Title: 2008 swing and trend from previous elections
Post by: nclib on December 09, 2008, 11:31:24 PM
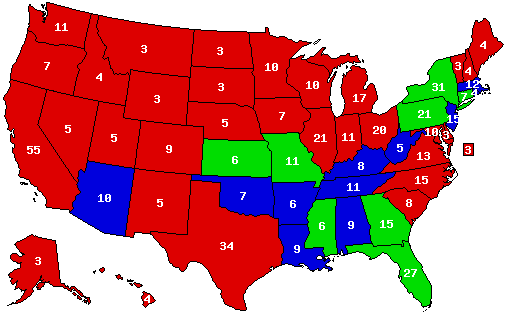
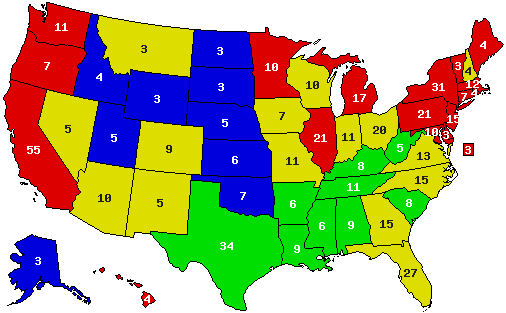
From 2000 to 2008
Red = swung above the national swing
Green = swung Dem., but below the national swing
Blue = swung Rep.
( )
)
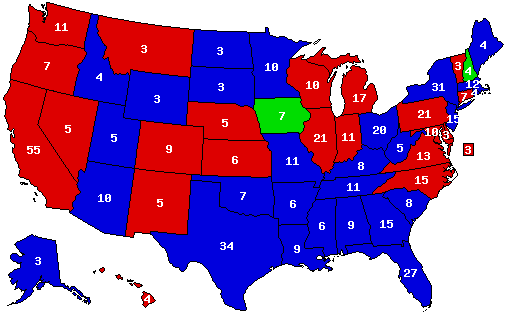
1996 to 2008
( )
)
Red = swung Dem
Green = swung Rep., but below the national swing
Blue = swung Rep. above the national swing
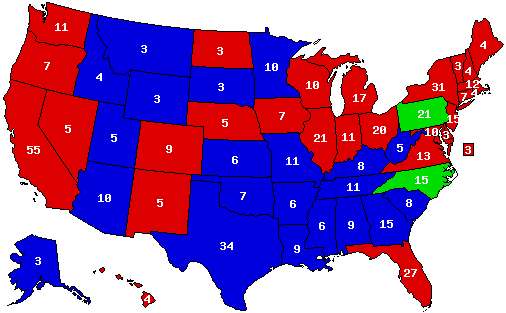
1992 to 2008
Red = swung above the national swing
Green = swung Dem., but below the national swing
Blue = swung Rep.
( )
)
1988 to 2008
Red = swung above the national swing
Green = swung Dem., but below the national swing
Blue = swung Rep.
( )
)
Red = swung above the national swing
Green = swung Dem., but below the national swing
Blue = swung Rep.
(
1996 to 2008
(
Red = swung Dem
Green = swung Rep., but below the national swing
Blue = swung Rep. above the national swing
1992 to 2008
Red = swung above the national swing
Green = swung Dem., but below the national swing
Blue = swung Rep.
(
1988 to 2008
Red = swung above the national swing
Green = swung Dem., but below the national swing
Blue = swung Rep.
(
Title: Re: 2008 swing and trend from previous elections
Post by: nclib on March 15, 2009, 10:27:33 AM
It is interesting how in the first map (2000-2008), Republican swing/trend was concentrated in only 19 states. Also note the urban northeast was the only area outside the South and Arizona to trend Republican, esp. given that Kerry and 9/11 are controlled for, and Nader 2000 did quite well in some of this region.
Title: Re: 2008 swing and trend from previous elections
Post by: Nym90 on March 18, 2009, 09:03:29 PM
Yeah, Gore did quite well in the Northeast in 2000.
Also interesting that the entire Atlantic Coast from Maine to Florida has trended Dem since 1988.
Also interesting that the entire Atlantic Coast from Maine to Florida has trended Dem since 1988.
Title: Re: 2008 swing and trend from previous elections
Post by: bgwah on March 22, 2009, 05:15:08 AM
Very cool. More elections, please. :)
Title: Re: 2008 swing and trend from previous elections
Post by: Antonio the Sixth on March 22, 2009, 05:55:38 AM
Very good maps, nclib ! ;)
The 1992-2008 and 1996-2008 maps are a bit falsed by the Perot candidacy.
Anyways, the two others are very interesting : we can see how much the democratic trend is generalized countrywide, whereas republican tred is concentrated in the South. That's a formidable advantage for democrats : the dramatic 2000 situation ( structural enormous disadvantage ) is now reversed.
Title: Re: 2008 swing and trend from previous elections
Post by: pbrower2a on March 22, 2009, 01:35:07 PM
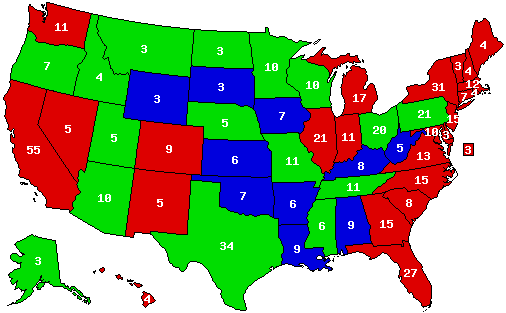
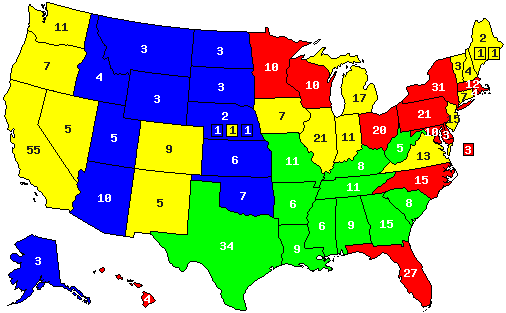
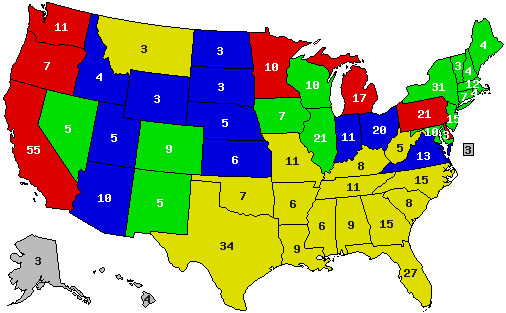
One way of looking at the map is to split states according to what sorts of candidates they can vote for, at least since 1988. Who runs matters greatly:
( )
)
Red -- Vote indiscriminately for Democrats, at least since 1992. Only a very strong conservative Republican, one with a nationwide appeal, has a chance to win any of these states. This is a very strict standard; I exclude Wisconsin because it nearly went to Dubya in 2004.
Could it be that conservative Republicans can no longer win these states in statewide elections?
Green -- These states can vote for a southern, moderate, rural Democratic populist like LBJ, Carter (1976), or Clinton, but probably not for a northern or western liberal. Does the southern moderate rural Democratic politician really exist? None will be available until at least 2016. Obama and Kerry got clobbered in these states. Obama wins any of these states only in an electoral blowout
Yellow -- Genuine swing states that have vulnerabilities for Democrats or Republicans who miss something. They have all voted at least once for a Democratic candidate for President since 1988 (which may include Obama); even if they didn't vote for Obama they were reasonably close. I include Arizona, which Obama would probably have won except that the Republican nominee was from there. This now includes Indiana and North Carolina, both of which voted -- barely -- for Obama and for the first time for any Democratic nominee for President since 1964 or 1976. Except in an electoral blowout, no candidate can ever win all of these states.
Blue -- These states seem to indiscriminately vote Republican. The most likely ones among these to flip to Obama are the Dakotas.
(
Red -- Vote indiscriminately for Democrats, at least since 1992. Only a very strong conservative Republican, one with a nationwide appeal, has a chance to win any of these states. This is a very strict standard; I exclude Wisconsin because it nearly went to Dubya in 2004.
Could it be that conservative Republicans can no longer win these states in statewide elections?
Green -- These states can vote for a southern, moderate, rural Democratic populist like LBJ, Carter (1976), or Clinton, but probably not for a northern or western liberal. Does the southern moderate rural Democratic politician really exist? None will be available until at least 2016. Obama and Kerry got clobbered in these states. Obama wins any of these states only in an electoral blowout
Yellow -- Genuine swing states that have vulnerabilities for Democrats or Republicans who miss something. They have all voted at least once for a Democratic candidate for President since 1988 (which may include Obama); even if they didn't vote for Obama they were reasonably close. I include Arizona, which Obama would probably have won except that the Republican nominee was from there. This now includes Indiana and North Carolina, both of which voted -- barely -- for Obama and for the first time for any Democratic nominee for President since 1964 or 1976. Except in an electoral blowout, no candidate can ever win all of these states.
Blue -- These states seem to indiscriminately vote Republican. The most likely ones among these to flip to Obama are the Dakotas.
Title: Re: 2008 swing and trend from previous elections
Post by: Antonio the Sixth on March 22, 2009, 02:07:27 PM
One way of looking at the map is to split states according to what sorts of candidates they can vote for, at least since 1988:
()
Red -- Vote indiscriminately for Democrats, at least since 1992. Only a very strong conservative Republican, one with a nationwide appeal, has a chance to win any of these states. This is a very strict standard; I exclude Wisconsin because it nearly went to Dubya in 2004.
Could it be that conservative Republicans can no longer win these states in statewide elections?
Green -- These states can vote for a southern, moderate, rural Democratic populist like LBJ, Carter (1976), or Clinton, but probably not for a northern or western liberal. Does the southern moderate rural Democratic politician really exist? None will be available until at least 2016. Obama and Kerry got clobbered in these states. Obama wins any of these states only in an electoral blowout
Yellow -- Genuine swing states that have vulnerabilities for Democrats or Republicans who miss something. They have all voted at least once for a Democratic candidate for President since 1988 (which may include Obama); even if they didn't vote for Obama they were reasonably close. I include Arizona, which Obama would probably have won except that the Republican nominee was from there. This now includes Indiana and North Carolina, both of which voted -- barely -- for Obama and for the first time for any Democratic nominee for President since 1964 or 1976. Except in an electoral blowout, no candidate can ever win all of these states. None of these states are in the South.
Blue -- These states seem to indiscriminately vote Republican. The most likely ones among these to flip to Obama are the Dakotas.
(
Red -- Vote indiscriminately for Democrats, at least since 1992. Only a very strong conservative Republican, one with a nationwide appeal, has a chance to win any of these states. This is a very strict standard; I exclude Wisconsin because it nearly went to Dubya in 2004.
Could it be that conservative Republicans can no longer win these states in statewide elections?
Green -- These states can vote for a southern, moderate, rural Democratic populist like LBJ, Carter (1976), or Clinton, but probably not for a northern or western liberal. Does the southern moderate rural Democratic politician really exist? None will be available until at least 2016. Obama and Kerry got clobbered in these states. Obama wins any of these states only in an electoral blowout
Yellow -- Genuine swing states that have vulnerabilities for Democrats or Republicans who miss something. They have all voted at least once for a Democratic candidate for President since 1988 (which may include Obama); even if they didn't vote for Obama they were reasonably close. I include Arizona, which Obama would probably have won except that the Republican nominee was from there. This now includes Indiana and North Carolina, both of which voted -- barely -- for Obama and for the first time for any Democratic nominee for President since 1964 or 1976. Except in an electoral blowout, no candidate can ever win all of these states. None of these states are in the South.
Blue -- These states seem to indiscriminately vote Republican. The most likely ones among these to flip to Obama are the Dakotas.
Ah, you really love this sort of maps ! :D
Anyways, good analysis.
Title: Re: 2008 swing and trend from previous elections
Post by: pbrower2a on March 22, 2009, 08:39:53 PM
Here's another one: 1976-2008:
( )
)
Red -- voted for Carter and Obama (180)
Blue -- voted for Ford and McCain (51)
Green -- voted for Carter and McCain (122)
Yellow -- voted for Ford and Obama (165)
Talk about a flip of voting! Carter's 1976 showed how heavily the Democratic Party depended upon the South.
Talk about a flip!
(
Red -- voted for Carter and Obama (180)
Blue -- voted for Ford and McCain (51)
Green -- voted for Carter and McCain (122)
Yellow -- voted for Ford and Obama (165)
Talk about a flip of voting! Carter's 1976 showed how heavily the Democratic Party depended upon the South.
Talk about a flip!
Title: Re: 2008 swing and trend from previous elections
Post by: Antonio the Sixth on March 23, 2009, 02:44:57 AM
Here's another one: 1976-2008:
()
Red -- voted for Carter and Obama (180)
Blue -- voted for Ford and McCain (51)
Green -- voted for Carter and McCain (122)
Yellow -- voted for Ford and Obama (165)
Talk about a flip of voting! Carter's 1976 showed how heavily the Democratic Party depended upon the South.
Talk about a flip!
(
Red -- voted for Carter and Obama (180)
Blue -- voted for Ford and McCain (51)
Green -- voted for Carter and McCain (122)
Yellow -- voted for Ford and Obama (165)
Talk about a flip of voting! Carter's 1976 showed how heavily the Democratic Party depended upon the South.
Talk about a flip!
Title: Re: 2008 swing and trend from previous elections
Post by: Filuwaúrdjan on March 23, 2009, 06:10:54 PM
I'm not quite sure how dear old LBJ can be considered a "moderate" in relation to later Democratic candidates...
Title: Re: 2008 swing and trend from previous elections
Post by: Antonio the Sixth on March 24, 2009, 01:46:54 AM
I'm not quite sure how dear old LBJ can be considered a "moderate" in relation to later Democratic candidates...
Title: Re: 2008 swing and trend from previous elections
Post by: Associate Justice PiT on March 24, 2009, 03:28:27 PM
The movement towards the GOP in Iowa between 1988 & 2008 is interesting given that McCain lost pretty badly while Bush won decisively.
Title: Re: 2008 swing and trend from previous elections
Post by: Antonio the Sixth on March 25, 2009, 09:13:56 AM
The movement towards the GOP in Iowa between 1988 & 2008 is interesting given that McCain lost pretty badly while Bush won decisively.
Title: Re: 2008 swing and trend from previous elections
Post by: pbrower2a on March 25, 2009, 07:38:55 PM
Here's another one: 1976-1992:
(
Red -- voted for Carter and Clinton
Blue -- voted for Ford and GHWB
Green -- voted for Carter and GHWB
Yellow -- voted for Ford and Clinton
(Note: 2004/2008 EV allocation)
Talk about a flip of voting! Carter's 1976 showed how heavily the Democratic Party depended upon the South.
Title: Re: 2008 swing and trend from previous elections
Post by: Kaine for Senate '18 on March 25, 2009, 10:21:51 PM
One way of looking at the map is to split states according to what sorts of candidates they can vote for, at least since 1988. Who runs matters greatly:
()
Red -- Vote indiscriminately for Democrats, at least since 1992. Only a very strong conservative Republican, one with a nationwide appeal, has a chance to win any of these states. This is a very strict standard; I exclude Wisconsin because it nearly went to Dubya in 2004.
Could it be that conservative Republicans can no longer win these states in statewide elections?
Green -- These states can vote for a southern, moderate, rural Democratic populist like LBJ, Carter (1976), or Clinton, but probably not for a northern or western liberal. Does the southern moderate rural Democratic politician really exist? None will be available until at least 2016. Obama and Kerry got clobbered in these states. Obama wins any of these states only in an electoral blowout
Yellow -- Genuine swing states that have vulnerabilities for Democrats or Republicans who miss something. They have all voted at least once for a Democratic candidate for President since 1988 (which may include Obama); even if they didn't vote for Obama they were reasonably close. I include Arizona, which Obama would probably have won except that the Republican nominee was from there. This now includes Indiana and North Carolina, both of which voted -- barely -- for Obama and for the first time for any Democratic nominee for President since 1964 or 1976. Except in an electoral blowout, no candidate can ever win all of these states.
Blue -- These states seem to indiscriminately vote Republican. The most likely ones among these to flip to Obama are the Dakotas.
(
Red -- Vote indiscriminately for Democrats, at least since 1992. Only a very strong conservative Republican, one with a nationwide appeal, has a chance to win any of these states. This is a very strict standard; I exclude Wisconsin because it nearly went to Dubya in 2004.
Could it be that conservative Republicans can no longer win these states in statewide elections?
Green -- These states can vote for a southern, moderate, rural Democratic populist like LBJ, Carter (1976), or Clinton, but probably not for a northern or western liberal. Does the southern moderate rural Democratic politician really exist? None will be available until at least 2016. Obama and Kerry got clobbered in these states. Obama wins any of these states only in an electoral blowout
Yellow -- Genuine swing states that have vulnerabilities for Democrats or Republicans who miss something. They have all voted at least once for a Democratic candidate for President since 1988 (which may include Obama); even if they didn't vote for Obama they were reasonably close. I include Arizona, which Obama would probably have won except that the Republican nominee was from there. This now includes Indiana and North Carolina, both of which voted -- barely -- for Obama and for the first time for any Democratic nominee for President since 1964 or 1976. Except in an electoral blowout, no candidate can ever win all of these states.
Blue -- These states seem to indiscriminately vote Republican. The most likely ones among these to flip to Obama are the Dakotas.
I wouldn't put Georgia into the same category as a state like Missouri; likewise with Indiana. Indiana, especially, is a fluke more than anything else. It won't go Democratic at a 50/50 election, which should be the standard for judging swing states.
Title: Re: 2008 swing and trend from previous elections
Post by: Antonio the Sixth on August 18, 2010, 11:30:51 AM
I'm gonna bump this too, those maps were really great.
Title: Re: 2008 swing and trend from previous elections
Post by: pbrower2a on August 19, 2010, 01:21:31 PM
Now for a real long-term trend: Eisenhower/Obama.
( )
)
Eisenhower twice, McCain
Eisenhower once, McCain
Eisenhower twice, Obama
did not vote 1952 or 1956, McCain
did not vote 1952 or 1956, Obama
Stevenson twice, Obama
Stevenson twice, McCain
Alaska and Hawaii would have likely voted for Ike; I wouldn't hazard a guess on DC.
(
Eisenhower twice, McCain
Eisenhower once, McCain
Eisenhower twice, Obama
did not vote 1952 or 1956, McCain
did not vote 1952 or 1956, Obama
Stevenson twice, Obama
Stevenson twice, McCain
Alaska and Hawaii would have likely voted for Ike; I wouldn't hazard a guess on DC.
Title: Re: 2008 swing and trend from previous elections
Post by: Antonio the Sixth on August 19, 2010, 01:29:03 PM
1952 was a rep+11 election, 1956 was rep+15, whereas 2008 was dem+7, so this comparison isn't very meaningful.
Title: Re: 2008 swing and trend from previous elections
Post by: pbrower2a on August 19, 2010, 03:17:26 PM
1952 was a rep+11 election, 1956 was rep+15, whereas 2008 was dem+7, so this comparison isn't very meaningful.
It is hugely meaningful -- if one figures that many states that used to be reliably Republican are now reliably Democratic, and vice-versa. Isn't it remarkable that Obama won only one state that the Democrat won in either 1952 or 1956 (North Carolina), and that one barely!
Title: Re: 2008 swing and trend from previous elections
Post by: #CriminalizeSobriety on August 19, 2010, 05:00:04 PM
Now for a real long-term trend: Eisenhower/Obama.
()
Eisenhower twice, McCain
Eisenhower once, McCain
Eisenhower twice, Obama
did not vote 1952 or 1956, McCain
did not vote 1952 or 1956, Obama
Stevenson twice, Obama
Stevenson twice, McCain
Alaska and Hawaii would have likely voted for Ike; I wouldn't hazard a guess on DC.
(
Eisenhower twice, McCain
Eisenhower once, McCain
Eisenhower twice, Obama
did not vote 1952 or 1956, McCain
did not vote 1952 or 1956, Obama
Stevenson twice, Obama
Stevenson twice, McCain
Alaska and Hawaii would have likely voted for Ike; I wouldn't hazard a guess on DC.
I think Stevenson would've stood a chance in Alaska.
Title: Re: 2008 swing and trend from previous elections
Post by: Antonio the Sixth on August 20, 2010, 05:39:10 AM
1952 was a rep+11 election, 1956 was rep+15, whereas 2008 was dem+7, so this comparison isn't very meaningful.
It is hugely meaningful -- if one figures that many states that used to be reliably Republican are now reliably Democratic, and vice-versa. Isn't it remarkable that Obama won only one state that the Democrat won in either 1952 or 1956 (North Carolina), and that one barely!
You don't understand. The fact democrats won North Carolina in 2008 doesn't mean North Carolina was a democratic state in 2008. And the fact Republicans won RI in 1952 doesn't mean it was a republican State.
If you are looking for a 1952-2008 comparison that makes sense, you should look at elections as if they were ties. That means every State won by Eisenhower below the national margin should be seen as a Stevenson state, and everyone won by Obama below a national margin as McCain States. In this case, your map becomes :
(
Stevenson/Obama (72)
Eisenhower/Obama (199)
Stevenson/McCain (171)
Eisenhower/McCain (86)
Title: Re: 2008 swing and trend from previous elections
Post by: Antonio the Sixth on August 20, 2010, 05:56:21 AM
And the same for 1956 :
( )
)
Stevenson/Obama (124)
Eisenhower/Obama (147)
Stevenson/McCain (174)
Eisenhower/McCain (83)
(
Stevenson/Obama (124)
Eisenhower/Obama (147)
Stevenson/McCain (174)
Eisenhower/McCain (83)