Title: 1988-2016 Trends: A map/comparison/analysis
Post by: MT Treasurer on February 12, 2017, 11:13:50 AM
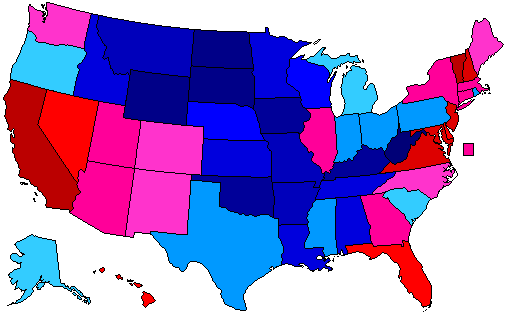
1988-2016 Trend map
( )
)
States with the strongest Democratic trends
1. California (Trend: 23.8% D)
2. Vermont (Trend: 20.1% D)
3. Maryland (Trend: 19.5% D)
4. New Jersey (Trend: 17.8% D)
5. New Hampshire (Trend: 16.8% D)
6. Virginia (Trend: 16.0% D)
7. Delaware (Trend: 14.0% D)
8. Nevada (Trend: 13.5% D)
9. Hawaii (Trend: 12.9% D)
10. Florida (Trend: 11.4% D)
States with the strongest Republican trends
1. West Virginia (Trend: 56.2% R)
2. Wyoming (Trend: 33.6% R)
3. South Dakota (Trend: 33.3% R)
4. North Dakota (Trend: 32.4% R)
5. Iowa (Trend: 29.4% R)
6. Kentucky (Trend: 28.0% R)
7. Missouri (Trend: 24.3% R)
8. Montana (Trend: 24.1% R)
9. Arkansas (Trend: 22.5% R)
10. Tennessee (Trend: 19.5% R)
11. Alabama (Trend: 18.2% R)
States with the smallest trends
1. South Carolina (Trend: 0.2% R)
2. Alaska (Trend: 1.3% R)
3. Michigan (Trend: 2.1% R)
4. North Carolina (Trend: 2.8% D)
5. Oregon (Trend: 3.5% R)
6. Maine (Trend 4.7% D)
7. Rhode Island (Trend: 6.0% R)
8. Texas (Trend: 6.2% R)
9. Utah (Trend: 6.5% D)
10. Mississippi (Trend: 6.8% R)
National: 1988 → 2016: D +9.82
Alaska: R+23.3 → R+14.8 → Trend: 1.3% R
Alabama: R+19.3→ R+27.7 → Trend: 18.2% R
Arizona: R+21.2→ R+3.5 → Trend: 7.9% D
Arkansas: R+14.2 → R+26.9 → Trend: 22.5% R
California: R+3.6 → D+30.0 → Trend: 23.8% D
Colorado: R+7.8→ D+4.9 → Trend: 2.9% D
Connecticut: R+5.1→ D+13.6 → Trend: 8.9% D
Delaware: R+12.4 → D+11.4 → Trend: 14.0% D
DC: D+68.4→ D+86.8 → Trend: 8.6% D
Florida: R+22.4 → R+1.2 → Trend: 11.4% D
Georgia: R+20.3→ R+5.1 → Trend: 5.4% D
Hawaii: D+9.5 → D+32.2 → Trend: 12.9% D
Idaho: R+26.1→ R+31.8 → Trend: 15.5% R
Illinois: R+2.1→ D+17.1 → Trend: 9.4% D
Indiana: R+20.2→ R+18.9 → Trend: 8.5% R
Iowa: D+10.2 → R+9.4 → Trend: 29.4% R
Kentucky: R+11.6 → R+29.8 → Trend: 28.0% R
Kansas: R+13.2 → R+20.5 → Trend: 17.1% R
Louisiana: R+10.2 → R+19.6 → Trend: 19.2% R
Maine: R+11.5 → D+3.0 → Trend: 4.7% D
Maryland: R+2.9→ D+26.4 → Trend: 19.5% D
Massachusetts: D+7.9→ D+27.2 → Trend: 9.5% D
Michigan: R+7.9 → R+0.2 → Trend: 2.1% R
Minnesota: D+7.0 → D+1.5 → Trend: 15.3% R
Mississippi: R+20.8→ R+17.8 → Trend: 6.8% R
Missouri: R+4.0→ R+18.5 → Trend: 24.3% R
Montana: R+5.9→ R+20.2 → Trend: 24.1% R
Nebraska: R+21.0→ R+25.0 → Trend: 13.8% R
Nevada: R+20.9→ D+2.4 → Trend: 13.5% D
New Hampshire: R+26.2→ D+0.4 → Trend: 16.8% D
New Jersey: R+13.6→ D+14.0 → Trend: 17.8% D
New Mexico: R+5.0→ D+8.2 → Trend: 3.4% D
New York: D+4.1 → D+22.5 → Trend: 8.6% D
North Carolina: R+16.3 → R+3.7 → Trend: 2.8% D
North Dakota: R+13.1→ R+35.7 → Trend: 32.4% R
Ohio: R+10.9→ R+8.1 → Trend: 7.0% R
Oklahoma: R+16.7→ R+36.4 → Trend: 29.5% R
Oregon: D+4.7→ D+11.0 → Trend: 3.5% R
Pennsylvania: R+2.3→ R+0.7 → Trend: 8.2% R
Rhode Island: D+11.7→ D+15.5 → Trend: 6.0% R
South Carolina: R+23.9→ R+14.3 → Trend: 0.2% R
South Dakota: R+6.3→ R+29.8 → Trend: 33.3% R
Tennessee: R+16.3→ R+26.0 → Trend: 19.5% R
Texas: R+12.6→ R+9.0 → Trend: 6.2% R
Utah: R+34.2→ R+17.9 → Trend: 6.5% D
Vermont: R+3.5→ D+26.4 → Trend: 20.1% D
Virginia: R+20.5 → D+5.3 → Trend: 16.0% D
Washington: D+1.6→ D+15.7 → Trend: 4.3% D
West Virginia: D+4.7 → R+41.7 → Trend: 56.2% R
Wyoming: R+22.5→ R+46.3 → Trend: 33.6% R
Wisconsin: D+3.6 → R+0.8 → Trend: 14.2% R
(
States with the strongest Democratic trends
1. California (Trend: 23.8% D)
2. Vermont (Trend: 20.1% D)
3. Maryland (Trend: 19.5% D)
4. New Jersey (Trend: 17.8% D)
5. New Hampshire (Trend: 16.8% D)
6. Virginia (Trend: 16.0% D)
7. Delaware (Trend: 14.0% D)
8. Nevada (Trend: 13.5% D)
9. Hawaii (Trend: 12.9% D)
10. Florida (Trend: 11.4% D)
States with the strongest Republican trends
1. West Virginia (Trend: 56.2% R)
2. Wyoming (Trend: 33.6% R)
3. South Dakota (Trend: 33.3% R)
4. North Dakota (Trend: 32.4% R)
5. Iowa (Trend: 29.4% R)
6. Kentucky (Trend: 28.0% R)
7. Missouri (Trend: 24.3% R)
8. Montana (Trend: 24.1% R)
9. Arkansas (Trend: 22.5% R)
10. Tennessee (Trend: 19.5% R)
11. Alabama (Trend: 18.2% R)
States with the smallest trends
1. South Carolina (Trend: 0.2% R)
2. Alaska (Trend: 1.3% R)
3. Michigan (Trend: 2.1% R)
4. North Carolina (Trend: 2.8% D)
5. Oregon (Trend: 3.5% R)
6. Maine (Trend 4.7% D)
7. Rhode Island (Trend: 6.0% R)
8. Texas (Trend: 6.2% R)
9. Utah (Trend: 6.5% D)
10. Mississippi (Trend: 6.8% R)
National: 1988 → 2016: D +9.82
Alaska: R+23.3 → R+14.8 → Trend: 1.3% R
Alabama: R+19.3→ R+27.7 → Trend: 18.2% R
Arizona: R+21.2→ R+3.5 → Trend: 7.9% D
Arkansas: R+14.2 → R+26.9 → Trend: 22.5% R
California: R+3.6 → D+30.0 → Trend: 23.8% D
Colorado: R+7.8→ D+4.9 → Trend: 2.9% D
Connecticut: R+5.1→ D+13.6 → Trend: 8.9% D
Delaware: R+12.4 → D+11.4 → Trend: 14.0% D
DC: D+68.4→ D+86.8 → Trend: 8.6% D
Florida: R+22.4 → R+1.2 → Trend: 11.4% D
Georgia: R+20.3→ R+5.1 → Trend: 5.4% D
Hawaii: D+9.5 → D+32.2 → Trend: 12.9% D
Idaho: R+26.1→ R+31.8 → Trend: 15.5% R
Illinois: R+2.1→ D+17.1 → Trend: 9.4% D
Indiana: R+20.2→ R+18.9 → Trend: 8.5% R
Iowa: D+10.2 → R+9.4 → Trend: 29.4% R
Kentucky: R+11.6 → R+29.8 → Trend: 28.0% R
Kansas: R+13.2 → R+20.5 → Trend: 17.1% R
Louisiana: R+10.2 → R+19.6 → Trend: 19.2% R
Maine: R+11.5 → D+3.0 → Trend: 4.7% D
Maryland: R+2.9→ D+26.4 → Trend: 19.5% D
Massachusetts: D+7.9→ D+27.2 → Trend: 9.5% D
Michigan: R+7.9 → R+0.2 → Trend: 2.1% R
Minnesota: D+7.0 → D+1.5 → Trend: 15.3% R
Mississippi: R+20.8→ R+17.8 → Trend: 6.8% R
Missouri: R+4.0→ R+18.5 → Trend: 24.3% R
Montana: R+5.9→ R+20.2 → Trend: 24.1% R
Nebraska: R+21.0→ R+25.0 → Trend: 13.8% R
Nevada: R+20.9→ D+2.4 → Trend: 13.5% D
New Hampshire: R+26.2→ D+0.4 → Trend: 16.8% D
New Jersey: R+13.6→ D+14.0 → Trend: 17.8% D
New Mexico: R+5.0→ D+8.2 → Trend: 3.4% D
New York: D+4.1 → D+22.5 → Trend: 8.6% D
North Carolina: R+16.3 → R+3.7 → Trend: 2.8% D
North Dakota: R+13.1→ R+35.7 → Trend: 32.4% R
Ohio: R+10.9→ R+8.1 → Trend: 7.0% R
Oklahoma: R+16.7→ R+36.4 → Trend: 29.5% R
Oregon: D+4.7→ D+11.0 → Trend: 3.5% R
Pennsylvania: R+2.3→ R+0.7 → Trend: 8.2% R
Rhode Island: D+11.7→ D+15.5 → Trend: 6.0% R
South Carolina: R+23.9→ R+14.3 → Trend: 0.2% R
South Dakota: R+6.3→ R+29.8 → Trend: 33.3% R
Tennessee: R+16.3→ R+26.0 → Trend: 19.5% R
Texas: R+12.6→ R+9.0 → Trend: 6.2% R
Utah: R+34.2→ R+17.9 → Trend: 6.5% D
Vermont: R+3.5→ D+26.4 → Trend: 20.1% D
Virginia: R+20.5 → D+5.3 → Trend: 16.0% D
Washington: D+1.6→ D+15.7 → Trend: 4.3% D
West Virginia: D+4.7 → R+41.7 → Trend: 56.2% R
Wyoming: R+22.5→ R+46.3 → Trend: 33.6% R
Wisconsin: D+3.6 → R+0.8 → Trend: 14.2% R
Title: Re: 1988-2016 Trends: A map/comparison/analysis
Post by: MT Treasurer on February 12, 2017, 11:15:20 AM
Will post some #analysis later.
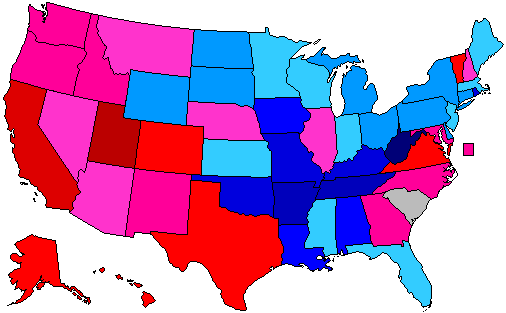
For the time being, here are 2000-2016 and 2008-2016 for comparison:
For the time being, here are 2000-2016 and 2008-2016 for comparison:
2000-2016 Trend map
( )
)
States with the strongest Democratic trends
1. Utah (Trend: 21.0% D)
2. California (Trend: 16.8% D)
3. Vermont (Trend: 14.9% D)
4. Alaska (Trend: 14.5% D)
5. Hawaii (Trend: 12.3% D)
6./7. Virginia (Trend: 11.7% D) and Colorado (Trend: 11.7% D)
8. Texas (Trend: 10.7% D)
9. DC (Trend: 9.0% D)
10. Oregon (Trend: 8.8% D)
11. Washington (Trend: 8.6% D)
States with the strongest Republican trends
1. West Virginia (Trend: 37.5% R)
2. Tennessee (Trend: 23.9% R)
3. Arkansas (Trend: 23.1% R)
4. Missouri (Trend: 16.9% R)
5. Kentucky (Trend: 16.3% R)
6. Oklahoma (Trend: 16.1% R)
7. Rhode Island (Trend: 15.2% R)
8. Alabama (Trend: 14.4% R)
9. Louisiana (Trend: 13.8% R)
10. Iowa (Trend: 11.3% R)
States with the smallest trends
1. South Carolina (Trend: 0.0% D/R)
2. New Hampshire (Trend: 0.1% D)
3./4. Arizona (Trend: 1.2% D)/Kansas (Trend: 1.4% R)
5. Massachusetts (Trend: 1.7% R)
6. Nebraska (Trend: 1.8% D)
7./8. Wisconsin (Trend: 2.5% R)/Minnesota (Trend: 2.5% R)
9./10. Florida (Trend: 2.8% R)/Mississippi (Trend: 2.8% R)
11. Montana (Trend: 2.9% D)
(
States with the strongest Democratic trends
1. Utah (Trend: 21.0% D)
2. California (Trend: 16.8% D)
3. Vermont (Trend: 14.9% D)
4. Alaska (Trend: 14.5% D)
5. Hawaii (Trend: 12.3% D)
6./7. Virginia (Trend: 11.7% D) and Colorado (Trend: 11.7% D)
8. Texas (Trend: 10.7% D)
9. DC (Trend: 9.0% D)
10. Oregon (Trend: 8.8% D)
11. Washington (Trend: 8.6% D)
States with the strongest Republican trends
1. West Virginia (Trend: 37.5% R)
2. Tennessee (Trend: 23.9% R)
3. Arkansas (Trend: 23.1% R)
4. Missouri (Trend: 16.9% R)
5. Kentucky (Trend: 16.3% R)
6. Oklahoma (Trend: 16.1% R)
7. Rhode Island (Trend: 15.2% R)
8. Alabama (Trend: 14.4% R)
9. Louisiana (Trend: 13.8% R)
10. Iowa (Trend: 11.3% R)
States with the smallest trends
1. South Carolina (Trend: 0.0% D/R)
2. New Hampshire (Trend: 0.1% D)
3./4. Arizona (Trend: 1.2% D)/Kansas (Trend: 1.4% R)
5. Massachusetts (Trend: 1.7% R)
6. Nebraska (Trend: 1.8% D)
7./8. Wisconsin (Trend: 2.5% R)/Minnesota (Trend: 2.5% R)
9./10. Florida (Trend: 2.8% R)/Mississippi (Trend: 2.8% R)
11. Montana (Trend: 2.9% D)
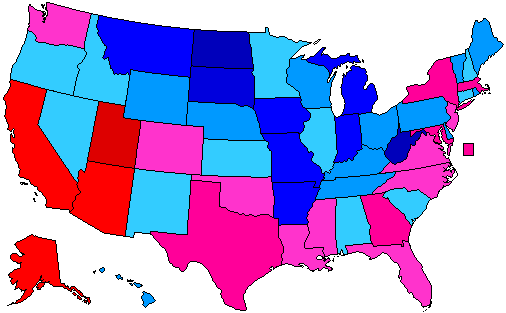
2008-2016 Trend map
( )
)
States with the strongest Democratic trends
1. Utah (Trend: 15.3% D)
2. Alaska (Trend: 11.9% D)
3. Arizona (Trend: 10.3% D)
4. California (Trend: 10.2% D)
5. Texas (Trend: 8.0% D)
6. Massachusetts (Trend: 6.6% D)
7. Maryland (Trend: 6.2% D)
8. DC (Trend: 6.1% D)
9. Georgia (Trend: 5.3% D)
10./11. Louisiana (Trend: 4.2% D)/Virginia (Trend: 4.2% D)
12. New Jersey (Trend: 3.7% D)
States with the strongest Republican trends
1. West Virginia (Trend: 23.4% R)
2. North Dakota (Trend: 21.9% R)
3. South Dakota (Trend: 16.2% R)
4. Indiana (Trend: 14.7% R)
5. Iowa (Trend: 13.7% R)
6. Missouri (Trend: 13.2% R)
7. Montana (Trend: 12.6% R)
8. Arkansas (Trend: 12.2% R)
9. Michigan (Trend: 11.4% R)
10. Wisconsin (Trend: 9.5% R)
11. Maine (Trend: 9.1% R)
States with the smallest trends
1./2./3. South Carolina (Trend: 0.1% R)/Oklahoma (Trend: 0.1% D)/Oregon (Trend: 0.1% R)
4. Kansas (Trend: 0.4% R)
5. Mississippi (Trend: 0.6% D)
6./7. Alabama (Trend: 0.9% R)/New York (Trend: 0.9% D)
8./9./10. Florida (Trend: 1.2% D)/North Carolina (Trend: 1.2% D)/Colorado (Trend: 1.2% D)
11. Idaho (Trend: 1.4% R)
National: 2008 → 2016: R +5.16
Alaska: R+21.5 → R+14.8 → Trend: 11.9% D
Alabama: R+21.6→ R+27.7 → Trend: 0.9% R
Arizona: R+8.5→ R+3.5 → Trend: 10.2% D
Arkansas: R+19.9 → R+26.9 → Trend: 12.2% R
California: D+24.0 → D+30.0 → Trend: 10.2% D
Colorado: D+8.9→ D+4.9 → Trend: 1.2% D
Connecticut: D+22.4→ D+13.6 → Trend: 3.6% R
Delaware: D+25.0 → D+11.4 → Trend: 8.4% R
DC: D+85.9→ D+86.8 → Trend: 6.1% D
Florida: D+2.8 → R+1.2 → Trend: 1.2% D
Georgia: R+5.2→ R+5.1 → Trend: 5.3% D
Hawaii: D+45.3 → D+32.2 → Trend: 7.9% R
Idaho: R+25.3→ R+31.8 → Trend: 1.4% R
Illinois: D+25.1→ D+17.1 → Trend: 2.8% R
Indiana: D+1.0→ R+18.9 → Trend: 14.7% R
Iowa: D+9.5 → R+9.4 → Trend: 13.7% R
Kentucky: R+16.2 → R+29.8 → Trend: 8.4% R
Kansas: R+14.9 → R+20.5 → Trend: 0.4% R
Louisiana: R+18.6 → R+19.6 → Trend: 4.2% D
Maine: D+17.3 → D+3.0 → Trend: 9.1% R
Maryland: D+25.4→ D+26.4 → Trend: 6.2% D
Massachusetts: D+25.8→ D+27.2 → Trend: 6.6% D
Michigan: D+16.4 → R+0.2 → Trend: 11.4% R
Minnesota: D+10.2 → D+1.5 → Trend: 3.5% R
Mississippi: R+13.2→ R+17.8 → Trend: 0.6% D
Missouri: R+0.1→ R+18.5 → Trend: 13.2% R
Montana: R+2.4→ R+20.2 → Trend: 12.6% R
Nebraska: R+14.9→ R+25.0 → Trend: 4.9% R
Nevada: D+12.5→ D+2.4 → Trend: 4.9% R
New Hampshire: D+9.6→ D+0.4 → Trend: 4.0% R
New Jersey: D+15.5→ D+14.0 → Trend: 3.7% D
New Mexico: D+15.1→ D+8.2 → Trend: 1.7% R
New York: D+26.8 → D+22.5 → Trend: 0.9% D
North Carolina: D+0.3 → R+3.7 → Trend: 1.2% D
North Dakota: R+8.6→ R+35.7 → Trend: 21.9% R
Ohio: D+4.6→ R+8.1 → Trend: 7.5% R
Oklahoma: R+31.3→ R+36.4 → Trend: 0.1% D
Oregon: D+16.3→ D+11.0 → Trend: 0.1% R
Pennsylvania: D+10.3→ R+0.7 → Trend: 5.8% R
Rhode Island: D+27.8→ D+15.5 → Trend: 7.1% R
South Carolina: R+9.0→ R+14.3 → Trend: 0.1% R
South Dakota: R+8.4→ R+29.8 → Trend: 16.2% R
Tennessee: R+15.1→ R+26.0 → Trend: 5.7% R
Texas: R+11.8→ R+9.0 → Trend: 8.0% D
Utah: R+28.0→ R+17.9 → Trend: 15.3% D
Vermont: D+37.0→ D+26.4 → Trend: 5.4% R
Virginia: D+6.3 → D+5.3 → Trend: 4.2% D
Washington: D+17.1→ D+15.7 → Trend: 3.8% D
West Virginia: R+13.1 → R+41.7 → Trend: 23.4% R
Wyoming: R+32.2→ R+46.3 → Trend: 8.9% R
Wisconsin: D+13.9 → R+0.8 → Trend: 9.5% R
(
States with the strongest Democratic trends
1. Utah (Trend: 15.3% D)
2. Alaska (Trend: 11.9% D)
3. Arizona (Trend: 10.3% D)
4. California (Trend: 10.2% D)
5. Texas (Trend: 8.0% D)
6. Massachusetts (Trend: 6.6% D)
7. Maryland (Trend: 6.2% D)
8. DC (Trend: 6.1% D)
9. Georgia (Trend: 5.3% D)
10./11. Louisiana (Trend: 4.2% D)/Virginia (Trend: 4.2% D)
12. New Jersey (Trend: 3.7% D)
States with the strongest Republican trends
1. West Virginia (Trend: 23.4% R)
2. North Dakota (Trend: 21.9% R)
3. South Dakota (Trend: 16.2% R)
4. Indiana (Trend: 14.7% R)
5. Iowa (Trend: 13.7% R)
6. Missouri (Trend: 13.2% R)
7. Montana (Trend: 12.6% R)
8. Arkansas (Trend: 12.2% R)
9. Michigan (Trend: 11.4% R)
10. Wisconsin (Trend: 9.5% R)
11. Maine (Trend: 9.1% R)
States with the smallest trends
1./2./3. South Carolina (Trend: 0.1% R)/Oklahoma (Trend: 0.1% D)/Oregon (Trend: 0.1% R)
4. Kansas (Trend: 0.4% R)
5. Mississippi (Trend: 0.6% D)
6./7. Alabama (Trend: 0.9% R)/New York (Trend: 0.9% D)
8./9./10. Florida (Trend: 1.2% D)/North Carolina (Trend: 1.2% D)/Colorado (Trend: 1.2% D)
11. Idaho (Trend: 1.4% R)
National: 2008 → 2016: R +5.16
Alaska: R+21.5 → R+14.8 → Trend: 11.9% D
Alabama: R+21.6→ R+27.7 → Trend: 0.9% R
Arizona: R+8.5→ R+3.5 → Trend: 10.2% D
Arkansas: R+19.9 → R+26.9 → Trend: 12.2% R
California: D+24.0 → D+30.0 → Trend: 10.2% D
Colorado: D+8.9→ D+4.9 → Trend: 1.2% D
Connecticut: D+22.4→ D+13.6 → Trend: 3.6% R
Delaware: D+25.0 → D+11.4 → Trend: 8.4% R
DC: D+85.9→ D+86.8 → Trend: 6.1% D
Florida: D+2.8 → R+1.2 → Trend: 1.2% D
Georgia: R+5.2→ R+5.1 → Trend: 5.3% D
Hawaii: D+45.3 → D+32.2 → Trend: 7.9% R
Idaho: R+25.3→ R+31.8 → Trend: 1.4% R
Illinois: D+25.1→ D+17.1 → Trend: 2.8% R
Indiana: D+1.0→ R+18.9 → Trend: 14.7% R
Iowa: D+9.5 → R+9.4 → Trend: 13.7% R
Kentucky: R+16.2 → R+29.8 → Trend: 8.4% R
Kansas: R+14.9 → R+20.5 → Trend: 0.4% R
Louisiana: R+18.6 → R+19.6 → Trend: 4.2% D
Maine: D+17.3 → D+3.0 → Trend: 9.1% R
Maryland: D+25.4→ D+26.4 → Trend: 6.2% D
Massachusetts: D+25.8→ D+27.2 → Trend: 6.6% D
Michigan: D+16.4 → R+0.2 → Trend: 11.4% R
Minnesota: D+10.2 → D+1.5 → Trend: 3.5% R
Mississippi: R+13.2→ R+17.8 → Trend: 0.6% D
Missouri: R+0.1→ R+18.5 → Trend: 13.2% R
Montana: R+2.4→ R+20.2 → Trend: 12.6% R
Nebraska: R+14.9→ R+25.0 → Trend: 4.9% R
Nevada: D+12.5→ D+2.4 → Trend: 4.9% R
New Hampshire: D+9.6→ D+0.4 → Trend: 4.0% R
New Jersey: D+15.5→ D+14.0 → Trend: 3.7% D
New Mexico: D+15.1→ D+8.2 → Trend: 1.7% R
New York: D+26.8 → D+22.5 → Trend: 0.9% D
North Carolina: D+0.3 → R+3.7 → Trend: 1.2% D
North Dakota: R+8.6→ R+35.7 → Trend: 21.9% R
Ohio: D+4.6→ R+8.1 → Trend: 7.5% R
Oklahoma: R+31.3→ R+36.4 → Trend: 0.1% D
Oregon: D+16.3→ D+11.0 → Trend: 0.1% R
Pennsylvania: D+10.3→ R+0.7 → Trend: 5.8% R
Rhode Island: D+27.8→ D+15.5 → Trend: 7.1% R
South Carolina: R+9.0→ R+14.3 → Trend: 0.1% R
South Dakota: R+8.4→ R+29.8 → Trend: 16.2% R
Tennessee: R+15.1→ R+26.0 → Trend: 5.7% R
Texas: R+11.8→ R+9.0 → Trend: 8.0% D
Utah: R+28.0→ R+17.9 → Trend: 15.3% D
Vermont: D+37.0→ D+26.4 → Trend: 5.4% R
Virginia: D+6.3 → D+5.3 → Trend: 4.2% D
Washington: D+17.1→ D+15.7 → Trend: 3.8% D
West Virginia: R+13.1 → R+41.7 → Trend: 23.4% R
Wyoming: R+32.2→ R+46.3 → Trend: 8.9% R
Wisconsin: D+13.9 → R+0.8 → Trend: 9.5% R
Title: Re: 1988-2016 Trends: A map/comparison/analysis
Post by: AGA on February 12, 2017, 11:17:57 AM
Looks kind of like the 1992-2016 trend map.
Title: Re: 1988-2016 Trends: A map/comparison/analysis
Post by: MT Treasurer on February 12, 2017, 01:01:21 PM
A few observations:
1.) In all three cases, West Virginia was the state with the strongest Republican trend. From 1988-2016, WV trended 56 points Republican!
2.) In all three cases, South Carolina was the state with the smallest trend in either direction. It is eerily accurate in terms of how it captures the natural trend.
3.) Here are all the states that have trended Democratic in all three cases: California, Washington, Utah, Arizona, Massachusetts, Virginia, North Carolina, Georgia. (8 states) No surprises here, except maybe Washington.
4.) All the states that have trended Republican in all three cases: Alabama, Tennessee, Kentucky, Arkansas, Missouri, Iowa, Minnesota, Wisconsin, Michigan, Ohio, Pennsylvania, Indiana, Kansas, North Dakota, South Dakota, Montana, Wyoming, Rhode Island (18 states) Rhode Island, Alabama and Kansas are probably the most surprising.
Title: Re: 1988-2016 Trends: A map/comparison/analysis
Post by: Antonio the Sixth on February 12, 2017, 09:15:54 PM
Horrifying.
Title: Re: 1988-2016 Trends: A map/comparison/analysis
Post by: thumb21 on February 13, 2017, 05:12:51 PM
Nice work. I'm surprised about Texas. There is a lot of talk about Texas slowly shifting towards the Democrats because of a high minority population, but I don't see it here. Is there something I'm missing?
Title: Re: 1988-2016 Trends: A map/comparison/analysis
Post by: Tartarus Sauce on February 13, 2017, 06:20:24 PM
Nice work. I'm surprised about Texas. There is a lot of talk about Texas slowly shifting towards the Democrats because of a high minority population, but I don't see it here. Is there something I'm missing?
Yeah, you only paid attention to the first map. :P
Texas has been Dem trend 2000 onwards.
Title: Re: 1988-2016 Trends: A map/comparison/analysis
Post by: (Still) muted by Kalwejt until March 31 on February 13, 2017, 09:08:36 PM
Texas has trended D three out of the past four elections (exception: 2012). Florida has trended R three out of the past four elections (exception: 2012).
Title: Re: 1988-2016 Trends: A map/comparison/analysis
Post by: Antonio the Sixth on February 14, 2017, 12:57:33 AM
Nice work. I'm surprised about Texas. There is a lot of talk about Texas slowly shifting towards the Democrats because of a high minority population, but I don't see it here. Is there something I'm missing?
Lloyd Bentsen was on the Democratic ticket in 1988.
Title: Re: 1988-2016 Trends: A map/comparison/analysis
Post by: thumb21 on February 14, 2017, 05:23:33 AM
Nice work. I'm surprised about Texas. There is a lot of talk about Texas slowly shifting towards the Democrats because of a high minority population, but I don't see it here. Is there something I'm missing?
Yeah, you only paid attention to the first map. :P
Texas has been Dem trend 2000 onwards.
But the growing minority population has been a constant thing from before the 2000s, no?
Title: Re: 1988-2016 Trends: A map/comparison/analysis
Post by: thumb21 on February 14, 2017, 05:24:00 AM
Nice work. I'm surprised about Texas. There is a lot of talk about Texas slowly shifting towards the Democrats because of a high minority population, but I don't see it here. Is there something I'm missing?
Lloyd Bentsen was on the Democratic ticket in 1988.
Ok, that makes sense.
Title: Re: 1988-2016 Trends: A map/comparison/analysis
Post by: AGA on February 20, 2017, 01:13:02 AM
Nice work. I'm surprised about Texas. There is a lot of talk about Texas slowly shifting towards the Democrats because of a high minority population, but I don't see it here. Is there something I'm missing?
Lloyd Bentsen was on the Democratic ticket in 1988.
But George Bush was also on the Republican ticket.
It seems that Texas trended Republican from Carter's win there in 1976 to 2000 due to Southerners leaving the Democrat party, but is now going in the Democratic direction since 2000 due to minority growth and urban growth.
Title: Re: 1988-2016 Trends: A map/comparison/analysis
Post by: jaichind on February 20, 2017, 12:43:30 PM
Looks a lot like the Mississippi-Missouri river basin minus Chicago.
()
()
Title: Re: 1988-2016 Trends: A map/comparison/analysis
Post by: jaichind on February 20, 2017, 12:56:46 PM
I love how New Hampshire is in the top 5 of states with the strongest D trend. And yet people here think it will trend Republican in the future for some strange reasons...
Reversion to the mean ?
Title: Re: 1988-2016 Trends: A map/comparison/analysis
Post by: (Still) muted by Kalwejt until March 31 on February 20, 2017, 01:28:15 PM
I love how New Hampshire is in the top 5 of states with the strongest D trend. And yet people here think it will trend Republican in the future for some strange reasons...
-Uh, Florida's in the top 10. Don't use spurious reasoning; NH has had a GOP trend in three out of the past three presidential elections, and four out of the past five. Most of its Dem trend since 1988 was due to the 1992 GOP bloodbath and WJC's 1996 consolidation of his 1992 gains in the Northeast.