Title: 2008-2016 Trends: A map/comparison/analysis
Post by: MT Treasurer on December 29, 2016, 10:57:06 PM
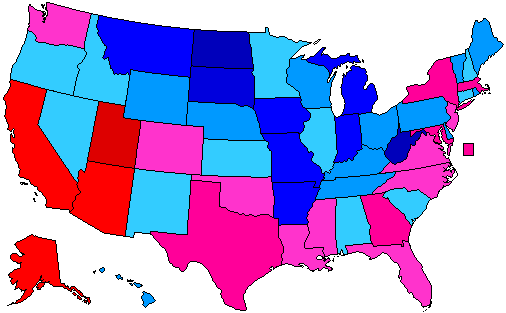
2008-2016 Trend map
( )
)
States with the strongest Democratic trends
1. Utah (Trend: 15.3% D)
2. Alaska (Trend: 11.9% D)
3. Arizona (Trend: 10.3% D)
4. California (Trend: 10.2% D)
5. Texas (Trend: 8.0% D)
6. Massachusetts (Trend: 6.6% D)
7. Maryland (Trend: 6.2% D)
8. DC (Trend: 6.1% D)
9. Georgia (Trend: 5.3% D)
10./11. Louisiana (Trend: 4.2% D)/Virginia (Trend: 4.2% D)
12. New Jersey (Trend: 3.7% D)
States with the strongest Republican trends
1. West Virginia (Trend: 23.4% R)
2. North Dakota (Trend: 21.9% R)
3. South Dakota (Trend: 16.2% R)
4. Indiana (Trend: 14.7% R)
5. Iowa (Trend: 13.7% R)
6. Missouri (Trend: 13.2% R)
7. Montana (Trend: 12.6% R)
8. Arkansas (Trend: 12.2% R)
9. Michigan (Trend: 11.4% R)
10. Wisconsin (Trend: 9.5% R)
11. Maine (Trend: 9.1% R)
States with the smallest trends
1./2./3. South Carolina (Trend: 0.1% R)/Oklahoma (Trend: 0.1% D)/Oregon (Trend: 0.1% R)
4. Kansas (Trend: 0.4% R)
5. Mississippi (Trend: 0.6% D)
6./7. Alabama (Trend: 0.9% R)/New York (Trend: 0.9% D)
8./9./10. Florida (Trend: 1.2% D)/North Carolina (Trend: 1.2% D)/Colorado (Trend: 1.2% D)
11. Idaho (Trend: 1.4% R)
National: 2008 → 2016: R +5.16
Alaska: R+21.5 → R+14.8 → Trend: 11.9% D
Alabama: R+21.6→ R+27.7 → Trend: 0.9% R
Arizona: R+8.5→ R+3.5 → Trend: 10.2% D
Arkansas: R+19.9 → R+26.9 → Trend: 12.2% R
California: D+24.0 → D+30.0 → Trend: 10.2% D
Colorado: D+8.9→ D+4.9 → Trend: 1.2% D
Connecticut: D+22.4→ D+13.6 → Trend: 3.6% R
Delaware: D+25.0 → D+11.4 → Trend: 8.4% R
DC: D+85.9→ D+86.8 → Trend: 6.1% D
Florida: D+2.8 → R+1.2 → Trend: 1.2% D
Georgia: R+5.2→ R+5.1 → Trend: 5.3% D
Hawaii: D+45.3 → D+32.2 → Trend: 7.9% R
Idaho: R+25.3→ R+31.8 → Trend: 1.4% R
Illinois: D+25.1→ D+17.1 → Trend: 2.8% R
Indiana: D+1.0→ R+18.9 → Trend: 14.7% R
Iowa: D+9.5 → R+9.4 → Trend: 13.7% R
Kentucky: R+16.2 → R+29.8 → Trend: 8.4% R
Kansas: R+14.9 → R+20.5 → Trend: 0.4% R
Louisiana: R+18.6 → R+19.6 → Trend: 4.2% D
Maine: D+17.3 → D+3.0 → Trend: 9.1% R
Maryland: D+25.4→ D+26.4 → Trend: 6.2% D
Massachusetts: D+25.8→ D+27.2 → Trend: 6.6% D
Michigan: D+16.4 → R+0.2 → Trend: 11.4% R
Minnesota: D+10.2 → D+1.5 → Trend: 3.5% R
Mississippi: R+13.2→ R+17.8 → Trend: 0.6% D
Missouri: R+0.1→ R+18.5 → Trend: 13.2% R
Montana: R+2.4→ R+20.2 → Trend: 12.6% R
Nebraska: R+14.9→ R+25.0 → Trend: 4.9% R
Nevada: D+12.5→ D+2.4 → Trend: 4.9% R
New Hampshire: D+9.6→ D+0.4 → Trend: 4.0% R
New Jersey: D+15.5→ D+14.0 → Trend: 3.7% D
New Mexico: D+15.1→ D+8.2 → Trend: 1.7% R
New York: D+26.8 → D+22.5 → Trend: 0.9% D
North Carolina: D+0.3 → R+3.7 → Trend: 1.2% D
North Dakota: R+8.6→ R+35.7 → Trend: 21.9% R
Ohio: D+4.6→ R+8.1 → Trend: 7.5% R
Oklahoma: R+31.3→ R+36.4 → Trend: 0.1% D
Oregon: D+16.3→ D+11.0 → Trend: 0.1% R
Pennsylvania: D+10.3→ R+0.7 → Trend: 5.8% R
Rhode Island: D+27.8→ D+15.5 → Trend: 7.1% R
South Carolina: R+9.0→ R+14.3 → Trend: 0.1% R
South Dakota: R+8.4→ R+29.8 → Trend: 16.2% R
Tennessee: R+15.1→ R+26.0 → Trend: 5.7% R
Texas: R+11.8→ R+9.0 → Trend: 8.0% D
Utah: R+28.0→ R+17.9 → Trend: 15.3% D
Vermont: D+37.0→ D+26.4 → Trend: 5.4% R
Virginia: D+6.3 → D+5.3 → Trend: 4.2% D
Washington: D+17.1→ D+15.7 → Trend: 3.8% D
West Virginia: R+13.1 → R+41.7 → Trend: 23.4% R
Wyoming: R+32.2→ R+46.3 → Trend: 8.9% R
Wisconsin: D+13.9 → R+0.8 → Trend: 9.5% R
(
States with the strongest Democratic trends
1. Utah (Trend: 15.3% D)
2. Alaska (Trend: 11.9% D)
3. Arizona (Trend: 10.3% D)
4. California (Trend: 10.2% D)
5. Texas (Trend: 8.0% D)
6. Massachusetts (Trend: 6.6% D)
7. Maryland (Trend: 6.2% D)
8. DC (Trend: 6.1% D)
9. Georgia (Trend: 5.3% D)
10./11. Louisiana (Trend: 4.2% D)/Virginia (Trend: 4.2% D)
12. New Jersey (Trend: 3.7% D)
States with the strongest Republican trends
1. West Virginia (Trend: 23.4% R)
2. North Dakota (Trend: 21.9% R)
3. South Dakota (Trend: 16.2% R)
4. Indiana (Trend: 14.7% R)
5. Iowa (Trend: 13.7% R)
6. Missouri (Trend: 13.2% R)
7. Montana (Trend: 12.6% R)
8. Arkansas (Trend: 12.2% R)
9. Michigan (Trend: 11.4% R)
10. Wisconsin (Trend: 9.5% R)
11. Maine (Trend: 9.1% R)
States with the smallest trends
1./2./3. South Carolina (Trend: 0.1% R)/Oklahoma (Trend: 0.1% D)/Oregon (Trend: 0.1% R)
4. Kansas (Trend: 0.4% R)
5. Mississippi (Trend: 0.6% D)
6./7. Alabama (Trend: 0.9% R)/New York (Trend: 0.9% D)
8./9./10. Florida (Trend: 1.2% D)/North Carolina (Trend: 1.2% D)/Colorado (Trend: 1.2% D)
11. Idaho (Trend: 1.4% R)
National: 2008 → 2016: R +5.16
Alaska: R+21.5 → R+14.8 → Trend: 11.9% D
Alabama: R+21.6→ R+27.7 → Trend: 0.9% R
Arizona: R+8.5→ R+3.5 → Trend: 10.2% D
Arkansas: R+19.9 → R+26.9 → Trend: 12.2% R
California: D+24.0 → D+30.0 → Trend: 10.2% D
Colorado: D+8.9→ D+4.9 → Trend: 1.2% D
Connecticut: D+22.4→ D+13.6 → Trend: 3.6% R
Delaware: D+25.0 → D+11.4 → Trend: 8.4% R
DC: D+85.9→ D+86.8 → Trend: 6.1% D
Florida: D+2.8 → R+1.2 → Trend: 1.2% D
Georgia: R+5.2→ R+5.1 → Trend: 5.3% D
Hawaii: D+45.3 → D+32.2 → Trend: 7.9% R
Idaho: R+25.3→ R+31.8 → Trend: 1.4% R
Illinois: D+25.1→ D+17.1 → Trend: 2.8% R
Indiana: D+1.0→ R+18.9 → Trend: 14.7% R
Iowa: D+9.5 → R+9.4 → Trend: 13.7% R
Kentucky: R+16.2 → R+29.8 → Trend: 8.4% R
Kansas: R+14.9 → R+20.5 → Trend: 0.4% R
Louisiana: R+18.6 → R+19.6 → Trend: 4.2% D
Maine: D+17.3 → D+3.0 → Trend: 9.1% R
Maryland: D+25.4→ D+26.4 → Trend: 6.2% D
Massachusetts: D+25.8→ D+27.2 → Trend: 6.6% D
Michigan: D+16.4 → R+0.2 → Trend: 11.4% R
Minnesota: D+10.2 → D+1.5 → Trend: 3.5% R
Mississippi: R+13.2→ R+17.8 → Trend: 0.6% D
Missouri: R+0.1→ R+18.5 → Trend: 13.2% R
Montana: R+2.4→ R+20.2 → Trend: 12.6% R
Nebraska: R+14.9→ R+25.0 → Trend: 4.9% R
Nevada: D+12.5→ D+2.4 → Trend: 4.9% R
New Hampshire: D+9.6→ D+0.4 → Trend: 4.0% R
New Jersey: D+15.5→ D+14.0 → Trend: 3.7% D
New Mexico: D+15.1→ D+8.2 → Trend: 1.7% R
New York: D+26.8 → D+22.5 → Trend: 0.9% D
North Carolina: D+0.3 → R+3.7 → Trend: 1.2% D
North Dakota: R+8.6→ R+35.7 → Trend: 21.9% R
Ohio: D+4.6→ R+8.1 → Trend: 7.5% R
Oklahoma: R+31.3→ R+36.4 → Trend: 0.1% D
Oregon: D+16.3→ D+11.0 → Trend: 0.1% R
Pennsylvania: D+10.3→ R+0.7 → Trend: 5.8% R
Rhode Island: D+27.8→ D+15.5 → Trend: 7.1% R
South Carolina: R+9.0→ R+14.3 → Trend: 0.1% R
South Dakota: R+8.4→ R+29.8 → Trend: 16.2% R
Tennessee: R+15.1→ R+26.0 → Trend: 5.7% R
Texas: R+11.8→ R+9.0 → Trend: 8.0% D
Utah: R+28.0→ R+17.9 → Trend: 15.3% D
Vermont: D+37.0→ D+26.4 → Trend: 5.4% R
Virginia: D+6.3 → D+5.3 → Trend: 4.2% D
Washington: D+17.1→ D+15.7 → Trend: 3.8% D
West Virginia: R+13.1 → R+41.7 → Trend: 23.4% R
Wyoming: R+32.2→ R+46.3 → Trend: 8.9% R
Wisconsin: D+13.9 → R+0.8 → Trend: 9.5% R
Title: Re: 2008-2016 Trends: A map/comparison/analysis
Post by: MT Treasurer on December 29, 2016, 11:00:34 PM
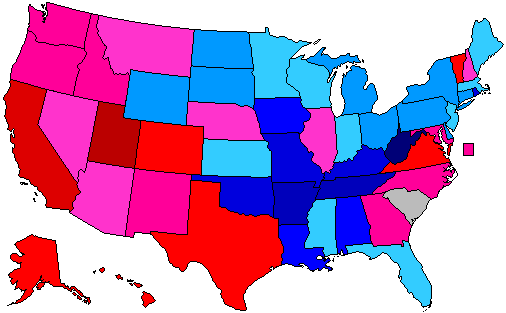
2000-2016 for comparison:
2000-2016 Trend map
( )
)
States with the strongest Democratic trends
1. Utah (Trend: 21.0% D)
2. California (Trend: 16.8% D)
3. Vermont (Trend: 14.9% D)
4. Alaska (Trend: 14.5% D)
5. Hawaii (Trend: 12.3% D)
6./7. Virginia (Trend: 11.7% D) and Colorado (Trend: 11.7% D)
8. Texas (Trend: 10.7% D)
9. DC (Trend: 9.0% D)
10. Oregon (Trend: 8.8% D)
11. Washington (Trend: 8.6% D)
States with the strongest Republican trends
1. West Virginia (Trend: 37.5% R)
2. Tennessee (Trend: 23.9% R)
3. Arkansas (Trend: 23.1% R)
4. Missouri (Trend: 16.9% R)
5. Kentucky (Trend: 16.3% R)
6. Oklahoma (Trend: 16.1% R)
7. Rhode Island (Trend: 15.2% R)
8. Alabama (Trend: 14.4% R)
9. Louisiana (Trend: 13.8% R)
10. Iowa (Trend: 11.3% R)
States with the smallest trends
1. South Carolina (Trend: 0.0% D/R)
2. New Hampshire (Trend: 0.1% D)
3./4. Arizona (Trend: 1.2% D)/Kansas (Trend: 1.4% R)
5. Massachusetts (Trend: 1.7% R)
6. Nebraska (Trend: 1.8% D)
7./8. Wisconsin (Trend: 2.5% R)/Minnesota (Trend: 2.5% R)
9./10. Florida (Trend: 2.8% R)/Mississippi (Trend: 2.8% R)
11. Montana (Trend: 2.9% D)
(
States with the strongest Democratic trends
1. Utah (Trend: 21.0% D)
2. California (Trend: 16.8% D)
3. Vermont (Trend: 14.9% D)
4. Alaska (Trend: 14.5% D)
5. Hawaii (Trend: 12.3% D)
6./7. Virginia (Trend: 11.7% D) and Colorado (Trend: 11.7% D)
8. Texas (Trend: 10.7% D)
9. DC (Trend: 9.0% D)
10. Oregon (Trend: 8.8% D)
11. Washington (Trend: 8.6% D)
States with the strongest Republican trends
1. West Virginia (Trend: 37.5% R)
2. Tennessee (Trend: 23.9% R)
3. Arkansas (Trend: 23.1% R)
4. Missouri (Trend: 16.9% R)
5. Kentucky (Trend: 16.3% R)
6. Oklahoma (Trend: 16.1% R)
7. Rhode Island (Trend: 15.2% R)
8. Alabama (Trend: 14.4% R)
9. Louisiana (Trend: 13.8% R)
10. Iowa (Trend: 11.3% R)
States with the smallest trends
1. South Carolina (Trend: 0.0% D/R)
2. New Hampshire (Trend: 0.1% D)
3./4. Arizona (Trend: 1.2% D)/Kansas (Trend: 1.4% R)
5. Massachusetts (Trend: 1.7% R)
6. Nebraska (Trend: 1.8% D)
7./8. Wisconsin (Trend: 2.5% R)/Minnesota (Trend: 2.5% R)
9./10. Florida (Trend: 2.8% R)/Mississippi (Trend: 2.8% R)
11. Montana (Trend: 2.9% D)
Title: Re: 2008-2016 Trends: A map/comparison/analysis
Post by: MT Treasurer on December 30, 2016, 02:51:20 AM
So to sum up:
States that trended D from 2000-2016 AND 2008-2016: Alaska, Utah, California, Washington, Arizona, Virginia, North Carolina, Maryland, Colorado, Georgia
States that trended R from 2000-2016 AND 2008-2016: Kansas, North Dakota, South Dakota, Wyoming, Minnesota, Missouri, Iowa, Arkansas, Wisconsin, Michigan, Indiana, Ohio, Pennsylvania, Kentucky, Tennessee, Alabama, Delaware, Connecticut, Rhode Island, Maine
States that had the smallest trends both times: South Carolina!, Kansas, Florida, Mississippi
Title: Re: 2008-2016 Trends: A map/comparison/analysis
Post by: Wiz in Wis on January 07, 2017, 11:04:27 PM
Interesting.... states that are seeing population/diversity growth are shifting D, and those that aren't are shifting R. Short term hurts the Ds, but long term...
Title: Re: 2008-2016 Trends: A map/comparison/analysis
Post by: DPKdebator on January 10, 2017, 09:30:46 PM
Is there a map out there that shows plain old swing from 2008-2016 too?
Title: Re: 2008-2016 Trends: A map/comparison/analysis
Post by: Antonio the Sixth on January 10, 2017, 09:51:26 PM
The Democratic collapse in the Midwest is absolutely horrifying.
Title: Re: 2008-2016 Trends: A map/comparison/analysis
Post by: Since I'm the mad scientist proclaimed by myself on January 11, 2017, 01:37:56 AM
The Democratic collapse in the Midwest is absolutely horrifying.
What about the significant gains in the sunbelt?
Title: Re: 2008-2016 Trends: A map/comparison/analysis
Post by: LLR on January 11, 2017, 07:14:14 AM
The Democratic collapse in the Midwest is absolutely horrifying.
What about the significant gains in the sunbelt?
Say goodbye to Iowa, Wisconsin, Minnesota, Ohio, and Michigan's Senate seats. We may gain the same amount of EVs, but that's 4 or 6 seats we're down in the Senate.
Title: Re: 2008-2016 Trends: A map/comparison/analysis
Post by: HAnnA MArin County on January 11, 2017, 07:32:12 AM
Is this really the future of the two parties: Republicans as the party of whites and Democrats for everyone who isn't white? If so, I think that says something deeply disturbing about where we are not only as a democracy but also as a country.
Title: Re: 2008-2016 Trends: A map/comparison/analysis
Post by: Since I'm the mad scientist proclaimed by myself on January 11, 2017, 09:21:12 AM
The Democratic collapse in the Midwest is absolutely horrifying.
What about the significant gains in the sunbelt?
Say goodbye to Iowa, Wisconsin, Minnesota, Ohio, and Michigan's Senate seats. We may gain the same amount of EVs, but that's 4 or 6 seats we're down in the Senate.
We won't be noncompetitive in the rust-belt for senate races for a long time.
Title: Re: 2008-2016 Trends: A map/comparison/analysis
Post by: Since I'm the mad scientist proclaimed by myself on January 11, 2017, 09:30:48 AM
The Democratic collapse in the Midwest is absolutely horrifying.
What about the significant gains in the sunbelt?
Say goodbye to Iowa, Wisconsin, Minnesota, Ohio, and Michigan's Senate seats. We may gain the same amount of EVs, but that's 4 or 6 seats we're down in the Senate.
We won't be noncompetitive in the rust-belt for senate races for a long time.
Plus, including IL, PA, and WV there are currently 12 dem held senate seats. Including AK, the D trending sunbelt states have the exact same amount of R held states.
Title: Re: 2008-2016 Trends: A map/comparison/analysis
Post by: RINO Tom on January 11, 2017, 11:32:51 AM
People who think Texas will become a Democratic state are out of their ing minds. At best, it will be a swing state that the Republicans will go through hell and high water to win every single cycle. Plus, I'll bet a LOT of money that the Senate and House delegations will remain in GOP hands either way.
Title: Re: 2008-2016 Trends: A map/comparison/analysis
Post by: Arbitrage1980 on January 14, 2017, 12:57:30 AM
People who think Texas will become a Democratic state are out of their ing minds. At best, it will be a swing state that the Republicans will go through hell and high water to win every single cycle. Plus, I'll bet a LOT of money that the Senate and House delegations will remain in GOP hands either way.
TX is solid red for now, but the fact that Trump won it by a smaller margin than Iowa worries me. If Trump does well during his first term, perhaps he will win it by a similar margin as Romney.