Title: 2012 Results By Official Regions
Post by: ElectionsGuy on September 07, 2013, 09:11:04 PM
Intro: I'm going to categorize the 2012 presidential results by regions and mini regions. These are official regions defined by the US census that you can see here in this link (http://www.census.gov/popest/about/geo/terms.html) (Census Regions and Divisions).
For Reference:
The Midwest: IL, IN, IA, KS, MI, MN, MO, NE, ND, OH, SD, WI.
East North Central: IL, IN, MI, OH, WI.
West North Central: IA, KS, MN, MO, NE, ND, SD.
The Northeast: CT, ME, MA, NH, NJ, NY, PA, RI, VT.
New England: CT, ME, MA, NH, RI, VT.
Middle Atlantic: NJ, NY, PA.
The South: AL, AR, DE, DC, FL, GA, KY, LA, MD, MS, NC, OK, SC, TN, TX, VA, WV.
South Atlantic: DE, DC, FL, GA, MD, NC, SC, VA, WV.
East South Central: AL, KY, MS, TN.
West South Central: AR, LA, OK, TX.
The West: AK, AZ, CA, CO, HI, ID, MT, NV, NM, OR, UT, WA, WY.
Mountain: AZ, CO, ID, MT, NV, NM, UT, WY.
Pacific: AK, CA, HI, OR, WA.
Model:
Region: % Obama (EV) (Votes), % Romney (EV) (Votes) Rating: R/D Bellwether: State
Title: Re: 2012 Results By Official Regions
Post by: ElectionsGuy on September 07, 2013, 09:19:21 PM
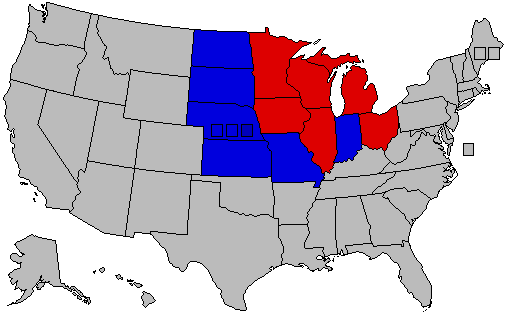
The Midwest:
( )
)
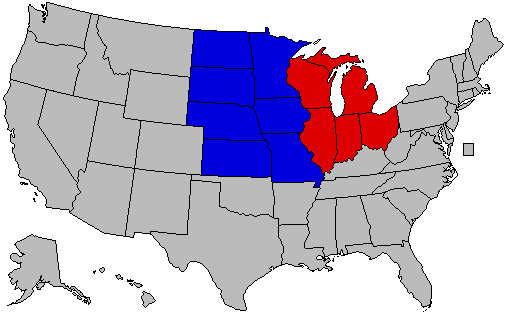
Total Electoral Votes: 118
East North Central: Red (75)
West North Central: Blue (43)
The Midwest: 50.7% Obama (80) (15,790,893), 47.6% Romney (38) (14,843,298) Rating: Toss-Up Bellwether: Ohio
East North Central: 52.6% Obama (64) (11,185,547), 45.9% Romney (11) (9,743,388) Rating: Lean D Bellwether: Wisconsin
West North Central: 51.4% Romney (27) (5,099,910), 46.4% Obama (16) (4,605,319) Rating: Lean R Bellwether: Missouri
(
Total Electoral Votes: 118
East North Central: Red (75)
West North Central: Blue (43)
The Midwest: 50.7% Obama (80) (15,790,893), 47.6% Romney (38) (14,843,298) Rating: Toss-Up Bellwether: Ohio
East North Central: 52.6% Obama (64) (11,185,547), 45.9% Romney (11) (9,743,388) Rating: Lean D Bellwether: Wisconsin
West North Central: 51.4% Romney (27) (5,099,910), 46.4% Obama (16) (4,605,319) Rating: Lean R Bellwether: Missouri
Title: Re: 2012 Results By Official Regions
Post by: ElectionsGuy on September 07, 2013, 09:27:49 PM
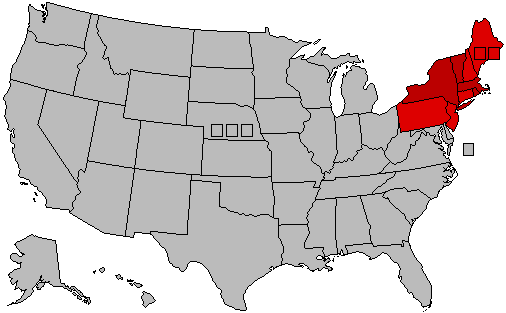
The Northeast:
( )
)
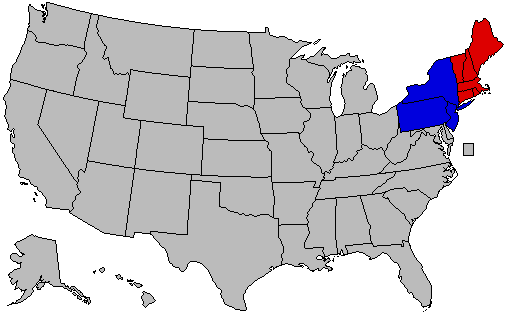
Total Electoral Votes: 96
New England: Red (33)
Middle Atlantic: Blue (63)
The Northeast: 58.5% Obama (96) (13,661,087), 40.0% Romney (0) (9,339,256) Rating: Likely D Bellwether: Connecticut
New England: 59.1% Obama (33) (4,076,156), 39.1% Romney (0) (2,695,302) Rating: Likely D Bellwether: Connecticut
Middle Atlantic: 58.3% Obama (63) (9,584,931), 40.4% Romney (0) (6,643,954) Rating: Likely D Bellwether: New Jersey
(
Total Electoral Votes: 96
New England: Red (33)
Middle Atlantic: Blue (63)
The Northeast: 58.5% Obama (96) (13,661,087), 40.0% Romney (0) (9,339,256) Rating: Likely D Bellwether: Connecticut
New England: 59.1% Obama (33) (4,076,156), 39.1% Romney (0) (2,695,302) Rating: Likely D Bellwether: Connecticut
Middle Atlantic: 58.3% Obama (63) (9,584,931), 40.4% Romney (0) (6,643,954) Rating: Likely D Bellwether: New Jersey
Title: Re: 2012 Results By Official Regions
Post by: ElectionsGuy on September 07, 2013, 09:39:54 PM
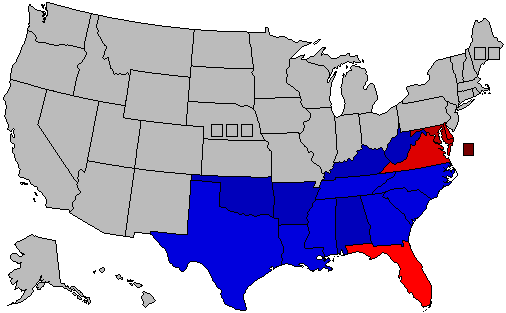
The South:
( )
)
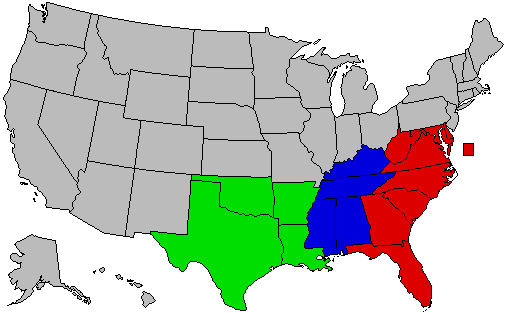
Total Electoral Votes: 196
South Atlantic: Red (103)
East South Central: Blue (34)
West South Central: Green (59)
The South: 52.9% Romney (24,760,451), 45.8% Obama (21,407,447) Rating: Likely R Bellwether: Georgia
South Atlantic: 50.2% Obama (58) (13,453,502), 48.5% Romney (45) (12,983,086) Rating: Toss-Up Bellwether: Virginia
East South Central: 59.3% Romney (34) (4,516,191), 39.4% Obama (0) (2,998,724) Rating: Safe R Bellwether: Tennessee
West South Central: 58.6% Romney (59) (7,261,174), 40.0% Obama (0) (4,955,221) Rating: Safe R Bellwether: Louisiana
(
Total Electoral Votes: 196
South Atlantic: Red (103)
East South Central: Blue (34)
West South Central: Green (59)
The South: 52.9% Romney (24,760,451), 45.8% Obama (21,407,447) Rating: Likely R Bellwether: Georgia
South Atlantic: 50.2% Obama (58) (13,453,502), 48.5% Romney (45) (12,983,086) Rating: Toss-Up Bellwether: Virginia
East South Central: 59.3% Romney (34) (4,516,191), 39.4% Obama (0) (2,998,724) Rating: Safe R Bellwether: Tennessee
West South Central: 58.6% Romney (59) (7,261,174), 40.0% Obama (0) (4,955,221) Rating: Safe R Bellwether: Louisiana
Title: Re: 2012 Results By Official Regions
Post by: ElectionsGuy on September 07, 2013, 09:47:19 PM
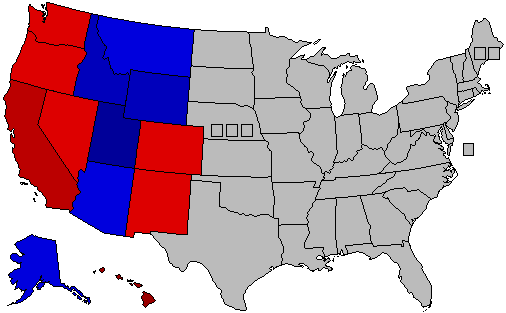
The West:
( )
)
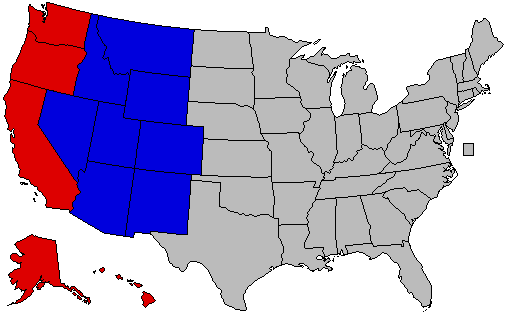
Total Electoral Votes: 128
Mountain: Blue (47)
Pacific: Red (81)
The West: 54.2% Obama (98) (15,040,233), 43.2% Romney (30) (11,989,147) Rating: Lean D Bellwether: Oregon
Mountain: 53.1% Romney (27) (4,818,653), 44.4% Obama (20) (4,030,766) Rating: Likely R Bellwether: Arizona
Pacific: 58.9% Obama (78) (11,009,467), 38.4% Romney (3) (7,170,494) Rating: Likely D Bellwether: California
(
Total Electoral Votes: 128
Mountain: Blue (47)
Pacific: Red (81)
The West: 54.2% Obama (98) (15,040,233), 43.2% Romney (30) (11,989,147) Rating: Lean D Bellwether: Oregon
Mountain: 53.1% Romney (27) (4,818,653), 44.4% Obama (20) (4,030,766) Rating: Likely R Bellwether: Arizona
Pacific: 58.9% Obama (78) (11,009,467), 38.4% Romney (3) (7,170,494) Rating: Likely D Bellwether: California
Title: Re: 2012 Results By Official Regions
Post by: ElectionsGuy on September 07, 2013, 10:23:02 PM
Actual Results by region:
The Northeast:
( )
)
The Midwest:
( )
)
The South
( )
)
The West
( )
)
Obama Regions Won: 3/4: The Midwest, The Northeast, and The West
Romney Regions Won: 1/4: The South
Obama Mini-Regions Won: 5/9: East North Central, New England, Middle Atlantic, South Atlantic, Pacific.
Romney Mini-Regions Won: 4/9: West North Central, East South Central, West South Central, Mountain.
The Northeast:
(
The Midwest:
(
The South
(
The West
(
Obama Regions Won: 3/4: The Midwest, The Northeast, and The West
Romney Regions Won: 1/4: The South
Obama Mini-Regions Won: 5/9: East North Central, New England, Middle Atlantic, South Atlantic, Pacific.
Romney Mini-Regions Won: 4/9: West North Central, East South Central, West South Central, Mountain.
Title: Re: 2012 Results By Official Regions
Post by: minionofmidas on September 08, 2013, 03:20:45 AM
Change on 2008 by regions would be interesting, I think.
Title: Re: 2012 Results By Official Regions
Post by: PolitiJunkie on September 08, 2013, 02:47:30 PM
This is AWESOME, thanks for this Waukesha! My only question is how you determined Lean/Likely/Safe. Pacific was 58.9% Obama while West South Central was 58.6% Romney, yet the former was Likely D and the latter was Safe R despite the former being more heavily D than the latter was R. Similarly, West was 54.2% Obama while Mountain was 53.1% Romney, yet the former was Lean D and the latter was Likely R despite the former being more heavily D than the latter was R. What's the methodology there?
Title: Re: 2012 Results By Official Regions
Post by: ElectionsGuy on September 08, 2013, 04:00:03 PM
This is AWESOME, thanks for this Waukesha! My only question is how you determined Lean/Likely/Safe. Pacific was 58.9% Obama while West South Central was 58.6% Romney, yet the former was Likely D and the latter was Safe R despite the former being more heavily D than the latter was R. Similarly, West was 54.2% Obama while Mountain was 53.1% Romney, yet the former was Lean D and the latter was Likely R despite the former being more heavily D than the latter was R. What's the methodology there?
Again, its because Obama won by 3.9 points, so I add 3.9 points to republican margins and subtract 3.9 to democrat margins that way its balanced for a tied election.
The rating system goes like this:
D/R+0-10% = Lean
D/R+10-20% = Likely
D/R+20% or more = Safe
The margin of victory of Texas in 2012 was R+15.8%, but since it was a republican state, I add 3.9% and I get R+19.7% which is at the edge of likely.
The margin of victory of California in 2012 was D+23.1%, but since it was a democratic state, I subtract 3.9% and I get D+19.2% which is also at the edge of likely.
California may appear much more liberal than Texas is conservative (in 2012), but in a tied election California is just as liberal as Texas is conservative. That's what I'm getting at here.
Title: Re: 2012 Results By Official Regions
Post by: ElectionsGuy on September 08, 2013, 05:02:24 PM
Change on 2008 by regions would be interesting, I think.
It would, If you want I can do 2008 in 2008 results and then asses the changes here.