Title: 2016 Official Polling Map Thread
Post by: Obamanation on February 08, 2013, 05:11:27 PM
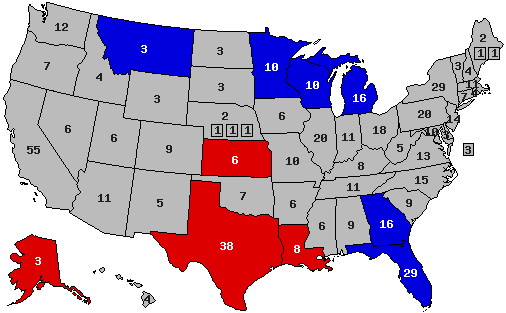
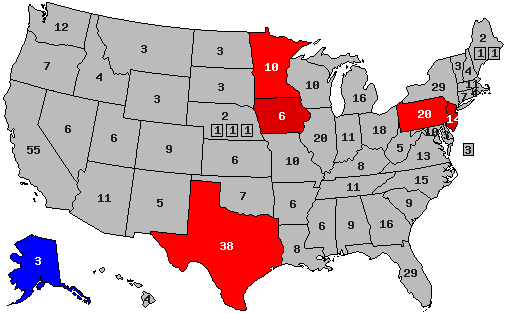
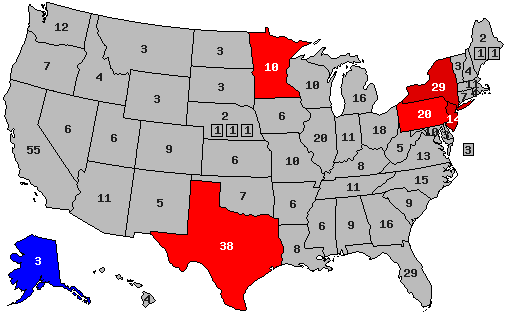
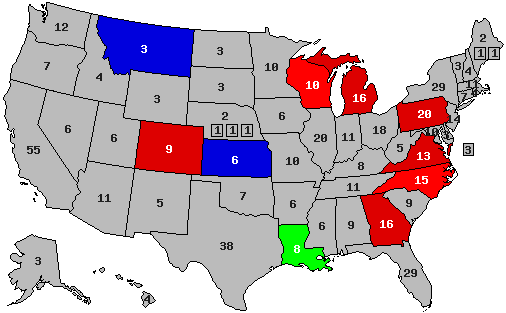
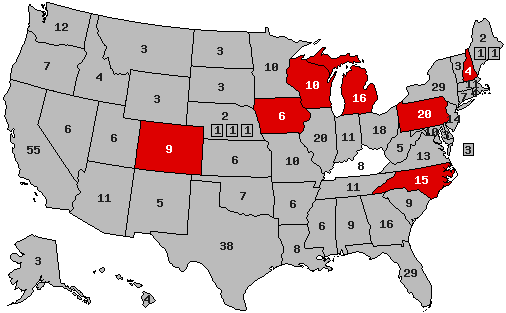
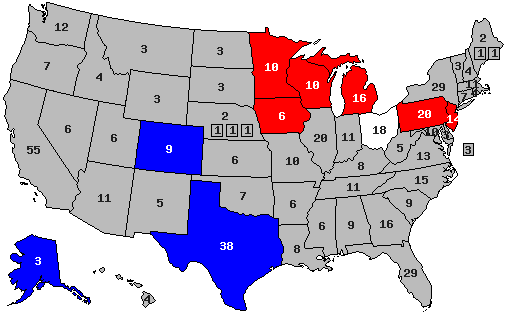
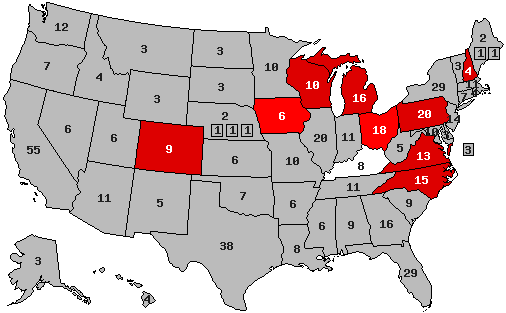
Clinton vs. Rubio
( )
)
EDIT: Adding most recent PA-PPP poll
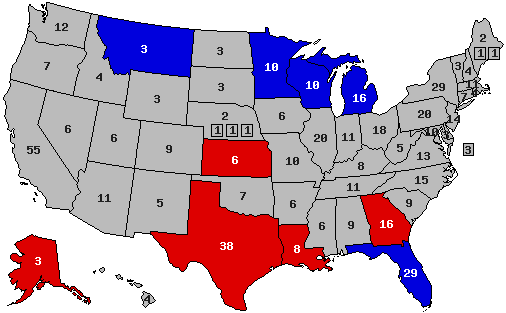
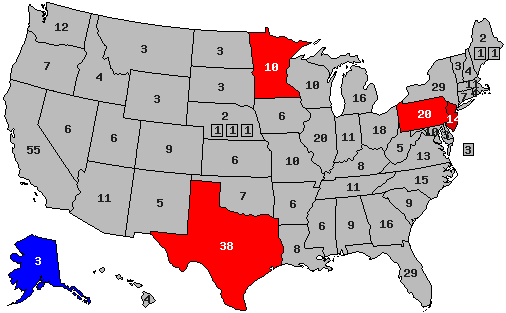
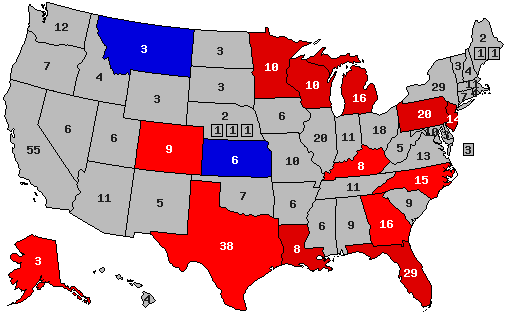
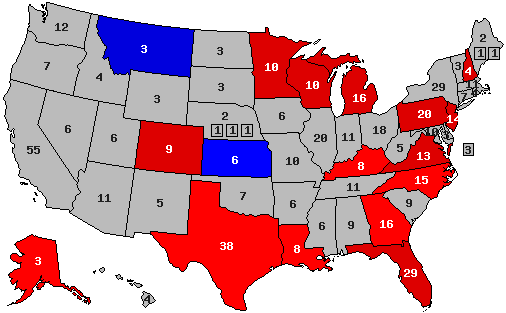
Clinton vs. Ryan
( )
)
EDIT: Adding most recent PA-PPP poll
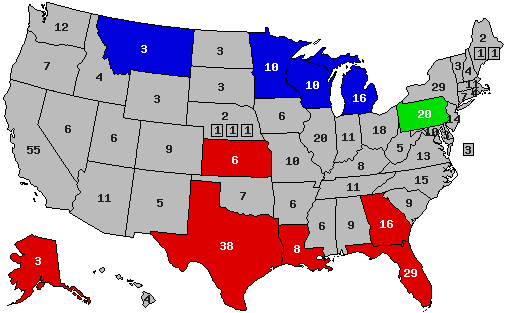
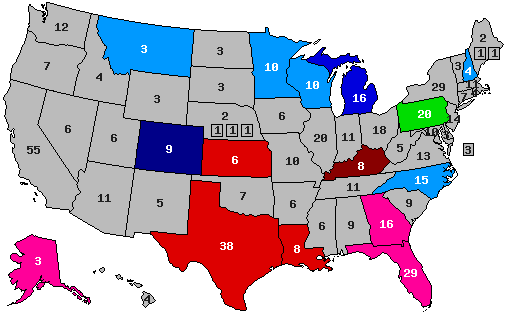
Clinton vs. Christie
( )
)
EDIT: Adding most recent PA-Qunnipiac poll
(
EDIT: Adding most recent PA-PPP poll
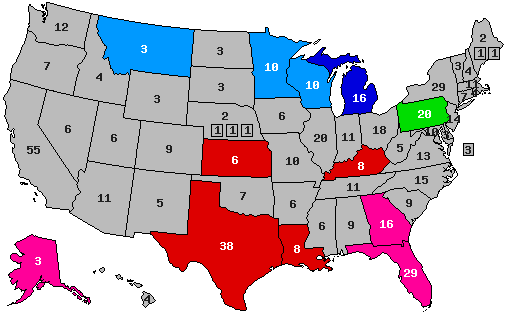
Clinton vs. Ryan
(
EDIT: Adding most recent PA-PPP poll
Clinton vs. Christie
(
EDIT: Adding most recent PA-Qunnipiac poll
Title: Re: 2016 Official Polling Map Thread
Post by: Lief 🗽 on February 09, 2013, 02:16:09 AM
hahaha awesome
Title: Re: 2016 Official Polling Map Thread
Post by: LiberalJunkie on February 09, 2013, 03:07:31 AM
DOMINATING
Title: Re: 2016 Official Polling Map Thread
Post by: pbrower2a on February 09, 2013, 10:18:10 AM
Iowa, PPP. PPP is polling North Carolina and Louisiana this weekend, and could get some interesting results.
Clinton vs. Christie
( )
)
Clinton vs. Rubio
( )
)
Clinton vs. Christie
(
Clinton vs. Rubio
(
Title: Re: 2016 Official Polling Map Thread
Post by: pbrower2a on February 09, 2013, 10:26:49 AM
Unless someone utterly money-bombs the Republican primaries on his behalf, I can't see Christie winning the Republican nomination. Rubio may be over-hyped.
Title: Re: 2016 Official Polling Map Thread
Post by: justfollowingtheelections on February 09, 2013, 02:34:13 PM
Rubio is an early frontrunner. He will make a fool of himself in the debates. Guy's a lightweight.
Title: Re: 2016 Official Polling Map Thread
Post by: Obamanation on February 14, 2013, 01:53:55 PM
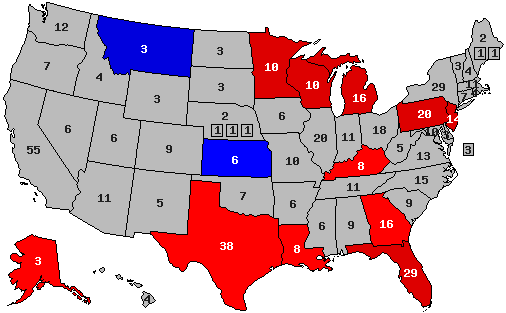
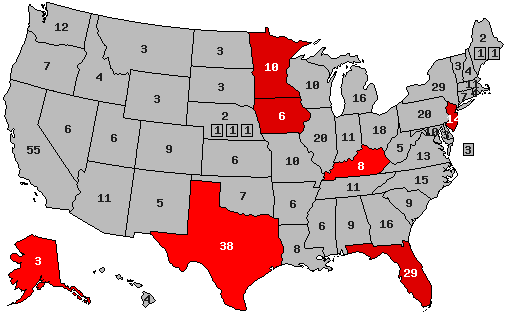
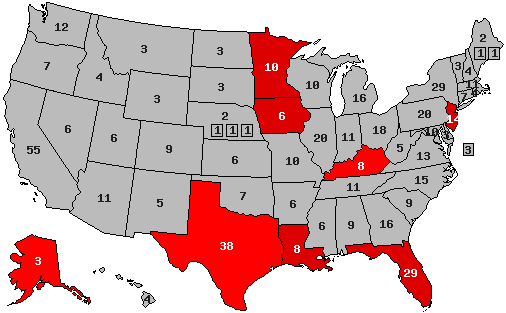
Louisiana - PPP
Clinton.......46%
Rubio.........43%
http://www.publicpolicypolling.com/pdf/2011/PPP_Release_LA_021413.pdf
Clinton vs. Rubio
( )
)
Clinton.......46%
Rubio.........43%
http://www.publicpolicypolling.com/pdf/2011/PPP_Release_LA_021413.pdf
Clinton vs. Rubio
(
Title: Re: 2016 Official Polling Map Thread
Post by: Joe Biden is your president. Deal with it. on February 14, 2013, 01:55:35 PM
President Clinton 2017-2025!! :p
Title: Re: 2016 Official Polling Map Thread
Post by: pbrower2a on February 14, 2013, 05:41:09 PM
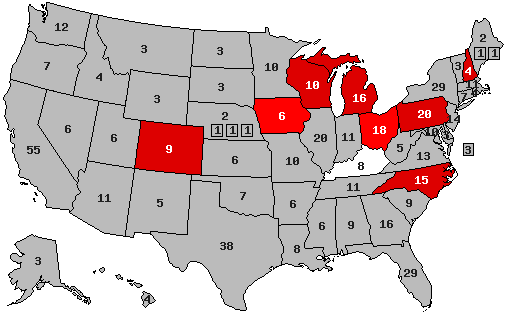
You can add Louisiana to the list of states where Hillary Clinton might be competitive with a 2016 Presidential bid, at least at this stage. She has a 46/44 favorability rating in the state and has 3 points lead over Jindal (48/45) and Rubio (46/43) in hypothetical match ups. She ties Ryan at 46.
Clinton vs. Christie
()
Clinton vs. Rubio
( )
)
Clinton vs. Christie
(
Clinton vs. Rubio
(
Title: Re: 2016 Official Polling Map Thread
Post by: JerryArkansas on February 14, 2013, 05:47:31 PM
I can't wait for PPP to do a poll in Arkansas. I did a poll late last year for school and I had Hillary winning the state with 57% of the vote against Rubio
Title: Re: 2016 Official Polling Map Thread
Post by: Mr. Morden on February 14, 2013, 05:56:24 PM
Has PPP stopped including Christie in their general election matchups because he's not competitive in the primary?
Title: Re: 2016 Official Polling Map Thread
Post by: retromike22 on February 14, 2013, 10:20:03 PM
Why don't you just edit the first post each time a new poll is added, instead of making new posts for each new poll? (just an idea, not a complaint)
Title: Re: 2016 Official Polling Map Thread
Post by: pbrower2a on February 18, 2013, 02:11:06 PM
Re: Rubio
His performance of the rebuttal to the President's State of the Union speech indicates that he is not ready for prime time. Republicans surely liked it for policy issues, but everything else left much to be desired.
His performance of the rebuttal to the President's State of the Union speech indicates that he is not ready for prime time. Republicans surely liked it for policy issues, but everything else left much to be desired.
Title: Re: 2016 Official Polling Map Thread
Post by: pbrower2a on February 18, 2013, 02:27:51 PM
Quote
With over 3,400 respondents, the poll has a national scope as well as ample sampling of such traditionally under-polled groups as African-Americans and Latinos
...Correction noted, and the invalid material is removed.
PPP polled Georgia and Montana this weekend. We may find such interesting.
Title: Re: 2016 Official Polling Map Thread
Post by: Mr. Morden on February 18, 2013, 06:01:15 PM
Poll questions released Wednesday also covered the 2012 presidential election results, attitudes toward women in the workplace and hypothetical 2016 presidential election match-ups involving the possible candidacy of former Secretary of State Hillary Clinton.
The poll results showed Clinton with leads over former Florida Gov. Jeb Bush (61 percent to 32 percent), Florida Sen. Marco Rubio (61 percent to 30 percent) and New Jersey Gov. Chris Christie (58 percent to 34 percent).
http://blaircenterclintonschoolpoll.uark.edu/6760.php
The poll results showed Clinton with leads over former Florida Gov. Jeb Bush (61 percent to 32 percent), Florida Sen. Marco Rubio (61 percent to 30 percent) and New Jersey Gov. Chris Christie (58 percent to 34 percent).
http://blaircenterclintonschoolpoll.uark.edu/6760.php
This is a national poll, not an Arkansas poll. And we discussed it two weeks ago, when it was first released:
https://uselectionatlas.org/FORUM/index.php?topic=169067.0
Title: Re: 2016 Official Polling Map Thread
Post by: Obamanation on February 20, 2013, 04:03:54 PM
I am updating the map at the start of the thread. So far it will take the most recent poll, once we start getting a greater volume of polls, I'll average the last 3 polls per state, or so...
Feel free to add comments, as usual.
Feel free to add comments, as usual.
Title: Re: 2016 Official Polling Map Thread
Post by: pbrower2a on February 20, 2013, 10:39:08 PM
Georgia (PPP)
Clinton vs. Christie
()
Clinton vs. Rubio
( )
)
If Republicans think Barack Obama troublesome, then wait until they see Hillary Clinton.
Quote
Q16 If the candidates for President in 2016 were
Democrat Hillary Clinton and Republican Newt
Gingrich, who would you vote for?
Hillary Clinton.................................................. 51%
Newt Gingrich ................................................. 44%
Not sure .......................................................... 5%
Q17 If the candidates for President in 2016 were
Democrat Hillary Clinton and Republican
Marco Rubio, who would you vote for?
Hillary Clinton.................................................. 49%
Marco Rubio ................................................... 46%
Not sure .......................................................... 5%
Q18 If the candidates for President in 2016 were
Democrat Hillary Clinton and Republican Paul
Ryan, who would you vote for?
Hillary Clinton.................................................. 50%
Paul Ryan ....................................................... 45%
Not sure .......................................................... 5%
Clinton vs. Christie
(
Clinton vs. Rubio
(
If Republicans think Barack Obama troublesome, then wait until they see Hillary Clinton.
Title: Re: 2016 Official Polling Map Thread
Post by: pbrower2a on February 21, 2013, 07:37:25 PM
Q6 Do you have a favorable or unfavorable opinion
of Hillary Clinton?
Favorable........................................................ 44%
Unfavorable .................................................... 48%
Not sure .......................................................... 8%
Q7 If the candidates for President in 2016 were
Democrat Hillary Clinton and Republican
Marco Rubio, who would you vote for?
Hillary Clinton.................................................. 42%
Marco Rubio ................................................... 50%
Not sure .......................................................... 7%
http://www.publicpolicypolling.com/pdf/2011/PPP_Release_MT_022113.pdf
Montana hasn't voted for the Democratic nominee for President since 1992, when the state split 37-35-26 Clinton-Bush-Perot. Perot likely took more votes from the elder Bush that year. It went 44-41-16 Dole-Clinton-Perot in 1996. Dubya won it 55-33 in 2000 and 59-39 in 2004. The highest percentage for any Democratic nominee for President since the LBJ blowout was 47% for Barack Obama. Kennedy lost it with a slightly-larger percentage than Obama in 1960. Of course, Presidential politics in America before 1992 now might as well be ancient history. Don't let the close election in 2008 fool you: it will go D for President only in a blowout.
Montana is a swing state with its Favorite Son its recent Governor Brian Schweitzer, but three electoral votes haven't decided a Presidential election in a very long time. If he is a VP nominee he might not swing the state because it isn't that close; his value for Biden or Clinton would likely be in places where populist tendencies have hibernated under President Obama.
Clinton vs. Christie
()
Clinton vs. Rubio
( )
)
If Republicans think Barack Obama troublesome, then wait until they see Hillary Clinton.
of Hillary Clinton?
Favorable........................................................ 44%
Unfavorable .................................................... 48%
Not sure .......................................................... 8%
Q7 If the candidates for President in 2016 were
Democrat Hillary Clinton and Republican
Marco Rubio, who would you vote for?
Hillary Clinton.................................................. 42%
Marco Rubio ................................................... 50%
Not sure .......................................................... 7%
http://www.publicpolicypolling.com/pdf/2011/PPP_Release_MT_022113.pdf
Montana hasn't voted for the Democratic nominee for President since 1992, when the state split 37-35-26 Clinton-Bush-Perot. Perot likely took more votes from the elder Bush that year. It went 44-41-16 Dole-Clinton-Perot in 1996. Dubya won it 55-33 in 2000 and 59-39 in 2004. The highest percentage for any Democratic nominee for President since the LBJ blowout was 47% for Barack Obama. Kennedy lost it with a slightly-larger percentage than Obama in 1960. Of course, Presidential politics in America before 1992 now might as well be ancient history. Don't let the close election in 2008 fool you: it will go D for President only in a blowout.
Montana is a swing state with its Favorite Son its recent Governor Brian Schweitzer, but three electoral votes haven't decided a Presidential election in a very long time. If he is a VP nominee he might not swing the state because it isn't that close; his value for Biden or Clinton would likely be in places where populist tendencies have hibernated under President Obama.
Clinton vs. Christie
(
Clinton vs. Rubio
(
If Republicans think Barack Obama troublesome, then wait until they see Hillary Clinton.
Title: Re: 2016 Official Polling Map Thread
Post by: pbrower2a on February 28, 2013, 05:52:19 PM
Quote
Other notes from Michigan:
-By a 45/35 margin voters think the state should keep the current system of all electoral votes going to the statewide winner rather than changing to an allocation by Congressional District model. 22% of Republicans think the state should keep winner take all, while only 12% of Democrats support switching to a by district model.
-Michigan voters support stricter gun laws in general by a 52/39 margin, and on the specific issue of an assault weapons ban they're supportive by a 54/37 margin. There is near universal support among Democrats for the assault weapons ban, and even 36% of Republicans support it. The NRA has a 38/45 favorability rating in the state.
-Barack Obama's approval rating is 48/47. Debbie Stabenow's is 51/36. The late Gerald Ford has a 57/12 favorability rating in the state, including 47/18 with Democrats.
-Hillary Clinton at this early stage looks like she would be a strong favorite in Michigan in 2016. She leads Paul Ryan 52/41 and Marco Rubio 51/37, in both cases margins even larger than what Barack Obama won by last fall.
http://www.publicpolicypolling.com/main/2013/03/michigan-miscellany.html#more
....The Republicans could probably win Michigan if they nominated Gerald Ford, the last Republican to win the state in a close election...
(
Clinton vs. Rubio
(
If Republicans think Barack Obama troublesome, then wait until they see Hillary Clinton.
Title: Re: 2016 Official Polling Map Thread
Post by: pbrower2a on March 08, 2013, 11:44:14 PM
I figure Ryan would get about the same results as Rubio. I have seen nothing on Christie lately.
Title: Re: 2016 Official Polling Map Thread
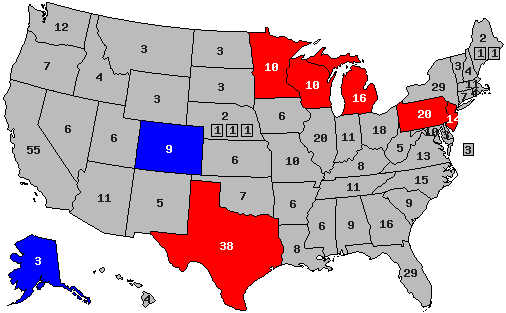
Post by: Mr. Morden on March 09, 2013, 08:00:02 AM
I think the trend map is more interesting than the straight up who's ahead map. We now have quite a few Clinton vs. Rubio state polls. Just counting polls that PPP has conducted this year on Clinton vs. Rubio, we have:
national, Jan. 3-6: Clinton +14
Florida, Jan. 11-13: Clinton +4
Minnesota, Jan. 18-20: Clinton +13
Texas, Jan. 24-27: Clinton +1
national, Jan. 31-Feb. 3: Clinton +8
Alaska, Feb. 4-5: Clinton +1
Louisiana, Feb. 8-12: Clinton +3
Montana, Feb. 15-17: Rubio +8
Georgia, Feb. 15-18: Clinton +3
Kansas, Feb. 21-24: Rubio +5
Wisconsin, Feb. 21-24: Clinton +14
Michigan, Mar. 2-4: Clinton +14
We also have the recent Quinnipiac national poll:
national, Feb. 27-Mar. 4: Clinton +16
So some disagreement about how much Clinton leads by nationally. PPP says 8 points, and Quinnipiac says 16. If you assume that the true national margin is the Clinton by 8 seen in that Jan. 31-Feb. 3 poll, then relative to the 2012 election, the trend would be:
Florida: R+1 (Rubio's home state)
Minnesota: D+1
Texas: D+12
Alaska: D+11
Louisiana: D+16
Montana: D+1
Georgia: D+7
Kansas: D+13
Wisconsin: D+3
Michigan: +/-0
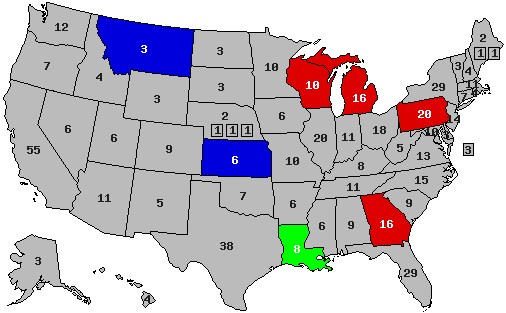
But that doesn't seem right. Not every state can be trending Democratic. Remember, "trend" all has to balance out. If, instead, we assume that the Clinton by 16 nationally number from Quinnipiac is closer to the truth, then you just add 8 points to the GOP side in every state:
Florida: R+9 (Rubio's home state)
Minnesota: R+7
Texas: D+4
Alaska: D+3
Louisiana: D+8
Montana: R+7
Georgia: R+1
Kansas: D+5
Wisconsin: R+5
Michigan: R+8
That map would be (ignore shading):
( )
)
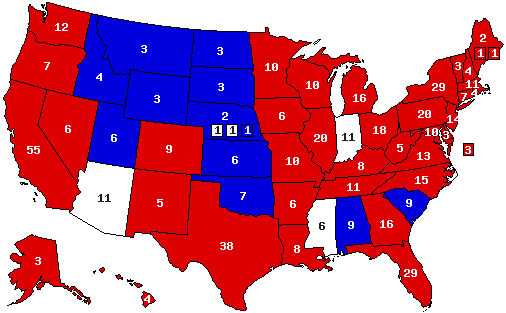
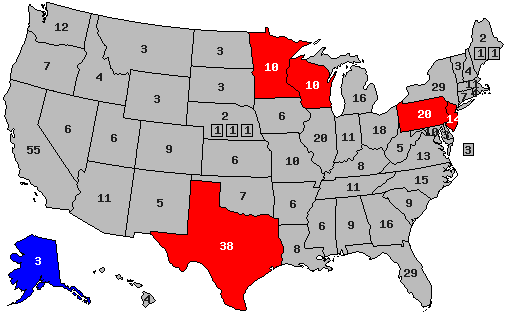
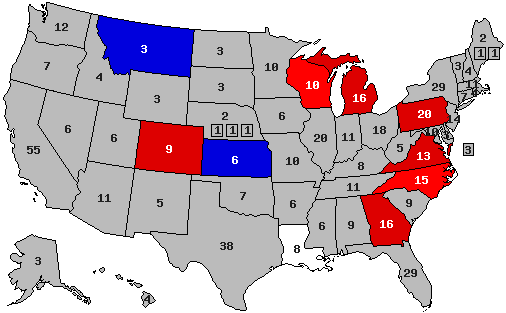
Perhaps that's closer to the truth, though the answer's probably somewhere in between. If you assume that the Clinton by 14 national margin that PPP got in early Jan. is the true national margin, then you flip Georgia on the trend map:
( )
)
There's either a north/south divide here, or a Dem. state / GOP state divide, with the more Democratic states trending Republican and vice versa.
Or, to put it another way, the polls show that, as of today, Clinton would beat Rubio by much more than the margin by which Obama beat Romney. But most of those extra votes she would get are in the more Republican states, perhaps especially in the South. Obama may have come closer to maxing out the Democratic vote in the North than the South.
national, Jan. 3-6: Clinton +14
Florida, Jan. 11-13: Clinton +4
Minnesota, Jan. 18-20: Clinton +13
Texas, Jan. 24-27: Clinton +1
national, Jan. 31-Feb. 3: Clinton +8
Alaska, Feb. 4-5: Clinton +1
Louisiana, Feb. 8-12: Clinton +3
Montana, Feb. 15-17: Rubio +8
Georgia, Feb. 15-18: Clinton +3
Kansas, Feb. 21-24: Rubio +5
Wisconsin, Feb. 21-24: Clinton +14
Michigan, Mar. 2-4: Clinton +14
We also have the recent Quinnipiac national poll:
national, Feb. 27-Mar. 4: Clinton +16
So some disagreement about how much Clinton leads by nationally. PPP says 8 points, and Quinnipiac says 16. If you assume that the true national margin is the Clinton by 8 seen in that Jan. 31-Feb. 3 poll, then relative to the 2012 election, the trend would be:
Florida: R+1 (Rubio's home state)
Minnesota: D+1
Texas: D+12
Alaska: D+11
Louisiana: D+16
Montana: D+1
Georgia: D+7
Kansas: D+13
Wisconsin: D+3
Michigan: +/-0
But that doesn't seem right. Not every state can be trending Democratic. Remember, "trend" all has to balance out. If, instead, we assume that the Clinton by 16 nationally number from Quinnipiac is closer to the truth, then you just add 8 points to the GOP side in every state:
Florida: R+9 (Rubio's home state)
Minnesota: R+7
Texas: D+4
Alaska: D+3
Louisiana: D+8
Montana: R+7
Georgia: R+1
Kansas: D+5
Wisconsin: R+5
Michigan: R+8
That map would be (ignore shading):
(
Perhaps that's closer to the truth, though the answer's probably somewhere in between. If you assume that the Clinton by 14 national margin that PPP got in early Jan. is the true national margin, then you flip Georgia on the trend map:
(
There's either a north/south divide here, or a Dem. state / GOP state divide, with the more Democratic states trending Republican and vice versa.
Or, to put it another way, the polls show that, as of today, Clinton would beat Rubio by much more than the margin by which Obama beat Romney. But most of those extra votes she would get are in the more Republican states, perhaps especially in the South. Obama may have come closer to maxing out the Democratic vote in the North than the South.
Title: Re: 2016 Official Polling Map Thread
Post by: pbrower2a on March 09, 2013, 09:11:13 AM
One way to look at it is to say that Barack Obama, although an above-average vote-getter, gets polarizing results. That could be race (for which he is obviously excused) or his unusual ability to win northern suburban votes but unusual incapacity for winning rural votes. Hillary Clinton isn't as polarizing a figure, or she can win the sorts of voters that he husband won but Obama could not reach.
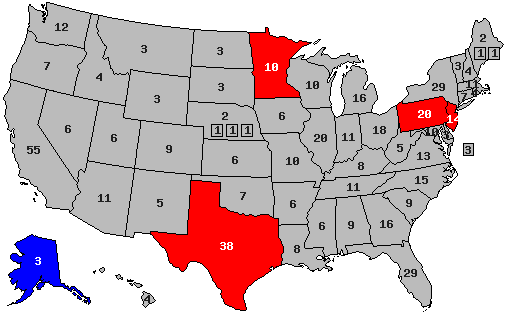
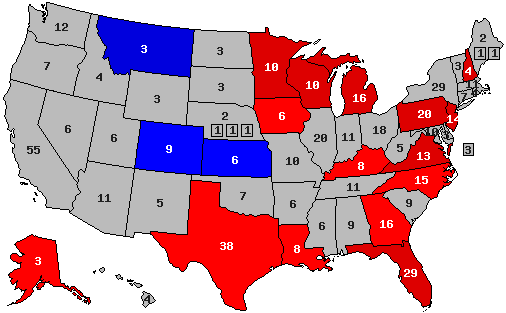
If she is able to win the sorts of voters who went for Barack Obama won in 2008 and 2012 and the sorts of voters that her husband won in 1992 and 1996 but Gore, Kerry, and Obama lost beginning in 2000, then this is what I can predict for 2016:
Clinton vs. Rubio
( )
)
At this point I have no idea of how Arizona, Indiana, Mississippi, or two of the three Congressional districts of Nebraska would go. It could also be that Marco Rubio fails badly to live up to the early hype and will get wiped out early.
If Republicans think Barack Obama troublesome, then wait until they see Hillary Clinton.
If she is able to win the sorts of voters who went for Barack Obama won in 2008 and 2012 and the sorts of voters that her husband won in 1992 and 1996 but Gore, Kerry, and Obama lost beginning in 2000, then this is what I can predict for 2016:
Clinton vs. Rubio
(
At this point I have no idea of how Arizona, Indiana, Mississippi, or two of the three Congressional districts of Nebraska would go. It could also be that Marco Rubio fails badly to live up to the early hype and will get wiped out early.
If Republicans think Barack Obama troublesome, then wait until they see Hillary Clinton.
Title: Re: 2016 Official Polling Map Thread
Post by: pbrower2a on March 13, 2013, 10:06:23 PM
PPP, Pennsylvania.
I have seen little on Clinton vs. Christie lately. Hillary clobbers everyone else in Pennsylvania:
H. Clinton v. Christie
()
Clinton vs. Rubio
( )
)
If Republicans think Barack Obama troublesome, then wait until they see Hillary Clinton.
I have seen little on Clinton vs. Christie lately. Hillary clobbers everyone else in Pennsylvania:
Quote
Q13
If the candidates for President in 2016 were
Democrat Hillary Clinton and Republican
Marco Rubio, who would you vote for?
52%
Hillary Clinton
..................................................
37%
Marco Rubio
...................................................
12%
Not sure
..........................................................
Q14
If the candidates for President in 2016 were
Democrat Hillary Clinton and Republican Paul
Ryan, who would you vote for?
52%
Hillary Clinton
..................................................
40%
Paul Ryan
.......................................................
8%
Not sure
..........................................................
Q15
If the candidates for President in 2016 were
Democrat Hillary Clinton and Republican Rick
Santorum, who would you vote for?
55%
Hillary Clinton
..................................................
38%
Rick Santorum
................................................
7%
Not sure
If the candidates for President in 2016 were
Democrat Hillary Clinton and Republican
Marco Rubio, who would you vote for?
52%
Hillary Clinton
..................................................
37%
Marco Rubio
...................................................
12%
Not sure
..........................................................
Q14
If the candidates for President in 2016 were
Democrat Hillary Clinton and Republican Paul
Ryan, who would you vote for?
52%
Hillary Clinton
..................................................
40%
Paul Ryan
.......................................................
8%
Not sure
..........................................................
Q15
If the candidates for President in 2016 were
Democrat Hillary Clinton and Republican Rick
Santorum, who would you vote for?
55%
Hillary Clinton
..................................................
38%
Rick Santorum
................................................
7%
Not sure
H. Clinton v. Christie
(
Clinton vs. Rubio
(
If Republicans think Barack Obama troublesome, then wait until they see Hillary Clinton.
Title: Re: 2016 Official Polling Map Thread
Post by: BaldEagle1991 on March 13, 2013, 10:51:25 PM
I just love to see Texas go for Clinton in these maps.
Although I don't really think it would happen.
Although I don't really think it would happen.
Title: Re: 2016 Official Polling Map Thread
Post by: Mr. Morden on March 13, 2013, 11:01:22 PM
Where do the Iowa numbers here come from? I don't see a general election poll for Iowa out there, but I might have missed it.
Title: Re: 2016 Official Polling Map Thread
Post by: publicunofficial on March 14, 2013, 12:09:52 AM
Should this thread have a map for Hillary vs. Rand Paul? He's being featured in a lot more polls than Christie is.
Title: Re: 2016 Official Polling Map Thread
Post by: pbrower2a on March 14, 2013, 08:07:14 AM
Should this thread have a map for Hillary vs. Rand Paul? He's being featured in a lot more polls than Christie is.
It seems that most Republicans other than Chris Christie -- such as Paul Ryan -- do about the same as Marco Rubio. So far we have little other contrast in likely results between most Republican prospects other than Chris Christie with Hillary Clinton.
Title: Re: 2016 Official Polling Map Thread
Post by: Mr. Morden on March 14, 2013, 08:11:45 AM
Where do the Iowa numbers here come from? I don't see a general election poll for Iowa out there, but I might have missed it.
Title: Re: 2016 Official Polling Map Thread
Post by: Tender Branson on March 14, 2013, 09:42:09 AM
Where do the Iowa numbers here come from? I don't see a general election poll for Iowa out there, but I might have missed it.
There was no Iowa general election poll.
I think he used the national numbers from PPP for Iowa, because they were in the same release.
http://www.publicpolicypolling.com/pdf/2011/PPP_Release_National_207.pdf
Title: Re: 2016 Official Polling Map Thread
Post by: pbrower2a on March 15, 2013, 01:12:47 PM
Quinnipiac -- H Clinton 47. Christie 42.
I have seen little on Clinton vs. Christie lately. Hillary clobbers everyone else in Pennsylvania:
H. Clinton v. Christie
( )
)
Clinton vs. Rubio
()
If Republicans think Barack Obama troublesome, then wait until they see Hillary Clinton.
[/quote]
I have seen little on Clinton vs. Christie lately. Hillary clobbers everyone else in Pennsylvania:
H. Clinton v. Christie
(
Clinton vs. Rubio
(
If Republicans think Barack Obama troublesome, then wait until they see Hillary Clinton.
[/quote]
Title: Re: 2016 Official Polling Map Thread
Post by: Tender Branson on March 15, 2013, 01:15:41 PM
pbrower, what is that Iowa poll in your map ?
I didn't find an Iowa poll. Where did you get it from ?
I didn't find an Iowa poll. Where did you get it from ?
Title: Re: 2016 Official Polling Map Thread
Post by: pbrower2a on March 17, 2013, 12:06:25 PM
Quinnipiac -- H Clinton 47. Christie 42.
I checked. Dirty spectacles.
H. Clinton v. Christie
( )
)
Clinton vs. Rubio
( )
)
If Republicans think Barack Obama troublesome, then wait until they see Hillary Clinton.
pbrower, what is that Iowa poll in your map ?
I didn't find an Iowa poll. Where did you get it from ?
I didn't find an Iowa poll. Where did you get it from ?
I checked. Dirty spectacles.
H. Clinton v. Christie
(
Clinton vs. Rubio
(
If Republicans think Barack Obama troublesome, then wait until they see Hillary Clinton.
Title: Re: 2016 Official Polling Map Thread
Post by: pbrower2a on March 19, 2013, 07:18:53 PM
Quote
In an early look at the 2016 presidential race in New York State, voters back former Senator and Secretary of State Hillary Clinton over New Jersey Gov. Christie 59 - 32 percent.
http://www.quinnipiac.edu/institutes-centers/polling-institute/new-york-state/release-detail?ReleaseID=1867
Nothing about Rubio, Ryan, or others who have almost no chance of winning New York.
H. Clinton v. Christie
(
Clinton vs. Rubio
(
If Republicans think Barack Obama troublesome, then wait until they see Hillary Clinton.
Title: Re: 2016 Official Polling Map Thread
Post by: Mr. Illini on March 20, 2013, 09:07:38 PM
Anything on Rand Paul? Would love to see how he fairs against Hillary. If he fairs much better than the other GOP potentials, he could use that as a great tool in the primary.
Title: Re: 2016 Official Polling Map Thread
Post by: Tender Branson on March 21, 2013, 11:14:12 AM
Anything on Rand Paul? Would love to see how he fairs against Hillary. If he fairs much better than the other GOP potentials, he could use that as a great tool in the primary.
Well, PPP is doing a new national poll next week.
If Rand Paul finishes among the first 2 in their GOP primary poll, then Paul will be used in every state matchup against Hillary until their next national GOP poll.
PPP always uses the first 2 GOP candidates for their state polls and 1 or 2 local people against Hillary.
Title: Re: 2016 Official Polling Map Thread
Post by: Enderman on March 21, 2013, 09:29:43 PM
Anything on Rand Paul? Would love to see how he fairs against Hillary. If he fairs much better than the other GOP potentials, he could use that as a great tool in the primary.
Well, PPP is doing a new national poll next week.
If Rand Paul finishes among the first 2 in their GOP primary poll, then Paul will be used in every state matchup against Hillary until their next national GOP poll.
PPP always uses the first 2 GOP candidates for their state polls and 1 or 2 local people against Hillary.
I wonder how's Jindal doing....
Title: Re: 2016 Official Polling Map Thread
Post by: Mr. Morden on March 22, 2013, 01:44:33 AM
I wonder how's Jindal doing....
Likely terrible. All we have is his home state:
Clinton: 48
Jindal: 45
Clinton: 46
Rubio: 43
Clinton: 46
Ryan: 46
Jindal: 45
Clinton: 46
Rubio: 43
Clinton: 46
Ryan: 46
With the favourite son effect, he only does as well as other candidates, meaning he'd likely be doing worse than either Rubio or Ryan against Hillary in other states.
I thought he meant how Jindal was doing in the national primary matchup.
In any case, anyone want to guess what PPP's national primary numbers will look like on the GOP side? My guess is Rubio in first and Paul in second, meaning that they'll include Paul in the general election matchups for a while?
Title: Re: 2016 Official Polling Map Thread
Post by: Tender Branson on March 22, 2013, 01:47:40 AM
I wonder how's Jindal doing....
Likely terrible. All we have is his home state:
Clinton: 48
Jindal: 45
Clinton: 46
Rubio: 43
Clinton: 46
Ryan: 46
Jindal: 45
Clinton: 46
Rubio: 43
Clinton: 46
Ryan: 46
With the favourite son effect, he only does as well as other candidates, meaning he'd likely be doing worse than either Rubio or Ryan against Hillary in other states.
I thought he meant how Jindal was doing in the national primary matchup.
In any case, anyone want to guess what PPP's national primary numbers will look like on the GOP side? My guess is Rubio in first and Paul in second, meaning that they'll include Paul in the general election matchups for a while?
Their FL poll suggests that Paul might even be 1st in their national primary poll.
I say:
1) Paul
2) Rubio
3) Christie
4) Ryan
5) Bush
Title: Re: 2016 Official Polling Map Thread
Post by: Mr. Morden on March 23, 2013, 01:47:15 AM
Their FL poll suggests that Paul might even be 1st in their national primary poll.
I say:
1) Paul
2) Rubio
3) Christie
4) Ryan
5) Bush
I say:
1) Paul
2) Rubio
3) Christie
4) Ryan
5) Bush
Maybe. We don't have a lot to go on. The PA poll was also taken after the filibuster, and Paul was at 17% in that. For the record, PPP's last national poll (pre-filibuster) was:
https://uselectionatlas.org/FORUM/index.php?topic=169083.0
Rubio 22%
Ryan 15%
Bush 13%
Christie 13%
Huckabee 11%
Paul 10%
Jindal 4%
Perry 3%
Martinez 1%
For this one, I could see a close race between Paul and Rubio for first place.
Title: Re: 2016 Official Polling Map Thread
Post by: DS0816 on March 27, 2013, 03:39:40 PM
One way to look at it is to say that Barack Obama, although an above-average vote-getter, gets polarizing results. That could be race (for which he is obviously excused) or his unusual ability to win northern suburban votes but unusual incapacity for winning rural votes. Hillary Clinton isn't as polarizing a figure, or she can win the sorts of voters that he husband won but Obama could not reach.
If she is able to win the sorts of voters who went for Barack Obama won in 2008 and 2012 and the sorts of voters that her husband won in 1992 and 1996 but Gore, Kerry, and Obama lost beginning in 2000, then this is what I can predict for 2016:
Clinton vs. Rubio
()
At this point I have no idea of how Arizona, Indiana, Mississippi, or two of the three Congressional districts of Nebraska would go. It could also be that Marco Rubio fails badly to live up to the early hype and will get wiped out early.
If Republicans think Barack Obama troublesome, then wait until they see Hillary Clinton.
If she is able to win the sorts of voters who went for Barack Obama won in 2008 and 2012 and the sorts of voters that her husband won in 1992 and 1996 but Gore, Kerry, and Obama lost beginning in 2000, then this is what I can predict for 2016:
Clinton vs. Rubio
(
At this point I have no idea of how Arizona, Indiana, Mississippi, or two of the three Congressional districts of Nebraska would go. It could also be that Marco Rubio fails badly to live up to the early hype and will get wiped out early.
If Republicans think Barack Obama troublesome, then wait until they see Hillary Clinton.
For a Democrat to win Texas one or two things happen:
1. Win the U.S. Popular Vote with at least 57 percent.
2. See Texas's demographics move sharply away from being advantageous with the Republicans and without needing so much rope to bring it in.
If Texas is going Democratic, so is Montana. So is Indiana. And so are North Dakota and South Dakota and the first two Congressional Districts in the state of Nebraska. Nebraska, statewide and with the 3rd Congressional District, and Kansas would be reduced to (at best) a 5-point hold for the losing Republican.
If Texas goes Democratic, it's going to be a 40-state [plus] landslide election.
Since 1912 -- dating back 100 years -- South Carolina has voted the same as Mississippi and Alabama in all but two elections: 1960 and 1968. If ever a split, Ala. and Miss. -- which have voted alike in all elections since their first vote in 1820 (exception is 1840) -- would stay Republicans (because, long term, they vote opposite Vermont) while S.C. would flip Democratic. This is like Ind. + N.D. + S.D. + Neb. + Kan. = same since 1920. Those five states voted the same in all of 1920 to 2004. In 2008, Barack Obama flipped Ind. and Neb. #02. It was a difference in tipping point.
In recent elections, S.C. has been about 15 points more Republican than the country. Tex. has been about 20 points. We can't hold them all to a tee but if Texas is willing to flip Democratic, it would be wise to look out for S.C. But for this to be happening, it's a likelihood than Montana will have already flipped. It would be such a national tide that Montana would come in. It's just that Democrats should be going after Montana.
If all of this is happening Arizona is there for the Democrats.
Title: Re: 2016 Official Polling Map Thread
Post by: pbrower2a on March 28, 2013, 10:56:33 AM
For a Democrat to win Texas one or two things happen:
1. Win the U.S. Popular Vote with at least 57 percent.
2. See Texas's demographics move sharply away from being advantageous with the Republicans and without needing so much rope to bring it in.
If Texas is going Democratic, so is Montana. So is Indiana. And so are North Dakota and South Dakota and the first two Congressional Districts in the state of Nebraska. Nebraska, statewide and with the 3rd Congressional District, and Kansas would be reduced to (at best) a 5-point hold for the losing Republican.
If Texas goes Democratic, it's going to be a 40-state [plus] landslide election.
Since 1912 -- dating back 100 years -- South Carolina has voted the same as Mississippi and Alabama in all but two elections: 1960 and 1968. If ever a split, Ala. and Miss. -- which have voted alike in all elections since their first vote in 1820 (exception is 1840) -- would stay Republicans (because, long term, they vote opposite Vermont) while S.C. would flip Democratic. This is like Ind. + N.D. + S.D. + Neb. + Kan. = same since 1920. Those five states voted the same in all of 1920 to 2004. In 2008, Barack Obama flipped Ind. and Neb. #02. It was a difference in tipping point.
In recent elections, S.C. has been about 15 points more Republican than the country. Tex. has been about 20 points. We can't hold them all to a tee but if Texas is willing to flip Democratic, it would be wise to look out for S.C. But for this to be happening, it's a likelihood than Montana will have already flipped. It would be such a national tide that Montana would come in. It's just that Democrats should be going after Montana.
If all of this is happening Arizona is there for the Democrats.
I just have no information for Arizona, Indiana, Mississippi, or either of the two Congressional districts of eastern Nebraska, and there are no good analogues for either state or those two districts. Hillary was polled for Kansas, a good analogue for Plains states other than Texas. I saw PPP polls for Montana, Louisiana, and Texas. Show me polls for Arizona, Indiana, and Mississippi and I don't white them out for lack of data. I have Missouri as a likely win for Hillary because she is ahead in Kentucky.
Texas has no good analogue, and my best guess is to describe it as "Kansas grafted onto Florida". Texas east of the I-35 corridor and Greater El Paso is probably analogous to Florida in its voting; Texas west of the I-35 corridor except for the Rio Grande Valley is much like Kansas. The quadrilateral formed by Dallas/Fort Worth at the north, Houston in the southeast, Laredo in the southwest and Brownsville in the south would be a swing state in most Presidential and Senatorial elections if it were a state. Kansas? We all know about Kansas. A Democratic nominee for President would have to win Florida by about 8% to break even in Texas.
If Hillary Clinton would defeat Marco Rubio and Jeb Bush in Florida, she would do just the same in Texas where those two are not well known.
If Hillary Clinton can win Texas, she would achieve what her husband came close to doing twice but never quite did. Graft the (Bill) Clinton-but-not-Obama voters onto the Obama voters, and a Democratic nominee for President (1) gets about 57% of the popular vote, (2) wins 40 or so states, one of which is Texas, and (3) shows that the political reality of the South has changed dramatically.
re: Indiana
Indiana usually says something; it is about 10% more R than the rest of America in almost every Presidential election. Barack Obama campaigned heavily in Indiana and sank vast resources into the state to win it in 2008 and did not do so in 2012. He lost it by 10% in 2012 -- which should be a huge disappointment. Right?
Year margin
2012 10R
2008 1D
2004 21R
2000 16R
1996 6R*
1992 6R*
1988 20R
1984 24R
1980 18R*
1976 8R
1972 33R
1968 12R*
1964 12D[/b]
1960 10R
1956 20R
1952 17R
1948 1R
1944 7R
1940 1R
*Independent or third-party nominee may have had an effect. Bold is for the Democratic nominee winning the state. Bold indicates that the Democratic nominee won the state. Dark shades indicate electoral blowouts.
Wrong. Barack Obama campaigned extensively in Indiana in 2008 and won it -- and was effective enough in winning a raft of states that neither Gore nor Kerry won. He stayed out of Indiana in 2012 and lost it because he needed a laser focus on a small number of states that could decide the election. If he was going to win Indiana he was going to win Ohio anyway, but Ohio was easier for him to win against an opponent who could overpower him with campaign funds.
Indiana has gone for the Republican nominee for President in 18 of the last 20 chances. This goes back to two elections involving FDR. Democratic nominees have won the popular vote 9 times and the Presidency 8 times -- and Republican nominees have won the popular vote 11 times and the Presidency 12 times.
The Republicans seem unable to win the Presidency if the Democrat loses the state by less than 11%. If Indiana votes by more than 11% for the Republican, then the Republican wins at the least the Electoral College (which is everything).
If you see the Republican nominee winning Indiana early in 2016 on Election Day but by a comparatively-small margin (let us say 7%), then it will be a bad night for the GOP.
Title: Re: 2016 Official Polling Map Thread
Post by: Mr. Morden on April 01, 2013, 09:35:36 PM
Their FL poll suggests that Paul might even be 1st in their national primary poll.
I say:
1) Paul
2) Rubio
3) Christie
4) Ryan
5) Bush
I say:
1) Paul
2) Rubio
3) Christie
4) Ryan
5) Bush
Maybe. We don't have a lot to go on. The PA poll was also taken after the filibuster, and Paul was at 17% in that. For the record, PPP's last national poll (pre-filibuster) was:
https://uselectionatlas.org/FORUM/index.php?topic=169083.0
Rubio 22%
Ryan 15%
Bush 13%
Christie 13%
Huckabee 11%
Paul 10%
Jindal 4%
Perry 3%
Martinez 1%
For this one, I could see a close race between Paul and Rubio for first place.
PPP tweets:
https://twitter.com/ppppolls/status/318823239453376513
Quote
Rand Paul's favorability with GOP primary voters nationally: 60%. Chris Christie's: 41%
That actually represents no meaningful change from their February poll, which had Christie at 42% favorable and Paul at 61% favorable among GOP primary voters. Remains to be seen whether the lack of change in Paul's favorability portends a lack of gains in the primary matchup question.
Title: Re: 2016 Official Polling Map Thread
Post by: PPT Spiral on April 01, 2013, 10:54:45 PM
Their FL poll suggests that Paul might even be 1st in their national primary poll.
I say:
1) Paul
2) Rubio
3) Christie
4) Ryan
5) Bush
I say:
1) Paul
2) Rubio
3) Christie
4) Ryan
5) Bush
Maybe. We don't have a lot to go on. The PA poll was also taken after the filibuster, and Paul was at 17% in that. For the record, PPP's last national poll (pre-filibuster) was:
https://uselectionatlas.org/FORUM/index.php?topic=169083.0
Rubio 22%
Ryan 15%
Bush 13%
Christie 13%
Huckabee 11%
Paul 10%
Jindal 4%
Perry 3%
Martinez 1%
For this one, I could see a close race between Paul and Rubio for first place.
PPP tweets:
https://twitter.com/ppppolls/status/318823239453376513
Quote
Rand Paul's favorability with GOP primary voters nationally: 60%. Chris Christie's: 41%
That actually represents no meaningful change from their February poll, which had Christie at 42% favorable and Paul at 61% favorable among GOP primary voters. Remains to be seen whether the lack of change in Paul's favorability portends a lack of gains in the primary matchup question.
Title: Re: 2016 Official Polling Map Thread
Post by: Mr. Morden on April 06, 2013, 07:42:45 PM
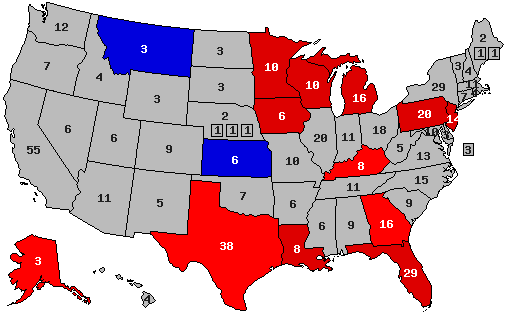
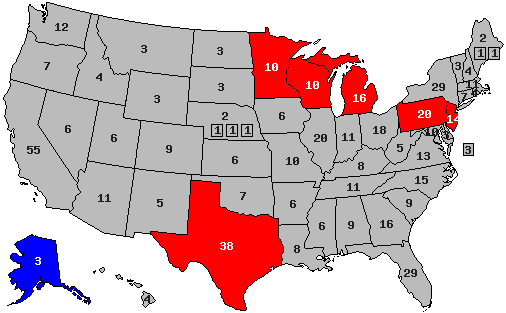
Update on my trend map. Here are the latest PPP polls:
Pennsylvania, Mar. 8-10: Clinton +15
Florida: Mar. 15-18: Clinton +16
national: Mar. 27-30: Clinton +7
That 7 point margin for Clinton just doesn't mesh with the statewide polls. You can't have every state trending for the Dems. That doesn't make any sense. I'll stick with my Clinton by 14 points over Rubio estimate, which seems closer to reality, if we take into account the statewide polls. In that case, the trends (for state polls conducted by PPP since Jan. 1) relative to 2012 would be:
Minnesota: R+5
Texas: D+6
Alaska: D+5
Louisiana: D+10
Montana: R+5
Georgia: D+1
Kansas: D+7
Wisconsin: R+3
Michigan: R+6
Pennsylvania: no trend
Florida: D+5
( )
)
Pennsylvania, Mar. 8-10: Clinton +15
Florida: Mar. 15-18: Clinton +16
national: Mar. 27-30: Clinton +7
That 7 point margin for Clinton just doesn't mesh with the statewide polls. You can't have every state trending for the Dems. That doesn't make any sense. I'll stick with my Clinton by 14 points over Rubio estimate, which seems closer to reality, if we take into account the statewide polls. In that case, the trends (for state polls conducted by PPP since Jan. 1) relative to 2012 would be:
Minnesota: R+5
Texas: D+6
Alaska: D+5
Louisiana: D+10
Montana: R+5
Georgia: D+1
Kansas: D+7
Wisconsin: R+3
Michigan: R+6
Pennsylvania: no trend
Florida: D+5
(
Title: Re: 2016 Official Polling Map Thread
Post by: Mr. Morden on April 15, 2013, 09:04:32 AM
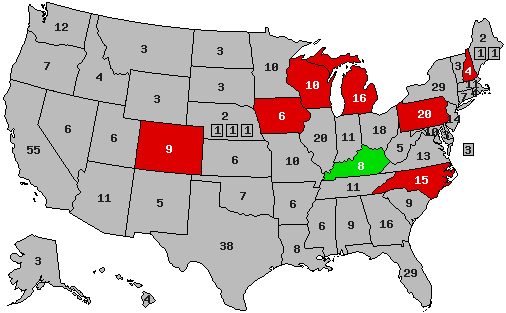
So we now have a new Clinton-Rubio PPP poll of KY:
Kentucky, Apr. 5-7: Clinton +6
Which more or less confirms their poll from 2012, and suggests a massive swing towards the Dems from 2012. Much bigger than we've seen for any other state. Again, assuming a national margin of Clinton by 14 points over Rubio, current trend map would be:
Minnesota: R+5
Texas: D+6
Alaska: D+5
Louisiana: D+10
Montana: R+5
Georgia: D+1
Kansas: D+7
Wisconsin: R+3
Michigan: R+6
Pennsylvania: no trend
Florida: D+5
Kentucky: D+19
( )
)
Kentucky, Apr. 5-7: Clinton +6
Which more or less confirms their poll from 2012, and suggests a massive swing towards the Dems from 2012. Much bigger than we've seen for any other state. Again, assuming a national margin of Clinton by 14 points over Rubio, current trend map would be:
Minnesota: R+5
Texas: D+6
Alaska: D+5
Louisiana: D+10
Montana: R+5
Georgia: D+1
Kansas: D+7
Wisconsin: R+3
Michigan: R+6
Pennsylvania: no trend
Florida: D+5
Kentucky: D+19
(
Title: Re: 2016 Official Polling Map Thread
Post by: Tender Branson on April 22, 2013, 01:51:48 PM
NC is wrong. Hillary is ahead.
Title: Re: 2016 Official Polling Map Thread
Post by: pbrower2a on April 22, 2013, 09:22:34 PM
NC is wrong. Hillary is ahead.
Correction made here:
H. Clinton v. Christie
(
Clinton vs. Rubio
(
If Republicans think Barack Obama troublesome, then wait until they see Hillary Clinton.
Title: Re: 2016 Official Polling Map Thread
Post by: pbrower2a on April 23, 2013, 06:48:21 PM
Colorado checks in:
Q5 If the candidates for President in 2016 were
Democrat Hillary Clinton and Republican
Marco Rubio, who would you vote for?
48% Hillary Clinton
..................................................
44% Marco Rubio
...................................................
8% Not sure
( )
)
Clinton vs. Rubio
( )
)
If Republicans think Barack Obama troublesome, then wait until they see Hillary Clinton.
Q5 If the candidates for President in 2016 were
Democrat Hillary Clinton and Republican
Marco Rubio, who would you vote for?
48% Hillary Clinton
..................................................
44% Marco Rubio
...................................................
8% Not sure
(
Clinton vs. Rubio
(
If Republicans think Barack Obama troublesome, then wait until they see Hillary Clinton.
Title: Re: 2016 Official Polling Map Thread
Post by: Mr. Morden on April 27, 2013, 08:28:55 AM
Updating the trend map. We now have:
Colorado, April 11-14: Clinton +3
North Carolina, April 11-14: Clinton +7
New Hampshire, April 19-21: Clinton +14
Again, assuming national Clinton margin of 14 points, trend map would now be:
Minnesota: R+5
Texas: D+6
Alaska: D+5
Louisiana: D+10
Montana: R+5
Georgia: D+1
Kansas: D+7
Wisconsin: R+3
Michigan: R+6
Pennsylvania: no trend
Florida: D+5
Kentucky: D+19
Colorado: R+13
North Carolina: R+1
New Hampshire: R+2
( )
)
Colorado, April 11-14: Clinton +3
North Carolina, April 11-14: Clinton +7
New Hampshire, April 19-21: Clinton +14
Again, assuming national Clinton margin of 14 points, trend map would now be:
Minnesota: R+5
Texas: D+6
Alaska: D+5
Louisiana: D+10
Montana: R+5
Georgia: D+1
Kansas: D+7
Wisconsin: R+3
Michigan: R+6
Pennsylvania: no trend
Florida: D+5
Kentucky: D+19
Colorado: R+13
North Carolina: R+1
New Hampshire: R+2
(
Title: Re: 2016 Official Polling Map Thread
Post by: pbrower2a on April 29, 2013, 01:43:59 PM
Clinton vs. Rubio
( )
)
Clinton vs. Ryan
( )
)
Clinton vs. Christie
()
(
Clinton vs. Ryan
(
Clinton vs. Christie
(
CO, NH, NC added.
Title: Re: 2016 Official Polling Map Thread
Post by: Oak Hills on May 12, 2013, 11:13:54 AM
If Republicans think Barack Obama troublesome, then wait until they see Hillary Clinton.
Why do you keep ending your posts with exactly the same phrase?
Title: Re: 2016 Official Polling Map Thread
Post by: H.E. VOLODYMYR ZELENKSYY on May 12, 2013, 11:19:28 AM
If Republicans think Barack Obama troublesome, then wait until they see Hillary Clinton.
Why do you keep ending your posts with exactly the same phrase?
Probably copy-pasted.
Title: Re: 2016 Official Polling Map Thread
Post by: pbrower2a on May 16, 2013, 09:57:02 PM
Virginia, Quinnipiac. Clinton overpowers Rubio and Ryan -- nothing on Christie.
Wisconsin, Marquette University Law School.
https://law.marquette.edu/poll/wp-content/uploads/2013/05/MLSP16Toplines.pdf
Clinton 49%
Ryan 44%
Clinton 47%
Christie 40%
Clinton 50%
Walker 42%
Clinton 51%
Rubio 35%
Clinton vs. Rubio
( )
)
Clinton vs. Ryan
( )
)
Clinton vs. Christie
( )
)
Wisconsin, Marquette University Law School.
https://law.marquette.edu/poll/wp-content/uploads/2013/05/MLSP16Toplines.pdf
Clinton 49%
Ryan 44%
Clinton 47%
Christie 40%
Clinton 50%
Walker 42%
Clinton 51%
Rubio 35%
Clinton vs. Rubio
(
Clinton vs. Ryan
(
Clinton vs. Christie
(
Title: Re: 2016 Official Polling Map Thread
Post by: pbrower2a on June 10, 2013, 12:21:36 PM
Quote
If Hillary Clinton's the Democratic candidate for President at least for now it looks like the state will remain firmly in the blue column. The only Republican who even comes within single digits of her is Christie, who still trails 44-38. The other 3 trail by margins closer to Barack Obama's 16 point margin of victory in 2008 than his 9 point victory from last fall- Clinton is up 14 on Bush at 51/37, 17 on Rubio at 53/36, and 20 on Paul at 55/35.
http://www.publicpolicypolling.com/main/2013/06/michigan-miscellany.html
Clinton vs. Rubio
(
Clinton vs. Ryan
(
Clinton vs. Christie
(
Title: Re: 2016 Official Polling Map Thread
Post by: JerryArkansas on June 12, 2013, 02:54:11 AM
I think that you should add Paul to this map, and here is what the map looks like right now with him and Hillary.
( )
)
(
Title: Re: 2016 Official Polling Map Thread
Post by: pbrower2a on June 12, 2013, 11:35:54 AM
Clinton vs. Rubio
()
Clinton vs. Ryan
()
Clinton vs. Christie
( )
)
Good idea, as there are enough data points to satisfy me.
(
Clinton vs. Ryan
(
Clinton vs. Christie
(
I think that you should add Paul to this map, and here is what the map looks like right now with him and Hillary.
()
(
Good idea, as there are enough data points to satisfy me.
Title: Re: 2016 Official Polling Map Thread
Post by: pbrower2a on June 12, 2013, 11:43:04 AM
Now in alphabetical order:
Clinton vs. Christie
()
Clinton vs. Paul
( )
)
Clinton vs. Rubio
()
Clinton vs. Ryan
( )
)
White indicates a tie.
Clinton vs. Christie
(
Clinton vs. Paul
(
Clinton vs. Rubio
(
Clinton vs. Ryan
(
White indicates a tie.
Title: Re: 2016 Official Polling Map Thread
Post by: Mr. Morden on June 12, 2013, 08:48:03 PM
Updated Clinton-Rubio trend map from PPP polls...
Virginia, May 24-26: Clinton +4
Michigan, May 30-June 2: Clinton +17
Assuming national Clinton margin of 13 points, trend map would now be:
Minnesota: R+4
Texas: D+7
Alaska: D+6
Louisiana: D+11
Montana: R+4
Georgia: D+2
Kansas: D+8
Wisconsin: R+2
Pennsylvania: D+1
Florida: D+6
Kentucky: D+20
Colorado: R+12
North Carolina: no trend
New Hampshire: R+1
Virginia: R+9
Michigan: R+2
( )
)
Virginia, May 24-26: Clinton +4
Michigan, May 30-June 2: Clinton +17
Assuming national Clinton margin of 13 points, trend map would now be:
Minnesota: R+4
Texas: D+7
Alaska: D+6
Louisiana: D+11
Montana: R+4
Georgia: D+2
Kansas: D+8
Wisconsin: R+2
Pennsylvania: D+1
Florida: D+6
Kentucky: D+20
Colorado: R+12
North Carolina: no trend
New Hampshire: R+1
Virginia: R+9
Michigan: R+2
(
Title: Re: 2016 Official Polling Map Thread
Post by: pbrower2a on June 13, 2013, 05:06:53 PM
We have Hillary against three different potential nominees. I can see some patterns.
Against Christie -- would Hillary really win Texas? She does win one of three imaginable tipping-point states (Pennsylvania) No way does she win Pennsylvania and Texas and still lose. Otherwise we see few states --all of which Hillary wins.
Against Paul -- she makes Kentucky close. It is possible to lose one's home state and win the Presidential election (Al Gore came close). But Kentucky is one state that Republicans absolutely must win to have a chance. He is also losing North Carolina, a state that Democratic nominees have won twice in nearly fifty years. Ugh!
Against Rubio -- she seems to combine just about every state that Obama won in 2008... and that Carter won in 1976. That would stick Rubio with about 50 electoral votes -- and fewer if Arizona goes. That would be like LBJ in 1964 in electoral results. Rubio loses his own state -- Florida -- but that could be the least of his problems.
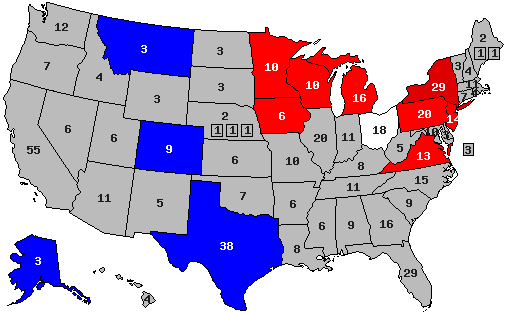
Against Ryan -- she picks off the entire Atlantic seaboard except perhaps South Carolina. Ryan comes to a virtual tie in Louisiana, the most Catholic state in the South except for Florida...
Against Christie -- would Hillary really win Texas? She does win one of three imaginable tipping-point states (Pennsylvania) No way does she win Pennsylvania and Texas and still lose. Otherwise we see few states --all of which Hillary wins.
Against Paul -- she makes Kentucky close. It is possible to lose one's home state and win the Presidential election (Al Gore came close). But Kentucky is one state that Republicans absolutely must win to have a chance. He is also losing North Carolina, a state that Democratic nominees have won twice in nearly fifty years. Ugh!
Against Rubio -- she seems to combine just about every state that Obama won in 2008... and that Carter won in 1976. That would stick Rubio with about 50 electoral votes -- and fewer if Arizona goes. That would be like LBJ in 1964 in electoral results. Rubio loses his own state -- Florida -- but that could be the least of his problems.
Against Ryan -- she picks off the entire Atlantic seaboard except perhaps South Carolina. Ryan comes to a virtual tie in Louisiana, the most Catholic state in the South except for Florida...
Title: Re: 2016 Official Polling Map Thread
Post by: pbrower2a on June 14, 2013, 12:35:21 PM
44-41 Christie/Clinton
46-45 Rubio/Clinton
48-32 Christie/Biden
48-35 Rubio/Biden
Favorables:
49-17 Christie
39-22 Rubio
53-44 Clinton
39-49 Biden
http://www.quinnipiac.edu/institutes-and-centers/polling-institute/colorado/release-detail?ReleaseID=1908
Clinton vs. Christie
( )
)
Clinton vs. Paul
()
Clinton vs. Rubio
( )
)
Clinton vs. Ryan
()
White indicates a tie.
46-45 Rubio/Clinton
48-32 Christie/Biden
48-35 Rubio/Biden
Favorables:
49-17 Christie
39-22 Rubio
53-44 Clinton
39-49 Biden
http://www.quinnipiac.edu/institutes-and-centers/polling-institute/colorado/release-detail?ReleaseID=1908
Clinton vs. Christie
(
Clinton vs. Paul
(
Clinton vs. Rubio
(
Clinton vs. Ryan
(
White indicates a tie.
Title: Re: 2016 Official Polling Map Thread
Post by: pbrower2a on June 17, 2013, 09:19:29 PM
PPP 2016 poll of Michigan:
http://www.publicpolicypolling.com/pdf/2011/PPP_Release_MI_610.pdf
Clinton 51%
Bush 37%
Clinton 44%
Christie 38%
Clinton 55%
Paul 35%
Clinton 53%
Rubio 36%
Clinton vs. Christie
()
Clinton vs. Paul
()
Clinton vs. Rubio
()
Clinton vs. Ryan
()
White indicates a tie.
http://www.publicpolicypolling.com/pdf/2011/PPP_Release_MI_610.pdf
Clinton 51%
Bush 37%
Clinton 44%
Christie 38%
Clinton 55%
Paul 35%
Clinton 53%
Rubio 36%
Clinton vs. Christie
(
Clinton vs. Paul
(
Clinton vs. Rubio
(
Clinton vs. Ryan
(
White indicates a tie.
Title: Re: 2016 Official Polling Map Thread
Post by: Knives on June 18, 2013, 01:33:30 AM
I don't understand people from Colorado...
Title: Re: 2016 Official Polling Map Thread
Post by: Tender Branson on June 19, 2013, 06:32:35 AM
I don't understand people from Colorado...
No wonder with all the Mexicans there and their Spanish ...
Title: Re: 2016 Official Polling Map Thread
Post by: pbrower2a on June 19, 2013, 11:47:50 AM
I don't understand people from Colorado...
No wonder with all the Mexicans there and their Spanish ...
Possible explanation. If Quinnipiac can allow polling in Spanish, then its results could easily align with the sorts of results that PPP comes up with. But it does poll Florida, which has a large Spanish-speaking population.
Any poll that undercounts Spanish-speaking people will be R-friendly in Colorado. But Colorado gets polled often, and even at that Q can adjust its methodology to allow people to respond to questions in Spanish.
Title: Re: 2016 Official Polling Map Thread
Post by: pbrower2a on June 19, 2013, 12:00:04 PM
Florida, Quinnipiac
Clinton 53%
Rubio 41%
Clinton 50%
(Jeb) Bush 43%
(Biden fares badly; nothing on Christie, Paul, or Ryan). If Hillary Clinton decisively defeats Favorite Son Republicans in Florida, she probably beats any other Republican nominee in Florida.
http://www.quinnipiac.edu/institutes-and-centers/polling-institute/florida/release-detail?ReleaseID=1910
Clinton vs. Christie
()
Clinton vs. Paul
()
Clinton vs. Rubio
()
Clinton vs. Ryan
()
White indicates a tie.
[/quote]
Clinton 53%
Rubio 41%
Clinton 50%
(Jeb) Bush 43%
(Biden fares badly; nothing on Christie, Paul, or Ryan). If Hillary Clinton decisively defeats Favorite Son Republicans in Florida, she probably beats any other Republican nominee in Florida.
http://www.quinnipiac.edu/institutes-and-centers/polling-institute/florida/release-detail?ReleaseID=1910
Clinton vs. Christie
(
Clinton vs. Paul
(
Clinton vs. Rubio
(
Clinton vs. Ryan
(
White indicates a tie.
[/quote]
Title: Re: 2016 Official Polling Map Thread
Post by: JerryArkansas on June 27, 2013, 04:54:35 PM
OH-Quinnipiac
Christie 42%
Clinton 42%
Clinton 47%
Paul 44%
http://www.quinnipiac.edu/institutes-and-centers/polling-institute/ohio/release-detail?ReleaseID=1914
Clinton vs. Christie
( )
)
Clinton vs. Paul
( )
)
Clinton vs. Rubio
()
Clinton vs. Ryan
()
White indicates a tie.
[/quote]
Christie 42%
Clinton 42%
Clinton 47%
Paul 44%
http://www.quinnipiac.edu/institutes-and-centers/polling-institute/ohio/release-detail?ReleaseID=1914
Clinton vs. Christie
(
Clinton vs. Paul
(
Clinton vs. Rubio
(
Clinton vs. Ryan
(
White indicates a tie.
[/quote]
Title: Re: 2016 Official Polling Map Thread
Post by: pbrower2a on July 03, 2013, 12:16:17 PM
Texas, PPP
http://www.publicpolicypolling.com/pdf/2011/PPP_Release_TX_703.pdf
(Hillary is shown against Christie in this poll and against imaginable Favorite-Son candidates - and not against Paul, Rubio, or Ryan.
Clinton vs. Christie
( )
)
Clinton vs. Paul
()
Clinton vs. Rubio
()
Clinton vs. Ryan
()
White indicates a tie.
Quote
Q14 If the candidates for President in 2016 were
Democrat Hillary Clinton and Republican Chris
Christie, who would you vote for?
38% Hillary Clinton
47% Chris Christie
14% Not sure
Democrat Hillary Clinton and Republican Chris
Christie, who would you vote for?
38% Hillary Clinton
47% Chris Christie
14% Not sure
http://www.publicpolicypolling.com/pdf/2011/PPP_Release_TX_703.pdf
(Hillary is shown against Christie in this poll and against imaginable Favorite-Son candidates - and not against Paul, Rubio, or Ryan.
Clinton vs. Christie
(
Clinton vs. Paul
(
Clinton vs. Rubio
(
Clinton vs. Ryan
(
White indicates a tie.
Title: Re: 2016 Official Polling Map Thread
Post by: barfbag on July 05, 2013, 08:03:10 PM
Am I the only one who thinks it's too early to call the 2016 race for anyone?
Title: Re: 2016 Official Polling Map Thread
Post by: pbrower2a on July 05, 2013, 10:50:47 PM
Am I the only one who thinks it's too early to call the 2016 race for anyone?
No. Everyone knew in the spring of 1988 that George H W Bush was going to lose to Mike Dukakis. Whoops!
At this point I would not call a race between Chris Christie and Hillary Clinton anything but too close to predict. But the maps clearly show that Rand Paul, Marco Rubio, and Paul Ryan are not Presidential material. Hillary Clinton is.
Note the tie between Hillary Clinton and Chris Christie in Ohio. Ohio is about as close to a microcosm of America as any state can be, and has voted with the winner in all but two Presidential elections in the last century. Maybe Quinnipiac has some kinks to iron out in its Colorado and Ohio polls -- but Q did well in 2012.
Title: Re: 2016 Official Polling Map Thread
Post by: barfbag on July 06, 2013, 01:44:36 AM
Am I the only one who thinks it's too early to call the 2016 race for anyone?
No. Everyone knew in the spring of 1988 that George H W Bush was going to lose to Mike Dukakis. Whoops!
At this point I would not call a race between Chris Christie and Hillary Clinton anything but too close to predict. But the maps clearly show that Rand Paul, Marco Rubio, and Paul Ryan are not Presidential material. Hillary Clinton is.
Note the tie between Hillary Clinton and Chris Christie in Ohio. Ohio is about as close to a microcosm of America as any state can be, and has voted with the winner in all but two Presidential elections in the last century. Maybe Quinnipiac has some kinks to iron out in its Colorado and Ohio polls -- but Q did well in 2012.
Q was surprising because they pretty much had a Kerry landslide. Marco Rubio could easily win the presidency but I'm not predicting him or anyone to do so. Chris Christie and Hillary Clinton is a good possibility but Ben-Ghazi could come back when she least expects it. She also has a lot of ties to her "husband" not always in good ways. I think the map is very interesting as it shows a very typical election with all things being equal. The only thing is that things are never equal. Every election and in pretty much every state there are circumstances effecting voters. I agree Paul Ryan will lose early to in the middle of the primaries and so will Rand Paul. If Bob McDonnell was more popular he'd have a chance too. I can't think of a single Democrat who is electable in 2016 besides Hillary Clinton so if she runs she should be the nominee.
Title: Re: 2016 Official Polling Map Thread
Post by: Flake on July 06, 2013, 05:44:54 AM
I think Cory Booker is a qualified nominee for the democrats, the only problem is that he has such a low name recognition outside of the northeast that he couldn't win the primaries.
Title: Re: 2016 Official Polling Map Thread
Post by: barfbag on July 06, 2013, 06:07:08 PM
I think Cory Booker is a qualified nominee for the democrats, the only problem is that he has such a low name recognition outside of the northeast that he couldn't win the primaries.
Name recognition is huge in primaries. By the general election both candidates have 95% name recognition or close to it. It's all speculation right now but fun to think about.
Title: Re: 2016 Official Polling Map Thread
Post by: pbrower2a on July 11, 2013, 04:47:43 PM
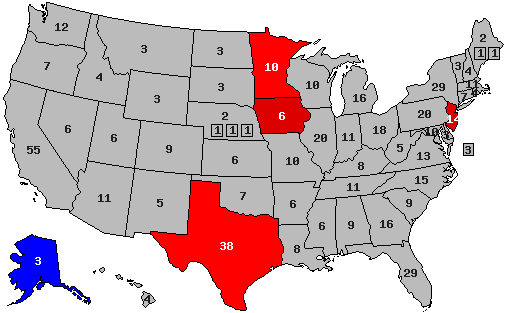
July 5-7, 2013
Survey of 668 Iowa voters
Iowa Survey Results (PPP)
Q1If the candidates for President next time were
Democrat Hillary Clinton and Republican Chris
Christie, who would you vote for?
43% Hillary Clinton
36% Chris Christie
21% Not sure
Q2
If the candidates for President next time were
Democrat Hillary Clinton and Republican Rand
Paul, who would you vote for?
48% Hillary Clinton
37% Rand Paul
14% Not sure
Q4 If the candidates for President next time were
Democrat Hillary Clinton and Republican Paul
Ryan, who would you vote for?
49% Hillary Clinton
40% Paul Ryan
11% Not sure
Q5 If the candidates for President next time were
Democrat Hillary Clinton and Republican
Marco Rubio, who would you vote for?
47% Hillary Clinton
35% Marco Rubio
18% Not sure
http://www.publicpolicypolling.com/pdf/2011/PPP_Release_Iowa_7111.pdf
Clinton vs. Christie
( )
)
Clinton vs. Paul
( )
)
Clinton vs. Rubio
( )
)
Clinton vs. Ryan
( )
)
White indicates a tie.
Survey of 668 Iowa voters
Iowa Survey Results (PPP)
Q1If the candidates for President next time were
Democrat Hillary Clinton and Republican Chris
Christie, who would you vote for?
43% Hillary Clinton
36% Chris Christie
21% Not sure
Q2
If the candidates for President next time were
Democrat Hillary Clinton and Republican Rand
Paul, who would you vote for?
48% Hillary Clinton
37% Rand Paul
14% Not sure
Q4 If the candidates for President next time were
Democrat Hillary Clinton and Republican Paul
Ryan, who would you vote for?
49% Hillary Clinton
40% Paul Ryan
11% Not sure
Q5 If the candidates for President next time were
Democrat Hillary Clinton and Republican
Marco Rubio, who would you vote for?
47% Hillary Clinton
35% Marco Rubio
18% Not sure
http://www.publicpolicypolling.com/pdf/2011/PPP_Release_Iowa_7111.pdf
Clinton vs. Christie
(
Clinton vs. Paul
(
Clinton vs. Rubio
(
Clinton vs. Ryan
(
White indicates a tie.
Title: Re: 2016 Official Polling Map Thread
Post by: Tender Branson on July 17, 2013, 06:33:52 AM
pbrower, if you update the Clinton vs. Christie map with VA, then include the MT, NY and NH polls as well:
Christie+5 over Hillary in MT
http://en.wikipedia.org/wiki/Statewide_opinion_polling_for_the_United_States_presidential_election,_2016#Montana
Hillary+5 over Christie in NH
http://en.wikipedia.org/wiki/Statewide_opinion_polling_for_the_United_States_presidential_election,_2016#New_Hampshire
Hillary+27 over Christie in NY
http://en.wikipedia.org/wiki/Statewide_opinion_polling_for_the_United_States_presidential_election,_2016#New_York
Title: Re: 2016 Official Polling Map Thread
Post by: pbrower2a on July 17, 2013, 08:07:20 AM
pbrower, if you update the Clinton vs. Christie map with VA, then include the MT, NY and NH polls as well:
Christie+5 over Hillary in MT
http://en.wikipedia.org/wiki/Statewide_opinion_polling_for_the_United_States_presidential_election,_2016#Montana
Hillary+5 over Christie in NH
http://en.wikipedia.org/wiki/Statewide_opinion_polling_for_the_United_States_presidential_election,_2016#New_Hampshire
Hillary+27 over Christie in NY
http://en.wikipedia.org/wiki/Statewide_opinion_polling_for_the_United_States_presidential_election,_2016#New_York
I had a good reason for not showing the NH poll -- namely that both potential candidates had less than 40% of the likely vote. The undecided are obviously so large in number with a 37-32 split that I chose not to include it. Otherwise, OK for Montana and New York.
Now, for Virginia --
Clinton 45-40 over Christie
Clinton 51-37 over Paul
Nothing on Clinton vs. Rubio or Clinton vs. Ryan from Quinnipiac this time, although there are some earlier polls (whether by PPP or Quinnipiac).
http://www.quinnipiac.edu/institutes-and-centers/polling-institute/virginia/release-detail?ReleaseID=1923
Clinton vs. Christie
( )
)
Clinton vs. Paul
( )
)
Clinton vs. Rubio
()
Clinton vs. Ryan
()
White indicates a tie.
Christie+5 over Hillary in MT
http://en.wikipedia.org/wiki/Statewide_opinion_polling_for_the_United_States_presidential_election,_2016#Montana
Hillary+5 over Christie in NH
http://en.wikipedia.org/wiki/Statewide_opinion_polling_for_the_United_States_presidential_election,_2016#New_Hampshire
Hillary+27 over Christie in NY
http://en.wikipedia.org/wiki/Statewide_opinion_polling_for_the_United_States_presidential_election,_2016#New_York
I had a good reason for not showing the NH poll -- namely that both potential candidates had less than 40% of the likely vote. The undecided are obviously so large in number with a 37-32 split that I chose not to include it. Otherwise, OK for Montana and New York.
Now, for Virginia --
Clinton 45-40 over Christie
Clinton 51-37 over Paul
Nothing on Clinton vs. Rubio or Clinton vs. Ryan from Quinnipiac this time, although there are some earlier polls (whether by PPP or Quinnipiac).
http://www.quinnipiac.edu/institutes-and-centers/polling-institute/virginia/release-detail?ReleaseID=1923
Clinton vs. Christie
(
Clinton vs. Paul
(
Clinton vs. Rubio
(
Clinton vs. Ryan
(
White indicates a tie.
Title: Re: 2016 Official Polling Map Thread
Post by: eric82oslo on July 19, 2013, 12:14:15 PM
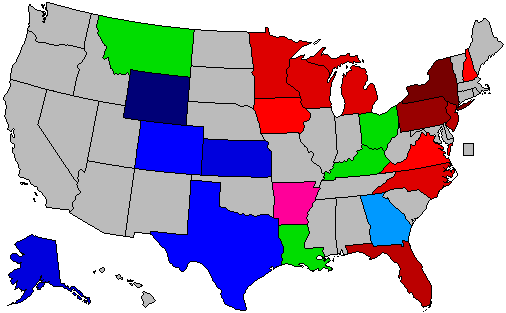
Here are all the 2016 poll averages for each state so far - 22 states having been polled to date - and how far off they are compared to the actual 2012 outcomes. I'm only including the Republican candidate with the best statewide polling.
Alaska: Hillary vs Jeb Bush: R +7%
+7% D improvement
(Updated on August 4)
Arkansas: Hillary vs Christie: D +2%
+22% D improvement
(Updated on August 11)
Colorado: Hillary vs Rand Paul: R +3%
+8% R improvement
Florida: Hillary vs Jeb Bush: D +9%
+8% D improvement
Georgia: Hillary vs Christie: R +2%
+6% D improvement
(Updated August 8 )
Iowa: Hillary vs Christie: D +4%
+2% R improvement
(Updated on July 22)
Kansas: Hillary vs Paul Ryan: R +7%
+15% D improvement
Kentucky: Hillary vs Rand Paul: Tie
+23% D improvement
Louisiana: Hillary vs Paul Ryan: Tie
+17% D improvement
Michigan: Hillary vs Christie: D +6%
+3.5% R improvement
Minnesota: Hillary vs Christie: D +6%
+2% R improvement
Montana: Hillary vs Jeb Bush: Tie
+14% D improvement
New Hampshire: Hillary vs Christie: D +4.8%
+0.8% R improvement
New Jersey: Hillary vs Christie: D +9%
+9% R improvement
New York: Hillary vs Christie: D +27%
+1% R improvement
North Carolina: Hillary vs Rubio: D +7%
+9% D improvement
Ohio: Hillary vs Christie: Tie
+3% R improvement
Pennsylvania: Hillary vs Paul Ryan: D +12%
+7% D improvement
Texas: Hillary vs Christie: R +3.5%
+12% D improvement
Virginia: Hillary vs Christie: D +3%
+1% R improvement
(Updated with latest poll)
Wisconsin: Hillary vs Christie: D +6.5%
+0.5% R improvement
Wyoming: Hillary vs Christie: R +28%
+13% D improvement
(Updated July 24)
Average all 22 states: Hillary vs Best Republican: D +2.1%
+5.6% D improvement
Looks like even in the best of cases, if the Grumpy Old Party could tailormake a specific candidate for each state, they still would do quite a lot worse nationally than they did against Obama in 2012. Possibly even worse than they did in the 2008 landslide.
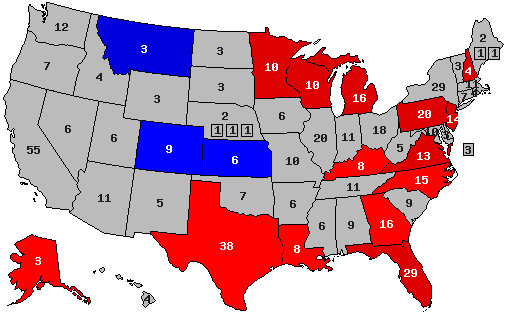
Hillary seems to be gaining the most traction in Rand Paul's home state of Kentucky as well as in Arkansas, while struggling the most in Chris Christie's home state of New Jersey. Overall, Hillary is doing really well in red states - including Texas, the Appalachians and the Deep South - while struggling the most against governor Christie in typically blue states, including Colorado and the Great Lakes district.
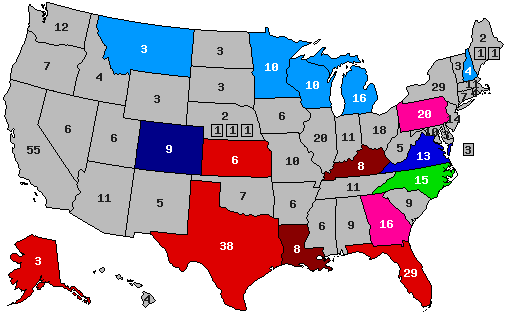
That gives us this map right now:
( )
)
Red = Democratic lead
Blue = Republican lead
Green = Exact tie
Grey = No polling yet
20% shade = 0-1% lead
30% shade = 1-3% lead
40% shade = 3-6% lead
50% shade = 6-9% lead
60% shade = 9-12% lead
70% shade = 12-15% lead
80% shade = 15-18% lead
90% shade = Above 18% lead
In the count of electoral votes, this means the current situation looks like this:
Hillary: 188 EVs
Best/Tailormade Republican: 59 EVs
Toss-up: 37 EVs
No polling: 254 EVs (almost half)
Which means that Hillary has captured 66.2% of all EVs awarded thus far, against lackluster 20.8% EVs for the tailormade Republican. And only New York of the solidly Democratic states has been polled so far, against no less than 9 solidly Republican states - the biggest of them, Texas, included. With California added to Hillary's pie, it'll look even more promising for her. It's looking like a landslide right now, even without Colorado and Ohio being in Hillary's column.
This is how the Trendline Map looks so far:
(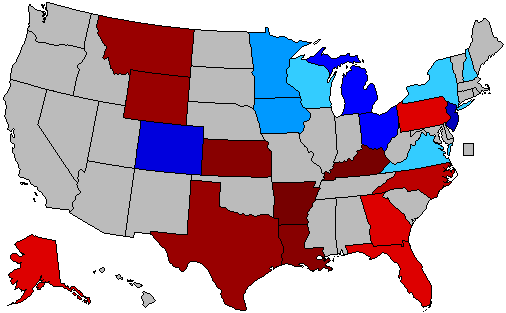 )
)
Looking good all across the south and west except in Colorado. :)
Updated with latest PPP poll of Virginia. Iowa polls updated on July 22. Wyoming poll, national averages and state map updated on July 24. Also updated with latest Alaska poll on August 4. Georgia updated with new poll August 8. Updated with the frist poll from Arkansas.
Alaska: Hillary vs Jeb Bush: R +7%
+7% D improvement
(Updated on August 4)
Arkansas: Hillary vs Christie: D +2%
+22% D improvement
(Updated on August 11)
Colorado: Hillary vs Rand Paul: R +3%
+8% R improvement
Florida: Hillary vs Jeb Bush: D +9%
+8% D improvement
Georgia: Hillary vs Christie: R +2%
+6% D improvement
(Updated August 8 )
Iowa: Hillary vs Christie: D +4%
+2% R improvement
(Updated on July 22)
Kansas: Hillary vs Paul Ryan: R +7%
+15% D improvement
Kentucky: Hillary vs Rand Paul: Tie
+23% D improvement
Louisiana: Hillary vs Paul Ryan: Tie
+17% D improvement
Michigan: Hillary vs Christie: D +6%
+3.5% R improvement
Minnesota: Hillary vs Christie: D +6%
+2% R improvement
Montana: Hillary vs Jeb Bush: Tie
+14% D improvement
New Hampshire: Hillary vs Christie: D +4.8%
+0.8% R improvement
New Jersey: Hillary vs Christie: D +9%
+9% R improvement
New York: Hillary vs Christie: D +27%
+1% R improvement
North Carolina: Hillary vs Rubio: D +7%
+9% D improvement
Ohio: Hillary vs Christie: Tie
+3% R improvement
Pennsylvania: Hillary vs Paul Ryan: D +12%
+7% D improvement
Texas: Hillary vs Christie: R +3.5%
+12% D improvement
Virginia: Hillary vs Christie: D +3%
+1% R improvement
(Updated with latest poll)
Wisconsin: Hillary vs Christie: D +6.5%
+0.5% R improvement
Wyoming: Hillary vs Christie: R +28%
+13% D improvement
(Updated July 24)
Average all 22 states: Hillary vs Best Republican: D +2.1%
+5.6% D improvement
Looks like even in the best of cases, if the Grumpy Old Party could tailormake a specific candidate for each state, they still would do quite a lot worse nationally than they did against Obama in 2012. Possibly even worse than they did in the 2008 landslide.
Hillary seems to be gaining the most traction in Rand Paul's home state of Kentucky as well as in Arkansas, while struggling the most in Chris Christie's home state of New Jersey. Overall, Hillary is doing really well in red states - including Texas, the Appalachians and the Deep South - while struggling the most against governor Christie in typically blue states, including Colorado and the Great Lakes district.
That gives us this map right now:
(
Red = Democratic lead
Blue = Republican lead
Green = Exact tie
Grey = No polling yet
20% shade = 0-1% lead
30% shade = 1-3% lead
40% shade = 3-6% lead
50% shade = 6-9% lead
60% shade = 9-12% lead
70% shade = 12-15% lead
80% shade = 15-18% lead
90% shade = Above 18% lead
In the count of electoral votes, this means the current situation looks like this:
Hillary: 188 EVs
Best/Tailormade Republican: 59 EVs
Toss-up: 37 EVs
No polling: 254 EVs (almost half)
Which means that Hillary has captured 66.2% of all EVs awarded thus far, against lackluster 20.8% EVs for the tailormade Republican. And only New York of the solidly Democratic states has been polled so far, against no less than 9 solidly Republican states - the biggest of them, Texas, included. With California added to Hillary's pie, it'll look even more promising for her. It's looking like a landslide right now, even without Colorado and Ohio being in Hillary's column.
This is how the Trendline Map looks so far:
(
Looking good all across the south and west except in Colorado. :)
Updated with latest PPP poll of Virginia. Iowa polls updated on July 22. Wyoming poll, national averages and state map updated on July 24. Also updated with latest Alaska poll on August 4. Georgia updated with new poll August 8. Updated with the frist poll from Arkansas.
Title: Re: 2016 Official Polling Map Thread
Post by: Oak Hills on July 19, 2013, 02:45:27 PM
The early polling for this next election is so weird.
-We've got Hillary winning or tying most of the time in most red states that have been polled, even ones which haven't voted Democratic for decades, in some cases since Carter or even Johnson, and which Obama lost by 15-20 points.
-We see Hillary doing slightly worse than Obama in blue states, at least in the upper midwest.
-And then we have the bizarre phenomenon of Republicans being tied or in striking distance in Colorado and Ohio.
At this rate, half the country's going to be battleground states! It probably won't hold, but if that happens, it might be entertaining enough to make up for the watching-paint-dry-like Democratic primaries.
Title: Re: 2016 Official Polling Map Thread
Post by: pbrower2a on July 23, 2013, 07:57:57 AM
Iowa, Quinnipiac:
Clinton, Christie split 41-41
Clinton vs. Scott Walker (Republican Governor of neighboring Wisconsin) 46-39...probably a good proxy for Jeb Bush, Rand Paul, Paul Ryan, and Rick Santorum.
http://www.quinnipiac.edu/institutes-and-centers/polling-institute/iowa/release-detail?ReleaseID=1926
Clinton vs. Christie
(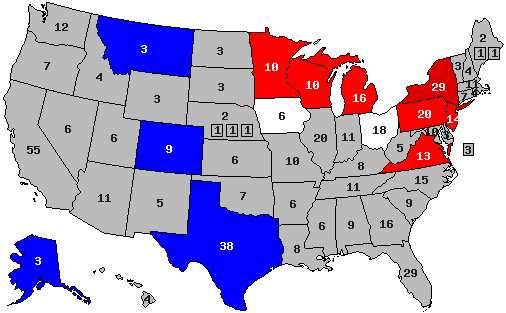 )
)
Clinton vs. Paul
()
Clinton vs. Rubio
()
Clinton vs. Ryan
()
White indicates a tie.
Clinton, Christie split 41-41
Clinton vs. Scott Walker (Republican Governor of neighboring Wisconsin) 46-39...probably a good proxy for Jeb Bush, Rand Paul, Paul Ryan, and Rick Santorum.
http://www.quinnipiac.edu/institutes-and-centers/polling-institute/iowa/release-detail?ReleaseID=1926
Clinton vs. Christie
(
Clinton vs. Paul
(
Clinton vs. Rubio
(
Clinton vs. Ryan
(
White indicates a tie.
Title: Re: 2016 Official Polling Map Thread
Post by: Senator Cris on July 23, 2013, 08:42:45 AM
hello pbrower!
I sent you a private message, please read it.
I sent you a private message, please read it.
Title: Re: 2016 Official Polling Map Thread
Post by: pbrower2a on July 23, 2013, 06:54:27 PM
hello pbrower!
I sent you a private message, please read it.
I sent you a private message, please read it.
By all means! Probably a different thread, because too many maps in one post get confusing.
You'd need to do much archive work to do so -- and I don't consider Joe Biden a credible candidate for President. He has had plenty of chances to get the nomination and has never gotten them. The only way in which he becomes a credible candidate for President is if the Unthinkable happens to the President.
I understand that one of the reasons for nominating him for VP was that he was at the bottom in assets in possession among US Senators. He lacks the money and income sources for staging a campaign.
Title: Re: 2016 Official Polling Map Thread
Post by: eric82oslo on July 24, 2013, 07:32:01 PM
Here are the averages for the 9 national polls which have been held since December 2012:
Hillary vs Chris Christie (7 polls): Hillary +5%
Hillary vs Jeb Bush (4 polls): Hillary +9.5%
Hillary vs Rand Paul (6 polls): Hillary +9.8%
Hillary vs Marco Rubio (6 polls): Hillary +10.8%
Hillary vs Paul Ryan (5 polls): Hillary +11.6%
Hillary vs Rick Perry (1 poll): Hillary +16%
Hillary vs Chris Christie (7 polls): Hillary +5%
Hillary vs Jeb Bush (4 polls): Hillary +9.5%
Hillary vs Rand Paul (6 polls): Hillary +9.8%
Hillary vs Marco Rubio (6 polls): Hillary +10.8%
Hillary vs Paul Ryan (5 polls): Hillary +11.6%
Hillary vs Rick Perry (1 poll): Hillary +16%
Title: Re: 2016 Official Polling Map Thread
Post by: Senator Cris on July 25, 2013, 03:46:54 AM
New Wyoming polls from PPP.
Christie + 28 over Hillary (56-28)
Bush + 27 over Hillary (58-31)
Ryan + 27 over Hillary (59-32)
Paul + 26 over Hillary (58-32)
Rubio + 24 over Hillary (56-32)
http://www.publicpolicypolling.com/pdf/2011/PPP_Release_WY_724.pdf
Christie + 28 over Hillary (56-28)
Bush + 27 over Hillary (58-31)
Ryan + 27 over Hillary (59-32)
Paul + 26 over Hillary (58-32)
Rubio + 24 over Hillary (56-32)
http://www.publicpolicypolling.com/pdf/2011/PPP_Release_WY_724.pdf
Title: Re: 2016 Official Polling Map Thread
Post by: pbrower2a on July 25, 2013, 03:53:37 AM
Wyoming, PPP
Five matchups between Hillary Clinton and Republicans, and they are all roughly 32-57. I am showing them at 60% saturation because such is closer to reality than the 52-46 split that might look somewhat close.
Clinton vs. Christie
(
Clinton vs. Paul
(
Clinton vs. Rubio
(
Clinton vs. Ryan
(
White indicates a tie.
Title: Re: 2016 Official Polling Map Thread
Post by: Senator Cris on July 25, 2013, 04:13:55 AM
Clinton 112
Christie 62
Tie 24
No polls 340
Clinton 111
Paul 3
Tie 8
No polls 416
Clinton 210
Rubio 21
Tie 0
No polls 307
Clinton 105
Ryan 12
Tie 8
No polls 413
Christie 62
Tie 24
No polls 340
Clinton 111
Paul 3
Tie 8
No polls 416
Clinton 210
Rubio 21
Tie 0
No polls 307
Clinton 105
Ryan 12
Tie 8
No polls 413
Title: Re: 2016 Official Polling Map Thread
Post by: eric82oslo on July 25, 2013, 11:02:15 AM
^^ Christie winning in Texas makes all the difference. :P
Title: Re: 2016 Official Polling Map Thread
Post by: pbrower2a on July 26, 2013, 12:24:47 PM
^^ Christie winning in Texas makes all the difference. :P
Texas has essentially a single-party system for statewide politics. The Democratic Party is basically crushed in statewide politics and is basically irrelevant. The giant cities are a different matter in local politics.
Title: Re: 2016 Official Polling Map Thread
Post by: eric82oslo on July 26, 2013, 12:31:54 PM
^^ Christie winning in Texas makes all the difference. :P
Texas has essentially a single-party system for statewide politics. The Democratic Party is basically crushed in statewide politics and is basically irrelevant. The giant cities are a different matter in local politics.
If you look at the polls, that doesn't seem to be the case for 2016 though. Chris Christie is the only one to beat Hillary in Texas at this moment, and even him just barely. Plus, I wouldn't be surprised if the polling firms only interviewed 18+ individuals. Which would mean that they would miss out on all the potential 15-18 year old future voters. Plus a few of those they interviewed will not be alive 3 years from now. If only 59% of Texas voters were white in 2012 with an extremely low Hispanic turnout, imagine how the Texas electorate will look like in 2016 with a record level of Hispanic turnout due to highly energized latinos in the state.
Title: Re: 2016 Official Polling Map Thread
Post by: TarHeelDem on July 27, 2013, 07:32:30 PM
Here are all the 2016 poll averages for each state so far - 21 states having been polled to date - and how far off they are compared to the actual 2012 outcomes. I'm only including the Republican candidate with the best statewide polling.
North Carolina: Hillary vs Rubio: D +7%
+9% D improvement
North Carolina: Hillary vs Rubio: D +7%
+9% D improvement
Rubio has the best NC polling? Color me surprised.
Title: Re: 2016 Official Polling Map Thread
Post by: eric82oslo on July 27, 2013, 10:31:23 PM
Here are all the 2016 poll averages for each state so far - 21 states having been polled to date - and how far off they are compared to the actual 2012 outcomes. I'm only including the Republican candidate with the best statewide polling.
North Carolina: Hillary vs Rubio: D +7%
+9% D improvement
North Carolina: Hillary vs Rubio: D +7%
+9% D improvement
Rubio has the best NC polling? Color me surprised.
Yeah, although only two candidates have been tried out against Hillary in your state, Rubio and Rand Paul. I'm sure Chris Christie would do better in NC as well, don't you think?
Here's the source: http://en.wikipedia.org/wiki/Statewide_opinion_polling_for_the_United_States_presidential_election,_2016#North_Carolina
Title: Re: 2016 Official Polling Map Thread
Post by: TarHeelDem on July 27, 2013, 11:31:44 PM
Here are all the 2016 poll averages for each state so far - 21 states having been polled to date - and how far off they are compared to the actual 2012 outcomes. I'm only including the Republican candidate with the best statewide polling.
North Carolina: Hillary vs Rubio: D +7%
+9% D improvement
North Carolina: Hillary vs Rubio: D +7%
+9% D improvement
Rubio has the best NC polling? Color me surprised.
Yeah, although only two candidates have been tried out against Hillary in your state, Rubio and Rand Paul. I'm sure Chris Christie would do better in NC as well, don't you think?
Here's the source: http://en.wikipedia.org/wiki/Statewide_opinion_polling_for_the_United_States_presidential_election,_2016#North_Carolina
I think NC would be just as receptive to Christie as it was to Romney, if not more. Even so, I do think Hillary could beat Christie here (in other words, she would do better than Obama in 2012, perhaps somewhere around Obama in 2008). I'm very interested to see the polling when it's released.
Title: Re: 2016 Official Polling Map Thread
Post by: pbrower2a on August 04, 2013, 08:36:41 AM
Alaska, PPP. Hillary Clinton would beat Sarah Palin (not shown), but lose by margins less than 8% against everyone else.
http://www.publicpolicypolling.com/pdf/2011/PPP_Release_AK_802.pdf
Clinton vs. Christie
(
Clinton vs. Paul
(
Clinton vs. Rubio
(
Clinton vs. Ryan
(
White indicates a tie.
Title: Re: 2016 Official Polling Map Thread
Post by: pbrower2a on August 08, 2013, 05:21:17 PM
-PPP's newest Georgia poll finds that Hillary Clinton would have a decent shot at winning the state if there was an election today. She leads Rand Paul, who's led our most recent national GOP polling, 48/43. She also has a 47/44 advantage on Paul Ryan, a 47/43 one on Newt Gingrich, and a 51/38 one over Sarah Palin. She ties Jeb Bush at 45, and the only Republican with an advantage over her is Chris Christie at 44/42. She could make Georgia a swing state in 2016.
http://www.publicpolicypolling.com/main/2013/08/georgia-miscellany.html
.....
Georgia has been about R+7 in 2008 and R+11 in 2012; if it is at all close for the Republican then the Democrat is going to win 375 or so electoral votes and about 54% of the popular vote. A Democrat who wins Georgia is probably winning 56% of the popular vote and at least 400 electoral votes.
I notice that PPP isn't paying attention to Rubio anymore, but it is paying attention to Jeb Bush.
Clinton vs. Christie
(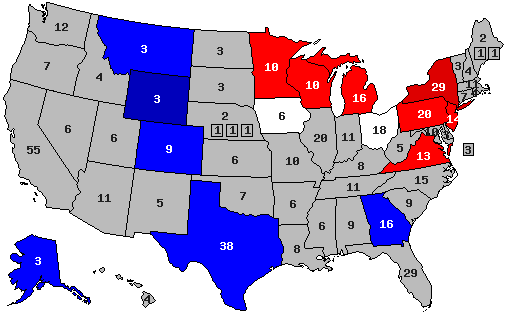 )
)
Clinton vs. Paul
(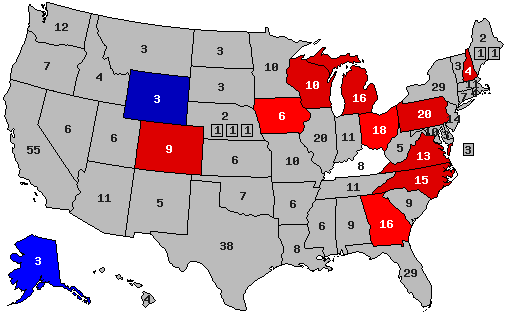 )
)
Clinton vs. Rubio
( )
)
Clinton vs. Ryan
(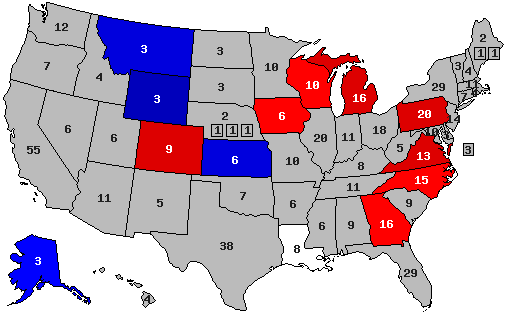 )
)
White indicates a tie.
http://www.publicpolicypolling.com/main/2013/08/georgia-miscellany.html
.....
Georgia has been about R+7 in 2008 and R+11 in 2012; if it is at all close for the Republican then the Democrat is going to win 375 or so electoral votes and about 54% of the popular vote. A Democrat who wins Georgia is probably winning 56% of the popular vote and at least 400 electoral votes.
I notice that PPP isn't paying attention to Rubio anymore, but it is paying attention to Jeb Bush.
Clinton vs. Christie
(
Clinton vs. Paul
(
Clinton vs. Rubio
(
Clinton vs. Ryan
(
White indicates a tie.
Title: Re: 2016 Official Polling Map Thread
Post by: Mr. Morden on August 09, 2013, 01:47:33 AM
Taking all the state polls on Christie vs. Clinton so far (most recent poll from states with more than one poll), we have:
AK: Christie +8
CO: Christie +3
GA: Christie +2
IA: tie
MI: Clinton +6
MN: Clinton +6
MT: Christie +5
NH: Clinton +5
NJ: Clinton +11
NY: Clinton +27
OH: tie
TX: Christie +9
VA: Clinton +5
WI: Clinton +7
WY: Christie +28
The swing from the 2012 election would then be:
AK: D+6
CO: R+8
GA: D+6
IA: R+6
MI: R+3
MN: R+1
MT: D+9
NH: R+1
NJ: R+7
NY: R+1
OH: R+3
TX: D+7
VA: D+1
WI: no change
WY: D+13
(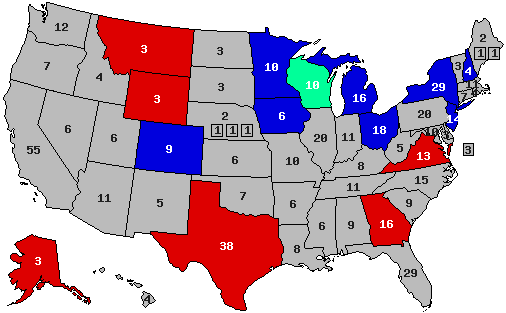 )
)
So yeah, the Democratic states swing Republican, and the Republican states swing Democratic. Thus creating a map with many more states that are close. 2012 actually had remarkably few states that were close, given that the election itself was fairly close.
AK: Christie +8
CO: Christie +3
GA: Christie +2
IA: tie
MI: Clinton +6
MN: Clinton +6
MT: Christie +5
NH: Clinton +5
NJ: Clinton +11
NY: Clinton +27
OH: tie
TX: Christie +9
VA: Clinton +5
WI: Clinton +7
WY: Christie +28
The swing from the 2012 election would then be:
AK: D+6
CO: R+8
GA: D+6
IA: R+6
MI: R+3
MN: R+1
MT: D+9
NH: R+1
NJ: R+7
NY: R+1
OH: R+3
TX: D+7
VA: D+1
WI: no change
WY: D+13
(
So yeah, the Democratic states swing Republican, and the Republican states swing Democratic. Thus creating a map with many more states that are close. 2012 actually had remarkably few states that were close, given that the election itself was fairly close.
Title: Re: 2016 Official Polling Map Thread
Post by: pbrower2a on August 11, 2013, 08:30:30 AM
Apparently the 'right' Democrat can win in Arkansas. Its incumbent Democratic Senator has a slight edge in a bid for re-election in 2014.
It certainly was not Barack Obama:
although that is better than the voting result of 2012 (61-37 Romney over Obama).
In 2008 Hillary Clinton projected to defeat John McCain, so it may not be Arkansas that has changed politically since 2008. Barack Obama is a horrible match for Arkansas, and if he is no longer relevant to Arkansas in 2016 then Hillary Clinton could win.
Of course this pollster is new to me, so expect either confirmation or repudiation by someone else. Only two potential matchups are shown.
http://freebeacon.com/tom-cotton-in-dead-heat-with-mark-pryor-for-arkansas-senate/
Clinton vs. Christie
(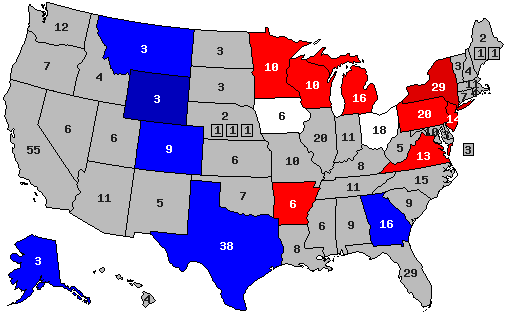 )
)
Clinton vs. Paul
(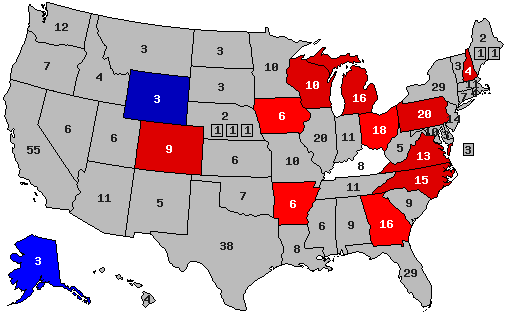 )
)
Clinton vs. Rubio
(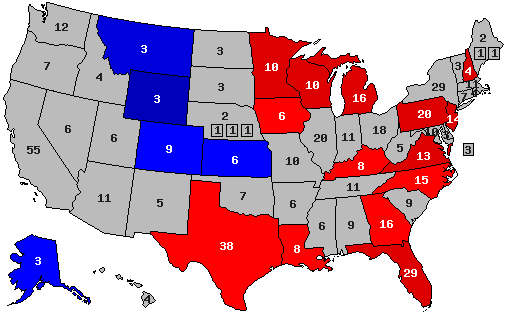 )
)
Clinton vs. Ryan
()
White indicates a tie.
[/quote]
It certainly was not Barack Obama:
Quote
There are also signs the atmosphere in Arkansas has grown less hospitable to Democrats as President Barack Obamas popularity has nose dived in the state. Just 42 percent of respondents approve of Obamas job performance, while 57 percent disapprove.
although that is better than the voting result of 2012 (61-37 Romney over Obama).
Quote
While Clinton crushes her Democratic competition, her advantage narrows significantly when she is placed head-to-head with potential Republican challengers. A Clinton vs. Paul matchup shows the former secretary of state leading 48 percent to 45 percent, within the polls margin-of-error. In a face-off between Clinton and Christie, Clinton leads 44 percent to 42.
In 2008 Hillary Clinton projected to defeat John McCain, so it may not be Arkansas that has changed politically since 2008. Barack Obama is a horrible match for Arkansas, and if he is no longer relevant to Arkansas in 2016 then Hillary Clinton could win.
Of course this pollster is new to me, so expect either confirmation or repudiation by someone else. Only two potential matchups are shown.
http://freebeacon.com/tom-cotton-in-dead-heat-with-mark-pryor-for-arkansas-senate/
Clinton vs. Christie
(
Clinton vs. Paul
(
Clinton vs. Rubio
(
Clinton vs. Ryan
(
White indicates a tie.
[/quote]
Title: Re: 2016 Official Polling Map Thread
Post by: pbrower2a on August 11, 2013, 08:48:38 AM
Apparently the 'right' Democrat can win in Arkansas. Its incumbent Democratic Senator has a slight edge in a bid for re-election in 2014.
It certainly was not Barack Obama:
Quote
There are also signs the atmosphere in Arkansas has grown less hospitable to Democrats as President Barack Obamas popularity has nose dived in the state. Just 42 percent of respondents approve of Obamas job performance, while 57 percent disapprove.
although that is better than the voting result of 2012 (61-37 Romney over Obama -- which is about what Reagan did to Mondale in 1984).
Quote
While Clinton crushes her Democratic competition, her advantage narrows significantly when she is placed head-to-head with potential Republican challengers. A Clinton vs. Paul matchup shows the former secretary of state leading 48 percent to 45 percent, within the polls margin-of-error. In a face-off between Clinton and Christie, Clinton leads 44 percent to 42.
In 2008 Hillary Clinton projected to defeat John McCain, so it may not be Arkansas that has changed politically since 2008. Barack Obama is a horrible match for Arkansas, and if he is no longer relevant to Arkansas in 2016 then Hillary Clinton could win.
Of course this pollster is new to me, so expect either confirmation or repudiation by someone else. Only two potential matchups are shown.
http://freebeacon.com/tom-cotton-in-dead-heat-with-mark-pryor-for-arkansas-senate/
Clinton vs. Christie
(
Clinton vs. Paul
(
Clinton vs. Rubio
(
Clinton vs. Ryan
(
White indicates a tie.
Title: Re: 2016 Official Polling Map Thread
Post by: ElectionsGuy on August 21, 2013, 02:11:04 AM
Apparently the 'right' Democrat can win in Arkansas. Its incumbent Democratic Senator has a slight edge in a bid for re-election in 2014.
It certainly was not Barack Obama:
Quote
There are also signs the atmosphere in Arkansas has grown less hospitable to Democrats as President Barack Obamas popularity has nose dived in the state. Just 42 percent of respondents approve of Obamas job performance, while 57 percent disapprove.
although that is better than the voting result of 2012 (61-37 Romney over Obama -- which is about what Reagan did to Mondale in 1984).
Quote
While Clinton crushes her Democratic competition, her advantage narrows significantly when she is placed head-to-head with potential Republican challengers. A Clinton vs. Paul matchup shows the former secretary of state leading 48 percent to 45 percent, within the polls margin-of-error. In a face-off between Clinton and Christie, Clinton leads 44 percent to 42.
In 2008 Hillary Clinton projected to defeat John McCain, so it may not be Arkansas that has changed politically since 2008. Barack Obama is a horrible match for Arkansas, and if he is no longer relevant to Arkansas in 2016 then Hillary Clinton could win.
Of course this pollster is new to me, so expect either confirmation or repudiation by someone else. Only two potential matchups are shown.
http://freebeacon.com/tom-cotton-in-dead-heat-with-mark-pryor-for-arkansas-senate/
Clinton vs. Christie
(
Clinton vs. Paul
(
Clinton vs. Rubio
(
Clinton vs. Ryan
(
White indicates a tie.
This is just laughable, it really is. Clinton winning Texas? Louisiana? Georgia? Arkansas? Kentucky? If this is anywhere near accurate where in for a seismic shift in election politics.
Title: Re: 2016 Official Polling Map Thread
Post by: pbrower2a on August 21, 2013, 03:19:00 PM
Apparently the 'right' Democrat can win in Arkansas. Its incumbent Democratic Senator has a slight edge in a bid for re-election in 2014.
It certainly was not Barack Obama:
Quote
There are also signs the atmosphere in Arkansas has grown less hospitable to Democrats as President Barack Obamas popularity has nose dived in the state. Just 42 percent of respondents approve of Obamas job performance, while 57 percent disapprove.
although that is better than the voting result of 2012 (61-37 Romney over Obama -- which is about what Reagan did to Mondale in 1984).
Quote
While Clinton crushes her Democratic competition, her advantage narrows significantly when she is placed head-to-head with potential Republican challengers. A Clinton vs. Paul matchup shows the former secretary of state leading 48 percent to 45 percent, within the polls margin-of-error. In a face-off between Clinton and Christie, Clinton leads 44 percent to 42.
In 2008 Hillary Clinton projected to defeat John McCain, so it may not be Arkansas that has changed politically since 2008. Barack Obama is a horrible match for Arkansas, and if he is no longer relevant to Arkansas in 2016 then Hillary Clinton could win.
Of course this pollster is new to me, so expect either confirmation or repudiation by someone else. Only two potential matchups are shown.
(maps excised)
This is just laughable, it really is. Clinton winning Texas? Louisiana? Georgia? Arkansas? Kentucky? If this is anywhere near accurate where in for a seismic shift in election politics.
Seismic shift? It could be that Hillary Clinton is winning back the Clinton-but-not-Obama voters while keeping the Obama voters (which include some Obama-but-not-Clinton voters).
It could also be that the Republicans have some dreadful prospects seeming to lead have the lead for the Presidential nomination. If the Republicans have the right-wing version of George McGovern or Walter Mondale, then they can lose badly in 2016.
It could also be that many Americans remain uncomfortable with the concept of a black man as President of the United States.
It's also possible that people in the Mountain and Deep South will begin to recognize Hillary Clinton as a d@mnyankee city-slicker who either never had (like Dukakis, Kerry, or Obama) any Southern roots or lost touch with them as did Al Gore. But at that I am discussing things that have yet to happen.
Title: Re: 2016 Official Polling Map Thread
Post by: pbrower2a on August 21, 2013, 03:28:14 PM
August 16-19, 2013
Survey of 721 Louisiana voters
Louisiana Survey Results (PPP)
Q4 If the candidates for President next time were
Democrat Hillary Clinton and Republican Jeb
Bush, who would you vote for?
44% Hillary Clinton
44% Jeb Bush
12% Not sure
Q5
If the candidates for President next time were
Democrat Hillary Clinton and Republican Chris
Christie, who would you vote for?
42% Hillary Clinton
41% Chris Christie
18% Not sure
Q6
If the candidates for President next time were
Democrat Hillary Clinton and Republican Rand
Paul, who would you vote for?
44% Hillary Clinton
45% Rand Paul
11% Not sure
Q7
If the candidates for President next time were
Democrat Hillary Clinton and Republican Paul
Ryan, who would you vote for?
44% Hillary Clinton
46% Paul Ryan
11% Not sure
.........................................................
Clinton vs. Christie
http://www.publicpolicypolling.com/pdf/2011/PPP_Release_LA_821.pdf
(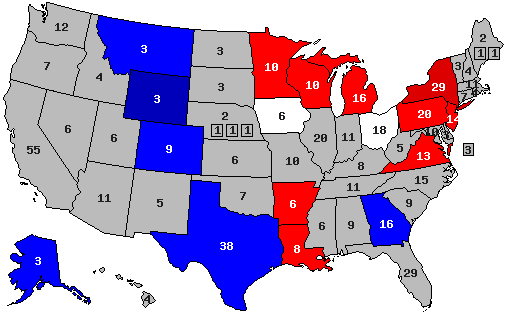 )
)
Clinton vs. Paul
( )
)
Clinton vs. Rubio
()
Clinton vs. Ryan
(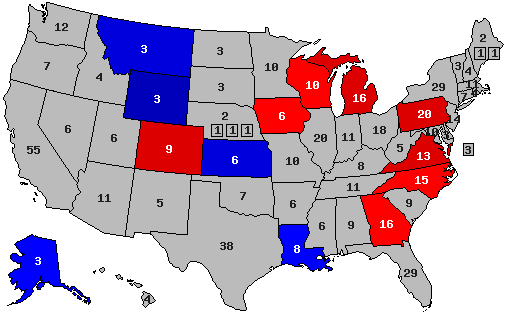 )
)
White indicates a tie.
Survey of 721 Louisiana voters
Louisiana Survey Results (PPP)
Q4 If the candidates for President next time were
Democrat Hillary Clinton and Republican Jeb
Bush, who would you vote for?
44% Hillary Clinton
44% Jeb Bush
12% Not sure
Q5
If the candidates for President next time were
Democrat Hillary Clinton and Republican Chris
Christie, who would you vote for?
42% Hillary Clinton
41% Chris Christie
18% Not sure
Q6
If the candidates for President next time were
Democrat Hillary Clinton and Republican Rand
Paul, who would you vote for?
44% Hillary Clinton
45% Rand Paul
11% Not sure
Q7
If the candidates for President next time were
Democrat Hillary Clinton and Republican Paul
Ryan, who would you vote for?
44% Hillary Clinton
46% Paul Ryan
11% Not sure
.........................................................
Clinton vs. Christie
http://www.publicpolicypolling.com/pdf/2011/PPP_Release_LA_821.pdf
(
Clinton vs. Paul
(
Clinton vs. Rubio
(
Clinton vs. Ryan
(
White indicates a tie.
Title: Re: 2016 Official Polling Map Thread
Post by: pbrower2a on August 21, 2013, 03:50:33 PM
Fellow readers of this thread:
I am tempted to start a new thread on this line. I am not saying when, but before I do (with the suggestion that this thread be locked) I see some faults in this presentation.
First, pollsters seem to no longer take Marco Rubio seriously. I am tempted to drop maps involving him in favor of maps for Jeb Bush, whom pollsters are beginning to take seriously. I am satisfied that Marco Rubio has beyond all imaginable question shown that he is not Presidential material until at least 2020 -- if ever.
Second, I see a huge difference between being up 43-42 and being up 49-40, and this map coloring scheme makes no such distinction. If it can't show the difference between a six-point lead and a one-point lead with someone 'leading' with less than 50% of the vote, the map shows leads that mean practically nothing. I'd like to show anyone with 40-49% support but less than a 4% margin (margin of error) with 30% saturation. Between 40% and 49% support, inclusively? Still 40% saturation. Between 50% and 54% support, inclusively? Still 50% saturation.
Third, I see few states that now seem likely to show a 70-30 preference for anyone. A 55% preference could be shown with a 70% saturation to signify that a state is likely out of reach because anyone with at least 55% support in a binary choice is up at least 10%. I could show 60% or higher support with 90% saturation because such shows a margin of at least 20%.
Title: Re: 2016 Official Polling Map Thread
Post by: pbrower2a on August 21, 2013, 04:18:45 PM
To show what the color scheme would look like:
White -- tie
blue, Republican -- red, Democratic
30% -- lead with 40-49% but a margin of 3% or less
40% -- lead with 40-49% but a margin of 4% or more
60% -- lead with 50-54%
70% -- lead with 55-59%
90% -- lead with 60% or more
(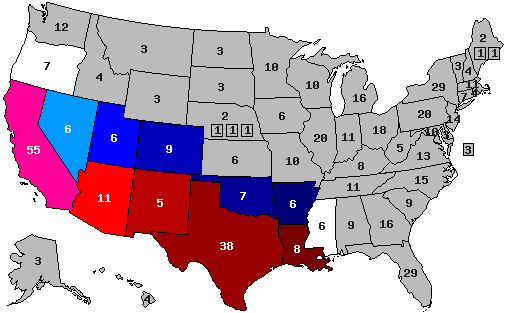 )
)
This map signifies nothing except to show a color scheme.
White -- tie
blue, Republican -- red, Democratic
30% -- lead with 40-49% but a margin of 3% or less
40% -- lead with 40-49% but a margin of 4% or more
60% -- lead with 50-54%
70% -- lead with 55-59%
90% -- lead with 60% or more
(
This map signifies nothing except to show a color scheme.
Title: Re: 2016 Official Polling Map Thread
Post by: pbrower2a on August 22, 2013, 01:43:39 PM
Looking ahead to the 2016 presidential campaign, former Secretary of State Hillary Clinton continues to be the apple of Virginia voters' eyes, leading New Jersey Gov. Chris Christie 46 - 37 percent, compared to 45 - 40 percent when Quinnipiac University asked that question in July.
Christie continues to lead Vice President Joseph Biden, 44 - 37 percent today compared to 46 - 38 percent last month.
Clinton crushes Sen. Ted Cruz of Texas 53 - 34 percent. Biden tops Cruz 47 - 37 percent.
http://www.quinnipiac.edu/institutes-and-centers/polling-institute/virginia/release-detail?ReleaseID=1940
Clinton vs. Christie
()
Clinton vs. Paul
()
Clinton vs. Rubio
()
Clinton vs. Ryan
()
White indicates a tie.
Christie continues to lead Vice President Joseph Biden, 44 - 37 percent today compared to 46 - 38 percent last month.
Clinton crushes Sen. Ted Cruz of Texas 53 - 34 percent. Biden tops Cruz 47 - 37 percent.
http://www.quinnipiac.edu/institutes-and-centers/polling-institute/virginia/release-detail?ReleaseID=1940
Clinton vs. Christie
(
Clinton vs. Paul
(
Clinton vs. Rubio
(
Clinton vs. Ryan
(
White indicates a tie.
Title: Re: 2016 Official Polling Map Thread
Post by: pbrower2a on August 23, 2013, 11:36:32 AM
Ohio, PPP:
Clinton 50%
Bush 36%
Clinton 45%
Christie 36%
Clinton 53%
Kasich 35%
Clinton 51%
Paul 36%
Clinton 52%
Ryan 36%
http://www.publicpolicypolling.com/main/2013/08/ohioans-skeptical-about-kasich-2016-and-more.html#more
Clinton vs. Christie
(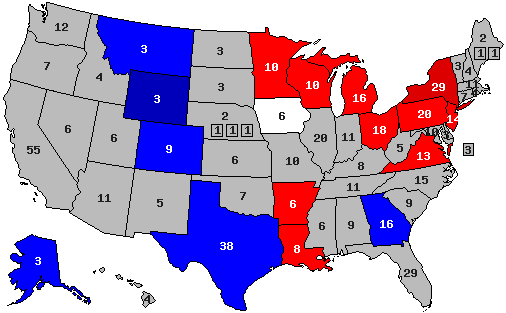 )
)
Clinton vs. Paul
(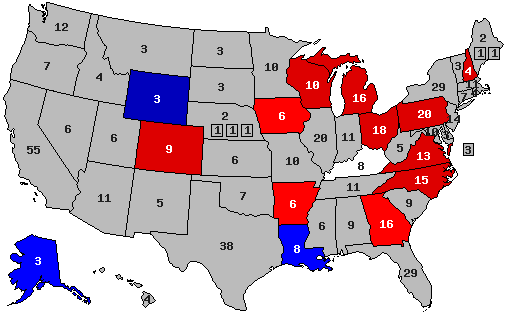 )
)
Clinton vs. Rubio
()
Clinton vs. Ryan
(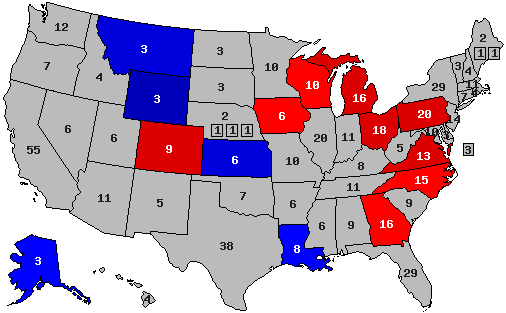 )
)
White indicates a tie.
Clinton 50%
Bush 36%
Clinton 45%
Christie 36%
Clinton 53%
Kasich 35%
Clinton 51%
Paul 36%
Clinton 52%
Ryan 36%
http://www.publicpolicypolling.com/main/2013/08/ohioans-skeptical-about-kasich-2016-and-more.html#more
Clinton vs. Christie
(
Clinton vs. Paul
(
Clinton vs. Rubio
(
Clinton vs. Ryan
(
White indicates a tie.
Title: Re: 2016 Official Polling Map Thread
Post by: pbrower2a on August 23, 2013, 12:11:19 PM
Blank map.
(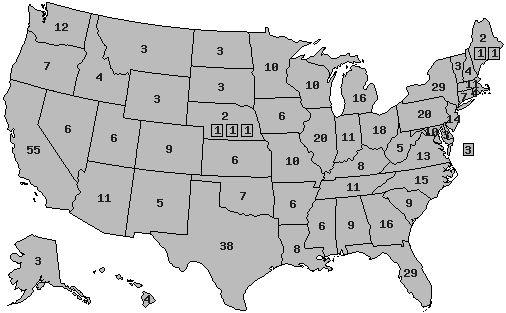 )
)
Purpose:
Jeb Bush vs. Hillary Clinton
Starting with Alaska, Florida, Georgia, Iowa, Louisiana, Michigan, Montana, Ohio, Virginia, and Wyoming:
(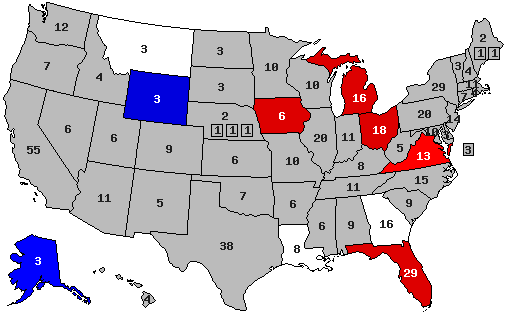 )
)
I will let someone else make the decision to merge this map with the others, perhaps replacing the maps involving Rubio with this one if such seems a good idea. After all, nobody seems to be paying any chances of Marco Rubio to be the next President anymore.
(
Purpose:
Jeb Bush vs. Hillary Clinton
Starting with Alaska, Florida, Georgia, Iowa, Louisiana, Michigan, Montana, Ohio, Virginia, and Wyoming:
(
I will let someone else make the decision to merge this map with the others, perhaps replacing the maps involving Rubio with this one if such seems a good idea. After all, nobody seems to be paying any chances of Marco Rubio to be the next President anymore.
Title: Re: 2016 Official Polling Map Thread
Post by: pbrower2a on August 23, 2013, 02:16:33 PM
With the color scheme suggested a few posts above:
White -- tie
blue, Republican -- red, Democratic
30% -- lead with 40-49% but a margin of 3% or less
40% -- lead with 40-49% but a margin of 4% or more
60% -- lead with 50-54%
70% -- lead with 55-59%
90% -- lead with 60% or more
Jeb Bush vs. Hillary Clinton
Starting with Alaska, Florida, Georgia, Iowa, Louisiana, Michigan, Montana, Ohio, Virginia, and Wyoming:
(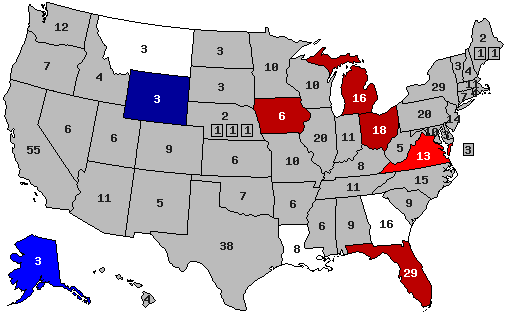 )
)
White -- tie
blue, Republican -- red, Democratic
30% -- lead with 40-49% but a margin of 3% or less
40% -- lead with 40-49% but a margin of 4% or more
60% -- lead with 50-54%
70% -- lead with 55-59%
90% -- lead with 60% or more
Jeb Bush vs. Hillary Clinton
Starting with Alaska, Florida, Georgia, Iowa, Louisiana, Michigan, Montana, Ohio, Virginia, and Wyoming:
(
Title: Re: 2016 Official Polling Map Thread
Post by: pbrower2a on August 23, 2013, 02:35:19 PM
With the color scheme suggested a few posts above:
White -- tie
blue, Republican -- red, Democratic
30% -- lead with 40-49% but a margin of 3% or less
40% -- lead with 40-49% but a margin of 4% or more
60% -- lead with 50-54%
70% -- lead with 55-59%
90% -- lead with 60% or more
Jeb Bush vs. Hillary Clinton
Starting with Alaska, Florida, Georgia, Iowa, Louisiana, Michigan, Montana, Ohio, Virginia, and Wyoming:
()
Contrast the old pattern:
()
I don't have enough data points to show a 46-43 split here, but as you can see I have a sharp contrast between someone up with 50% or more and someone up with under 50%. The justification for a 60% saturation is that the legal difference between winning 50% +1 and slightly less is significant in some places -- and because someone behind 52-47 must pull votes away from the one up 52-47 while the one down 47-45 can still win by picking up undecided votes.
White -- tie
blue, Republican -- red, Democratic
30% -- lead with 40-49% but a margin of 3% or less
40% -- lead with 40-49% but a margin of 4% or more
60% -- lead with 50-54%
70% -- lead with 55-59%
90% -- lead with 60% or more
Jeb Bush vs. Hillary Clinton
Starting with Alaska, Florida, Georgia, Iowa, Louisiana, Michigan, Montana, Ohio, Virginia, and Wyoming:
(
Contrast the old pattern:
(
I don't have enough data points to show a 46-43 split here, but as you can see I have a sharp contrast between someone up with 50% or more and someone up with under 50%. The justification for a 60% saturation is that the legal difference between winning 50% +1 and slightly less is significant in some places -- and because someone behind 52-47 must pull votes away from the one up 52-47 while the one down 47-45 can still win by picking up undecided votes.
Title: Re: 2016 Official Polling Map Thread
Post by: pbrower2a on August 23, 2013, 02:52:16 PM
Here is Christie for a contrast between the two patterns. The old way:
Clinton vs. Christie
()
White indicates a tie.
And my proposal:
White -- tie
blue, Republican -- red, Democratic
30% -- lead with 40-49% but a margin of 3% or less
40% -- lead with 40-49% but a margin of 4% or more
60% -- lead with 50-54%
70% -- lead with 55-59%
90% -- lead with 60% or more
Clinton vs. Christie
(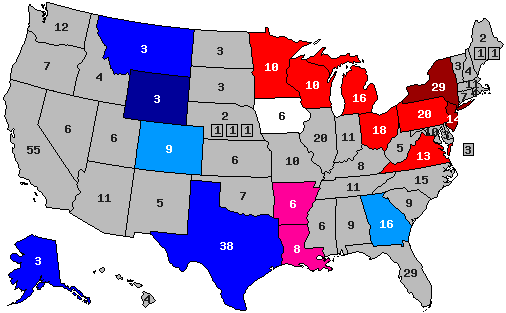 )
)
Polls go back at least to March with Clinton vs. Christie, but you can see more contrast in color (even if I show no state giving 60% to anyone). We can easily see that the weak leads of Clinton in Arkansas and Louisiana or of Christie in Colorado (which I have cause to doubt) and Georgia aren't worth much. Clinton leads in the northeastern quadrant of the US (except in New York and New Jersey) are not as imposing, but cutting into those will be difficult.
Clinton vs. Christie
(
White indicates a tie.
And my proposal:
White -- tie
blue, Republican -- red, Democratic
30% -- lead with 40-49% but a margin of 3% or less
40% -- lead with 40-49% but a margin of 4% or more
60% -- lead with 50-54%
70% -- lead with 55-59%
90% -- lead with 60% or more
Clinton vs. Christie
(
Polls go back at least to March with Clinton vs. Christie, but you can see more contrast in color (even if I show no state giving 60% to anyone). We can easily see that the weak leads of Clinton in Arkansas and Louisiana or of Christie in Colorado (which I have cause to doubt) and Georgia aren't worth much. Clinton leads in the northeastern quadrant of the US (except in New York and New Jersey) are not as imposing, but cutting into those will be difficult.
Title: Re: 2016 Official Polling Map Thread
Post by: Mr. Morden on August 24, 2013, 07:42:13 AM
Update on the latest statewide polls of Christie vs. Clinton:
AK: Christie +8
AR: Clinton +2
CO: Christie +1
GA: Christie +2
IA: tie
LA: Clinton +1
MI: Clinton +6
MN: Clinton +6
MT: Christie +5
NH: Clinton +5
NJ: Clinton +11
NY: Clinton +27
OH: Clinton +9
PA: Clinton +5
TX: Christie +9
VA: Clinton +9
WI: Clinton +7
WY: Christie +28
The swing from the 2012 election would then be:
AK: D+6
AR: D+26
CO: R+6
GA: D+6
IA: R+6
LA: D+21
MI: R+3
MN: R+1
MT: D+9
NH: R+1
NJ: R+7
NY: R+1
OH: D+6
PA: no change
TX: D+7
VA: D+5
WI: no change
WY: D+13
(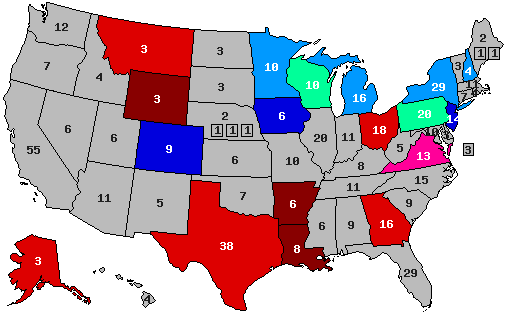 )
)
AK: Christie +8
AR: Clinton +2
CO: Christie +1
GA: Christie +2
IA: tie
LA: Clinton +1
MI: Clinton +6
MN: Clinton +6
MT: Christie +5
NH: Clinton +5
NJ: Clinton +11
NY: Clinton +27
OH: Clinton +9
PA: Clinton +5
TX: Christie +9
VA: Clinton +9
WI: Clinton +7
WY: Christie +28
The swing from the 2012 election would then be:
AK: D+6
AR: D+26
CO: R+6
GA: D+6
IA: R+6
LA: D+21
MI: R+3
MN: R+1
MT: D+9
NH: R+1
NJ: R+7
NY: R+1
OH: D+6
PA: no change
TX: D+7
VA: D+5
WI: no change
WY: D+13
(
Title: Re: 2016 Official Polling Map Thread
Post by: pbrower2a on August 26, 2013, 11:10:42 AM
Should we abandon all depictions of how Rubio would do in favor of Jeb Bush?
Title: Re: 2016 Official Polling Map Thread
Post by: eric82oslo on August 26, 2013, 07:30:56 PM
Here's an update with the latest state polls of August and September (up until the 20th).
Here are all the 2016 poll averages for each state so far - 22 states having been polled to date - and how far off they are compared to the actual 2012 outcomes. I'm only including the Republican candidate with the best statewide polling.
Alaska: Hillary vs Jeb Bush: R +7%
+7% D improvement
(Updated on August 4)
Arkansas: Hillary vs Chris Christie: D +2%
+22% D improvement
(Updated on August 11)
Colorado: Hillary vs Christie: R +2%
+7% R improvement
Florida: Hillary vs Jeb Bush: D +9%
+8% D improvement
Georgia: Hillary vs Christie: R +2%
+6% D improvement
(Updated August 8 )
Iowa: Hillary vs Christie: D +4%
+2% R improvement
(Updated on July 22)
Kansas: Hillary vs Paul Ryan: R +7%
+15% D improvement
Kentucky: Hillary vs Rand Paul: D +2.5%
+25% D improvement
(updated with second poll from 2012, corrected previous mistake)
Louisiana: Hillary vs Paul Ryan/Rand Paul: R +1%
+16% D improvement
Michigan: Hillary vs Christie: D +6%
+3.5% R improvement
Minnesota: Hillary vs Christie: D +6%
+2% R improvement
Montana: Hillary vs Marco Rubio: R +8%
+6% D improvement
(Corrected previous error)
New Hampshire: Hillary vs Christie: D +4.4%
+1.2% R improvement
(Updated with September poll)
New Jersey: Hillary vs Christie: D +9%
+9% R improvement
New York: Hillary vs Christie: D +27%
+1% R improvement
North Carolina: Hillary vs Rubio: D +7%
+9% D improvement
Ohio: Hillary vs Christie: D +4.5%
+1.5% R improvement
(Updated with newest poll)
Pennsylvania: Hillary vs Paul Ryan: D +12%
+7% D improvement
Texas: Hillary vs Ted Cruz: R +5%
+11% D improvement
Virginia: Hillary vs Christie: D +3%
+1% R improvement
(Updated with latest August poll + 3 new polls in September)
Wisconsin: Hillary vs Jeb Bush: D +4%
+3% R improvement
(Updated with latest September poll)
Wyoming: Hillary vs Christie: R +28%
+13% D improvement
(Updated July 24)
Average all 22 states: Hillary vs Best Republican: D +1.8%
+5.2% D improvement
That gives us this map right now:
(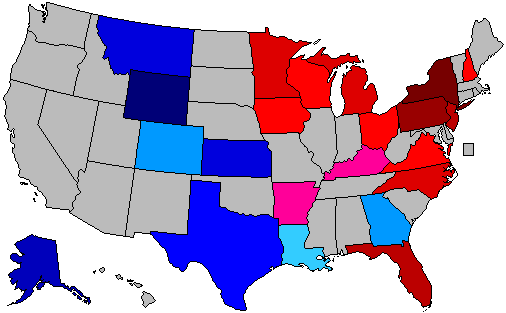 )
)
Red = Democratic lead
Blue = Republican lead
Green = Exact tie
Grey = No polling yet
20% shade = 0-1% lead
30% shade = 1-3% lead
40% shade = 3-6% lead
50% shade = 6-9% lead
60% shade = 9-12% lead
70% shade = 12-15% lead
80% shade = 15-18% lead
90% shade = Above 18% lead
In the count of electoral votes, this means the current situation looks like this:
Hillary: 214 EVs
Best/Tailormade Republican: 75 EVs
Toss-up: None
No polling: 249 EVs (almost half)
Which means that Hillary has captured an amazing 74% of all EVs awarded thus far, against disappointing 26% EVs for the tailormade Republican. And only New York of the solidly Democratic states has been polled so far (2 if including New Jersey), against no less than 9 solidly Republican states - the biggest of them, Texas, included. With California added to Hillary's pie, it'll look even more promising for her. Not either to forget such states as D.C., Vermont and Hawaii. It's looking like a landslide right now, even without Colorado being in Hillary's column.
This is how the Trendline Map looks so far:
( )
)
The states which right now are showing the strongest improvement for the Democratic (Hillary) or the Republican (in more than 50% of the cases, Christie) candidate:
1. Kentucky: D +25%
2. Arkansas: D +22%
3. Louisiana: D +16%
4. Kansas: D +15%
5. Wyoming: D +13%
6. Texas: D +11%
7. New Jersey: R +9%
8. North Carolina: D +9%
9. Florida: D +8%
10. Colorado: R +7%
11. Pennsylvania: D +7%
12. Alaska: D +7%
13. Georgia: D +6%
14. Montana: D +6%
All of these changes (in the 14 states above) are (more than) statistically significant. We see that (so far) Texas is experiencing a much more rapid change than other demograhically quick-changing states like Florida and Georgia. Unfortunately, the 4th quick-changing traditionally Republican state, Arizona, has still not been polled.
The strong D improvement in the Appalachian south (Kentucky, Arkansas, Louisiana, Pennsylvania (Texas & North Carolina)), makes me extremely curious to see how geographically similar states like Tennessee, Missouri, Indiana, Illinois, West Virginia and even South Carolina will play out in their first poll(s). I'm sure that all of these 6 states - in particular the first five - will move considerably towards Hillary as well.
The only non-candidate state (excluding New Jersey & Wisconsin) which have moved considerably towards Republican candidate(s) so far, has been Colorado. It will be interesting to see why this sole and very important swing state is bucking the trend which is occurring in almost the entire rest of the United States.
Updated with latest PPP poll of Virginia in August as well as the 3 Virginia polls from September. Also updated with polls of New Hampshire and Wisconsin in September. Iowa polls updated on July 22. Wyoming poll, national averages and state map updated on July 24. Also updated with latest Alaska poll on August 4. Georgia updated with new poll August 8. Updated with the first poll from Arkansas. Updated with latest August polls as well. And corrected three previous errors, including Kentucky, where Hillary is currently leading in the first two polls published, not Rand Paul as my numbers have claimed thus far.
Last updated on September 20.
Here are all the 2016 poll averages for each state so far - 22 states having been polled to date - and how far off they are compared to the actual 2012 outcomes. I'm only including the Republican candidate with the best statewide polling.
Alaska: Hillary vs Jeb Bush: R +7%
+7% D improvement
(Updated on August 4)
Arkansas: Hillary vs Chris Christie: D +2%
+22% D improvement
(Updated on August 11)
Colorado: Hillary vs Christie: R +2%
+7% R improvement
Florida: Hillary vs Jeb Bush: D +9%
+8% D improvement
Georgia: Hillary vs Christie: R +2%
+6% D improvement
(Updated August 8 )
Iowa: Hillary vs Christie: D +4%
+2% R improvement
(Updated on July 22)
Kansas: Hillary vs Paul Ryan: R +7%
+15% D improvement
Kentucky: Hillary vs Rand Paul: D +2.5%
+25% D improvement
(updated with second poll from 2012, corrected previous mistake)
Louisiana: Hillary vs Paul Ryan/Rand Paul: R +1%
+16% D improvement
Michigan: Hillary vs Christie: D +6%
+3.5% R improvement
Minnesota: Hillary vs Christie: D +6%
+2% R improvement
Montana: Hillary vs Marco Rubio: R +8%
+6% D improvement
(Corrected previous error)
New Hampshire: Hillary vs Christie: D +4.4%
+1.2% R improvement
(Updated with September poll)
New Jersey: Hillary vs Christie: D +9%
+9% R improvement
New York: Hillary vs Christie: D +27%
+1% R improvement
North Carolina: Hillary vs Rubio: D +7%
+9% D improvement
Ohio: Hillary vs Christie: D +4.5%
+1.5% R improvement
(Updated with newest poll)
Pennsylvania: Hillary vs Paul Ryan: D +12%
+7% D improvement
Texas: Hillary vs Ted Cruz: R +5%
+11% D improvement
Virginia: Hillary vs Christie: D +3%
+1% R improvement
(Updated with latest August poll + 3 new polls in September)
Wisconsin: Hillary vs Jeb Bush: D +4%
+3% R improvement
(Updated with latest September poll)
Wyoming: Hillary vs Christie: R +28%
+13% D improvement
(Updated July 24)
Average all 22 states: Hillary vs Best Republican: D +1.8%
+5.2% D improvement
That gives us this map right now:
(
Red = Democratic lead
Blue = Republican lead
Green = Exact tie
Grey = No polling yet
20% shade = 0-1% lead
30% shade = 1-3% lead
40% shade = 3-6% lead
50% shade = 6-9% lead
60% shade = 9-12% lead
70% shade = 12-15% lead
80% shade = 15-18% lead
90% shade = Above 18% lead
In the count of electoral votes, this means the current situation looks like this:
Hillary: 214 EVs
Best/Tailormade Republican: 75 EVs
Toss-up: None
No polling: 249 EVs (almost half)
Which means that Hillary has captured an amazing 74% of all EVs awarded thus far, against disappointing 26% EVs for the tailormade Republican. And only New York of the solidly Democratic states has been polled so far (2 if including New Jersey), against no less than 9 solidly Republican states - the biggest of them, Texas, included. With California added to Hillary's pie, it'll look even more promising for her. Not either to forget such states as D.C., Vermont and Hawaii. It's looking like a landslide right now, even without Colorado being in Hillary's column.
This is how the Trendline Map looks so far:
(
The states which right now are showing the strongest improvement for the Democratic (Hillary) or the Republican (in more than 50% of the cases, Christie) candidate:
1. Kentucky: D +25%
2. Arkansas: D +22%
3. Louisiana: D +16%
4. Kansas: D +15%
5. Wyoming: D +13%
6. Texas: D +11%
7. New Jersey: R +9%
8. North Carolina: D +9%
9. Florida: D +8%
10. Colorado: R +7%
11. Pennsylvania: D +7%
12. Alaska: D +7%
13. Georgia: D +6%
14. Montana: D +6%
All of these changes (in the 14 states above) are (more than) statistically significant. We see that (so far) Texas is experiencing a much more rapid change than other demograhically quick-changing states like Florida and Georgia. Unfortunately, the 4th quick-changing traditionally Republican state, Arizona, has still not been polled.
The strong D improvement in the Appalachian south (Kentucky, Arkansas, Louisiana, Pennsylvania (Texas & North Carolina)), makes me extremely curious to see how geographically similar states like Tennessee, Missouri, Indiana, Illinois, West Virginia and even South Carolina will play out in their first poll(s). I'm sure that all of these 6 states - in particular the first five - will move considerably towards Hillary as well.
The only non-candidate state (excluding New Jersey & Wisconsin) which have moved considerably towards Republican candidate(s) so far, has been Colorado. It will be interesting to see why this sole and very important swing state is bucking the trend which is occurring in almost the entire rest of the United States.
Updated with latest PPP poll of Virginia in August as well as the 3 Virginia polls from September. Also updated with polls of New Hampshire and Wisconsin in September. Iowa polls updated on July 22. Wyoming poll, national averages and state map updated on July 24. Also updated with latest Alaska poll on August 4. Georgia updated with new poll August 8. Updated with the first poll from Arkansas. Updated with latest August polls as well. And corrected three previous errors, including Kentucky, where Hillary is currently leading in the first two polls published, not Rand Paul as my numbers have claimed thus far.
Last updated on September 20.
Title: Re: 2016 Official Polling Map Thread
Post by: pbrower2a on August 28, 2013, 09:30:45 AM
Hillary Clinton seems to offer the prospect of winning in part on nostalgia for Bill Clinton while keeping Obama support intact. We have yet to see patters for New England (35 EV) and California (55 EV), and once PPP releases binary matchups between Hillary Clinton and prospective R pols, we will have some questions answered. Arizona, Indiana, and Missouri (which together contain 32 electoral votes) will be interesting if and when polled.
A Hillary Clinton win now looks like a huge Democratic win with a huge reduction in regional polarization of the electorate.
A Hillary Clinton win now looks like a huge Democratic win with a huge reduction in regional polarization of the electorate.
Title: Re: 2016 Official Polling Map Thread
Post by: pbrower2a on August 28, 2013, 06:02:03 PM
Merging in Jeb Bush; removing Marco Rubio
I anticipate binary matchups from PPP in Maine.
Hillary Clinton vs. Jeb Bush
()
Clinton vs. Christie
()
Clinton vs. Paul
()
Clinton vs. Ryan
()
White indicates a tie.
I anticipate binary matchups from PPP in Maine.
Hillary Clinton vs. Jeb Bush
(
Clinton vs. Christie
(
Clinton vs. Paul
(
Clinton vs. Ryan
(
White indicates a tie.
Title: Re: 2016 Official Polling Map Thread
Post by: GAworth on August 28, 2013, 09:41:45 PM
The polls might say GA will go to Hillary but I don't see that happening, it will be under 55% for the Republican but I think they will win it. 2020 I could believe it, but not 2016.
Title: Re: 2016 Official Polling Map Thread
Post by: President Johnson on August 29, 2013, 06:26:24 AM
The polls might say GA will go to Hillary but I don't see that happening, it will be under 55% for the Republican but I think they will win it. 2020 I could believe it, but not 2016.
Likely it becomes a tossup, as Obama lost it by "only" 7 percent. It might be very narrow democratic victory that year. But much depends on the candidates and the political cimate in 2016.
Title: Re: 2016 Official Polling Map Thread
Post by: IceSpear on September 12, 2013, 03:35:23 PM
The fact that Hillary only needs the West coast in most of these maps to get over 270 is telling.
Title: Re: 2016 Official Polling Map Thread
Post by: pbrower2a on September 12, 2013, 03:36:45 PM
Purple poll, Virginia.
Clinton 42, Christie 40
Clinton 48, Paul 41
http://www.purplestrategies.com/wp-content/uploads/September2013VAPoll_V5.pdf?utm_medium=email&utm_campaign=PurplePoll+VA+September&utm_content=PurplePoll+VA+September+CID_9ce890956460af89c13b0c312ffbee86&utm_source=Email%20marketing%20software&utm_term=Click%20here%20to%20see%20the%20full%20poll%20including%20the%20Purple%20analysis%20and%20crosstabs
Hillary Clinton vs. Jeb Bush
()
Clinton vs. Christie
()
Clinton vs. Paul
( )
)
Clinton vs. Ryan
()
White indicates a tie.
Clinton 42, Christie 40
Clinton 48, Paul 41
http://www.purplestrategies.com/wp-content/uploads/September2013VAPoll_V5.pdf?utm_medium=email&utm_campaign=PurplePoll+VA+September&utm_content=PurplePoll+VA+September+CID_9ce890956460af89c13b0c312ffbee86&utm_source=Email%20marketing%20software&utm_term=Click%20here%20to%20see%20the%20full%20poll%20including%20the%20Purple%20analysis%20and%20crosstabs
Hillary Clinton vs. Jeb Bush
(
Clinton vs. Christie
(
Clinton vs. Paul
(
Clinton vs. Ryan
(
White indicates a tie.
Title: Re: 2016 Official Polling Map Thread
Post by: pbrower2a on September 12, 2013, 04:01:18 PM
The fact that Hillary only needs the West coast in most of these maps to get over 270 is telling.
That is how things looked for Democrats in 2008 on Election night. In 2012 President Obama was ahead in four states that could decide the election and was close in another such state (North Carolina) as the networks called the West Coast states. The count made Ohio unwinnable for Romney just after 11PM eastern time.
Title: Re: 2016 Official Polling Map Thread
Post by: pbrower2a on September 12, 2013, 05:40:32 PM
Hillary Clinton vs. Rand Paul (new style)
blue, Republican -- red, Democratic
30% -- lead with 40-49% but a margin of 3% or less
40% -- lead with 40-49% but a margin of 4% or more
60% -- lead with 50-54%
70% -- lead with 55-59%
90% -- lead with 60% or more
(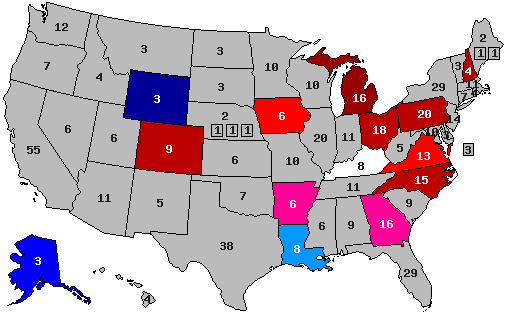 )
)
Old way:
Hillary Clinton vs. Rand Paul
()
The new way, I believe, shows the difference between an overwhelming lead (let us say between 57-42), a strong one (52-47), a significant one short of 50% (49-42), an insignificant one (48-45 or 43-42).
The new one involving a narrow Clinton lead over Christie in Virginia:
(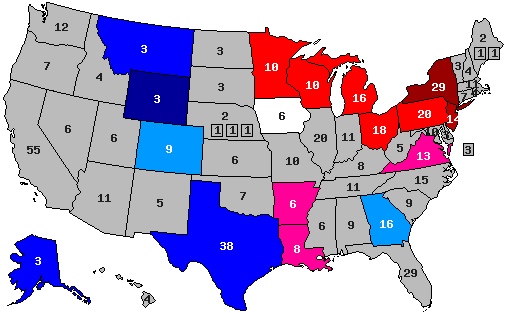 )
)
blue, Republican -- red, Democratic
30% -- lead with 40-49% but a margin of 3% or less
40% -- lead with 40-49% but a margin of 4% or more
60% -- lead with 50-54%
70% -- lead with 55-59%
90% -- lead with 60% or more
(
Old way:
Hillary Clinton vs. Rand Paul
(
The new way, I believe, shows the difference between an overwhelming lead (let us say between 57-42), a strong one (52-47), a significant one short of 50% (49-42), an insignificant one (48-45 or 43-42).
The new one involving a narrow Clinton lead over Christie in Virginia:
(
Title: Re: 2016 Official Polling Map Thread
Post by: pbrower2a on September 14, 2013, 10:58:55 AM
Margin-sensitive polling maps
The new way, I believe, shows the difference between an overwhelming lead (let us say between 57-42), a strong one (52-47), a significant one short of 50% (49-42), an insignificant one (48-45 or 43-42).
blue, Republican -- red, Democratic
30% -- lead with 40-49% but a margin of 3% or less
40% -- lead with 40-49% but a margin of 4% or more
60% -- lead with 50-54%
70% -- lead with 55-59%
90% -- lead with 60% or more
Hillary Clinton vs. Jeb Bush
()
Hillary Clinton vs. Chris Christie
()
Hillary Clinton vs. Rand Paul
()
Hillary Clinton vs. Paul Ryan
(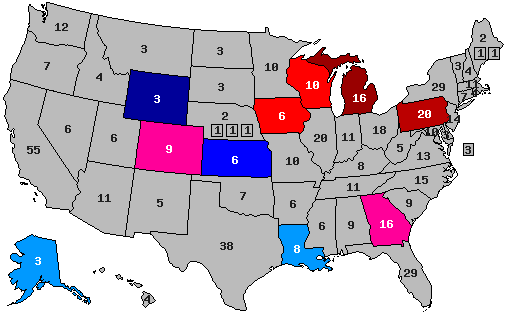 )
)
The new way, I believe, shows the difference between an overwhelming lead (let us say between 57-42), a strong one (52-47), a significant one short of 50% (49-42), an insignificant one (48-45 or 43-42).
blue, Republican -- red, Democratic
30% -- lead with 40-49% but a margin of 3% or less
40% -- lead with 40-49% but a margin of 4% or more
60% -- lead with 50-54%
70% -- lead with 55-59%
90% -- lead with 60% or more
Hillary Clinton vs. Jeb Bush
(
Hillary Clinton vs. Chris Christie
(
Hillary Clinton vs. Rand Paul
(
Hillary Clinton vs. Paul Ryan
(
Title: Re: 2016 Official Polling Map Thread
Post by: pbrower2a on September 15, 2013, 10:52:29 AM
I am going with the margin-sensitive polling map, and I may do no maintenance on the 'classic' maps. As I say, there's a huge difference between being up 57-41 and being up 51-48 that does not show with the 50% red saturation that fails to distinguish 50% and 59%. At or above 50%, the nominee cannot win by picking up the undecided vote alone; the lagger must pick up support from those then likely to vote for the leader. Even at 49% support the leader can lose by losing all of the undecided to the lagger even if such seems unlikely. (In my experience, the undecided tend to drift ineffectively and inadequately toward the eventual loser except during late-season collapses).
Having a lead of 3% and less than 50% is meaningless in predicting how that state is going, although patterns may show. For example, if Hillary Clinton is down by 6% to Chris Christie in Indiana (I chose Indiana as an example because I expect no Indiana polls for a very long time), then Christie is in trouble. After all, Democrats usually win the Presidency when Indiana is down 10% or less because Indiana is usually about R+12. Besides, if the Democratic nominee is down by that little in Indiana, he is probably ahead in a state like Florida, Ohio, or Virginia that is more D than Indiana that the Republicans cannot afford to lose.
Example: Carter lost the state by 7.6% in 1976 and barely got elected (2% in the popular vote). He lost it by 18.3% in 1980 and lost nationwide in the biggest blowout win for a challenger since FDR defeated Hoover in 1932.
Title: Re: 2016 Official Polling Map Thread
Post by: pbrower2a on September 18, 2013, 11:43:30 AM
Margin-sensitive polling maps
PPP, New Hampshire -- only four electoral votes, but it could have won the 2000 election for Al Gore by itself.
When it comes to the general election Hillary Clinton leads all the Republicans in head to heads. There's two pretty clear tiers of competitiveness: Chris Christie and everyone else. Christie comes within 4 points of Clinton, trailing 43/39. Everyone else we tested trails her by somewhere in the 8-12 point range: 50/42 against Ayotte, 49/40 against Bush, 50/41 against Ryan, 51/41 against Paul, and 50/38 against Cruz. - See more at: http://www.publicpolicypolling.com/main/2013/09/clinton-leads-dems-paul-and-christie-tops-among-republicans-in-nh.html#more
This way, I believe, shows the difference between an overwhelming lead (let us say between 57-42), a strong one (52-47), a significant one short of 50% (49-42), an insignificant one (48-45 or 43-42).
blue, Republican -- red, Democratic
30% -- lead with 40-49% but a margin of 3% or less
40% -- lead with 40-49% but a margin of 4% or more
60% -- lead with 50-54%
70% -- lead with 55-59%
90% -- lead with 60% or more
Hillary Clinton vs. Jeb Bush
(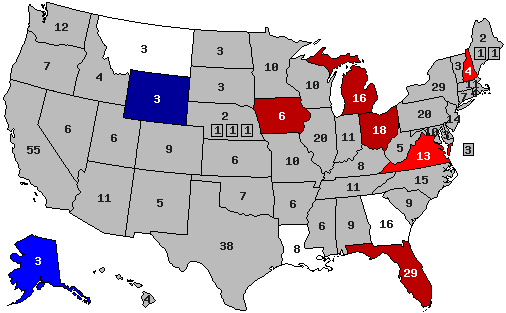 )
)
Hillary Clinton vs. Chris Christie
( )
)
Hillary Clinton vs. Rand Paul
()
Hillary Clinton vs. Paul Ryan
( )
)
As you can see (and the map shows it) Christie would have a significant chance to win New Hampshire, Jeb Bush practically none... and neither Paul nor Ryan has a chance in New Hampshire.
PPP, New Hampshire -- only four electoral votes, but it could have won the 2000 election for Al Gore by itself.
When it comes to the general election Hillary Clinton leads all the Republicans in head to heads. There's two pretty clear tiers of competitiveness: Chris Christie and everyone else. Christie comes within 4 points of Clinton, trailing 43/39. Everyone else we tested trails her by somewhere in the 8-12 point range: 50/42 against Ayotte, 49/40 against Bush, 50/41 against Ryan, 51/41 against Paul, and 50/38 against Cruz. - See more at: http://www.publicpolicypolling.com/main/2013/09/clinton-leads-dems-paul-and-christie-tops-among-republicans-in-nh.html#more
This way, I believe, shows the difference between an overwhelming lead (let us say between 57-42), a strong one (52-47), a significant one short of 50% (49-42), an insignificant one (48-45 or 43-42).
blue, Republican -- red, Democratic
30% -- lead with 40-49% but a margin of 3% or less
40% -- lead with 40-49% but a margin of 4% or more
60% -- lead with 50-54%
70% -- lead with 55-59%
90% -- lead with 60% or more
Hillary Clinton vs. Jeb Bush
(
Hillary Clinton vs. Chris Christie
(
Hillary Clinton vs. Rand Paul
(
Hillary Clinton vs. Paul Ryan
(
As you can see (and the map shows it) Christie would have a significant chance to win New Hampshire, Jeb Bush practically none... and neither Paul nor Ryan has a chance in New Hampshire.
Title: Re: 2016 Official Polling Map Thread
Post by: pbrower2a on September 19, 2013, 03:47:08 PM
PPP, Wisconsin
http://www.publicpolicypolling.com/main/2013/09/ryan-fares-stronger-than-walker-for-2016-in-wisconsin.html#more
Comment: Wisconsin may be drifting right. Ryan, without a Favorite Son advantage would lose Wisconsin... but he would lose enough genuine swing states to make Wisconsin irrelevant.
But not a sampling based upon the 2012 vote for President:
The current poll is of likely voters in midterm elections, obviously a more pressing concern in Wisconsin, as a Governorship and an open Senate seat will then be decided. In 2016 you can probably add four points to these polls for Clinton in the general election and take one away from each Republican as a potential nominee.
.....
This way, I believe, shows the difference between an overwhelming lead (let us say 57-42), a strong one (52-47), a significant one short of 50% (49-42), an insignificant one (48-45 or 43-42).
blue, Republican -- red, Democratic
30% -- lead with 40-49% but a margin of 3% or less
40% -- lead with 40-49% but a margin of 4% or more
60% -- lead with 50-54%
70% -- lead with 55-59%
90% -- lead with 60% or more
Hillary Clinton vs. Jeb Bush
(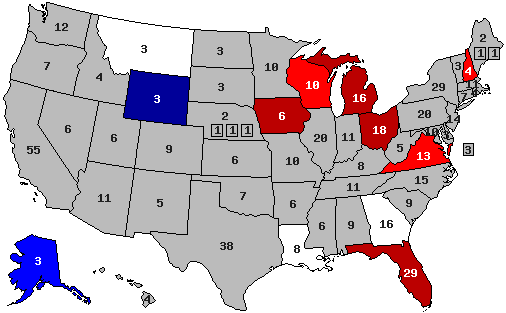 )
)
Hillary Clinton vs. Chris Christie
(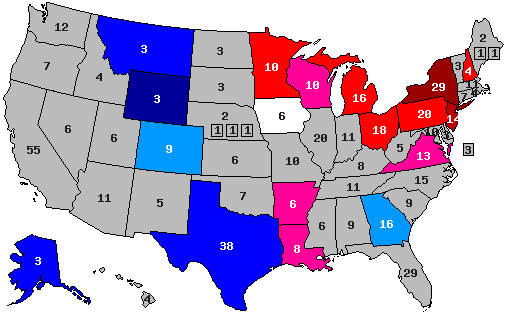 )
)
Hillary Clinton vs. Rand Paul
(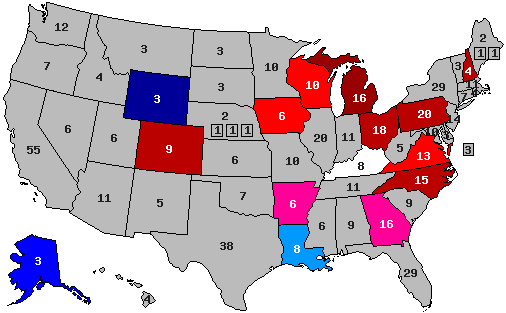 )
)
Hillary Clinton vs. Paul Ryan
(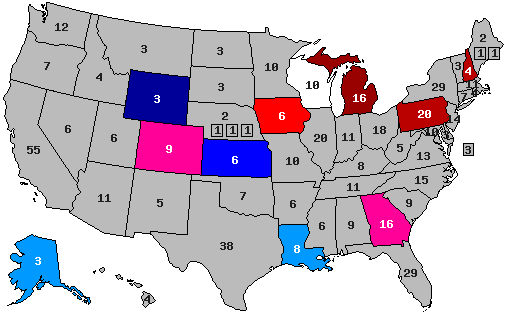 )
)
Quote
Ryan also fares better than Walker when it comes to matching up with Hillary Clinton. Ryan ties her at 46, while Walker trails by a 49/44 spread. In both cases the Republicans are polling 8 points better than they did when we last polled Wisconsin in February. At that time Clinton led Ryan 51/43 and Walker 54/41.
Clinton leads the rest of the Republicans we tested her against by varying margins- it's 3 points over Chris Christie at 43/40, 4 points over Jeb Bush at 46/42, 5 points over Rand Paul at 47/42, and 11 points over Ted Cruz at 48/37.
Clinton leads the rest of the Republicans we tested her against by varying margins- it's 3 points over Chris Christie at 43/40, 4 points over Jeb Bush at 46/42, 5 points over Rand Paul at 47/42, and 11 points over Ted Cruz at 48/37.
http://www.publicpolicypolling.com/main/2013/09/ryan-fares-stronger-than-walker-for-2016-in-wisconsin.html#more
Comment: Wisconsin may be drifting right. Ryan, without a Favorite Son advantage would lose Wisconsin... but he would lose enough genuine swing states to make Wisconsin irrelevant.
But not a sampling based upon the 2012 vote for President:
Quote
Q16 In the last presidential election, did you vote for
Barack Obama or Mitt Romney?
49% Barack Obama
45% Mitt Romney
6% Someone else/Don't remember
Barack Obama or Mitt Romney?
49% Barack Obama
45% Mitt Romney
6% Someone else/Don't remember
The current poll is of likely voters in midterm elections, obviously a more pressing concern in Wisconsin, as a Governorship and an open Senate seat will then be decided. In 2016 you can probably add four points to these polls for Clinton in the general election and take one away from each Republican as a potential nominee.
.....
This way, I believe, shows the difference between an overwhelming lead (let us say 57-42), a strong one (52-47), a significant one short of 50% (49-42), an insignificant one (48-45 or 43-42).
blue, Republican -- red, Democratic
30% -- lead with 40-49% but a margin of 3% or less
40% -- lead with 40-49% but a margin of 4% or more
60% -- lead with 50-54%
70% -- lead with 55-59%
90% -- lead with 60% or more
Hillary Clinton vs. Jeb Bush
(
Hillary Clinton vs. Chris Christie
(
Hillary Clinton vs. Rand Paul
(
Hillary Clinton vs. Paul Ryan
(
Title: Re: 2016 Official Polling Map Thread
Post by: eric82oslo on September 19, 2013, 05:55:47 PM
I've updated my averages and maps (both actual and trendline) for the 22 polled states now after the 5 polls in Virginia, Wisconsin and New Hampshire now in September. See post #109 please for the updated stats. :)
Title: Re: 2016 Official Polling Map Thread
Post by: pbrower2a on September 25, 2013, 05:25:37 PM
Do you remember when West Virginia went for Democratic nominees for President except during Republican landslides like 1972 and 1984? Me too. It's not going to bounce back enough for Hillary Clinton.
http://www.publicpolicypolling.com/pdf/2013/PPP_Release_WV_925.pdf
I'm not showing Ted Cruz.
blue, Republican -- red, Democratic
30% -- lead with 40-49% but a margin of 3% or less
40% -- lead with 40-49% but a margin of 4% or more
60% -- lead with 50-54%
70% -- lead with 55-59%
90% -- lead with 60% or more
Hillary Clinton vs. Jeb Bush
(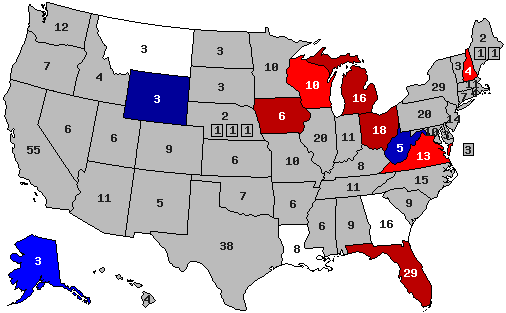 )
)
Hillary Clinton vs. Chris Christie
(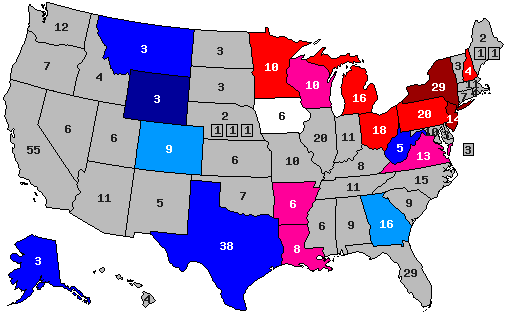 )
)
Hillary Clinton vs. Rand Paul
(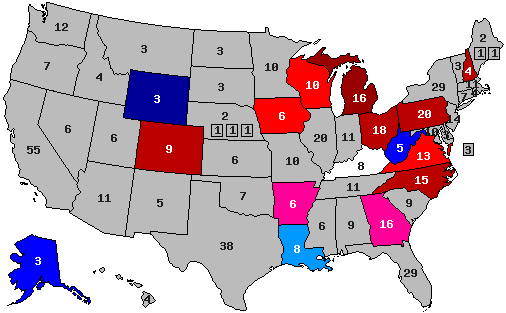 )
)
Hillary Clinton vs. Paul Ryan
(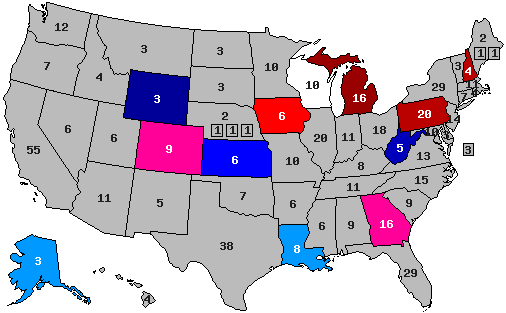 )
)
Quote
PPP, West Virginia
Q11 If the candidates for President next time were
Democrat Hillary Clinton and Republican Jeb
Bush, who would you vote for?
38% Hillary Clinton
52% Jeb Bush
10% not sure
Q12 If the candidates for President next time were
Democrat Hillary Clinton and Republican Chris
Christie, who would you vote for?
38% Hillary Clinton
47% Chris Christie
15% Not sure
Q13 If the candidates for President next time were
Democrat Hillary Clinton and Republican Ted
Cruz, who would you vote for?
41% Hillary Clinton
44% Ted Cruz
16% Not sure
Q14 If the candidates for President next time were
Democrat Hillary Clinton and Republican Rand
Paul, who would you vote for?
39% Hillary Clinton
49% Rand Paul
12% Not sure
Q15 If the candidates for President next time were
Democrat Hillary Clinton and Republican Paul
Ryan, who would you vote for?
38% Hillary Clinton
50% Paul Ryan
12% Not Sure
http://www.publicpolicypolling.com/pdf/2013/PPP_Release_WV_925.pdf
I'm not showing Ted Cruz.
blue, Republican -- red, Democratic
30% -- lead with 40-49% but a margin of 3% or less
40% -- lead with 40-49% but a margin of 4% or more
60% -- lead with 50-54%
70% -- lead with 55-59%
90% -- lead with 60% or more
Hillary Clinton vs. Jeb Bush
(
Hillary Clinton vs. Chris Christie
(
Hillary Clinton vs. Rand Paul
(
Hillary Clinton vs. Paul Ryan
(
Title: Re: 2016 Official Polling Map Thread
Post by: pbrower2a on September 27, 2013, 07:05:50 PM
New Jersey Survey of 1000 Likely Voters
Conducted September 19, 2013 By Pulse Opinion Research
In thinking about the 2016 presidential election, suppose you had a choice between Republican Chris Christie and Democrat Hillary Clinton. If the election were held today would you vote for Republican Chris Christie or Democrat Hillary Clinton?
43% Chris Christie
48% Hillary Clinton
5% Some other candidate
4% Not sure
http://chpp.kean.edu/poll/new-jersey-survey-1000-likely-voters-0
Nothing shown for binary matchups.
blue, Republican -- red, Democratic
30% -- lead with 40-49% but a margin of 3% or less
40% -- lead with 40-49% but a margin of 4% or more
60% -- lead with 50-54%
70% -- lead with 55-59%
90% -- lead with 60% or more
Hillary Clinton vs. Jeb Bush
()
Hillary Clinton vs. Chris Christie
( )
)
Hillary Clinton vs. Rand Paul
()
Hillary Clinton vs. Paul Ryan
()
Conducted September 19, 2013 By Pulse Opinion Research
In thinking about the 2016 presidential election, suppose you had a choice between Republican Chris Christie and Democrat Hillary Clinton. If the election were held today would you vote for Republican Chris Christie or Democrat Hillary Clinton?
43% Chris Christie
48% Hillary Clinton
5% Some other candidate
4% Not sure
http://chpp.kean.edu/poll/new-jersey-survey-1000-likely-voters-0
Nothing shown for binary matchups.
blue, Republican -- red, Democratic
30% -- lead with 40-49% but a margin of 3% or less
40% -- lead with 40-49% but a margin of 4% or more
60% -- lead with 50-54%
70% -- lead with 55-59%
90% -- lead with 60% or more
Hillary Clinton vs. Jeb Bush
(
Hillary Clinton vs. Chris Christie
(
Hillary Clinton vs. Rand Paul
(
Hillary Clinton vs. Paul Ryan
(
Title: Re: 2016 Official Polling Map Thread
Post by: Mr. Morden on September 27, 2013, 08:12:16 PM
Update on the latest statewide polls of Christie vs. Clinton:
AK: Christie +8
AR: Clinton +2
CO: Christie +1
GA: Christie +2
IA: tie
LA: Clinton +1
MI: Clinton +6
MN: Clinton +6
MT: Christie +5
NH: Clinton +4
NJ: Clinton +5
NY: Clinton +27
OH: Clinton +9
PA: Clinton +5
TX: Christie +9
VA: Clinton +2
WV: Christie +9
WI: Clinton +3
WY: Christie +28
The swing from the 2012 election would then be:
AK: D+6
AR: D+26
CO: R+6
GA: D+6
IA: R+6
LA: D+21
MI: R+3
MN: R+1
MT: D+9
NH: R+2
NJ: R+13
NY: R+1
OH: D+6
PA: no change
TX: D+7
VA: R+2
WV: D+18
WI: R+4
WY: D+13
(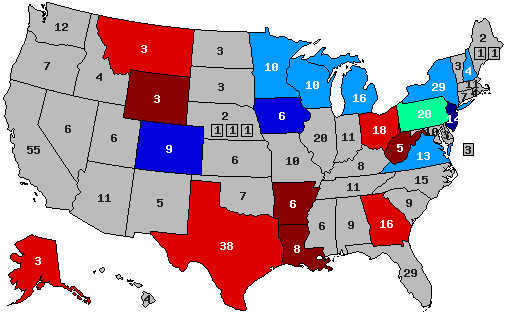 )
)
AK: Christie +8
AR: Clinton +2
CO: Christie +1
GA: Christie +2
IA: tie
LA: Clinton +1
MI: Clinton +6
MN: Clinton +6
MT: Christie +5
NH: Clinton +4
NJ: Clinton +5
NY: Clinton +27
OH: Clinton +9
PA: Clinton +5
TX: Christie +9
VA: Clinton +2
WV: Christie +9
WI: Clinton +3
WY: Christie +28
The swing from the 2012 election would then be:
AK: D+6
AR: D+26
CO: R+6
GA: D+6
IA: R+6
LA: D+21
MI: R+3
MN: R+1
MT: D+9
NH: R+2
NJ: R+13
NY: R+1
OH: D+6
PA: no change
TX: D+7
VA: R+2
WV: D+18
WI: R+4
WY: D+13
(
Title: Re: 2016 Official Polling Map Thread
Post by: eric82oslo on September 30, 2013, 06:59:44 PM
With two more polls out the last few days - including the very first poll this season in West Virginia (the other one being in New Jersey) - it's time to update my statistics once more, now presenting the 23rd state, the ultra Republican state as of late, and the most climate sceptic of all 50 states, West Virginia.
So here they are - all the 2016 poll averages for each state so far - 23 states having been polled to date - and how far off they are compared to the actual 2012 outcomes. I'm only including the Republican candidate with the best statewide polling.
Alaska: Hillary vs Jeb Bush: R +7%
+7% D improvement
(Updated on August 4)
Arkansas: Hillary vs Chris Christie: D +2%
+22% D improvement
Current Democratic gain
(Updated on August 11)
Colorado: Hillary vs Christie: R +2%
+7% R improvement
Current Republican gain
Florida: Hillary vs Jeb Bush: D +9%
+8% D improvement
Georgia: Hillary vs Christie: R +2%
+6% D improvement
(Updated August 8 )
Iowa: Hillary vs Christie: D +4%
+2% R improvement
(Updated on July 22)
Kansas: Hillary vs Paul Ryan: R +7%
+15% D improvement
Kentucky: Hillary vs Rand Paul: D +2.5%
+25% D improvement
Current Democratic gain
(updated with second poll from 2012, corrected previous mistake)
Louisiana: Hillary vs Paul Ryan/Rand Paul: R +1%
+16% D improvement
Michigan: Hillary vs Christie: D +6%
+3.5% R improvement
Minnesota: Hillary vs Christie: D +6%
+2% R improvement
Montana: Hillary vs Marco Rubio: R +8%
+6% D improvement
(Corrected previous error)
New Hampshire: Hillary vs Christie: D +4.4%
+1.2% R improvement
(Updated with September poll)
New Jersey: Hillary vs Christie: D +8%
+10% R improvement
(Updated October 1)
New York: Hillary vs Christie: D +27%
+1% R improvement
North Carolina: Hillary vs Rubio: D +7%
+9% D improvement
Current Democratic gain
Ohio: Hillary vs Christie: D +4.5%
+1.5% R improvement
(Updated with newest poll)
Pennsylvania: Hillary vs Paul Ryan: D +12%
+7% D improvement
Texas: Hillary vs Ted Cruz: R +5%
+11% D improvement
Virginia: Hillary vs Christie: D +3%
+1% R improvement
(Updated with latest August poll + 3 new polls in September)
West Virginia: Hillary vs Jeb Bush: R +14%
+13% D improvement
(Updated on October 1)
Wisconsin: Hillary vs Jeb Bush: D +4%
+3% R improvement
(Updated with latest September poll)
Wyoming: Hillary vs Christie: R +28%
+13% D improvement
(Updated July 24)
Average all 23 states: Hillary vs Best Republican: D +1.1%
+5.5% D improvement (from Obama 2012)
That gives us this map right now:
( )
)
Red = Democratic lead
Blue = Republican lead
Green = Exact tie
Grey = No polling yet
20% shade = 0-1% lead
30% shade = 1-3% lead
40% shade = 3-6% lead
50% shade = 6-9% lead
60% shade = 9-12% lead
70% shade = 12-15% lead
80% shade = 15-18% lead
90% shade = Above 18% lead
In the count of electoral votes, this means the current situation looks like this:
Hillary: 214 EVs (for a total of 14 states)
Best/Tailormade Republican: 80 EVs (for a total of 9 states)
Toss-up: None
No polling: 244 EVs [almost half, including California] (for a total of 27 states + D.C.)
Which means that Hillary has captured an amazing 73% of all EVs awarded thus far, against disappointing 27% EVs for the tailormade Republican. And only New York of the solidly Democratic states has been polled so far (2 if including New Jersey), against no less than 10 solidly Republican states - the biggest of them, Texas, included. With California added to Hillary's pie, it'll look even more promising for her. Neither to forget such states as D.C., Vermont and Hawaii. It's looking like a landslide right now, even without Colorado being in Hillary's column.
This is how the Trendline Map looks so far:
(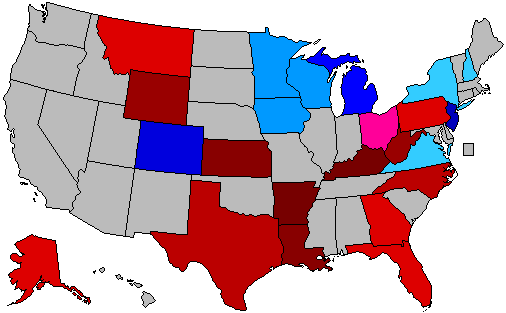 )
)
The states which right now are showing the strongest improvement for the Democratic (Hillary) or the Republican (in more than 50% of the cases, Christie) candidate:
1. Kentucky: D +25%
2. Arkansas: D +22%
3. Louisiana: D +16%
4. Kansas: D +15%
5. West Vriginia: D +13%
6. Wyoming: D +13%
7. Texas: D +11%
8. New Jersey: R +9%
9. North Carolina: D +9%
10. Florida: D +8%
11. Colorado: R +7%
12. Pennsylvania: D +7%
13. Alaska: D +7%
14. Georgia: D +6%
15. Montana: D +6%
All of these changes (in the 15 states above) are (more than) statistically significant. We see that (so far) Texas is experiencing a much more rapid change than other demograhically quick-changing states like Florida and Georgia. Unfortunately, the 4th quick-changing traditionally Republican state, Arizona, has still not been polled.
The strong D improvement in the Appalachian south (Kentucky, Arkansas, Louisiana, West Virginia, Pennsylvania (Texas & North Carolina)), makes me curious to see how geographically similar states like Tennessee, Missouri, Indiana, Illinois and even South Carolina will play out in their first poll(s). I'm pretty sure that all of these 5 states - in particular the first four - will move considerably towards Hillary as well.
The only non-candidate state (excluding New Jersey & Wisconsin) which have moved considerably towards Republican candidate(s) so far, has been Colorado. It will be interesting to see why this sole and very important swing state is bucking the trend which is occurring in almost the entire rest of the United States.
Last updated on October 1.
So here they are - all the 2016 poll averages for each state so far - 23 states having been polled to date - and how far off they are compared to the actual 2012 outcomes. I'm only including the Republican candidate with the best statewide polling.
Alaska: Hillary vs Jeb Bush: R +7%
+7% D improvement
(Updated on August 4)
Arkansas: Hillary vs Chris Christie: D +2%
+22% D improvement
Current Democratic gain
(Updated on August 11)
Colorado: Hillary vs Christie: R +2%
+7% R improvement
Current Republican gain
Florida: Hillary vs Jeb Bush: D +9%
+8% D improvement
Georgia: Hillary vs Christie: R +2%
+6% D improvement
(Updated August 8 )
Iowa: Hillary vs Christie: D +4%
+2% R improvement
(Updated on July 22)
Kansas: Hillary vs Paul Ryan: R +7%
+15% D improvement
Kentucky: Hillary vs Rand Paul: D +2.5%
+25% D improvement
Current Democratic gain
(updated with second poll from 2012, corrected previous mistake)
Louisiana: Hillary vs Paul Ryan/Rand Paul: R +1%
+16% D improvement
Michigan: Hillary vs Christie: D +6%
+3.5% R improvement
Minnesota: Hillary vs Christie: D +6%
+2% R improvement
Montana: Hillary vs Marco Rubio: R +8%
+6% D improvement
(Corrected previous error)
New Hampshire: Hillary vs Christie: D +4.4%
+1.2% R improvement
(Updated with September poll)
New Jersey: Hillary vs Christie: D +8%
+10% R improvement
(Updated October 1)
New York: Hillary vs Christie: D +27%
+1% R improvement
North Carolina: Hillary vs Rubio: D +7%
+9% D improvement
Current Democratic gain
Ohio: Hillary vs Christie: D +4.5%
+1.5% R improvement
(Updated with newest poll)
Pennsylvania: Hillary vs Paul Ryan: D +12%
+7% D improvement
Texas: Hillary vs Ted Cruz: R +5%
+11% D improvement
Virginia: Hillary vs Christie: D +3%
+1% R improvement
(Updated with latest August poll + 3 new polls in September)
West Virginia: Hillary vs Jeb Bush: R +14%
+13% D improvement
(Updated on October 1)
Wisconsin: Hillary vs Jeb Bush: D +4%
+3% R improvement
(Updated with latest September poll)
Wyoming: Hillary vs Christie: R +28%
+13% D improvement
(Updated July 24)
Average all 23 states: Hillary vs Best Republican: D +1.1%
+5.5% D improvement (from Obama 2012)
That gives us this map right now:
(
Red = Democratic lead
Blue = Republican lead
Green = Exact tie
Grey = No polling yet
20% shade = 0-1% lead
30% shade = 1-3% lead
40% shade = 3-6% lead
50% shade = 6-9% lead
60% shade = 9-12% lead
70% shade = 12-15% lead
80% shade = 15-18% lead
90% shade = Above 18% lead
In the count of electoral votes, this means the current situation looks like this:
Hillary: 214 EVs (for a total of 14 states)
Best/Tailormade Republican: 80 EVs (for a total of 9 states)
Toss-up: None
No polling: 244 EVs [almost half, including California] (for a total of 27 states + D.C.)
Which means that Hillary has captured an amazing 73% of all EVs awarded thus far, against disappointing 27% EVs for the tailormade Republican. And only New York of the solidly Democratic states has been polled so far (2 if including New Jersey), against no less than 10 solidly Republican states - the biggest of them, Texas, included. With California added to Hillary's pie, it'll look even more promising for her. Neither to forget such states as D.C., Vermont and Hawaii. It's looking like a landslide right now, even without Colorado being in Hillary's column.
This is how the Trendline Map looks so far:
(
The states which right now are showing the strongest improvement for the Democratic (Hillary) or the Republican (in more than 50% of the cases, Christie) candidate:
1. Kentucky: D +25%
2. Arkansas: D +22%
3. Louisiana: D +16%
4. Kansas: D +15%
5. West Vriginia: D +13%
6. Wyoming: D +13%
7. Texas: D +11%
8. New Jersey: R +9%
9. North Carolina: D +9%
10. Florida: D +8%
11. Colorado: R +7%
12. Pennsylvania: D +7%
13. Alaska: D +7%
14. Georgia: D +6%
15. Montana: D +6%
All of these changes (in the 15 states above) are (more than) statistically significant. We see that (so far) Texas is experiencing a much more rapid change than other demograhically quick-changing states like Florida and Georgia. Unfortunately, the 4th quick-changing traditionally Republican state, Arizona, has still not been polled.
The strong D improvement in the Appalachian south (Kentucky, Arkansas, Louisiana, West Virginia, Pennsylvania (Texas & North Carolina)), makes me curious to see how geographically similar states like Tennessee, Missouri, Indiana, Illinois and even South Carolina will play out in their first poll(s). I'm pretty sure that all of these 5 states - in particular the first four - will move considerably towards Hillary as well.
The only non-candidate state (excluding New Jersey & Wisconsin) which have moved considerably towards Republican candidate(s) so far, has been Colorado. It will be interesting to see why this sole and very important swing state is bucking the trend which is occurring in almost the entire rest of the United States.
Last updated on October 1.
Title: Re: 2016 Official Polling Map Thread
Post by: IceSpear on September 30, 2013, 09:37:42 PM
Kansas: Hillary vs Paul Ryan: R +7%
+15% D improvement
+15% D improvement
LMFAO. If I was a Republican I'd be praying every day Hillary doesn't run.
As for Colorado, the state is very atypical for several reasons. In most states there's backlash against Tea Party governors overreaching along with their legislators such as in NC, OH, etc. In Colorado it's the opposite at the moment, with the Democrats facing a backlash over their gun laws. Secondly, in most swing states, Democrats have a registration advantage over Republicans, but since independents skew Republican the states are competitive anyway. In Colorado it's the opposite, Republicans have a registration advantage but independents skew Democrat. I can see why Obama would have more appeal to libertarian-ish left-leaning independents in Colorado than Hillary would.
What really doesn't make any sense to me is why Hillary performs so well in Arkansas and Kentucky but not in West Virginia. AR/KY have pretty much been taken over by the GOP on all levels, but WV still has a dominant Democratic Party. You'd think she would be doing better there than in Kentucky especially.
Title: Re: 2016 Official Polling Map Thread
Post by: pbrower2a on October 16, 2013, 01:59:10 PM
That gives us this map right now:
(
Red = Democratic lead
Blue = Republican lead
Green = Exact tie
Grey = No polling yet
20% shade = 0-1% lead
30% shade = 1-3% lead
40% shade = 3-6% lead
50% shade = 6-9% lead
60% shade = 9-12% lead
70% shade = 12-15% lead
80% shade = 15-18% lead
90% shade = Above 18% lead
Quote
In the count of electoral votes, this means the current situation looks like this:
Hillary: 214 EVs (for a total of 14 states)
Best/Tailormade Republican: 80 EVs (for a total of 9 states)
Toss-up: None
No polling: 244 EVs [almost half, including California] (for a total of 27 states + D.C.)
Which means that Hillary has captured an amazing 73% of all EVs awarded thus far, against disappointing 27% EVs for the tailormade Republican. And only New York of the solidly Democratic states has been polled so far (2 if including New Jersey), against no less than 10 solidly Republican states - the biggest of them, Texas, included. With California added to Hillary's pie, it'll look even more promising for her. Neither to forget such states as D.C., Vermont and Hawaii. It's looking like a landslide right now, even without Colorado being in Hillary's column.
Let's make it even simpler. For states for which no polls have been taken yet nobody has any reasonable cause to believe would go other than as they usually do, color them green if they are practically certain to go for any Republican and orange if they are nearly-certain D wins. I am going to be on the cautious side with Nevada and New Mexico because if Colorado is leaning R for now then those two states are iffy. But if Georgia is iffy, then so are Arizona, Indiana, and Missouri. Basically Hillary Clinton is not going to win Alabama, Oklahoma, or Utah and she is not going to lose California, Maryland, or Massachusetts. I am going to use pale shades of green and orange because dark orange shades are ugly.
(
I can't believe that either Arkansas or Kentucky will go for Hillary Clinton -- but if they do we are going to see the dullest Presidential election since the 1980s. As it is I see Hillary with 343 electoral votes with an upside of up to 44 more based on Arizona, Indiana, Missouri, Nevada, and New Mexico.
Title: Re: 2016 Official Polling Map Thread
Post by: pbrower2a on October 29, 2013, 05:58:35 PM
Republicans surely wish that Wisconsin has become a showcase for the repudiation of liberalism in a state that hasn't voted for a Republican nominee for President since the Reagan blowouts through the glorious achievements of Favorite Sons Governor Scott Walker and Paul Ryan, and they would be ready to vote for just about any Republicans after the Presidential disaster that is Barack Obama.
Clinton 51, Ryan 43
Clinton 53, Walker 41
Clinton 50, Christie 40
Clinton 55, Cruz 33
https://law.marquette.edu/poll/2013/10/29/marquette-law-school-poll-shows-walker-in-tight-race-with-burke-for-wisconsin-governor-in-2014/
Fantasy disabused. Nothing on Jeb Bush or Rand Paul.
At this point, Scott Walker looks as if he would give the worst Favorite Son performance in his own state since at least George McGovern in 1972. Ted Cruz looks as if he would be setting up an electoral disaster analogous to Barry Goldwater in 1964.
blue, Republican -- red, Democratic
30% -- lead with 40-49% but a margin of 3% or less
40% -- lead with 40-49% but a margin of 4% or more
60% -- lead with 50-54%
70% -- lead with 55-59%
90% -- lead with 60% or more
Hillary Clinton vs. Jeb Bush
()
Hillary Clinton vs. Chris Christie
( )
)
Hillary Clinton vs. Rand Paul
()
Hillary Clinton vs. Paul Ryan
(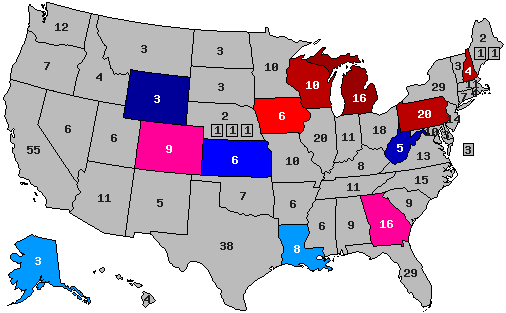 )
)
Clinton 51, Ryan 43
Clinton 53, Walker 41
Clinton 50, Christie 40
Clinton 55, Cruz 33
https://law.marquette.edu/poll/2013/10/29/marquette-law-school-poll-shows-walker-in-tight-race-with-burke-for-wisconsin-governor-in-2014/
Fantasy disabused. Nothing on Jeb Bush or Rand Paul.
At this point, Scott Walker looks as if he would give the worst Favorite Son performance in his own state since at least George McGovern in 1972. Ted Cruz looks as if he would be setting up an electoral disaster analogous to Barry Goldwater in 1964.
blue, Republican -- red, Democratic
30% -- lead with 40-49% but a margin of 3% or less
40% -- lead with 40-49% but a margin of 4% or more
60% -- lead with 50-54%
70% -- lead with 55-59%
90% -- lead with 60% or more
Hillary Clinton vs. Jeb Bush
(
Hillary Clinton vs. Chris Christie
(
Hillary Clinton vs. Rand Paul
(
Hillary Clinton vs. Paul Ryan
(
Title: Re: 2016 Official Polling Map Thread
Post by: Mr. Morden on November 01, 2013, 07:51:35 PM
Update on the latest statewide polls of Christie vs. Clinton:
AK: Christie +8
AR: Clinton +2
CO: Christie +1
GA: Christie +2
IA: tie
LA: Clinton +1
MI: Clinton +6
MN: Clinton +6
MT: Christie +5
NH: Clinton +4
NJ: Clinton +5
NY: Clinton +27
OH: Clinton +9
PA: Clinton +5
SC: Christie +5
TX: Christie +9
VA: Clinton +2
WV: Christie +9
WI: Clinton +10
WY: Christie +28
The swing from the 2012 election would then be:
AK: D+6
AR: D+26
CO: R+6
GA: D+6
IA: R+6
LA: D+21
MI: R+3
MN: R+1
MT: D+9
NH: R+2
NJ: R+13
NY: R+1
OH: D+6
PA: no change
SC: D+5
TX: D+7
VA: R+2
WV: D+18
WI: D+3
WY: D+13
(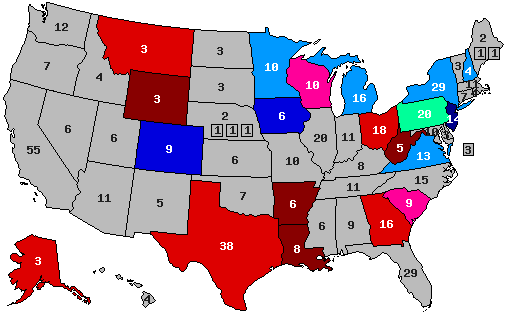 )
)
AK: Christie +8
AR: Clinton +2
CO: Christie +1
GA: Christie +2
IA: tie
LA: Clinton +1
MI: Clinton +6
MN: Clinton +6
MT: Christie +5
NH: Clinton +4
NJ: Clinton +5
NY: Clinton +27
OH: Clinton +9
PA: Clinton +5
SC: Christie +5
TX: Christie +9
VA: Clinton +2
WV: Christie +9
WI: Clinton +10
WY: Christie +28
The swing from the 2012 election would then be:
AK: D+6
AR: D+26
CO: R+6
GA: D+6
IA: R+6
LA: D+21
MI: R+3
MN: R+1
MT: D+9
NH: R+2
NJ: R+13
NY: R+1
OH: D+6
PA: no change
SC: D+5
TX: D+7
VA: R+2
WV: D+18
WI: D+3
WY: D+13
(
Title: Re: 2016 Official Polling Map Thread
Post by: eric82oslo on November 02, 2013, 08:56:56 AM
Updated on November 8 to add the latest Texas poll to the list. It didn't change much, however, it substituted Ted Cruz with Jeb Bush. The Republican lead is still 5% ahead of Hillary though. Chris Christie, Rand Paul and Ted Cruz are all 4% ahead of Hillary in Texas now. Marco Rubio is 1% behind her, while Rick Perry is 4.7% behind her - quite chanceless in other words.
Update on November 2 to include the very first poll from South Carolina. Harper polling polled 3 potential Republican candidates against Hillary - Cruz, Christie and Rubio. Marco Rubio did best of the three - beating Hillary by a margin of 7 %.
So here they are - all the 2016 poll averages for each state so far - 24 states having been polled to date - and how far off they are compared to the actual 2012 outcomes. I'm only including the Republican candidate with the best statewide polling.
Alaska: Hillary vs Jeb Bush: R +7%
+7% D improvement
(Updated on August 4)
Arkansas: Hillary vs Chris Christie: D +2%
+22% D improvement
Current Democratic gain
(Updated on August 11)
Colorado: Hillary vs Christie: R +2%
+7% R improvement
Current Republican gain
Florida: Hillary vs Jeb Bush: D +9%
+8% D improvement
Georgia: Hillary vs Christie: R +2%
+6% D improvement
(Updated August 8 )
Iowa: Hillary vs Christie: D +4%
+2% R improvement
Kansas: Hillary vs Paul Ryan: R +7%
+15% D improvement
Kentucky: Hillary vs Rand Paul: D +2.5%
+25% D improvement
Current Democratic gain
Louisiana: Hillary vs Paul Ryan/Rand Paul: R +1%
+16% D improvement
Michigan: Hillary vs Christie: D +6%
+3.5% R improvement
Minnesota: Hillary vs Christie: D +6%
+2% R improvement
Montana: Hillary vs Marco Rubio: R +8%
+6% D improvement
New Hampshire: Hillary vs Christie: D +4.4%
+1.2% R improvement
(Updated with September poll)
New Jersey: Hillary vs Christie: D +7.8%
+10% R improvement
(Updated November 8 )
New York: Hillary vs Christie: D +27%
+1% R improvement
North Carolina: Hillary vs Rubio: D +7%
+9% D improvement
Current Democratic gain
Ohio: Hillary vs Christie: D +4.5%
+1.5% R improvement
Pennsylvania: Hillary vs Paul Ryan: D +12%
+7% D improvement
South Carolina: Hillary vs Marco Rubio: R+7%
+3.5% D improvement
(Updated November 2)
Texas: Hillary vs Jeb Bush: R +5%
+11% D improvement
(Updated November 8 )
Virginia: Hillary vs Christie: D +3%
+1% R improvement
West Virginia: Hillary vs Jeb Bush: R +14%
+13% D improvement
(Updated on October 1)
Wisconsin: Hillary vs Jeb Bush: D +4%
+3% R improvement
(Updated with latest October poll, though Bush was not among those polled)
Wyoming: Hillary vs Christie: R +28%
+13% D improvement
Average all 24 states: Hillary vs Best Republican: D +0.8%
+6% D improvement (from Obama 2012)
That gives us this map right now:
(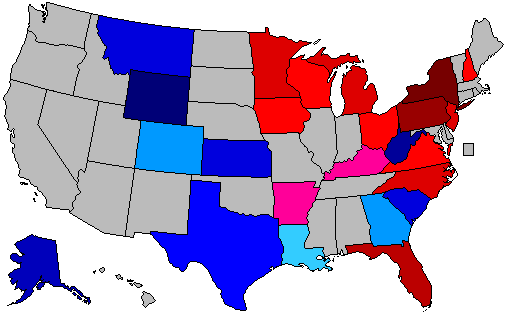 )
)
Red = Democratic lead
Blue = Republican lead
Green = Exact tie
Grey = No polling yet
20% shade = 0-1% lead
30% shade = 1-3% lead
40% shade = 3-6% lead
50% shade = 6-9% lead
60% shade = 9-12% lead
70% shade = 12-15% lead
80% shade = 15-18% lead
90% shade = Above 18% lead
In the count of electoral votes, this means the current situation looks like this:
Hillary: 214 EVs (for a total of 14 states)
Best/Tailormade Republican: 89 EVs (for a total of 10 states)
Toss-up: None
No polling: 235 EVs [almost half, including California] (for a total of 26 states + D.C.)
Which means that Hillary has captured an amazing 70.6% of all EVs awarded thus far, against disappointing 29.4% EVs for the tailormade Republican. And only New York of the solidly Democratic states has been polled so far (2 if including New Jersey), against no less than 11 solidly Republican states - the biggest of them, Texas, included. With California added to Hillary's pie, it'll look even more promising for her. Neither to forget such states as D.C., Vermont and Hawaii. It's looking like a landslide right now, even without Colorado being in Hillary's column.
This is how the Trendline Map looks so far:
(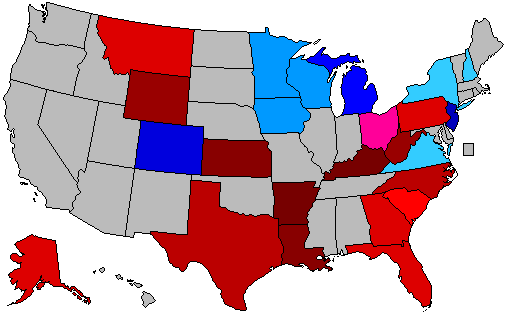 )
)
The states which right now are showing the strongest improvement for the Democratic (Hillary) or the Republican (in about 50% of the cases, Christie) candidate:
1. Kentucky: D +25%
2. Arkansas: D +22%
3. Louisiana: D +16%
4. Kansas: D +15%
5. West Vriginia: D +13%
6. Wyoming: D +13%
7. Texas: D +11%
8. New Jersey: R +10%
9. North Carolina: D +9%
10. Florida: D +8%
11. Colorado: R +7%
12. Pennsylvania: D +7%
13. Alaska: D +7%
14. Georgia: D +6%
15. Montana: D +6%
All of these changes (in the 15 states above) are (more than) statistically significant. We see that (so far) Texas is experiencing a much more rapid change than other demographically quick-changing states like Florida and Georgia. Unfortunately, the 4th quick-changing traditionally Republican state, Arizona, has still not been polled.
The strong D improvement in the Appalachian south (Kentucky, Arkansas, Louisiana, West Virginia, Pennsylvania, Ohio (Texas, North Carolina & South Carolina)), makes me curious to see how geographically similar states like Tennessee, Missouri, Indiana and Illinois will play out in their first poll(s). I'm feeling quite confident that all of these 4 states will move considerably towards Hillary as well, although Illinois might possibly be less certain than the first three, as Obama used the state as his campaign base in both of his elections.
The only non-candidate state (excluding New Jersey & Wisconsin) which have moved considerably towards Republican candidate(s) so far, has been Colorado. It will be interesting to see why this sole and very important swing state is bucking the trend which is occurring in almost the entire rest of the United States.
Last updated on November 8.
Update on November 2 to include the very first poll from South Carolina. Harper polling polled 3 potential Republican candidates against Hillary - Cruz, Christie and Rubio. Marco Rubio did best of the three - beating Hillary by a margin of 7 %.
So here they are - all the 2016 poll averages for each state so far - 24 states having been polled to date - and how far off they are compared to the actual 2012 outcomes. I'm only including the Republican candidate with the best statewide polling.
Alaska: Hillary vs Jeb Bush: R +7%
+7% D improvement
(Updated on August 4)
Arkansas: Hillary vs Chris Christie: D +2%
+22% D improvement
Current Democratic gain
(Updated on August 11)
Colorado: Hillary vs Christie: R +2%
+7% R improvement
Current Republican gain
Florida: Hillary vs Jeb Bush: D +9%
+8% D improvement
Georgia: Hillary vs Christie: R +2%
+6% D improvement
(Updated August 8 )
Iowa: Hillary vs Christie: D +4%
+2% R improvement
Kansas: Hillary vs Paul Ryan: R +7%
+15% D improvement
Kentucky: Hillary vs Rand Paul: D +2.5%
+25% D improvement
Current Democratic gain
Louisiana: Hillary vs Paul Ryan/Rand Paul: R +1%
+16% D improvement
Michigan: Hillary vs Christie: D +6%
+3.5% R improvement
Minnesota: Hillary vs Christie: D +6%
+2% R improvement
Montana: Hillary vs Marco Rubio: R +8%
+6% D improvement
New Hampshire: Hillary vs Christie: D +4.4%
+1.2% R improvement
(Updated with September poll)
New Jersey: Hillary vs Christie: D +7.8%
+10% R improvement
(Updated November 8 )
New York: Hillary vs Christie: D +27%
+1% R improvement
North Carolina: Hillary vs Rubio: D +7%
+9% D improvement
Current Democratic gain
Ohio: Hillary vs Christie: D +4.5%
+1.5% R improvement
Pennsylvania: Hillary vs Paul Ryan: D +12%
+7% D improvement
South Carolina: Hillary vs Marco Rubio: R+7%
+3.5% D improvement
(Updated November 2)
Texas: Hillary vs Jeb Bush: R +5%
+11% D improvement
(Updated November 8 )
Virginia: Hillary vs Christie: D +3%
+1% R improvement
West Virginia: Hillary vs Jeb Bush: R +14%
+13% D improvement
(Updated on October 1)
Wisconsin: Hillary vs Jeb Bush: D +4%
+3% R improvement
(Updated with latest October poll, though Bush was not among those polled)
Wyoming: Hillary vs Christie: R +28%
+13% D improvement
Average all 24 states: Hillary vs Best Republican: D +0.8%
+6% D improvement (from Obama 2012)
That gives us this map right now:
(
Red = Democratic lead
Blue = Republican lead
Green = Exact tie
Grey = No polling yet
20% shade = 0-1% lead
30% shade = 1-3% lead
40% shade = 3-6% lead
50% shade = 6-9% lead
60% shade = 9-12% lead
70% shade = 12-15% lead
80% shade = 15-18% lead
90% shade = Above 18% lead
In the count of electoral votes, this means the current situation looks like this:
Hillary: 214 EVs (for a total of 14 states)
Best/Tailormade Republican: 89 EVs (for a total of 10 states)
Toss-up: None
No polling: 235 EVs [almost half, including California] (for a total of 26 states + D.C.)
Which means that Hillary has captured an amazing 70.6% of all EVs awarded thus far, against disappointing 29.4% EVs for the tailormade Republican. And only New York of the solidly Democratic states has been polled so far (2 if including New Jersey), against no less than 11 solidly Republican states - the biggest of them, Texas, included. With California added to Hillary's pie, it'll look even more promising for her. Neither to forget such states as D.C., Vermont and Hawaii. It's looking like a landslide right now, even without Colorado being in Hillary's column.
This is how the Trendline Map looks so far:
(
The states which right now are showing the strongest improvement for the Democratic (Hillary) or the Republican (in about 50% of the cases, Christie) candidate:
1. Kentucky: D +25%
2. Arkansas: D +22%
3. Louisiana: D +16%
4. Kansas: D +15%
5. West Vriginia: D +13%
6. Wyoming: D +13%
7. Texas: D +11%
8. New Jersey: R +10%
9. North Carolina: D +9%
10. Florida: D +8%
11. Colorado: R +7%
12. Pennsylvania: D +7%
13. Alaska: D +7%
14. Georgia: D +6%
15. Montana: D +6%
All of these changes (in the 15 states above) are (more than) statistically significant. We see that (so far) Texas is experiencing a much more rapid change than other demographically quick-changing states like Florida and Georgia. Unfortunately, the 4th quick-changing traditionally Republican state, Arizona, has still not been polled.
The strong D improvement in the Appalachian south (Kentucky, Arkansas, Louisiana, West Virginia, Pennsylvania, Ohio (Texas, North Carolina & South Carolina)), makes me curious to see how geographically similar states like Tennessee, Missouri, Indiana and Illinois will play out in their first poll(s). I'm feeling quite confident that all of these 4 states will move considerably towards Hillary as well, although Illinois might possibly be less certain than the first three, as Obama used the state as his campaign base in both of his elections.
The only non-candidate state (excluding New Jersey & Wisconsin) which have moved considerably towards Republican candidate(s) so far, has been Colorado. It will be interesting to see why this sole and very important swing state is bucking the trend which is occurring in almost the entire rest of the United States.
Last updated on November 8.
Title: Re: 2016 Official Polling Map Thread
Post by: Mr. Morden on November 02, 2013, 05:54:04 PM
Iowa: Hillary vs Christie: D +4%
+2% R improvement
(Updated on July 22)
Isn't this a 41/41 tie, not a 4 point Clinton lead?
http://www.quinnipiac.edu/institutes-and-centers/polling-institute/iowa/release-detail?ReleaseID=1926
Title: Re: 2016 Official Polling Map Thread
Post by: eric82oslo on November 02, 2013, 06:12:44 PM
Iowa: Hillary vs Christie: D +4%
+2% R improvement
(Updated on July 22)
Isn't this a 41/41 tie, not a 4 point Clinton lead?
http://www.quinnipiac.edu/institutes-and-centers/polling-institute/iowa/release-detail?ReleaseID=1926
Mine is based on an average of ALL possible polls, not just on the last most random poll.
Title: Re: 2016 Official Polling Map Thread
Post by: pbrower2a on November 06, 2013, 08:07:42 AM
No map, as this is a national survey.
National Survey Results
Q1
If the candidates for President next time were
Democrat Hillary Clinton and Republican Jeb
Bush, who would you vote for?
48%
Hillary Clinton
..................................................
39%
Jeb Bush
.........................................................
13%
Not sure
..........................................................
Q2
If the candidates for President next time were
Democrat Hillary Clinton and Republican Chris
Christie, who would you vote for?
44%
Hillary Clinton
..................................................
39%
Chris Christie
..................................................
16%
Not sure
..........................................................
Q3
If the candidates for President next time were
Democrat Hillary Clinton and Republican Ted
Cruz, who would you vote for?
50%
Hillary Clinton
..................................................
33%
Ted Cruz
.........................................................
16%
Not sure
..........................................................
Q4
If the candidates for President next time were
Democrat Hillary Clinton and Republican Rand
Paul, who would you vote for?
49%
Hillary Clinton
..................................................
37%
Rand Paul
.......................................................
14%
Not sure
..........................................................
Q5
If the candidates for President next time were
Democrat Joe Biden and Republican Jeb
Bush, who would you vote for?
42%
Joe Biden
........................................................
43%
Jeb Bush
.........................................................
15%
Not sure
..........................................................
Q6
If the candidates for President next time were
Democrat Joe Biden and Republican Chris
Christie, who would you vote for?
38%
Joe Biden
........................................................
45%
Chris Christie
..................................................
17%
Not sure
..........................................................
Q7
If the candidates for President next time were
Democrat Joe Biden and Republican Ted Cruz,
who would you vote for?
46%
Joe Biden
........................................................
36%
Ted Cruz
.........................................................
18%
Not sure
..........................................................
Q8
If the candidates for President next time were
Democrat Joe Biden and Republican Rand
Paul, who would you vote for?
45%
Joe Biden
........................................................
38%
Rand Paul
.......................................................
16%
Not sure
..........................................................
Q9
In the last presidential election, did you vote for
Barack Obama or Mitt Romney?
47%
Barack Obama
................................................
46%
Mitt Romney
....................................................
7%
Someone else/Don't remember
......................
http://www.publicpolicypolling.com/pdf/2013/PPP_Release_US_110513.pdf
National Survey Results
Quote
Q1
If the candidates for President next time were
Democrat Hillary Clinton and Republican Jeb
Bush, who would you vote for?
48%
Hillary Clinton
..................................................
39%
Jeb Bush
.........................................................
13%
Not sure
..........................................................
Q2
If the candidates for President next time were
Democrat Hillary Clinton and Republican Chris
Christie, who would you vote for?
44%
Hillary Clinton
..................................................
39%
Chris Christie
..................................................
16%
Not sure
..........................................................
Q3
If the candidates for President next time were
Democrat Hillary Clinton and Republican Ted
Cruz, who would you vote for?
50%
Hillary Clinton
..................................................
33%
Ted Cruz
.........................................................
16%
Not sure
..........................................................
Q4
If the candidates for President next time were
Democrat Hillary Clinton and Republican Rand
Paul, who would you vote for?
49%
Hillary Clinton
..................................................
37%
Rand Paul
.......................................................
14%
Not sure
..........................................................
Q5
If the candidates for President next time were
Democrat Joe Biden and Republican Jeb
Bush, who would you vote for?
42%
Joe Biden
........................................................
43%
Jeb Bush
.........................................................
15%
Not sure
..........................................................
Q6
If the candidates for President next time were
Democrat Joe Biden and Republican Chris
Christie, who would you vote for?
38%
Joe Biden
........................................................
45%
Chris Christie
..................................................
17%
Not sure
..........................................................
Q7
If the candidates for President next time were
Democrat Joe Biden and Republican Ted Cruz,
who would you vote for?
46%
Joe Biden
........................................................
36%
Ted Cruz
.........................................................
18%
Not sure
..........................................................
Q8
If the candidates for President next time were
Democrat Joe Biden and Republican Rand
Paul, who would you vote for?
45%
Joe Biden
........................................................
38%
Rand Paul
.......................................................
16%
Not sure
..........................................................
Q9
In the last presidential election, did you vote for
Barack Obama or Mitt Romney?
47%
Barack Obama
................................................
46%
Mitt Romney
....................................................
7%
Someone else/Don't remember
......................
http://www.publicpolicypolling.com/pdf/2013/PPP_Release_US_110513.pdf
Title: Re: 2016 Official Polling Map Thread
Post by: pbrower2a on November 06, 2013, 08:22:07 AM
Exit poll, NJ gubernatorial election.
http://firstread.nbcnews.com/_news/2013/11/05/21324042-exit-polls-clinton-beats-christie-in-nj-in-potential-2016-matchup
Nothing on anyone else. I would guess that anyone else who has no connection to New Jersey loses New Jersey to Hillary Clinton by a margin in the high teens or even twenties.
blue, Republican -- red, Democratic
30% -- lead with 40-49% but a margin of 3% or less
40% -- lead with 40-49% but a margin of 4% or more
60% -- lead with 50-54%
70% -- lead with 55-59%
90% -- lead with 60% or more
Hillary Clinton vs. Jeb Bush
()
Hillary Clinton vs. Chris Christie
( )
)
Hillary Clinton vs. Rand Paul
()
Hillary Clinton vs. Paul Ryan
()
Quote
If today was a race between Christie and Clinton, exit polls show Christie would not carry his home state. The former secretary of state, senator, and first lady beats Christie, 50 percent to 43 percent.
http://firstread.nbcnews.com/_news/2013/11/05/21324042-exit-polls-clinton-beats-christie-in-nj-in-potential-2016-matchup
Nothing on anyone else. I would guess that anyone else who has no connection to New Jersey loses New Jersey to Hillary Clinton by a margin in the high teens or even twenties.
blue, Republican -- red, Democratic
30% -- lead with 40-49% but a margin of 3% or less
40% -- lead with 40-49% but a margin of 4% or more
60% -- lead with 50-54%
70% -- lead with 55-59%
90% -- lead with 60% or more
Hillary Clinton vs. Jeb Bush
(
Hillary Clinton vs. Chris Christie
(
Hillary Clinton vs. Rand Paul
(
Hillary Clinton vs. Paul Ryan
(
Title: Re: 2016 Official Polling Map Thread
Post by: pbrower2a on November 07, 2013, 11:39:06 AM
PPP will be polling Maine and North Carolina this week. It may (I hope!) still offer some binary matchups in Minnesota and Texas to fill some gaps in the map from extant polls.
Arizona, Florida, Indiana (don't hold your breath!), and Missouri could be interesting.
Arizona, Florida, Indiana (don't hold your breath!), and Missouri could be interesting.
Title: Re: 2016 Official Polling Map Thread
Post by: pbrower2a on November 07, 2013, 01:47:58 PM
Texas, PPP
http://www.publicpolicypolling.com/main/2013/11/mixed-news-for-cruz-in-texas-polling-numbers.html#more
I get to fill two big gaps. The Republican nominee will need to win Texas by about 15% to have a strong chance of winning nationwide.
blue, Republican -- red, Democratic
30% -- lead with 40-49% but a margin of 3% or less
40% -- lead with 40-49% but a margin of 4% or more
60% -- lead with 50-54%
70% -- lead with 55-59%
90% -- lead with 60% or more
Hillary Clinton vs. Jeb Bush
(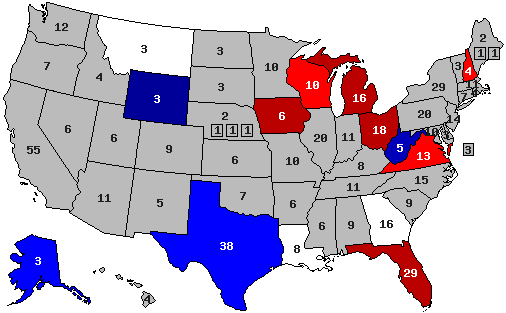 )
)
Hillary Clinton vs. Chris Christie
()
Hillary Clinton vs. Rand Paul
(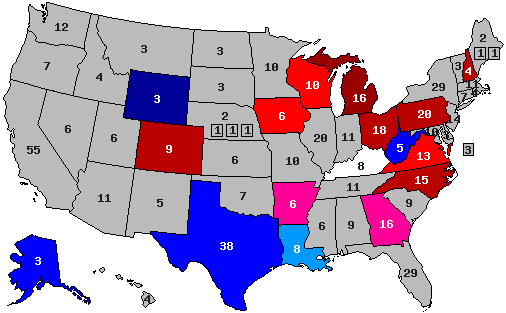 )
)
Hillary Clinton vs. Paul Ryan
()
Quote
Hypothetical Presidential match ups with Hillary Clinton for 2016 are a little bit closer than you might expect for Texas- and the Republicans who do better are the ones from out of state. Jeb Bush polls the strongest against Clinton, leading her 49/42. Chris Christie does next best, leading 44/39, followed by Rand Paul with a 48/44 advantage. Cruz leads Clinton only 48/45, and Rick Perry actually trails her 47/45. The poll numbers are overall brutal for Perry with only 15% of voters in the state thinking he should run for President in 2016 to 73% who think he should sit it out. Even among Republicans only 22% think he should run while 60% say no.
http://www.publicpolicypolling.com/main/2013/11/mixed-news-for-cruz-in-texas-polling-numbers.html#more
I get to fill two big gaps. The Republican nominee will need to win Texas by about 15% to have a strong chance of winning nationwide.
blue, Republican -- red, Democratic
30% -- lead with 40-49% but a margin of 3% or less
40% -- lead with 40-49% but a margin of 4% or more
60% -- lead with 50-54%
70% -- lead with 55-59%
90% -- lead with 60% or more
Hillary Clinton vs. Jeb Bush
(
Hillary Clinton vs. Chris Christie
(
Hillary Clinton vs. Rand Paul
(
Hillary Clinton vs. Paul Ryan
(
Title: Re: 2016 Official Polling Map Thread
Post by: pbrower2a on November 13, 2013, 10:04:48 AM
Approvals for President Obama have slipped badly in Maine, so Republicans ought to be able to stall the Hillary Clinton juggernaut.
Well, not in Maine for now. (PPP)
H Clinton 55 J Bush 32
H Clinton 47 Christie 39
H Clinton 57 T Cruz 30
H Clinton 57 R Paul 32
Nothing on Ryan.
North Carolina:
-Looking ahead to the 2016 Presidential race in North Carolina, Chris Christie is the only Republican who leads Hillary Clinton in the state at this early stage. He's up 46-43. Clinton leads Jeb Bush narrowly in a hypothetical contest (47/43) and then has wider leads over Rand Paul of 9 points (50/41) and Ted Cruz of 12 points (51/39). - See more at: http://www.publicpolicypolling.com/main/2013/11/north-carolina-miscellany.html#more
blue, Republican -- red, Democratic
30% -- lead with 40-49% but a margin of 3% or less
40% -- lead with 40-49% but a margin of 4% or more
60% -- lead with 50-54%
70% -- lead with 55-59%
90% -- lead with 60% or more
Hillary Clinton vs. Jeb Bush
(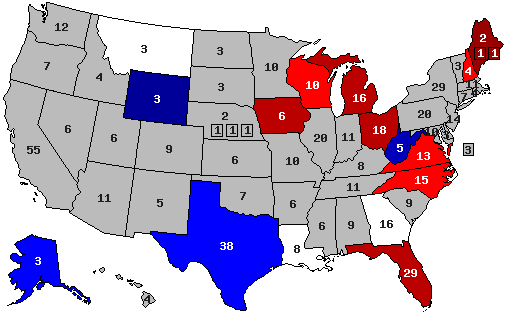 )
)
Hillary Clinton vs. Chris Christie
( )
)
Hillary Clinton vs. Rand Paul
(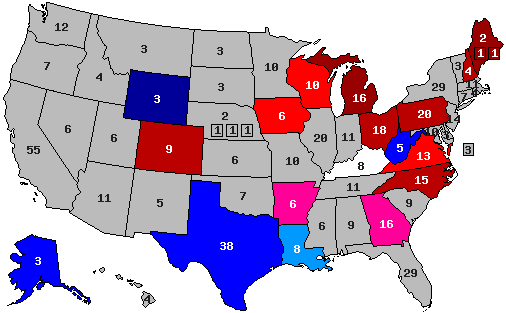 )
)
Hillary Clinton vs. Paul Ryan
()
Well, not in Maine for now. (PPP)
H Clinton 55 J Bush 32
H Clinton 47 Christie 39
H Clinton 57 T Cruz 30
H Clinton 57 R Paul 32
Nothing on Ryan.
North Carolina:
-Looking ahead to the 2016 Presidential race in North Carolina, Chris Christie is the only Republican who leads Hillary Clinton in the state at this early stage. He's up 46-43. Clinton leads Jeb Bush narrowly in a hypothetical contest (47/43) and then has wider leads over Rand Paul of 9 points (50/41) and Ted Cruz of 12 points (51/39). - See more at: http://www.publicpolicypolling.com/main/2013/11/north-carolina-miscellany.html#more
blue, Republican -- red, Democratic
30% -- lead with 40-49% but a margin of 3% or less
40% -- lead with 40-49% but a margin of 4% or more
60% -- lead with 50-54%
70% -- lead with 55-59%
90% -- lead with 60% or more
Hillary Clinton vs. Jeb Bush
(
Hillary Clinton vs. Chris Christie
(
Hillary Clinton vs. Rand Paul
(
Hillary Clinton vs. Paul Ryan
(
Title: Re: 2016 Official Polling Map Thread
Post by: eric82oslo on November 13, 2013, 04:32:56 PM
A new update on November 20 after Mississippi has been polled for the very first time, Colorado for the 4th time and New York for a second time.
Here's an update on November 13 to add the very first Maine poll and the second only North Carolina poll to the list. Hillary leads everyone with huge margins in Maine (even Christie), while North Carolina will be a dog fight with Christie or Bush on the GOP side. With this new poll, North Carolina changed from Democratic gain and back to Republican hold.
So here they are - all the 2016 poll averages for each state so far - 26 states having been polled to date - and how far off they are compared to the actual 2012 outcomes. I'm only including the Republican candidate with the best statewide polling.
Alaska: Hillary vs Jeb Bush: R +7%
+7% D improvement
(Updated on August 4)
Arkansas: Hillary vs Chris Christie: D +2%
+22% D improvement
Current Democratic gain
(Updated on August 11)
Colorado: Hillary vs Christie: R +4%
+9% R improvement
Current Republican gain
Florida: Hillary vs Jeb Bush: D +9%
+8% D improvement
Georgia: Hillary vs Christie: R +2%
+6% D improvement
(Updated August 8 )
Iowa: Hillary vs Christie: D +4%
+2% R improvement
Kansas: Hillary vs Paul Ryan: R +7%
+15% D improvement
Kentucky: Hillary vs Rand Paul: D +2.5%
+25% D improvement
Current Democratic gain
Louisiana: Hillary vs Paul Ryan/Rand Paul: R +1%
+16% D improvement
Maine: Hillary vs Christie: D +8%
+7% R improvement
(Updated on November 13)
Michigan: Hillary vs Christie: D +6%
+3.5% R improvement
Minnesota: Hillary vs Christie: D +6%
+2% R improvement
Mississippi: Hillary vs Christie: R +9%
+2.5% D improvement
Montana: Hillary vs Marco Rubio: R +8%
+6% D improvement
New Hampshire: Hillary vs Christie: D +4.4%
+1.2% R improvement
(Updated with September poll)
New Jersey: Hillary vs Christie: D +7.2%
+10.6% R improvement
(Updated on November 8 )
New York: Hillary vs Christie: D +21.5%
+6.5% R improvement
(Updated on November 19)
North Carolina: Hillary vs Christie: R +3%
+1% R improvement
(Updated on November 13)
Ohio: Hillary vs Christie: D +4.5%
+1.5% R improvement
Pennsylvania: Hillary vs Paul Ryan: D +12%
+7% D improvement
South Carolina: Hillary vs Marco Rubio: R+7%
+3.5% D improvement
(Updated November 2)
Texas: Hillary vs Jeb Bush: R +5%
+11% D improvement
(Updated November 8 )
Virginia: Hillary vs Christie: D +3%
+1% R improvement
West Virginia: Hillary vs Jeb Bush: R +14%
+13% D improvement
(Updated on October 1)
Wisconsin: Hillary vs Jeb Bush: D +4%
+3% R improvement
(Updated with latest October poll, though Bush was not among those polled)
Wyoming: Hillary vs Christie: R +28%
+13% D improvement
Average all 26 states: Hillary vs Best Republican: R +0.06%
+4.1% D improvement (from Obama 2012) [projecting an 7.9% victory for Hillary]
That gives us this map right now:
(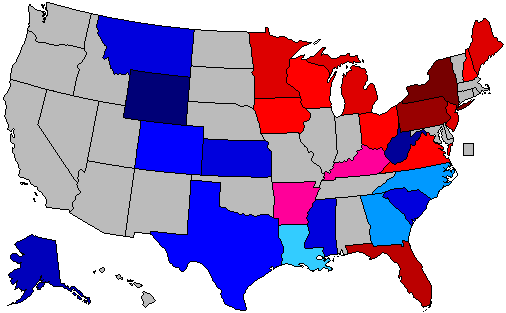 )
)
Red = Democratic lead
Blue = Republican lead
Green = Exact tie
Grey = No polling yet
20% shade = 0-1% lead
30% shade = 1-3% lead
40% shade = 3-6% lead
50% shade = 6-9% lead
60% shade = 9-12% lead
70% shade = 12-15% lead
80% shade = 15-18% lead
90% shade = Above 18% lead
In the count of electoral votes, this means the current situation looks like this:
Hillary: 203 EVs (for a total of 14 states)
Best/Tailormade Republican: 110 EVs (for a total of 12 states)
Toss-up: None
No polling: 225 EVs [almost half, including California] (for a total of 24 states + D.C.)
Which means that Hillary has captured an impressive 64.9% of all EVs awarded thus far, against a disappointing 35.1% EVs for the tailormade Republican. And only New York & Maine of the solidly Democratic states have been polled so far (3 if including New Jersey), against no less than 12 solidly Republican states - the biggest one of them, Texas, included. With California added to Hillary's pie, it'll look even more promising for her. Neither to forget such states as D.C., Vermont, Hawaii & Maryland. It's looking like a landslide right now, even without Colorado being in Hillary's column.
This is how the Trendline Map looks so far:
(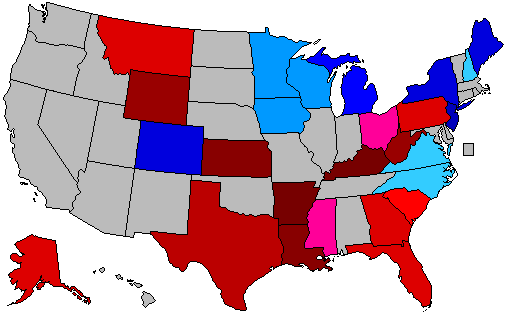 )
)
The states which right now are showing the strongest improvement for the Democratic (Hillary) or the Republican candidate (in 14 out of 25 cases, Christie is that person):
1. Kentucky: D +25%
2. Arkansas: D +22%
3. Louisiana: D +16%
4. Kansas: D +15%
5. West Vriginia: D +13%
6. Wyoming: D +13%
7. Texas: D +11%
8. New Jersey: R +10.6%
9. Colorado: R +9%
10. Florida: D +8%
11. Maine: R +7%
12. Pennsylvania: D +7%
13. Alaska: D +7%
14. New York: R +6.5%
15. Georgia: D +6%
16. Montana: D +6%
All of these changes (in the 16 states above) are (more than) statistically significant. We see that (so far) Texas is experiencing a much more rapid change than other demographically quick-changing states like Florida and Georgia. Unfortunately, the 4th quick-changing traditionally Republican state, Arizona, has still not been polled.
The strong D improvement in the Appalachian south (Kentucky, Arkansas, Louisiana, West Virginia, Pennsylvania, Ohio (Texas & South Carolina)), makes me curious to see how geographically similar states like Tennessee, Missouri, Indiana and Illinois will play out in their first poll(s). I'm feeling quite confident that all of these 4 states will move considerably towards Hillary as well, although Illinois might possibly be less certain than the first three, as Obama used the state as his campaign base in both of his elections.
The only non-candidate states (excluding New Jersey & Wisconsin) which have moved considerably towards Republican candidate(s) so far, have been Colorado, Maine & New York. It will be interesting to see why this sole and very important swing state is bucking the trend which is occurring in almost the entire rest of the United States.
The whole list of states having been polled till now, going from Democratic stronghold to Republican stronghold:
New York: D +21.5%
Pennsylvania: D +12%
Florida: D +9%
Maine: D +8%
New Jersey: D +7.2% (including Exit Poll from Governor's race)
Michigan: D +6%
Minnesota: D +6%
Ohio: D +4.5%
New Hampshire: D +4.4%
Wisconsin: D +4%
Iowa: D +4%
Virginia: D +3%
Kentucky: D +2.5%
Arkansas: D +2%
Louisiana: R +1%
Georgia: R +2%
North Carolina: R +3%
Colorado: R +4%
Texas: R +5%
Alaska: R +7%
South Carolina: R +7%
Kansas: R +7%
Montana: R +8%
Mississippi: R +9%
West Virginia: R +14%
Wyoming: R +28%
All lists and numbers above are based on no less than 66 individual polls from different pollsters. The vast majority of them conducted in 2013.
Last updated on November 20.
Here's an update on November 13 to add the very first Maine poll and the second only North Carolina poll to the list. Hillary leads everyone with huge margins in Maine (even Christie), while North Carolina will be a dog fight with Christie or Bush on the GOP side. With this new poll, North Carolina changed from Democratic gain and back to Republican hold.
So here they are - all the 2016 poll averages for each state so far - 26 states having been polled to date - and how far off they are compared to the actual 2012 outcomes. I'm only including the Republican candidate with the best statewide polling.
Alaska: Hillary vs Jeb Bush: R +7%
+7% D improvement
(Updated on August 4)
Arkansas: Hillary vs Chris Christie: D +2%
+22% D improvement
Current Democratic gain
(Updated on August 11)
Colorado: Hillary vs Christie: R +4%
+9% R improvement
Current Republican gain
Florida: Hillary vs Jeb Bush: D +9%
+8% D improvement
Georgia: Hillary vs Christie: R +2%
+6% D improvement
(Updated August 8 )
Iowa: Hillary vs Christie: D +4%
+2% R improvement
Kansas: Hillary vs Paul Ryan: R +7%
+15% D improvement
Kentucky: Hillary vs Rand Paul: D +2.5%
+25% D improvement
Current Democratic gain
Louisiana: Hillary vs Paul Ryan/Rand Paul: R +1%
+16% D improvement
Maine: Hillary vs Christie: D +8%
+7% R improvement
(Updated on November 13)
Michigan: Hillary vs Christie: D +6%
+3.5% R improvement
Minnesota: Hillary vs Christie: D +6%
+2% R improvement
Mississippi: Hillary vs Christie: R +9%
+2.5% D improvement
Montana: Hillary vs Marco Rubio: R +8%
+6% D improvement
New Hampshire: Hillary vs Christie: D +4.4%
+1.2% R improvement
(Updated with September poll)
New Jersey: Hillary vs Christie: D +7.2%
+10.6% R improvement
(Updated on November 8 )
New York: Hillary vs Christie: D +21.5%
+6.5% R improvement
(Updated on November 19)
North Carolina: Hillary vs Christie: R +3%
+1% R improvement
(Updated on November 13)
Ohio: Hillary vs Christie: D +4.5%
+1.5% R improvement
Pennsylvania: Hillary vs Paul Ryan: D +12%
+7% D improvement
South Carolina: Hillary vs Marco Rubio: R+7%
+3.5% D improvement
(Updated November 2)
Texas: Hillary vs Jeb Bush: R +5%
+11% D improvement
(Updated November 8 )
Virginia: Hillary vs Christie: D +3%
+1% R improvement
West Virginia: Hillary vs Jeb Bush: R +14%
+13% D improvement
(Updated on October 1)
Wisconsin: Hillary vs Jeb Bush: D +4%
+3% R improvement
(Updated with latest October poll, though Bush was not among those polled)
Wyoming: Hillary vs Christie: R +28%
+13% D improvement
Average all 26 states: Hillary vs Best Republican: R +0.06%
+4.1% D improvement (from Obama 2012) [projecting an 7.9% victory for Hillary]
That gives us this map right now:
(
Red = Democratic lead
Blue = Republican lead
Green = Exact tie
Grey = No polling yet
20% shade = 0-1% lead
30% shade = 1-3% lead
40% shade = 3-6% lead
50% shade = 6-9% lead
60% shade = 9-12% lead
70% shade = 12-15% lead
80% shade = 15-18% lead
90% shade = Above 18% lead
In the count of electoral votes, this means the current situation looks like this:
Hillary: 203 EVs (for a total of 14 states)
Best/Tailormade Republican: 110 EVs (for a total of 12 states)
Toss-up: None
No polling: 225 EVs [almost half, including California] (for a total of 24 states + D.C.)
Which means that Hillary has captured an impressive 64.9% of all EVs awarded thus far, against a disappointing 35.1% EVs for the tailormade Republican. And only New York & Maine of the solidly Democratic states have been polled so far (3 if including New Jersey), against no less than 12 solidly Republican states - the biggest one of them, Texas, included. With California added to Hillary's pie, it'll look even more promising for her. Neither to forget such states as D.C., Vermont, Hawaii & Maryland. It's looking like a landslide right now, even without Colorado being in Hillary's column.
This is how the Trendline Map looks so far:
(
The states which right now are showing the strongest improvement for the Democratic (Hillary) or the Republican candidate (in 14 out of 25 cases, Christie is that person):
1. Kentucky: D +25%
2. Arkansas: D +22%
3. Louisiana: D +16%
4. Kansas: D +15%
5. West Vriginia: D +13%
6. Wyoming: D +13%
7. Texas: D +11%
8. New Jersey: R +10.6%
9. Colorado: R +9%
10. Florida: D +8%
11. Maine: R +7%
12. Pennsylvania: D +7%
13. Alaska: D +7%
14. New York: R +6.5%
15. Georgia: D +6%
16. Montana: D +6%
All of these changes (in the 16 states above) are (more than) statistically significant. We see that (so far) Texas is experiencing a much more rapid change than other demographically quick-changing states like Florida and Georgia. Unfortunately, the 4th quick-changing traditionally Republican state, Arizona, has still not been polled.
The strong D improvement in the Appalachian south (Kentucky, Arkansas, Louisiana, West Virginia, Pennsylvania, Ohio (Texas & South Carolina)), makes me curious to see how geographically similar states like Tennessee, Missouri, Indiana and Illinois will play out in their first poll(s). I'm feeling quite confident that all of these 4 states will move considerably towards Hillary as well, although Illinois might possibly be less certain than the first three, as Obama used the state as his campaign base in both of his elections.
The only non-candidate states (excluding New Jersey & Wisconsin) which have moved considerably towards Republican candidate(s) so far, have been Colorado, Maine & New York. It will be interesting to see why this sole and very important swing state is bucking the trend which is occurring in almost the entire rest of the United States.
The whole list of states having been polled till now, going from Democratic stronghold to Republican stronghold:
New York: D +21.5%
Pennsylvania: D +12%
Florida: D +9%
Maine: D +8%
New Jersey: D +7.2% (including Exit Poll from Governor's race)
Michigan: D +6%
Minnesota: D +6%
Ohio: D +4.5%
New Hampshire: D +4.4%
Wisconsin: D +4%
Iowa: D +4%
Virginia: D +3%
Kentucky: D +2.5%
Arkansas: D +2%
Louisiana: R +1%
Georgia: R +2%
North Carolina: R +3%
Colorado: R +4%
Texas: R +5%
Alaska: R +7%
South Carolina: R +7%
Kansas: R +7%
Montana: R +8%
Mississippi: R +9%
West Virginia: R +14%
Wyoming: R +28%
All lists and numbers above are based on no less than 66 individual polls from different pollsters. The vast majority of them conducted in 2013.
Last updated on November 20.
Title: Re: 2016 Official Polling Map Thread
Post by: pbrower2a on November 17, 2013, 10:34:42 PM
That gives us this map right now:
(
Red = Democratic lead
Blue = Republican lead
Green = Exact tie
Grey = No polling yet (orange -- D sure things -- 139 electoral votes)
Title: Re: 2016 Official Polling Map Thread
Post by: pbrower2a on November 18, 2013, 07:03:30 AM
Siena, New York
Christie trails Hillary Clinton 56 - 40 percent and he leads Cuomo 47 - 42 percent
Only one data point, and only a subtle change, but it is in a huge state electorally. So much for Andrew Cuomo as a possible President. More significantly this is by a pollster that we haven't seen for some time.
http://www.siena.edu/uploadedfiles/home/parents_and_community/community_page/sri/sny_poll/SNY%20November%202013%20Poll%20Release%20--%20FINAL.pdf
blue, Republican -- red, Democratic
30% -- lead with 40-49% but a margin of 3% or less
40% -- lead with 40-49% but a margin of 4% or more
60% -- lead with 50-54%
70% -- lead with 55-59%
90% -- lead with 60% or more
Hillary Clinton vs. Jeb Bush
()
Hillary Clinton vs. Chris Christie
(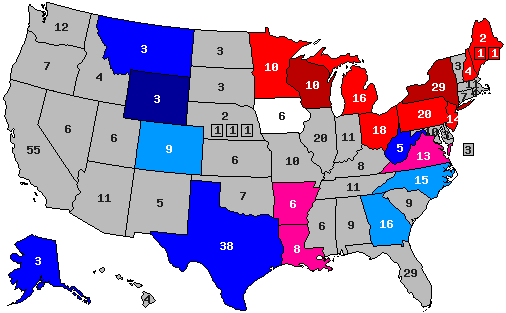 )
)
Hillary Clinton vs. Rand Paul
()
Hillary Clinton vs. Paul Ryan
()
Christie trails Hillary Clinton 56 - 40 percent and he leads Cuomo 47 - 42 percent
Only one data point, and only a subtle change, but it is in a huge state electorally. So much for Andrew Cuomo as a possible President. More significantly this is by a pollster that we haven't seen for some time.
http://www.siena.edu/uploadedfiles/home/parents_and_community/community_page/sri/sny_poll/SNY%20November%202013%20Poll%20Release%20--%20FINAL.pdf
blue, Republican -- red, Democratic
30% -- lead with 40-49% but a margin of 3% or less
40% -- lead with 40-49% but a margin of 4% or more
60% -- lead with 50-54%
70% -- lead with 55-59%
90% -- lead with 60% or more
Hillary Clinton vs. Jeb Bush
(
Hillary Clinton vs. Chris Christie
(
Hillary Clinton vs. Rand Paul
(
Hillary Clinton vs. Paul Ryan
(
Title: Re: 2016 Official Polling Map Thread
Post by: Tender Branson on November 18, 2013, 08:14:02 AM
Siena, New York
Christie trails Hillary Clinton 56 - 40 percent and he leads Cuomo 47 - 42 percent
Only one data point, and only a subtle change, but it is in a huge state electorally. So much for Andrew Cuomo as a possible President. More significantly this is by a pollster that we haven't seen for some time.
Christie trails Hillary Clinton 56 - 40 percent and he leads Cuomo 47 - 42 percent
Only one data point, and only a subtle change, but it is in a huge state electorally. So much for Andrew Cuomo as a possible President. More significantly this is by a pollster that we haven't seen for some time.
I think this only shows that NYers want Cuomo to stick as their Governor and not run for President, when they already have Hillary for that.
If Cuomo were the DEM nominee, he would do no worse than Obama though in NY ...
Also: You need to re-color NJ, because the Exit Poll showed Clinton leading Christie there by only 48-44.
Title: Re: 2016 Official Polling Map Thread
Post by: pbrower2a on November 18, 2013, 06:28:42 PM
Siena, New York
Christie trails Hillary Clinton 56 - 40 percent and he leads Cuomo 47 - 42 percent
Only one data point, and only a subtle change, but it is in a huge state electorally. So much for Andrew Cuomo as a possible President. More significantly this is by a pollster that we haven't seen for some time.
Christie trails Hillary Clinton 56 - 40 percent and he leads Cuomo 47 - 42 percent
Only one data point, and only a subtle change, but it is in a huge state electorally. So much for Andrew Cuomo as a possible President. More significantly this is by a pollster that we haven't seen for some time.
I think this only shows that NYers want Cuomo to stick as their Governor and not run for President, when they already have Hillary for that.
If Cuomo were the DEM nominee, he would do no worse than Obama though in NY ...
Also: You need to re-color NJ, because the Exit Poll showed Clinton leading Christie there by only 48-44.
Done on the most recent map.
Title: Re: 2016 Official Polling Map Thread
Post by: eric82oslo on November 19, 2013, 04:08:42 PM
If you want more new states to be polled by PPP next weekend, you guys need to vote for either Illinois, Maryland, New Mexico or Connecticut at the top right side of this page:
http://publicpolicypolling.com/
Thanks. :)
Disappointed that Arizona isn't one of the available offers though...
http://publicpolicypolling.com/
Thanks. :)
Disappointed that Arizona isn't one of the available offers though...
Title: Re: 2016 Official Polling Map Thread
Post by: pbrower2a on November 20, 2013, 10:27:52 AM
Quinnipiac, Colorado:
http://www.quinnipiac.edu/institutes-and-centers/polling-institute/colorado/release-detail?ReleaseID=1978
blue, Republican -- red, Democratic
30% -- lead with 40-49% but a margin of 3% or less
40% -- lead with 40-49% but a margin of 4% or more
60% -- lead with 50-54%
70% -- lead with 55-59%
90% -- lead with 60% or more
Hillary Clinton vs. Jeb Bush
()
Hillary Clinton vs. Chris Christie
(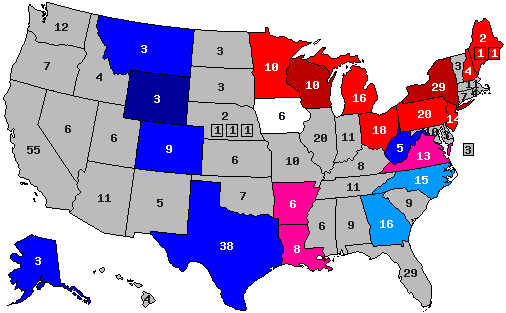 )
)
Hillary Clinton vs. Rand Paul
(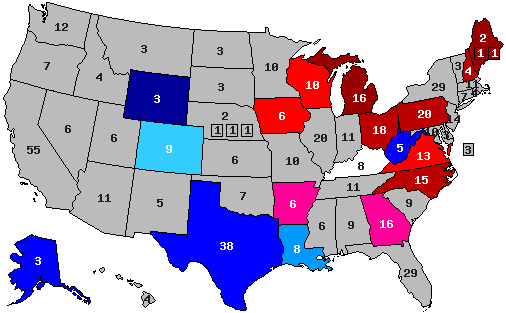 )
)
Hillary Clinton vs. Paul Ryan
(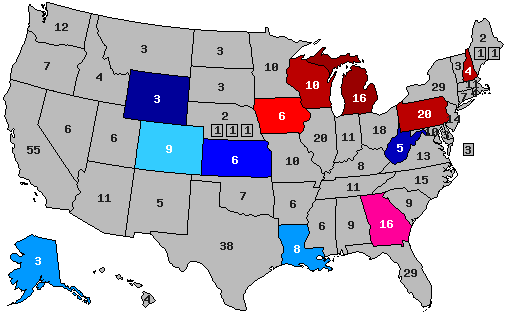 )
)
Quote
In an early look at the 2016 race for the White House, New Jersey Republican Gov. Christopher Christie tops former Secretary of State Hillary Clinton 46 - 38 percent in Colorado, according to a Quinnipiac University poll released today.
This compares to results of an August 23 survey by the independent Quinnipiac (KWIN- uh-pe-ack) University, showing Gov. Christie with 43 percent and Secretary Clinton at 42 percent, a tie.
In today's survey, Clinton runs neck and with other possible Republican candidates;
Clinton at 44 percent to 47 percent for U.S. Sen. Rand Paul of Kentucky;
Clinton and U.S. Sen. Ted Cruz of Texas tied at 44 - 44 percent;
Clinton at 43 percent to 45 percent for U.S. Rep. Paul Ryan of Wisconsin.
http://www.quinnipiac.edu/institutes-and-centers/polling-institute/colorado/release-detail?ReleaseID=1978
blue, Republican -- red, Democratic
30% -- lead with 40-49% but a margin of 3% or less
40% -- lead with 40-49% but a margin of 4% or more
60% -- lead with 50-54%
70% -- lead with 55-59%
90% -- lead with 60% or more
Hillary Clinton vs. Jeb Bush
(
Hillary Clinton vs. Chris Christie
(
Hillary Clinton vs. Rand Paul
(
Hillary Clinton vs. Paul Ryan
(
Title: Re: 2016 Official Polling Map Thread
Post by: pbrower2a on November 20, 2013, 03:43:35 PM
Could Hillary Clinton be the first Democratic nominee for President to win Mississippi since Jimmy Carter did in 1976?
http://www.publicpolicypolling.com/main/2013/11/mississippi-cruz-has-a-slim-lead-in-the-primary-and-general.html
Highly unlikely.
blue, Republican -- red, Democratic
30% -- lead with 40-49% but a margin of 3% or less
40% -- lead with 40-49% but a margin of 4% or more
60% -- lead with 50-54%
70% -- lead with 55-59%
90% -- lead with 60% or more
Hillary Clinton vs. Jeb Bush
(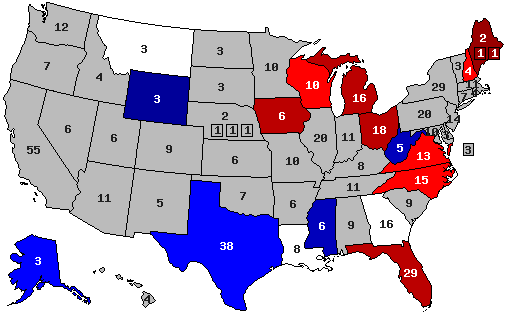 )
)
Hillary Clinton vs. Chris Christie
(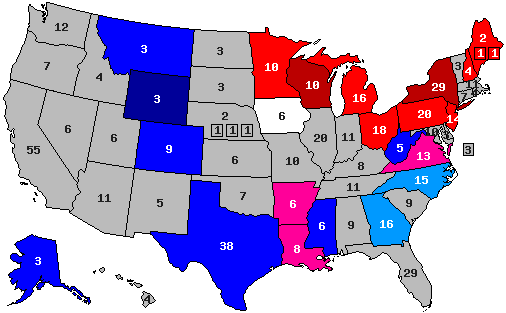 )
)
Hillary Clinton vs. Rand Paul
( )
)
Hillary Clinton vs. Paul Ryan
()
Quote
Q3 If the candidates for President next time were
Democrat Hillary Clinton and Republican Jeb
Bush, who would you vote for?
Hillary Clinton.................................................. 42%
Jeb Bush......................................................... 50%
Not sure .......................................................... 8%
Q4 If the candidates for President next time were
Democrat Hillary Clinton and Republican Chris
Christie, who would you vote for?
Hillary Clinton.................................................. 40%
Chris Christie .................................................. 49%
Not sure .......................................................... 11%
Q5 If the candidates for President next time were
Democrat Hillary Clinton and Republican Ted
Cruz, who would you vote for?
Hillary Clinton.................................................. 45%
Ted Cruz ......................................................... 47%
Not sure .......................................................... 9%
Q6 If the candidates for President next time were
Democrat Hillary Clinton and Republican Rand
Paul, who would you vote for?
Hillary Clinton.................................................. 44%
Rand Paul ....................................................... 46%
Not sure .......................................................... 10%
http://www.publicpolicypolling.com/main/2013/11/mississippi-cruz-has-a-slim-lead-in-the-primary-and-general.html
Highly unlikely.
blue, Republican -- red, Democratic
30% -- lead with 40-49% but a margin of 3% or less
40% -- lead with 40-49% but a margin of 4% or more
60% -- lead with 50-54%
70% -- lead with 55-59%
90% -- lead with 60% or more
Hillary Clinton vs. Jeb Bush
(
Hillary Clinton vs. Chris Christie
(
Hillary Clinton vs. Rand Paul
(
Hillary Clinton vs. Paul Ryan
(
Title: Re: 2016 Official Polling Map Thread
Post by: JerryArkansas on November 20, 2013, 04:53:11 PM
I think you should add Ted Cruz and get rid of Ryan. Hardly anyone polling on him anymore.
Title: Re: 2016 Official Polling Map Thread
Post by: eric82oslo on November 20, 2013, 05:02:50 PM
Average all 26 states: Hillary vs Best Republican: R +0.06%
+4.1% D improvement (from Obama 2012) [projecting an 7.9% victory for Hillary]
Even with Mississippi Christie numbers released, still looking good for Hillary. :P
Title: Re: 2016 Official Polling Map Thread
Post by: pbrower2a on November 21, 2013, 01:14:57 AM
I think you should add Ted Cruz and get rid of Ryan. Hardly anyone polling on him anymore.
I am in no rush to dump Ryan. I have suggested that PPP poll Illinois to see how both high-profile Wisconsin pols would do in Illinois. One is Paul Ryan; the other is Scott Walker.
I see Cruz doing uniformly badly, so his credibility as a candidate is unsupported. About all I can say is that he could win the Presidency if the 2016 election is ragged in much the same way as elections are rigged in Ted's father's native land.
Title: Re: 2016 Official Polling Map Thread
Post by: pbrower2a on November 22, 2013, 05:57:56 AM
Montana is almost all bad news for Democrats. The Democratic Governor is popular, but such is the only good news for the Democrats in Montana.
http://www.publicpolicypolling.com/pdf/2013/PPP_Release_MT_112113.pdf
blue, Republican -- red, Democratic
30% -- lead with 40-49% but a margin of 3% or less
40% -- lead with 40-49% but a margin of 4% or more
60% -- lead with 50-54%
70% -- lead with 55-59%
90% -- lead with 60% or more
Hillary Clinton vs. Jeb Bush
( )
)
Hillary Clinton vs. Chris Christie
(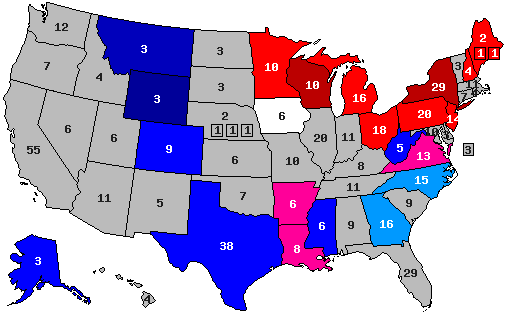 )
)
Hillary Clinton vs. Rand Paul
(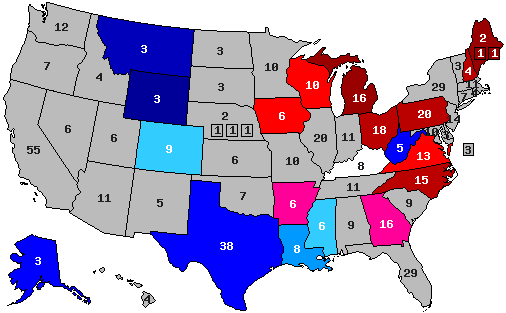 )
)
Hillary Clinton vs. Paul Ryan
()
Quote
Chris Christie .................................................. 51%
Hillary Clinton.................................................. 34%
Rand Paul ....................................................... 52%
Hillary Clinton.................................................. 39%
Ted Cruz ......................................................... 50%
Hillary Clinton.................................................. 39%
Jeb Bush......................................................... 49%
Hillary Clinton.................................................. 38%
http://www.publicpolicypolling.com/pdf/2013/PPP_Release_MT_112113.pdf
blue, Republican -- red, Democratic
30% -- lead with 40-49% but a margin of 3% or less
40% -- lead with 40-49% but a margin of 4% or more
60% -- lead with 50-54%
70% -- lead with 55-59%
90% -- lead with 60% or more
Hillary Clinton vs. Jeb Bush
(
Hillary Clinton vs. Chris Christie
(
Hillary Clinton vs. Rand Paul
(
Hillary Clinton vs. Paul Ryan
(
Title: Re: 2016 Official Polling Map Thread
Post by: pbrower2a on November 22, 2013, 08:46:28 AM
Quinnipiac, Florida:
Even though
Such does not make a Republican win of Florida in 2016 now look likely:
http://www.quinnipiac.edu/institutes-and-centers/polling-institute/florida/release-detail?ReleaseID=1980
blue, Republican -- red, Democratic
30% -- lead with 40-49% but a margin of 3% or less
40% -- lead with 40-49% but a margin of 4% or more
60% -- lead with 50-54%
70% -- lead with 55-59%
90% -- lead with 60% or more
Hillary Clinton vs. Jeb Bush
(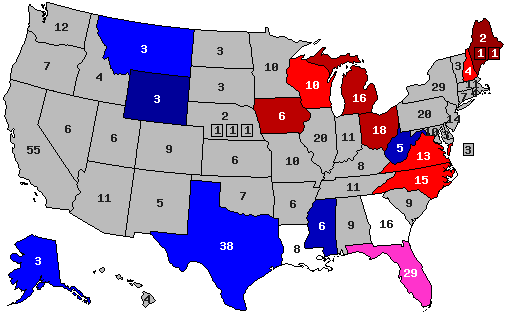 )
)
Hillary Clinton vs. Chris Christie
( )
)
Hillary Clinton vs. Rand Paul
(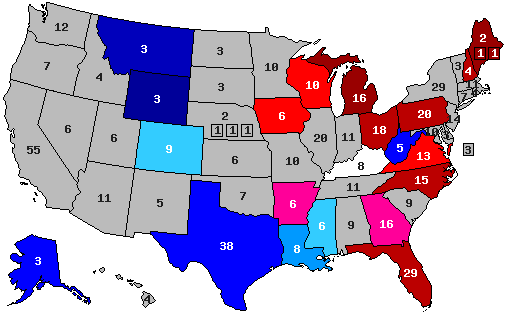 )
)
Hillary Clinton vs. Paul Ryan
(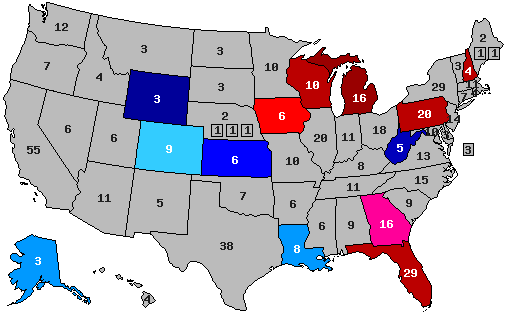 )
)
Even though
Quote
Florida voters disapprove 57 - 40 percent of the job President Barack Obama is doing, matching his all-time worst score, a 57 - 39 percent disapproval, in a September 22, 2011, Quinnipiac University poll.
Such does not make a Republican win of Florida in 2016 now look likely:
Quote
Head to head, Clinton gets 47 percent to Bush's 45 percent. She tops other Republicans:
45 - 41 percent over Christie;
50 - 43 percent over Rubio;
51 - 41 percent over U.S. Sen. Rand Paul of Kentucky;
50 - 42 percent over U.S. Rep. Paul Ryan of Wisconsin;
52 - 36 percent over Cruz.
45 - 41 percent over Christie;
50 - 43 percent over Rubio;
51 - 41 percent over U.S. Sen. Rand Paul of Kentucky;
50 - 42 percent over U.S. Rep. Paul Ryan of Wisconsin;
52 - 36 percent over Cruz.
http://www.quinnipiac.edu/institutes-and-centers/polling-institute/florida/release-detail?ReleaseID=1980
blue, Republican -- red, Democratic
30% -- lead with 40-49% but a margin of 3% or less
40% -- lead with 40-49% but a margin of 4% or more
60% -- lead with 50-54%
70% -- lead with 55-59%
90% -- lead with 60% or more
Hillary Clinton vs. Jeb Bush
(
Hillary Clinton vs. Chris Christie
(
Hillary Clinton vs. Rand Paul
(
Hillary Clinton vs. Paul Ryan
(
Title: Re: 2016 Official Polling Map Thread
Post by: pbrower2a on November 22, 2013, 09:02:25 AM
I think you should add Ted Cruz and get rid of Ryan. Hardly anyone polling on him anymore.
I dumped Marco Rubio because he was stumbling around badly, and nobody was talking about him as Presidential material. People were talking about the next-to-last Republican nominee for Vice-President for a long time... and Paul Ryan hasn't made a fool of himself yet. Well, at least not as badly as Rick Perry or Marco Rubio.
As you can see, Quinnipiac just polled Florida for several binary matchups between Hillary Clinton and several imaginable Republican nominees. Paul Ryan was one of them. Florida is a surprisingly-good microcosm of America.
I can dump Ryan in favor of Cruz -- but so far I see Cruz doing badly just about everywhere that is not a sure R state.
Title: Re: 2016 Official Polling Map Thread
Post by: Tender Branson on November 22, 2013, 09:11:55 AM
pbrower, Hillary leads Bush 47-45 in the new Quinnipiac poll.
You need to change the Hillary/Bush map to a 40% shade.
You need to change the Hillary/Bush map to a 40% shade.
Title: Re: 2016 Official Polling Map Thread
Post by: Mr. Morden on November 23, 2013, 07:42:00 AM
Update on the latest statewide polls of Christie vs. Clinton:
AK: Christie +8
AR: Clinton +2
CO: Christie +8
FL: Clinton +4
GA: Christie +2
IA: tie
LA: Clinton +1
ME: Clinton +8
MI: Clinton +6
MN: Clinton +6
MS: Christie +9
MT: Christie +17
NH: Clinton +4
NJ: Clinton +4
NC: Christie +3
NY: Clinton +16
OH: Clinton +9
PA: Clinton +5
SC: Christie +5
TX: Christie +5
VA: Clinton +2
WV: Christie +9
WI: Clinton +10
WY: Christie +28
Clinton leads by 4 in FL, NH, and NJ. If all of these polls reflected the true results, one of those three would be the "tipping point state".
The swing from the 2012 election would then be:
AK: D+6
AR: D+26
CO: R+13
FL: D+3
GA: D+6
IA: R+6
LA: D+21
ME: R+7
MI: R+3
MN: R+1
MS: D+3
MT: R+3
NH: R+2
NJ: R+14
NC: R+1
NY: R+10
OH: D+6
PA: no change
SC: D+5
TX: D+11
VA: R+2
WV: D+18
WI: D+3
WY: D+13
( )
)
AK: Christie +8
AR: Clinton +2
CO: Christie +8
FL: Clinton +4
GA: Christie +2
IA: tie
LA: Clinton +1
ME: Clinton +8
MI: Clinton +6
MN: Clinton +6
MS: Christie +9
MT: Christie +17
NH: Clinton +4
NJ: Clinton +4
NC: Christie +3
NY: Clinton +16
OH: Clinton +9
PA: Clinton +5
SC: Christie +5
TX: Christie +5
VA: Clinton +2
WV: Christie +9
WI: Clinton +10
WY: Christie +28
Clinton leads by 4 in FL, NH, and NJ. If all of these polls reflected the true results, one of those three would be the "tipping point state".
The swing from the 2012 election would then be:
AK: D+6
AR: D+26
CO: R+13
FL: D+3
GA: D+6
IA: R+6
LA: D+21
ME: R+7
MI: R+3
MN: R+1
MS: D+3
MT: R+3
NH: R+2
NJ: R+14
NC: R+1
NY: R+10
OH: D+6
PA: no change
SC: D+5
TX: D+11
VA: R+2
WV: D+18
WI: D+3
WY: D+13
(
Title: Re: 2016 Official Polling Map Thread
Post by: pbrower2a on November 23, 2013, 11:56:54 AM
pbrower, Hillary leads Bush 47-45 in the new Quinnipiac poll.
You need to change the Hillary/Bush map to a 40% shade.
You need to change the Hillary/Bush map to a 40% shade.
20% shade because the lead is only 2% with less than 50%. The correction is made.
That said, if she is doing that well against a former governor of Florida who wasn't that bad... then Hillary Clinton can overcome the usual Favorite Son effect. Against Jeb Bush she could win easily without Florida because she would have excellent chances of winning at least three states (North Carolina, Ohio, and Virginia) that a Republican nominee absolutely must win to have a chance. Basically she would have to win one of those three states (If I were her I would not count on Colorado), and Florida would be the difference between winning 300 and winning 329 electoral votes. If Rick Scott is still Governor, he probably 'delivers' Florida to the GOP through means other than campaigning.
The last poll of Georgia had a tie between Hillary and Jeb. Such may show the relevance of the Favorite Son.
Title: Re: 2016 Official Polling Map Thread
Post by: eric82oslo on November 23, 2013, 06:44:11 PM
Once again time to update, after the releases of two more polls, one in Virginia, the other in New York. The number of total state polls added to the lists below has now reached 70.
One more update, on November 24, to include the two latest polls of Montana and Florida. Both polls are very god news for Republicans, in the sense that Hillary's Florida lead has been cut in more than half and GOP's lead in Montana has increased by 5% as well.
So here they are - all the 2016 poll averages for each state so far - 26 states having been polled to date - and how far off they are compared to the actual 2012 outcomes. I'm only including the Republican candidate with the best statewide polling.
Alaska: Hillary vs Jeb Bush: R +7%
+7% D improvement
(Updated on August 4)
Arkansas: Hillary vs Chris Christie: D +2%
+22% D improvement
Current Democratic gain
(Updated on August 11)
Colorado: Hillary vs Christie: R +4%
+9% R improvement
Current Republican gain
Florida: Hillary vs Christie: D +4%
+3% D improvement
(Updated on November 24)
Georgia: Hillary vs Christie: R +2%
+6% D improvement
(Updated August 8 )
Iowa: Hillary vs Christie: D +4%
+2% R improvement
Kansas: Hillary vs Paul Ryan: R +7%
+15% D improvement
Kentucky: Hillary vs Rand Paul: D +2.5%
+25% D improvement
Current Democratic gain
Louisiana: Hillary vs Paul Ryan/Rand Paul: R +1%
+16% D improvement
Maine: Hillary vs Christie: D +8%
+7% R improvement
(Updated on November 13)
Michigan: Hillary vs Christie: D +6%
+3.5% R improvement
Minnesota: Hillary vs Christie: D +6%
+2% R improvement
Mississippi: Hillary vs Christie: R +9%
+2.5% D improvement
Montana: Hillary vs Rand Paul: R +13%
+1% D improvement
(Updated on November 24)
New Hampshire: Hillary vs Christie: D +4.4%
+1.2% R improvement
(Updated with September poll)
New Jersey: Hillary vs Christie: D +7.2%
+10.6% R improvement
(Updated on November 8 )
New York: Hillary vs Christie: D +20.3%
+7.9% R improvement
(Updated on November 26)
North Carolina: Hillary vs Christie: R +3%
+1% R improvement
(Updated on November 13)
Ohio: Hillary vs Christie: D +4.5%
+1.5% R improvement
Pennsylvania: Hillary vs Paul Ryan: D +12%
+7% D improvement
South Carolina: Hillary vs Marco Rubio: R+7%
+3.5% D improvement
(Updated November 2)
Texas: Hillary vs Jeb Bush: R +5%
+11% D improvement
(Updated November 8 )
Virginia: Hillary vs Christie: D +2.5%
+1.4% R improvement
(Updated on November 26)
West Virginia: Hillary vs Jeb Bush: R +14%
+13% D improvement
(Updated on October 1)
Wisconsin: Hillary vs Jeb Bush: D +4%
+3% R improvement
(Updated with latest October poll, though Bush was not among those polled)
Wyoming: Hillary vs Christie: R +28%
+13% D improvement
Average all 26 states: Hillary vs Best Republican: R +0.5%
+3.65% D improvement (from Obama 2012) [projecting an 7.5% victory for Hillary]
That gives us this map right now:
( )
)
Red = Democratic lead
Blue = Republican lead
Green = Exact tie
Grey = No polling yet
20% shade = 0-1% lead
30% shade = 1-3% lead
40% shade = 3-6% lead
50% shade = 6-9% lead
60% shade = 9-12% lead
70% shade = 12-15% lead
80% shade = 15-18% lead
90% shade = Above 18% lead
In the count of electoral votes, this means the current situation looks like this:
Hillary: 203 EVs (for a total of 14 states)
Best/Tailormade Republican: 110 EVs (for a total of 12 states)
Toss-up: None
No polling: 225 EVs [almost half, including California] (for a total of 24 states + D.C.)
Which means that Hillary has captured an impressive 64.9% of all EVs awarded thus far, against a disappointing 35.1% EVs for the tailormade Republican. And only New York & Maine of the solidly Democratic states have been polled so far (3 if including New Jersey), against no less than 12 solidly Republican states - the biggest one of them, Texas, included. With California added to Hillary's pie, it'll look even more promising for her. Neither to forget such states as D.C., Vermont, Hawaii & Maryland. It's looking like a landslide right now, even without Colorado being in Hillary's column.
This is how the Trendline Map looks so far:
(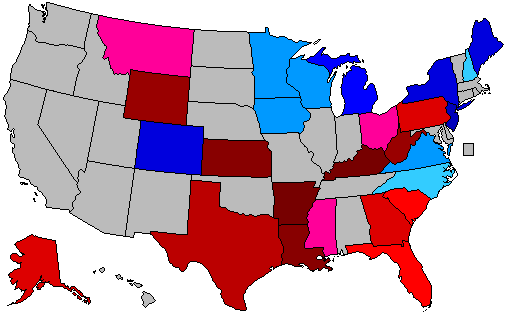 )
)
The states which right now are showing the strongest improvement for the Democratic (Hillary) or the Republican candidate (in 16 out of 26 cases, Christie is that person):
1. Kentucky: D +25%
2. Arkansas: D +22%
3. Louisiana: D +16%
4. Kansas: D +15%
5. West Vriginia: D +13%
6. Wyoming: D +13%
7. Texas: D +11%
8. New Jersey: R +10.6%
9. Colorado: R +9%
10. New York: R +7.9%
11. Maine: R +7%
12. Pennsylvania: D +7%
13. Alaska: D +7%
14. Georgia: D +6%
All of these changes (in the 14 states above) are (more than) statistically significant. We see that (so far) Texas is experiencing a much more rapid change than other demographically quick-changing states like Florida and Georgia. Unfortunately, the 4th quick-changing traditionally Republican state, Arizona, has still not been polled.
The strong D improvement in the Appalachian south (Kentucky, Arkansas, Louisiana, West Virginia, Pennsylvania, Ohio (Texas & South Carolina)), makes me curious to see how geographically similar states like Tennessee, Missouri, Indiana and Illinois will play out in their first poll(s). I'm feeling quite confident that all of these 4 states will move considerably towards Hillary as well, although Illinois might possibly be less certain than the first three, as Obama used the state as his campaign base in both of his elections.
The only non-candidate states (excluding New Jersey & Wisconsin) which have moved considerably towards Republican candidate(s) so far, have been Colorado, Maine & New York. It will be interesting to see why this sole and very important swing state is bucking the trend which is occurring in almost the entire rest of the United States.
The whole list of states having been polled till now, going from Democratic stronghold to Republican stronghold:
New York: D +20.3%
Pennsylvania: D +12%
Maine: D +8%
New Jersey: D +7.2% (including Exit Poll from Governor's race)
Michigan: D +6%
Minnesota: D +6%
Ohio: D +4.5%
New Hampshire: D +4.4%
Wisconsin: D +4%
Iowa: D +4%
Florida: D +4%
Virginia: D +2.5%
Kentucky: D +2.5%
Arkansas: D +2%
Louisiana: R +1%
Georgia: R +2%
North Carolina: R +3%
Colorado: R +4%
Texas: R +5%
Alaska: R +7%
South Carolina: R +7%
Kansas: R +7%
Mississippi: R +9%
Montana: R +13%
West Virginia: R +14%
Wyoming: R +28%
All lists and numbers above are based on no less than 70 individual polls from different pollsters. The vast majority of them conducted in 2013.
Last updated on November 26.
One more update, on November 24, to include the two latest polls of Montana and Florida. Both polls are very god news for Republicans, in the sense that Hillary's Florida lead has been cut in more than half and GOP's lead in Montana has increased by 5% as well.
So here they are - all the 2016 poll averages for each state so far - 26 states having been polled to date - and how far off they are compared to the actual 2012 outcomes. I'm only including the Republican candidate with the best statewide polling.
Alaska: Hillary vs Jeb Bush: R +7%
+7% D improvement
(Updated on August 4)
Arkansas: Hillary vs Chris Christie: D +2%
+22% D improvement
Current Democratic gain
(Updated on August 11)
Colorado: Hillary vs Christie: R +4%
+9% R improvement
Current Republican gain
Florida: Hillary vs Christie: D +4%
+3% D improvement
(Updated on November 24)
Georgia: Hillary vs Christie: R +2%
+6% D improvement
(Updated August 8 )
Iowa: Hillary vs Christie: D +4%
+2% R improvement
Kansas: Hillary vs Paul Ryan: R +7%
+15% D improvement
Kentucky: Hillary vs Rand Paul: D +2.5%
+25% D improvement
Current Democratic gain
Louisiana: Hillary vs Paul Ryan/Rand Paul: R +1%
+16% D improvement
Maine: Hillary vs Christie: D +8%
+7% R improvement
(Updated on November 13)
Michigan: Hillary vs Christie: D +6%
+3.5% R improvement
Minnesota: Hillary vs Christie: D +6%
+2% R improvement
Mississippi: Hillary vs Christie: R +9%
+2.5% D improvement
Montana: Hillary vs Rand Paul: R +13%
+1% D improvement
(Updated on November 24)
New Hampshire: Hillary vs Christie: D +4.4%
+1.2% R improvement
(Updated with September poll)
New Jersey: Hillary vs Christie: D +7.2%
+10.6% R improvement
(Updated on November 8 )
New York: Hillary vs Christie: D +20.3%
+7.9% R improvement
(Updated on November 26)
North Carolina: Hillary vs Christie: R +3%
+1% R improvement
(Updated on November 13)
Ohio: Hillary vs Christie: D +4.5%
+1.5% R improvement
Pennsylvania: Hillary vs Paul Ryan: D +12%
+7% D improvement
South Carolina: Hillary vs Marco Rubio: R+7%
+3.5% D improvement
(Updated November 2)
Texas: Hillary vs Jeb Bush: R +5%
+11% D improvement
(Updated November 8 )
Virginia: Hillary vs Christie: D +2.5%
+1.4% R improvement
(Updated on November 26)
West Virginia: Hillary vs Jeb Bush: R +14%
+13% D improvement
(Updated on October 1)
Wisconsin: Hillary vs Jeb Bush: D +4%
+3% R improvement
(Updated with latest October poll, though Bush was not among those polled)
Wyoming: Hillary vs Christie: R +28%
+13% D improvement
Average all 26 states: Hillary vs Best Republican: R +0.5%
+3.65% D improvement (from Obama 2012) [projecting an 7.5% victory for Hillary]
That gives us this map right now:
(
Red = Democratic lead
Blue = Republican lead
Green = Exact tie
Grey = No polling yet
20% shade = 0-1% lead
30% shade = 1-3% lead
40% shade = 3-6% lead
50% shade = 6-9% lead
60% shade = 9-12% lead
70% shade = 12-15% lead
80% shade = 15-18% lead
90% shade = Above 18% lead
In the count of electoral votes, this means the current situation looks like this:
Hillary: 203 EVs (for a total of 14 states)
Best/Tailormade Republican: 110 EVs (for a total of 12 states)
Toss-up: None
No polling: 225 EVs [almost half, including California] (for a total of 24 states + D.C.)
Which means that Hillary has captured an impressive 64.9% of all EVs awarded thus far, against a disappointing 35.1% EVs for the tailormade Republican. And only New York & Maine of the solidly Democratic states have been polled so far (3 if including New Jersey), against no less than 12 solidly Republican states - the biggest one of them, Texas, included. With California added to Hillary's pie, it'll look even more promising for her. Neither to forget such states as D.C., Vermont, Hawaii & Maryland. It's looking like a landslide right now, even without Colorado being in Hillary's column.
This is how the Trendline Map looks so far:
(
The states which right now are showing the strongest improvement for the Democratic (Hillary) or the Republican candidate (in 16 out of 26 cases, Christie is that person):
1. Kentucky: D +25%
2. Arkansas: D +22%
3. Louisiana: D +16%
4. Kansas: D +15%
5. West Vriginia: D +13%
6. Wyoming: D +13%
7. Texas: D +11%
8. New Jersey: R +10.6%
9. Colorado: R +9%
10. New York: R +7.9%
11. Maine: R +7%
12. Pennsylvania: D +7%
13. Alaska: D +7%
14. Georgia: D +6%
All of these changes (in the 14 states above) are (more than) statistically significant. We see that (so far) Texas is experiencing a much more rapid change than other demographically quick-changing states like Florida and Georgia. Unfortunately, the 4th quick-changing traditionally Republican state, Arizona, has still not been polled.
The strong D improvement in the Appalachian south (Kentucky, Arkansas, Louisiana, West Virginia, Pennsylvania, Ohio (Texas & South Carolina)), makes me curious to see how geographically similar states like Tennessee, Missouri, Indiana and Illinois will play out in their first poll(s). I'm feeling quite confident that all of these 4 states will move considerably towards Hillary as well, although Illinois might possibly be less certain than the first three, as Obama used the state as his campaign base in both of his elections.
The only non-candidate states (excluding New Jersey & Wisconsin) which have moved considerably towards Republican candidate(s) so far, have been Colorado, Maine & New York. It will be interesting to see why this sole and very important swing state is bucking the trend which is occurring in almost the entire rest of the United States.
The whole list of states having been polled till now, going from Democratic stronghold to Republican stronghold:
New York: D +20.3%
Pennsylvania: D +12%
Maine: D +8%
New Jersey: D +7.2% (including Exit Poll from Governor's race)
Michigan: D +6%
Minnesota: D +6%
Ohio: D +4.5%
New Hampshire: D +4.4%
Wisconsin: D +4%
Iowa: D +4%
Florida: D +4%
Virginia: D +2.5%
Kentucky: D +2.5%
Arkansas: D +2%
Louisiana: R +1%
Georgia: R +2%
North Carolina: R +3%
Colorado: R +4%
Texas: R +5%
Alaska: R +7%
South Carolina: R +7%
Kansas: R +7%
Mississippi: R +9%
Montana: R +13%
West Virginia: R +14%
Wyoming: R +28%
All lists and numbers above are based on no less than 70 individual polls from different pollsters. The vast majority of them conducted in 2013.
Last updated on November 26.
Title: Re: 2016 Official Polling Map Thread
Post by: Senator Cris on November 24, 2013, 04:48:25 AM
Florida: Hillary vs Chris Christie: D +4%
+3% D improvement
+3% D improvement
Florida is:
Florida: Hillary vs Jeb Bush: D +2%
+1% D improvement
Is right?
Title: Re: 2016 Official Polling Map Thread
Post by: eric82oslo on November 24, 2013, 08:17:53 AM
Florida: Hillary vs Chris Christie: D +4%
+3% D improvement
+3% D improvement
Florida is:
Florida: Hillary vs Jeb Bush: D +2%
+1% D improvement
Is right?
No, cause Jeb Bush's poll numbers are based on five local polls, while Christie strangely enough has only been polled this once in the state. It's too early to say if Bush or Christie will end up as the strongest candidate for Florida, but it might very well be Bush in the end. However, until this last poll, even Bush did horrendously in most Florida match-ups, trailing Hillary by an average of 9%.
Title: Re: 2016 Official Polling Map Thread
Post by: pbrower2a on November 24, 2013, 09:52:09 AM
We will get one 'new' state this weekend -- Illinois, with 20 electoral votes. It could be interesting. Without a Favorite Son running for President this time, Illinois could end up much closer in 2016. The Favorite Son effect is both additive and subtractive.
Such was true of Texas between 2004 and 2008.
Such was true of Texas between 2004 and 2008.
Title: Re: 2016 Official Polling Map Thread
Post by: pbrower2a on November 26, 2013, 12:46:58 AM
Wall Street Journal/Marist/WNBC-TV (NBC-4, New York City)
http://online.wsj.com/news/articles/SB10001424052702304465604579220182335855674
blue, Republican -- red, Democratic
30% -- lead with 40-49% but a margin of 3% or less
40% -- lead with 40-49% but a margin of 4% or more
60% -- lead with 50-54%
70% -- lead with 55-59%
90% -- lead with 60% or more
Hillary Clinton vs. Jeb Bush
()
Hillary Clinton vs. Chris Christie
(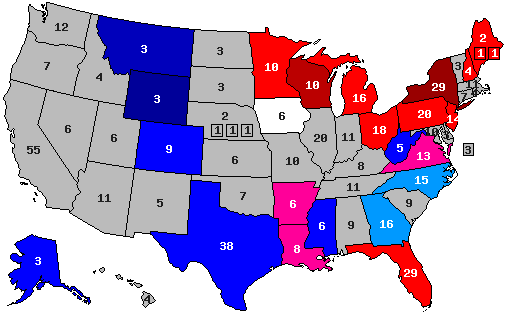 )
)
Hillary Clinton vs. Rand Paul
()
Hillary Clinton vs. Paul Ryan
()
[/quote]
Quote
The poll also looked beyond Mr. Cuomo's re-election race. It found that if he were to pursue a presidential bid for 2016 and win the Democratic nomination, he would beat New Jersey Gov. Chris Christie, a Republican, in a hypothetical general election matchup by 51% to 44% among New York state registered voters.
Former U.S. Secretary of State Hillary Clinton would win a wider margin against Mr. Christie, beating him among New York voters by 57% to 39%.
Former U.S. Secretary of State Hillary Clinton would win a wider margin against Mr. Christie, beating him among New York voters by 57% to 39%.
http://online.wsj.com/news/articles/SB10001424052702304465604579220182335855674
blue, Republican -- red, Democratic
30% -- lead with 40-49% but a margin of 3% or less
40% -- lead with 40-49% but a margin of 4% or more
60% -- lead with 50-54%
70% -- lead with 55-59%
90% -- lead with 60% or more
Hillary Clinton vs. Jeb Bush
(
Hillary Clinton vs. Chris Christie
(
Hillary Clinton vs. Rand Paul
(
Hillary Clinton vs. Paul Ryan
(
[/quote]
Title: Re: 2016 Official Polling Map Thread
Post by: eric82oslo on November 27, 2013, 10:39:03 AM
Latest update on December 9th with the 5th Colorado poll on presidential match-ups this year.
Once again time to update, after the releases of five more polls, three today, in Iowa, Ohio and Pennsylvania, and two yesterday, in Virginia and New York. The Pennsylvania poll is a semi-dramatic one, as it changes the state's status as a lean/likely D state into an absolute toss-up, as of now at least. The number of total state polls added to the lists below has thus now reached 75.
(One more update, on November 24, to include the two latest polls of Montana and Florida. Both polls are very god news for Republicans, in the sense that Hillary's Florida lead has been cut in more than half and GOP's lead in Montana has increased by 5% as well.)
So here they are - all the 2016 poll averages for each state so far - 26 states having been polled to date - and how far off they are compared to the actual 2012 outcomes. I'm only including the Republican candidate with the best statewide polling.
Alaska: Hillary vs Jeb Bush: R +7%
+7% D improvement
(Updated on August 4)
Arkansas: Hillary vs Chris Christie: D +2%
+22% D improvement
Current Democratic gain
(Updated on August 11)
Colorado: Hillary vs Christie: R +4.75%
+10.1% R improvement
Current Republican gain
(Updated on December 9)
Florida: Hillary vs Christie: D +4%
+3% D improvement
(Updated on November 24)
Georgia: Hillary vs Christie: R +2%
+6% D improvement
(Updated August 8 )
Iowa: Hillary vs Christie: D +1.7%
+4.1% R improvement
(Updated on November 27)
Kansas: Hillary vs Paul Ryan: R +7%
+15% D improvement
(Updated on February 26)
Kentucky: Hillary vs Rand Paul: D +2.5%
+25% D improvement
Current Democratic gain
(Updated on April 9)
Louisiana: Hillary vs Paul Ryan/Rand Paul: R +1%
+16% D improvement
(Updated on August 21)
Maine: Hillary vs Christie: D +8%
+7% R improvement
(Updated on November 13)
Michigan: Hillary vs Christie: D +6%
+3.5% R improvement
(Updated on June 4)
Minnesota: Hillary vs Christie: D +6%
+2% R improvement
(Updated on January 22)
Mississippi: Hillary vs Christie: R +9%
+2.5% D improvement
(Updated on November 19)
Montana: Hillary vs Rand Paul: R +13%
+1% D improvement
(Updated on November 24)
New Hampshire: Hillary vs Christie: D +4.4%
+1.2% R improvement
(Updated on September 18)
New Jersey: Hillary vs Christie: D +7.2%
+10.6% R improvement
(Updated on November 8 )
New York: Hillary vs Christie: D +20.3%
+7.9% R improvement
(Updated on November 26)
North Carolina: Hillary vs Christie: R +3%
+1% R improvement
(Updated on November 13)
Ohio: Hillary vs Christie: D +3.3%
+0.3% D improvement
(Updated on November 27)
Pennsylvania: Hillary vs Christie: D +0.5%
+4.9% R improvement
(Updated on November 27)
South Carolina: Hillary vs Marco Rubio: R+7%
+3.5% D improvement
(Updated on November 2)
Texas: Hillary vs Jeb Bush: R +5%
+11% D improvement
(Updated on November 8 )
Virginia: Hillary vs Christie: D +2.5%
+1.4% R improvement[/color]
(Updated on November 26)
West Virginia: Hillary vs Jeb Bush: R +14%
+13% D improvement
(Updated on October 1)
Wisconsin: Hillary vs Jeb Bush: D +4%
+3% R improvement
(Updated on October 29, though Bush was not among those polled)
Wyoming: Hillary vs Christie: R +28%
+13% D improvement
(Updated on July 23)
Average all 26 states: Hillary vs Best Republican: R +1.1%
+3% D improvement (from Obama 2012) [projecting a 6.9% victory for Hillary]
That gives us this map right now:
( )
)
Red = Democratic lead
Blue = Republican lead
Green = Exact tie
Grey = No polling yet
20% shade = 0-1% lead
30% shade = 1-3% lead
40% shade = 3-6% lead
50% shade = 6-9% lead
60% shade = 9-12% lead
70% shade = 12-15% lead
80% shade = 15-18% lead
90% shade = Above 18% lead
In the count of electoral votes, this means the current situation looks like this:
Hillary: 203 EVs (for a total of 14 states)
Best/Tailormade Republican: 110 EVs (for a total of 12 states)
Toss-up: None
No polling: 225 EVs [almost half, including California] (for a total of 24 states + D.C.)
Which means that Hillary has captured a rather impressive 64.9% of all EVs awarded thus far, against a more or less disappointing 35.1% EVs for the tailormade Republican. And only New York, Maine and New Jersey of the solidly Democratic states have been polled so far, against no less than 12 solidly Republican states - the biggest one of them, Texas, included. With California added to Hillary's pie, it'll look even more promising for her. Neither to forget such states as D.C., Vermont, Hawaii & Maryland. It's looking like a landslide right now, even without Colorado and Pennsylvania being in Hillary's column.
This is how the Trendline Map looks so far:
( )
)
The states which right now are showing the strongest improvement for the Democratic (Hillary) or the Republican candidate (in 17 out of 26 cases, Christie is that person):
1. Kentucky: D +25%
2. Arkansas: D +22%
3. Louisiana: D +16%
4. Kansas: D +15%
5. West Vriginia: D +13%
6. Wyoming: D +13%
7. Texas: D +11%
8. New Jersey: R +10.6%
9. Colorado: R +10.1%
10. New York: R +7.9%
11. Maine: R +7%
12. Alaska: D +7%
13. Georgia: D +6%
14. Pennsylvania: R +4.9%
All of these changes (in the 14 states above) are (more than) statistically significant. We see that (so far) Texas is experiencing a much more rapid change than other demographically quick-changing states like Florida and Georgia. Unfortunately, the 4th quick-changing traditionally Republican state, Arizona, has still not been polled.
The strong D improvement in the Appalachian south (Kentucky, Arkansas, Louisiana, West Virginia (Texas & South Carolina)), makes me curious to see how geographically similar states like Tennessee, Missouri, Indiana and Illinois will play out in their first poll(s). I'm feeling quite confident that all of these 4 states will move considerably towards Hillary as well, although Illinois might possibly be less certain than the first three, as Obama used the state as his campaign base in both of his elections.
The whole list of states having been polled till now, going from Democratic stronghold to Republican stronghold:
New York: D +20.3%
Maine: D +8%
New Jersey: D +7.2% (including Exit Poll from Governor's race)
Current estimated/projected national average: D +6.9%
Michigan: D +6%
Minnesota: D +6%
New Hampshire: D +4.4%
Wisconsin: D +4%
Florida: D +4%
Ohio: D +3.3%
Virginia: D +2.5%
Kentucky: D +2.5%
Arkansas: D +2%
Iowa: D +1.7%
Pennsylvania: D +0.5%
Louisiana: R +1%
Georgia: R +2%
North Carolina: R +3%
Colorado: R +4.75%
Texas: R +5%
Alaska: R +7%
South Carolina: R +7%
Kansas: R +7%
Mississippi: R +9%
Montana: R +13%
West Virginia: R +14%
Wyoming: R +28%
All lists and numbers above are based on no less than 75 individual polls from different pollsters. The vast majority of them conducted in 2013.
Despite the near inmense number of bad polls for Hillary, Obama and Democrats during the past month or so, Hillary is still expected to beat the tailor-made Republican (which in 17 of 26 cases happens to be Christie) by an impressive projected 6.9% nationally.
8 or 9 states are currently way too close to call; Virginia, Kentucky, Arkansas, Iowa & Pennsylvania (all leaning towards Hillary), plus Louisiana, Georgia and North Carolina (all leaning Republican). After this last poll, Ohio could possibly be added to the too-close-to-call states, just barely leaning towards Hillary by an average of 3.3%.
Last updated on December 9.
Once again time to update, after the releases of five more polls, three today, in Iowa, Ohio and Pennsylvania, and two yesterday, in Virginia and New York. The Pennsylvania poll is a semi-dramatic one, as it changes the state's status as a lean/likely D state into an absolute toss-up, as of now at least. The number of total state polls added to the lists below has thus now reached 75.
(One more update, on November 24, to include the two latest polls of Montana and Florida. Both polls are very god news for Republicans, in the sense that Hillary's Florida lead has been cut in more than half and GOP's lead in Montana has increased by 5% as well.)
So here they are - all the 2016 poll averages for each state so far - 26 states having been polled to date - and how far off they are compared to the actual 2012 outcomes. I'm only including the Republican candidate with the best statewide polling.
Alaska: Hillary vs Jeb Bush: R +7%
+7% D improvement
(Updated on August 4)
Arkansas: Hillary vs Chris Christie: D +2%
+22% D improvement
Current Democratic gain
(Updated on August 11)
Colorado: Hillary vs Christie: R +4.75%
+10.1% R improvement
Current Republican gain
(Updated on December 9)
Florida: Hillary vs Christie: D +4%
+3% D improvement
(Updated on November 24)
Georgia: Hillary vs Christie: R +2%
+6% D improvement
(Updated August 8 )
Iowa: Hillary vs Christie: D +1.7%
+4.1% R improvement
(Updated on November 27)
Kansas: Hillary vs Paul Ryan: R +7%
+15% D improvement
(Updated on February 26)
Kentucky: Hillary vs Rand Paul: D +2.5%
+25% D improvement
Current Democratic gain
(Updated on April 9)
Louisiana: Hillary vs Paul Ryan/Rand Paul: R +1%
+16% D improvement
(Updated on August 21)
Maine: Hillary vs Christie: D +8%
+7% R improvement
(Updated on November 13)
Michigan: Hillary vs Christie: D +6%
+3.5% R improvement
(Updated on June 4)
Minnesota: Hillary vs Christie: D +6%
+2% R improvement
(Updated on January 22)
Mississippi: Hillary vs Christie: R +9%
+2.5% D improvement
(Updated on November 19)
Montana: Hillary vs Rand Paul: R +13%
+1% D improvement
(Updated on November 24)
New Hampshire: Hillary vs Christie: D +4.4%
+1.2% R improvement
(Updated on September 18)
New Jersey: Hillary vs Christie: D +7.2%
+10.6% R improvement
(Updated on November 8 )
New York: Hillary vs Christie: D +20.3%
+7.9% R improvement
(Updated on November 26)
North Carolina: Hillary vs Christie: R +3%
+1% R improvement
(Updated on November 13)
Ohio: Hillary vs Christie: D +3.3%
+0.3% D improvement
(Updated on November 27)
Pennsylvania: Hillary vs Christie: D +0.5%
+4.9% R improvement
(Updated on November 27)
South Carolina: Hillary vs Marco Rubio: R+7%
+3.5% D improvement
(Updated on November 2)
Texas: Hillary vs Jeb Bush: R +5%
+11% D improvement
(Updated on November 8 )
Virginia: Hillary vs Christie: D +2.5%
+1.4% R improvement[/color]
(Updated on November 26)
West Virginia: Hillary vs Jeb Bush: R +14%
+13% D improvement
(Updated on October 1)
Wisconsin: Hillary vs Jeb Bush: D +4%
+3% R improvement
(Updated on October 29, though Bush was not among those polled)
Wyoming: Hillary vs Christie: R +28%
+13% D improvement
(Updated on July 23)
Average all 26 states: Hillary vs Best Republican: R +1.1%
+3% D improvement (from Obama 2012) [projecting a 6.9% victory for Hillary]
That gives us this map right now:
(
Red = Democratic lead
Blue = Republican lead
Green = Exact tie
Grey = No polling yet
20% shade = 0-1% lead
30% shade = 1-3% lead
40% shade = 3-6% lead
50% shade = 6-9% lead
60% shade = 9-12% lead
70% shade = 12-15% lead
80% shade = 15-18% lead
90% shade = Above 18% lead
In the count of electoral votes, this means the current situation looks like this:
Hillary: 203 EVs (for a total of 14 states)
Best/Tailormade Republican: 110 EVs (for a total of 12 states)
Toss-up: None
No polling: 225 EVs [almost half, including California] (for a total of 24 states + D.C.)
Which means that Hillary has captured a rather impressive 64.9% of all EVs awarded thus far, against a more or less disappointing 35.1% EVs for the tailormade Republican. And only New York, Maine and New Jersey of the solidly Democratic states have been polled so far, against no less than 12 solidly Republican states - the biggest one of them, Texas, included. With California added to Hillary's pie, it'll look even more promising for her. Neither to forget such states as D.C., Vermont, Hawaii & Maryland. It's looking like a landslide right now, even without Colorado and Pennsylvania being in Hillary's column.
This is how the Trendline Map looks so far:
(
The states which right now are showing the strongest improvement for the Democratic (Hillary) or the Republican candidate (in 17 out of 26 cases, Christie is that person):
1. Kentucky: D +25%
2. Arkansas: D +22%
3. Louisiana: D +16%
4. Kansas: D +15%
5. West Vriginia: D +13%
6. Wyoming: D +13%
7. Texas: D +11%
8. New Jersey: R +10.6%
9. Colorado: R +10.1%
10. New York: R +7.9%
11. Maine: R +7%
12. Alaska: D +7%
13. Georgia: D +6%
14. Pennsylvania: R +4.9%
All of these changes (in the 14 states above) are (more than) statistically significant. We see that (so far) Texas is experiencing a much more rapid change than other demographically quick-changing states like Florida and Georgia. Unfortunately, the 4th quick-changing traditionally Republican state, Arizona, has still not been polled.
The strong D improvement in the Appalachian south (Kentucky, Arkansas, Louisiana, West Virginia (Texas & South Carolina)), makes me curious to see how geographically similar states like Tennessee, Missouri, Indiana and Illinois will play out in their first poll(s). I'm feeling quite confident that all of these 4 states will move considerably towards Hillary as well, although Illinois might possibly be less certain than the first three, as Obama used the state as his campaign base in both of his elections.
The whole list of states having been polled till now, going from Democratic stronghold to Republican stronghold:
New York: D +20.3%
Maine: D +8%
New Jersey: D +7.2% (including Exit Poll from Governor's race)
Current estimated/projected national average: D +6.9%
Michigan: D +6%
Minnesota: D +6%
New Hampshire: D +4.4%
Wisconsin: D +4%
Florida: D +4%
Ohio: D +3.3%
Virginia: D +2.5%
Kentucky: D +2.5%
Arkansas: D +2%
Iowa: D +1.7%
Pennsylvania: D +0.5%
Louisiana: R +1%
Georgia: R +2%
North Carolina: R +3%
Colorado: R +4.75%
Texas: R +5%
Alaska: R +7%
South Carolina: R +7%
Kansas: R +7%
Mississippi: R +9%
Montana: R +13%
West Virginia: R +14%
Wyoming: R +28%
All lists and numbers above are based on no less than 75 individual polls from different pollsters. The vast majority of them conducted in 2013.
Despite the near inmense number of bad polls for Hillary, Obama and Democrats during the past month or so, Hillary is still expected to beat the tailor-made Republican (which in 17 of 26 cases happens to be Christie) by an impressive projected 6.9% nationally.
8 or 9 states are currently way too close to call; Virginia, Kentucky, Arkansas, Iowa & Pennsylvania (all leaning towards Hillary), plus Louisiana, Georgia and North Carolina (all leaning Republican). After this last poll, Ohio could possibly be added to the too-close-to-call states, just barely leaning towards Hillary by an average of 3.3%.
Last updated on December 9.
Title: Re: 2016 Official Polling Map Thread
Post by: eric82oslo on November 27, 2013, 01:32:56 PM
Please everyone, use your democratic right and go and vote for one of the five so far no-polled states which might be polled by Public Policy Polling this weekend. Those five states are, in decreasing number of importance (counting from their number of Electoral Votes):
Maryland: 10 EVs
Oregon: 7 EVs
Connecticut: 7 EVs
New Mexico: 5 EVs
Rhode Island: 4 EVs
Here's the link to go to vote: http://publicpolicypolling.com/
Maryland: 10 EVs
Oregon: 7 EVs
Connecticut: 7 EVs
New Mexico: 5 EVs
Rhode Island: 4 EVs
Here's the link to go to vote: http://publicpolicypolling.com/
Title: Re: 2016 Official Polling Map Thread
Post by: The world will shine with light in our nightmare on November 27, 2013, 01:37:49 PM
I voted for Kentucky. I don't see the big need for any of the states you listed to be polled yet.
Title: Re: 2016 Official Polling Map Thread
Post by: eric82oslo on November 27, 2013, 01:41:56 PM
I voted for Kentucky. I don't see the big need for any of the states you listed to be polled yet.
Luckily Oregon is leading though, yet I personally voted for Maryland. :P
Title: Re: 2016 Official Polling Map Thread
Post by: pbrower2a on November 27, 2013, 06:04:49 PM
Ohio, Quinnipiac:
In an early look at the 2016 run for the White House, former Secretary of State Hillary Clinton gets 42 percent to 41 percent for New Jersey Republican Gov. Christopher Christie in Ohio. Secretary Clinton tops Gov. John Kasich 49 - 38 percent and leads other Republicans:
50 - 37 percent over former Florida Gov. Jeb Bush;
48 - 39 percent over U.S. Sen. Marco Rubio of Florida;
50 - 40 percent over U.S. Sen. Rand Paul of Kentucky;
49 - 41 percent over U.S. Rep. Paul Ryan of Wisconsin.
50 - 35 percent over U.S. Sen. Ted Cruz of Texas.
http://www.quinnipiac.edu/institutes-and-centers/polling-institute/ohio/release-detail?ReleaseID=1985
Pennsylvania, PPP:
Christie 48%, Clinton 44%
Clinton 48%, Bush 44%
Clinton 51%, Paul 43%
Clinton 51%, Santorum 42%
Clinton 53%, Cruz 41%
http://www.publicpolicypolling.com/pdf/2013/PPP_Release_PA_112713.pdf
Chris Christie must be an unusually-good match for Pennsylvania but not so good a match for Ohio. Go figure.
blue, Republican -- red, Democratic
30% -- lead with 40-49% but a margin of 3% or less
40% -- lead with 40-49% but a margin of 4% or more
60% -- lead with 50-54%
70% -- lead with 55-59%
90% -- lead with 60% or more
Hillary Clinton vs. Jeb Bush
( )
)
Hillary Clinton vs. Chris Christie
(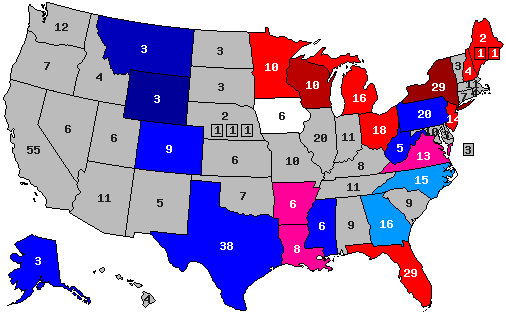 )
)
Hillary Clinton vs. Rand Paul
()
Hillary Clinton vs. Paul Ryan
( )
)
In an early look at the 2016 run for the White House, former Secretary of State Hillary Clinton gets 42 percent to 41 percent for New Jersey Republican Gov. Christopher Christie in Ohio. Secretary Clinton tops Gov. John Kasich 49 - 38 percent and leads other Republicans:
50 - 37 percent over former Florida Gov. Jeb Bush;
48 - 39 percent over U.S. Sen. Marco Rubio of Florida;
50 - 40 percent over U.S. Sen. Rand Paul of Kentucky;
49 - 41 percent over U.S. Rep. Paul Ryan of Wisconsin.
50 - 35 percent over U.S. Sen. Ted Cruz of Texas.
http://www.quinnipiac.edu/institutes-and-centers/polling-institute/ohio/release-detail?ReleaseID=1985
Pennsylvania, PPP:
Christie 48%, Clinton 44%
Clinton 48%, Bush 44%
Clinton 51%, Paul 43%
Clinton 51%, Santorum 42%
Clinton 53%, Cruz 41%
http://www.publicpolicypolling.com/pdf/2013/PPP_Release_PA_112713.pdf
Chris Christie must be an unusually-good match for Pennsylvania but not so good a match for Ohio. Go figure.
blue, Republican -- red, Democratic
30% -- lead with 40-49% but a margin of 3% or less
40% -- lead with 40-49% but a margin of 4% or more
60% -- lead with 50-54%
70% -- lead with 55-59%
90% -- lead with 60% or more
Hillary Clinton vs. Jeb Bush
(
Hillary Clinton vs. Chris Christie
(
Hillary Clinton vs. Rand Paul
(
Hillary Clinton vs. Paul Ryan
(
Title: Re: 2016 Official Polling Map Thread
Post by: Tender Branson on November 28, 2013, 03:01:34 AM
pbrower, Christie is actually leading Hillary in Iowa and Virginia.
Title: Re: 2016 Official Polling Map Thread
Post by: pbrower2a on November 28, 2013, 06:19:49 PM
pbrower, Christie is actually leading Hillary in Iowa and Virginia.
The Iowa poll is commissioned by an entity that has the word "conservative" in its name.
Re: VA-Polling Company/WomanTrend/Washington Free Beacon: Christie ahead
« Reply #1 on: November 26, 2013, 12:34:39 pm »
It should be noted that the Washington Free Beacon is a conservative newspaper and that the owner of the Polling Company is a former aide to Newt Gingrich.
Iowa and Virginia get polled often enough.
Title: Re: 2016 Official Polling Map Thread
Post by: Mr. Morden on December 01, 2013, 02:47:29 AM
Update on the latest statewide polls of Christie vs. Clinton:
AK: Christie +8
AR: Clinton +2
CO: Christie +8
FL: Clinton +4
GA: Christie +2
IA: Christie +5
LA: Clinton +1
ME: Clinton +8
MI: Clinton +6
MN: Clinton +6
MS: Christie +9
MT: Christie +17
NH: Clinton +4
NJ: Clinton +4
NC: Christie +3
NY: Clinton +18
OH: Clinton +1
PA: Christie +4
SC: Christie +5
TX: Christie +5
VA: Christie +2
WV: Christie +9
WI: Clinton +10
WY: Christie +28
The swing from the 2012 election would then be:
AK: D+6
AR: D+26
CO: R+13
FL: D+3
GA: D+6
IA: R+11
LA: D+21
ME: R+7
MI: R+3
MN: R+1
MS: D+3
MT: R+3
NH: R+2
NJ: R+14
NC: R+1
NY: R+8
OH: R+2
PA: R+9
SC: D+5
TX: D+11
VA: R+6
WV: D+18
WI: D+3
WY: D+13
( )
)
AK: Christie +8
AR: Clinton +2
CO: Christie +8
FL: Clinton +4
GA: Christie +2
IA: Christie +5
LA: Clinton +1
ME: Clinton +8
MI: Clinton +6
MN: Clinton +6
MS: Christie +9
MT: Christie +17
NH: Clinton +4
NJ: Clinton +4
NC: Christie +3
NY: Clinton +18
OH: Clinton +1
PA: Christie +4
SC: Christie +5
TX: Christie +5
VA: Christie +2
WV: Christie +9
WI: Clinton +10
WY: Christie +28
The swing from the 2012 election would then be:
AK: D+6
AR: D+26
CO: R+13
FL: D+3
GA: D+6
IA: R+11
LA: D+21
ME: R+7
MI: R+3
MN: R+1
MS: D+3
MT: R+3
NH: R+2
NJ: R+14
NC: R+1
NY: R+8
OH: R+2
PA: R+9
SC: D+5
TX: D+11
VA: R+6
WV: D+18
WI: D+3
WY: D+13
(
Title: Re: 2016 Official Polling Map Thread
Post by: pbrower2a on December 09, 2013, 06:10:55 PM
Republicans seem to be reversing the Democratic trend of the last six years or so in Colorado.
Note, though:
Very Republican sample at 47-46 Obama-Romney, though.
blue, Republican -- red, Democratic
30% -- lead with 40-49% but a margin of 3% or less
40% -- lead with 40-49% but a margin of 4% or more
60% -- lead with 50-54%
70% -- lead with 55-59%
90% -- lead with 60% or more
Hillary Clinton vs. Jeb Bush
( )
)
Hillary Clinton vs. Chris Christie
()
Hillary Clinton vs. Rand Paul
()
Hillary Clinton vs. Paul Ryan
()
Quote
December 3-4 2013
Survey of 928 Colorado voters
Colorado Survey Results (PPP)
Q1
Generally speaking, if there was an election for
the state legislature today, would you vote for
the Democratic or Republican candidate from
your district?
42% Democrat
47% Republican
12% Not sure
..........................................................
Q2
If the candidates for President next time were
Democrat Hillary Clinton and Republican Jeb
Bush, who would you vote for?
47% Hillary Clinton
43% Jeb Bush
11% Not sure
Q3
If the candidates for President next time were
Democrat Hillary Clinton and Republican Chris
Christie, who would you vote for?
39% Hillary Clinton
46% Chris Christie
15% Not sure
Q4
If the candidates for President next time were
Democrat Hillary Clinton and Republican Ted
Cruz, who would you vote for?
48% Hillary Clinton
45% Ted Cruz
7% Not sure
Q5
If the candidates for President next time were
Democrat Hillary Clinton and Republican Rand
Paul, who would you vote for?
45% Hillary Clinton
47% Rand Paul
8% Not sure
http://www.publicpolicypolling.com/pdf/2013/PPP_Release_CO_120913.pdfSurvey of 928 Colorado voters
Colorado Survey Results (PPP)
Q1
Generally speaking, if there was an election for
the state legislature today, would you vote for
the Democratic or Republican candidate from
your district?
42% Democrat
47% Republican
12% Not sure
..........................................................
Q2
If the candidates for President next time were
Democrat Hillary Clinton and Republican Jeb
Bush, who would you vote for?
47% Hillary Clinton
43% Jeb Bush
11% Not sure
Q3
If the candidates for President next time were
Democrat Hillary Clinton and Republican Chris
Christie, who would you vote for?
39% Hillary Clinton
46% Chris Christie
15% Not sure
Q4
If the candidates for President next time were
Democrat Hillary Clinton and Republican Ted
Cruz, who would you vote for?
48% Hillary Clinton
45% Ted Cruz
7% Not sure
Q5
If the candidates for President next time were
Democrat Hillary Clinton and Republican Rand
Paul, who would you vote for?
45% Hillary Clinton
47% Rand Paul
8% Not sure
Note, though:
Very Republican sample at 47-46 Obama-Romney, though.
blue, Republican -- red, Democratic
30% -- lead with 40-49% but a margin of 3% or less
40% -- lead with 40-49% but a margin of 4% or more
60% -- lead with 50-54%
70% -- lead with 55-59%
90% -- lead with 60% or more
Hillary Clinton vs. Jeb Bush
(
Hillary Clinton vs. Chris Christie
(
Hillary Clinton vs. Rand Paul
(
Hillary Clinton vs. Paul Ryan
(
Title: Re: 2016 Official Polling Map Thread
Post by: pbrower2a on December 11, 2013, 09:43:14 AM
National, Pew Research:
In a hypothetical general election matchup, Clinton has an edge over Christie and a double-digit lead against anyone else. She leads:
Christie 48-45;
Rubio 52-42;
Bush 53-41;
Paul 55-40;
Ryan 56-40;
Perry 58-37;
Cruz 57-35;
Palin 59-36.
Christie does better among Democrats and moderates against Clinton than his fellow Republicans. He also does better among men, which a Republican needs to offset the Democrats usual lead among women.
He chips away a little, said Miringoff. But Clinton has her way with the crowd.
Read more here: http://www.mcclatchydc.com/2013/12/10/211208/hillary-clinton-dominates-early.html#storylink=cpy
My interpretation based on how the undecided would go: they either do not vote or go ineffectively to the loser. Hillary Clinton would win much like Obama in 2012 against Christie, roughly 51.5-48.5 (I don't like decimals, but they are close enough to split the vote some, probably about 6-4 for Christie). Hillary would lose the undecided about 7-3 against Bush or Rubio. With the others the undecided are almost all on the Right, and they would go R about 9-1.
Christie 51-48 Kennedy 1960
Rubio 55-45 Eisenhower 1952
Bush 56-44 GHW Bush 1988
Paul 56-44 GHW Bush 1988
Ryan 57-43 Reagan 1980
Perry 59-41 Reagan 1980
Cruz 58-42 Reagan 1980
Palin 60-40 LBJ 1964
...If anyone is thinking about Sarah Palin as the Great Female Hope for the GOP, she still has one gigantic weakness: her mangled language will offend anyone whose first language is not English, whether that language is German or Tagalog, Russian or Arabic, Hindi or Chinese, or Farsi or Vietnamese.
In view of his ability to cut even a small deal with Democratic Senator Patty Murray, his stock has probably risen since this poll. I am not abandoning him yet.
Title: Re: 2016 Official Polling Map Thread
Post by: Mr. Morden on December 11, 2013, 10:16:24 AM
Title: Re: 2016 Official Polling Map Thread
Post by: pbrower2a on December 11, 2013, 11:01:41 AM
Monmouth, NJ
blue, Republican -- red, Democratic
30% -- lead with 40-49% but a margin of 3% or less
40% -- lead with 40-49% but a margin of 4% or more
60% -- lead with 50-54%
70% -- lead with 55-59%
90% -- lead with 60% or more
Hillary Clinton vs. Jeb Bush
( )
)
Hillary Clinton vs. Chris Christie
( )
)
Hillary Clinton vs. Rand Paul
()
Hillary Clinton vs. Paul Ryan
()
blue, Republican -- red, Democratic
30% -- lead with 40-49% but a margin of 3% or less
40% -- lead with 40-49% but a margin of 4% or more
60% -- lead with 50-54%
70% -- lead with 55-59%
90% -- lead with 60% or more
Hillary Clinton vs. Jeb Bush
(
Hillary Clinton vs. Chris Christie
(
Hillary Clinton vs. Rand Paul
(
Hillary Clinton vs. Paul Ryan
(
Title: Re: 2016 Official Polling Map Thread
Post by: Senator Cris on December 11, 2013, 11:51:46 AM
Why NJ is blue in the Clinton vs. Bush map?
Title: Re: 2016 Official Polling Map Thread
Post by: pbrower2a on December 11, 2013, 03:13:45 PM
Why NJ is blue in the Clinton vs. Bush map?
Intended for Christie. Corrected.
Title: Re: 2016 Official Polling Map Thread
Post by: pbrower2a on December 11, 2013, 03:21:11 PM
December 5-8, 2013
Survey of 1,034 Michigan voters (PPP)
http://www.publicpolicypolling.com/pdf/2013/PPP_Release_MI_121113.pdf
Hillary Clinton vs. Jeb Bush
( )
)
Hillary Clinton vs. Chris Christie
(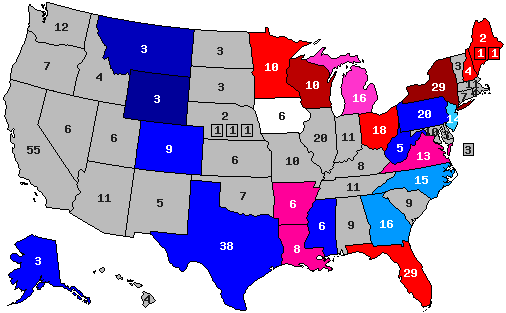 )
)
Hillary Clinton vs. Rand Paul
( )
)
Hillary Clinton vs. Paul Ryan
()
Survey of 1,034 Michigan voters (PPP)
Quote
Q4
If the candidates for President next time were
Democrat Hillary Clinton and Republican Jeb
Bush, who would you vote for?
46% Hillary Clinton
42% Jeb Bush
12% Not sure
Q5
If the candidates for President next time were
Democrat Hillary Clinton and Republican Chris
Christie, who would you vote for?
43% Hillary Clinton
40% Chris Christie
18% Not sure
Q6 If the candidates for President next time were
Democrat Hillary Clinton and Republican Ted
Cruz, who would you vote for?
49% Hillary Clinton
38% Ted Cruz
13% Not sure
Q7
If the candidates for President next time were
Democrat Hillary Clinton and Republican Rand
Paul, who would you vote for?
48% Hillary Clinton
39% Rand Paul
13% Not sure
If the candidates for President next time were
Democrat Hillary Clinton and Republican Jeb
Bush, who would you vote for?
46% Hillary Clinton
42% Jeb Bush
12% Not sure
Q5
If the candidates for President next time were
Democrat Hillary Clinton and Republican Chris
Christie, who would you vote for?
43% Hillary Clinton
40% Chris Christie
18% Not sure
Q6 If the candidates for President next time were
Democrat Hillary Clinton and Republican Ted
Cruz, who would you vote for?
49% Hillary Clinton
38% Ted Cruz
13% Not sure
Q7
If the candidates for President next time were
Democrat Hillary Clinton and Republican Rand
Paul, who would you vote for?
48% Hillary Clinton
39% Rand Paul
13% Not sure
http://www.publicpolicypolling.com/pdf/2013/PPP_Release_MI_121113.pdf
Hillary Clinton vs. Jeb Bush
(
Hillary Clinton vs. Chris Christie
(
Hillary Clinton vs. Rand Paul
(
Hillary Clinton vs. Paul Ryan
(
Title: Re: 2016 Official Polling Map Thread
Post by: eric82oslo on December 11, 2013, 06:34:06 PM
The very latest poll I've added is the PPP poll of Kentucky, which shifts that state from leaning Hillary by 2.5% versus Rand Paul into a leaning Republican state with Jeb Bush and Christie both beating the presumptive Democratic nominee by 4%, both being polled for the first time against Hillary in the state.
Current update as of December 22.
Adding the four latest polls on North Carolina, Michigan, New Jersey and Pennsylvania to the already extensive state-wide poll database we've been collecting this year.
The number of total state polls added to the lists below has thus now reached 81.
So here they are - all the 2016 poll averages for each state so far - 26 states having been polled to date - and how far off they are compared to the actual 2012 outcomes. I'm only including the Republican candidate with the best statewide polling.
Alaska: Hillary vs Jeb Bush: R +7%
+7% D improvement
(Updated on August 4)
Arkansas: Hillary vs Chris Christie: D +2%
+22% D improvement
Current Democratic gain
(Updated on August 11)
Colorado: Hillary vs Christie: R +4.75%
+10.1% R improvement
Current Republican gain
(Updated on December 9)
Florida: Hillary vs Christie: D +4%
+3% D improvement
(Updated on November 24)
Georgia: Hillary vs Christie: R +2%
+6% D improvement
(Updated August 8 )
Iowa: Hillary vs Christie: D +0.4%
+5.4% R improvement
(Updated on December 17)
Kansas: Hillary vs Paul Ryan: R +7%
+15% D improvement
(Updated on February 26)
Kentucky: Hillary vs Christie/Jeb Bush: R +4%
+19% D improvement
(Updated on December 22)
Louisiana: Hillary vs Paul Ryan/Rand Paul: R +1%
+16% D improvement
(Updated on August 21)
Maine: Hillary vs Christie: D +8%
+7% R improvement
(Updated on November 13)
Michigan: Hillary vs Christie: D +4.5%
+5% R improvement
(Updated on December 12)
Minnesota: Hillary vs Christie: D +6%
+2% R improvement
(Updated on January 22)
Mississippi: Hillary vs Christie: R +9%
+2.5% D improvement
(Updated on November 19)
Montana: Hillary vs Rand Paul: R +13%
+1% D improvement
(Updated on November 24)
New Hampshire: Hillary vs Christie: D +4.4%
+1.2% R improvement
(Updated on September 18)
New Jersey: Hillary vs Christie: D +5.5%
+12.3% R improvement
(Updated on December 12)
New York: Hillary vs Christie: D +20.3%
+7.9% R improvement
(Updated on November 26)
North Carolina: Hillary vs Christie: R +3%
+1% R improvement
(Updated on December 13)
Ohio: Hillary vs Christie: D +3.3%
+0.3% D improvement
(Updated on November 27)
Pennsylvania: Hillary vs Christie: D +0.7%
+4.7% R improvement
(Updated on December 19)
South Carolina: Hillary vs Marco Rubio: R+7%
+3.5% D improvement
(Updated on November 2)
Texas: Hillary vs Jeb Bush: R +5%
+11% D improvement
(Updated on November 8 )
Virginia: Hillary vs Christie: D +2.5%
+1.4% R improvement
(Updated on November 26)
West Virginia: Hillary vs Jeb Bush: R +14%
+13% D improvement
(Updated on October 1)
Wisconsin: Hillary vs Jeb Bush: D +4%
+3% R improvement
(Updated on October 29, though Bush was not among those polled)
Wyoming: Hillary vs Christie: R +28%
+13% D improvement
(Updated on July 23)
Average all 26 states: Hillary vs Best Republican: R +1.6%
+2.7% D improvement (from Obama 2012) [projecting a 6.6% victory for Hillary]
That gives us this map right now:
( )
)
Red = Democratic lead
Blue = Republican lead
Green = Exact tie
Grey = No polling yet
Green = toss up
20% shade = 0.1-1% lead
30% shade = 1.1-3% lead
40% shade = 3.1-6% lead
50% shade = 6.1-9% lead
60% shade = 9.1-12% lead
70% shade = 12.1-15% lead
80% shade = 15.1-18% lead
90% shade = Above 18.1% lead
In the count of electoral votes, this means the current situation looks like this:
Hillary: 195 EVs (for a total of 13 states)
Best/Tailormade Republican: 118 EVs (for a total of 13 states)
Toss-up: None
No polling: 225 EVs [almost half, including California] (for a total of 24 states + D.C.)
Which means that Hillary has captured a rather impressive 62.3% of all EVs awarded thus far, against a more or less disappointing 37.7% EVs for the tailormade Republican. And only New York, Maine and New Jersey of the solidly Democratic states have been polled so far, against no less than 12 solidly Republican states - the biggest one of them, Texas, included. With California added to Hillary's pie, it'll look even more promising for her. Neither to forget such states as D.C., Vermont, Hawaii & Maryland. It's looking like a landslide right now, even without Colorado and Pennsylvania being in Hillary's column.
This is how the Trendline Map looks so far:
(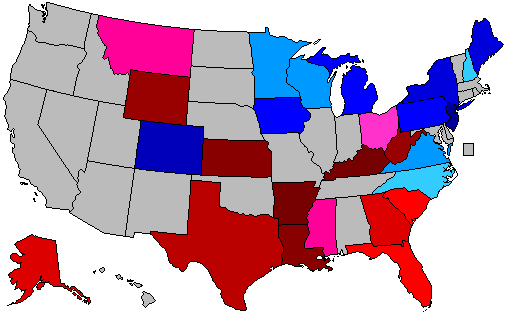 )
)
The states which right now are showing the strongest improvement for the Democratic (Hillary) or the Republican candidate (in 18 out of 26 cases, Christie is that person):
1. Arkansas: D +22%
2. Kentucky: D +19%
3. Louisiana: D +16%
4. Kansas: D +15%
5. West Vriginia: D +13%
6. Wyoming: D +13%
7. New Jersey: R +12.3%
8. Texas: D +11%
9. Colorado: R +10.1%
10. New York: R +7.9%
11. Maine: R +7%
12. Alaska: D +7%
13. Georgia: D +6%
14. Iowa: R +5.4%
15. Michigan: R +5%
16. Pennsylvania: R +4.7%
All of these changes (in the 16 states above) are (more than) statistically significant. We see that (so far) Texas is experiencing a much more rapid change than other demographically quick-changing states like Florida and Georgia. Unfortunately, the 4th quick-changing traditionally Republican state, Arizona, has still not been polled.
The strong D improvement in the Appalachian south (Kentucky, Arkansas, Louisiana, West Virginia (Texas & South Carolina)), makes me curious to see how geographically similar states like Tennessee, Missouri, Indiana and Illinois will play out in their first poll(s). I'm feeling quite confident that all of these 4 states will move considerably towards Hillary as well, although Illinois might possibly be less certain than the first three, as Obama used the state as his campaign base in both of his elections.
The whole list of states having been polled till now, going from Democratic stronghold to Republican stronghold:
New York: D +20.3%
Maine: D +8%
Currently estimated/projected national average: D +6.6%
Minnesota: D +6%
New Jersey: D +5.5% (including Exit Poll from Governor's race)
Michigan: D +4.5%
New Hampshire: D +4.4%
Wisconsin: D +4%
Florida: D +4%
Ohio: D +3.3%
Virginia: D +2.5%
Arkansas: D +2%
Pennsylvania: D +0.7%
Iowa: D +0.4%
Louisiana: R +1%
Georgia: R +2%
North Carolina: R +3%
Kentucky: R +4%
Colorado: R +4.75%
Texas: R +5%
Alaska: R +7%
South Carolina: R +7%
Kansas: R +7%
Mississippi: R +9%
Montana: R +13%
West Virginia: R +14%
Wyoming: R +28%
All lists and numbers above are based on no less than 81 individual polls from different pollsters. The vast majority of them conducted in 2013.
Despite the near inmense number of bad polls for Hillary, Obama and Democrats during the past month or so, Hillary is still expected to beat the tailor-made Republican (which in 18 of 26 cases happens to be Christie) by an impressive projected 6.6% nationally.
7 or 8 states are currently way too close to call; Virginia, Arkansas, Pennsylvania & Iowa (all leaning towards Hillary), plus Louisiana, Georgia and North Carolina (all leaning Republican). After the last Ohio poll, Ohio could possibly be added to the too-close-to-call states, just barely leaning towards Hillary by an average of 3.3%.
Last updated on December 22.
Current update as of December 22.
Adding the four latest polls on North Carolina, Michigan, New Jersey and Pennsylvania to the already extensive state-wide poll database we've been collecting this year.
The number of total state polls added to the lists below has thus now reached 81.
So here they are - all the 2016 poll averages for each state so far - 26 states having been polled to date - and how far off they are compared to the actual 2012 outcomes. I'm only including the Republican candidate with the best statewide polling.
Alaska: Hillary vs Jeb Bush: R +7%
+7% D improvement
(Updated on August 4)
Arkansas: Hillary vs Chris Christie: D +2%
+22% D improvement
Current Democratic gain
(Updated on August 11)
Colorado: Hillary vs Christie: R +4.75%
+10.1% R improvement
Current Republican gain
(Updated on December 9)
Florida: Hillary vs Christie: D +4%
+3% D improvement
(Updated on November 24)
Georgia: Hillary vs Christie: R +2%
+6% D improvement
(Updated August 8 )
Iowa: Hillary vs Christie: D +0.4%
+5.4% R improvement
(Updated on December 17)
Kansas: Hillary vs Paul Ryan: R +7%
+15% D improvement
(Updated on February 26)
Kentucky: Hillary vs Christie/Jeb Bush: R +4%
+19% D improvement
(Updated on December 22)
Louisiana: Hillary vs Paul Ryan/Rand Paul: R +1%
+16% D improvement
(Updated on August 21)
Maine: Hillary vs Christie: D +8%
+7% R improvement
(Updated on November 13)
Michigan: Hillary vs Christie: D +4.5%
+5% R improvement
(Updated on December 12)
Minnesota: Hillary vs Christie: D +6%
+2% R improvement
(Updated on January 22)
Mississippi: Hillary vs Christie: R +9%
+2.5% D improvement
(Updated on November 19)
Montana: Hillary vs Rand Paul: R +13%
+1% D improvement
(Updated on November 24)
New Hampshire: Hillary vs Christie: D +4.4%
+1.2% R improvement
(Updated on September 18)
New Jersey: Hillary vs Christie: D +5.5%
+12.3% R improvement
(Updated on December 12)
New York: Hillary vs Christie: D +20.3%
+7.9% R improvement
(Updated on November 26)
North Carolina: Hillary vs Christie: R +3%
+1% R improvement
(Updated on December 13)
Ohio: Hillary vs Christie: D +3.3%
+0.3% D improvement
(Updated on November 27)
Pennsylvania: Hillary vs Christie: D +0.7%
+4.7% R improvement
(Updated on December 19)
South Carolina: Hillary vs Marco Rubio: R+7%
+3.5% D improvement
(Updated on November 2)
Texas: Hillary vs Jeb Bush: R +5%
+11% D improvement
(Updated on November 8 )
Virginia: Hillary vs Christie: D +2.5%
+1.4% R improvement
(Updated on November 26)
West Virginia: Hillary vs Jeb Bush: R +14%
+13% D improvement
(Updated on October 1)
Wisconsin: Hillary vs Jeb Bush: D +4%
+3% R improvement
(Updated on October 29, though Bush was not among those polled)
Wyoming: Hillary vs Christie: R +28%
+13% D improvement
(Updated on July 23)
Average all 26 states: Hillary vs Best Republican: R +1.6%
+2.7% D improvement (from Obama 2012) [projecting a 6.6% victory for Hillary]
That gives us this map right now:
(
Red = Democratic lead
Blue = Republican lead
Green = Exact tie
Grey = No polling yet
Green = toss up
20% shade = 0.1-1% lead
30% shade = 1.1-3% lead
40% shade = 3.1-6% lead
50% shade = 6.1-9% lead
60% shade = 9.1-12% lead
70% shade = 12.1-15% lead
80% shade = 15.1-18% lead
90% shade = Above 18.1% lead
In the count of electoral votes, this means the current situation looks like this:
Hillary: 195 EVs (for a total of 13 states)
Best/Tailormade Republican: 118 EVs (for a total of 13 states)
Toss-up: None
No polling: 225 EVs [almost half, including California] (for a total of 24 states + D.C.)
Which means that Hillary has captured a rather impressive 62.3% of all EVs awarded thus far, against a more or less disappointing 37.7% EVs for the tailormade Republican. And only New York, Maine and New Jersey of the solidly Democratic states have been polled so far, against no less than 12 solidly Republican states - the biggest one of them, Texas, included. With California added to Hillary's pie, it'll look even more promising for her. Neither to forget such states as D.C., Vermont, Hawaii & Maryland. It's looking like a landslide right now, even without Colorado and Pennsylvania being in Hillary's column.
This is how the Trendline Map looks so far:
(
The states which right now are showing the strongest improvement for the Democratic (Hillary) or the Republican candidate (in 18 out of 26 cases, Christie is that person):
1. Arkansas: D +22%
2. Kentucky: D +19%
3. Louisiana: D +16%
4. Kansas: D +15%
5. West Vriginia: D +13%
6. Wyoming: D +13%
7. New Jersey: R +12.3%
8. Texas: D +11%
9. Colorado: R +10.1%
10. New York: R +7.9%
11. Maine: R +7%
12. Alaska: D +7%
13. Georgia: D +6%
14. Iowa: R +5.4%
15. Michigan: R +5%
16. Pennsylvania: R +4.7%
All of these changes (in the 16 states above) are (more than) statistically significant. We see that (so far) Texas is experiencing a much more rapid change than other demographically quick-changing states like Florida and Georgia. Unfortunately, the 4th quick-changing traditionally Republican state, Arizona, has still not been polled.
The strong D improvement in the Appalachian south (Kentucky, Arkansas, Louisiana, West Virginia (Texas & South Carolina)), makes me curious to see how geographically similar states like Tennessee, Missouri, Indiana and Illinois will play out in their first poll(s). I'm feeling quite confident that all of these 4 states will move considerably towards Hillary as well, although Illinois might possibly be less certain than the first three, as Obama used the state as his campaign base in both of his elections.
The whole list of states having been polled till now, going from Democratic stronghold to Republican stronghold:
New York: D +20.3%
Maine: D +8%
Currently estimated/projected national average: D +6.6%
Minnesota: D +6%
New Jersey: D +5.5% (including Exit Poll from Governor's race)
Michigan: D +4.5%
New Hampshire: D +4.4%
Wisconsin: D +4%
Florida: D +4%
Ohio: D +3.3%
Virginia: D +2.5%
Arkansas: D +2%
Pennsylvania: D +0.7%
Iowa: D +0.4%
Louisiana: R +1%
Georgia: R +2%
North Carolina: R +3%
Kentucky: R +4%
Colorado: R +4.75%
Texas: R +5%
Alaska: R +7%
South Carolina: R +7%
Kansas: R +7%
Mississippi: R +9%
Montana: R +13%
West Virginia: R +14%
Wyoming: R +28%
All lists and numbers above are based on no less than 81 individual polls from different pollsters. The vast majority of them conducted in 2013.
Despite the near inmense number of bad polls for Hillary, Obama and Democrats during the past month or so, Hillary is still expected to beat the tailor-made Republican (which in 18 of 26 cases happens to be Christie) by an impressive projected 6.6% nationally.
7 or 8 states are currently way too close to call; Virginia, Arkansas, Pennsylvania & Iowa (all leaning towards Hillary), plus Louisiana, Georgia and North Carolina (all leaning Republican). After the last Ohio poll, Ohio could possibly be added to the too-close-to-call states, just barely leaning towards Hillary by an average of 3.3%.
Last updated on December 22.
Title: Re: 2016 Official Polling Map Thread
Post by: pbrower2a on December 13, 2013, 10:53:40 AM
NC, PPP
-Just as we found a month ago Chris Christie is the only Republican who leads Hillary Clinton at this point in North Carolina, 45/42. Clinton has modest leads over Jeb Bush (46/45) and Rand Paul (48/44) and then holds a wider lead over Ted Cruz at 49/41.
http://www.publicpolicypolling.com/main/2013/12/north-carolina-miscellany.html#more
blue, Republican -- red, Democratic
30% -- lead with 40-49% but a margin of 3% or less
40% -- lead with 40-49% but a margin of 4% or more
60% -- lead with 50-54%
70% -- lead with 55-59%
90% -- lead with 60% or more
Hillary Clinton vs. Jeb Bush
( )
)
Hillary Clinton vs. Chris Christie
()
Hillary Clinton vs. Rand Paul
( )
)
Hillary Clinton vs. Paul Ryan
()
-Just as we found a month ago Chris Christie is the only Republican who leads Hillary Clinton at this point in North Carolina, 45/42. Clinton has modest leads over Jeb Bush (46/45) and Rand Paul (48/44) and then holds a wider lead over Ted Cruz at 49/41.
http://www.publicpolicypolling.com/main/2013/12/north-carolina-miscellany.html#more
blue, Republican -- red, Democratic
30% -- lead with 40-49% but a margin of 3% or less
40% -- lead with 40-49% but a margin of 4% or more
60% -- lead with 50-54%
70% -- lead with 55-59%
90% -- lead with 60% or more
Hillary Clinton vs. Jeb Bush
(
Hillary Clinton vs. Chris Christie
(
Hillary Clinton vs. Rand Paul
(
Hillary Clinton vs. Paul Ryan
(
Title: Re: 2016 Official Polling Map Thread
Post by: pbrower2a on December 17, 2013, 09:40:34 AM
Quote
In an early look at the 2016 presidential race, New Jersey Gov. Christopher Christie leads former Secretary of State Hillary Clinton 45 - 40 percent.
There is a large gender gap as women back Clinton 49 - 39 percent while men back Christie 51 - 30 percent. Independent voters back the Republican 44 - 35 percent.
In another matchup, Clinton gets 45 percent to 44 percent for U.S. Sen. Rand Paul of Kentucky. She tops U.S. Sen. Ted Cruz of Texas 48 - 41 percent and leads former Florida Gov. Jeb Bush 47 - 40 percent.
http://www.quinnipiac.edu/institutes-and-centers/polling-institute/iowa/release-detail?ReleaseID=1989
blue, Republican -- red, Democratic
30% -- lead with 40-49% but a margin of 3% or less
40% -- lead with 40-49% but a margin of 4% or more
60% -- lead with 50-54%
70% -- lead with 55-59%
90% -- lead with 60% or more
Hillary Clinton vs. Jeb Bush
(
Hillary Clinton vs. Chris Christie
(
Hillary Clinton vs. Rand Paul
(
Hillary Clinton vs. Paul Ryan
(
Title: Re: 2016 Official Polling Map Thread
Post by: pbrower2a on December 19, 2013, 03:32:21 PM
Pennsylvania, Quinnipiac:
Clinton 44, Christie 43
Clinton 52, Paul 40
Clinton 51, Santorum 38
Clinton 52, Bush 36
Clinton 54, Cruz 36
http://www.quinnipiac.edu/institutes-and-centers/polling-institute/pennsylvania/release-detail?ReleaseID=1992
This is with President Obama having an approval rate of only 39% in the state.
blue, Republican -- red, Democratic
30% -- lead with 40-49% but a margin of 3% or less
40% -- lead with 40-49% but a margin of 4% or more
60% -- lead with 50-54%
70% -- lead with 55-59%
90% -- lead with 60% or more
Hillary Clinton vs. Jeb Bush
( )
)
Hillary Clinton vs. Chris Christie
(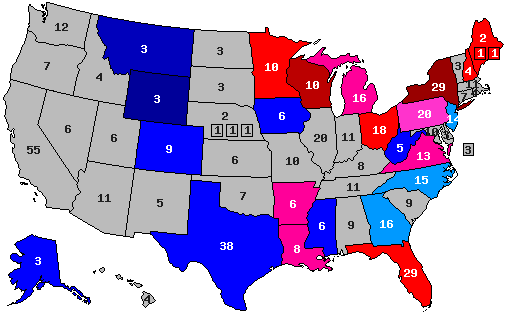 )
)
Hillary Clinton vs. Rand Paul
(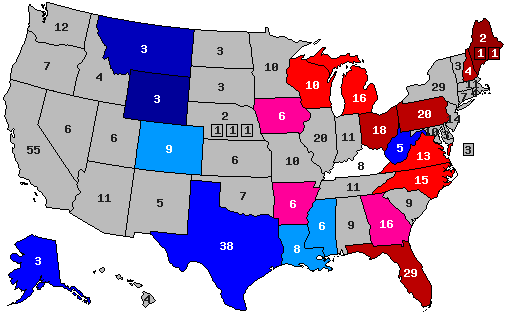 )
)
Hillary Clinton vs. Paul Ryan
(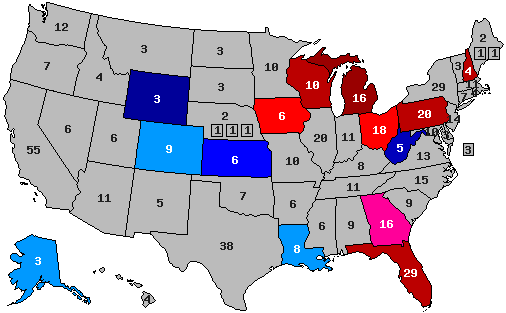 )
)
Clinton 44, Christie 43
Clinton 52, Paul 40
Clinton 51, Santorum 38
Clinton 52, Bush 36
Clinton 54, Cruz 36
http://www.quinnipiac.edu/institutes-and-centers/polling-institute/pennsylvania/release-detail?ReleaseID=1992
This is with President Obama having an approval rate of only 39% in the state.
blue, Republican -- red, Democratic
30% -- lead with 40-49% but a margin of 3% or less
40% -- lead with 40-49% but a margin of 4% or more
60% -- lead with 50-54%
70% -- lead with 55-59%
90% -- lead with 60% or more
Hillary Clinton vs. Jeb Bush
(
Hillary Clinton vs. Chris Christie
(
Hillary Clinton vs. Rand Paul
(
Hillary Clinton vs. Paul Ryan
(
Title: Re: 2016 Official Polling Map Thread
Post by: pbrower2a on December 21, 2013, 07:50:27 AM
49-43 Paul/Clinton
46-42 Bush/Clinton
44-40 Christie/Clinton
44-41 Clinton/Cruz
December 12-15, 2013
Survey of 1,509 Kentucky voters
http://www.scribd.com/document_downloads/192171096?extension=pdf&from=embed&source=embed
blue, Republican -- red, Democratic
30% -- lead with 40-49% but a margin of 3% or less
40% -- lead with 40-49% but a margin of 4% or more
60% -- lead with 50-54%
70% -- lead with 55-59%
90% -- lead with 60% or more
Hillary Clinton vs. Jeb Bush
(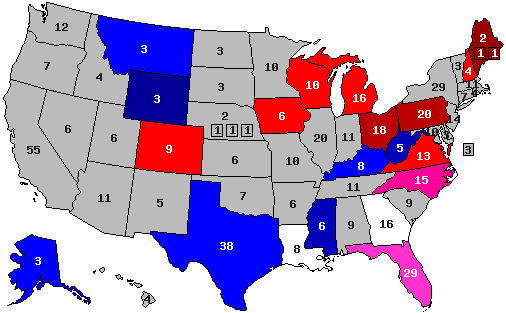 )
)
Hillary Clinton vs. Chris Christie
(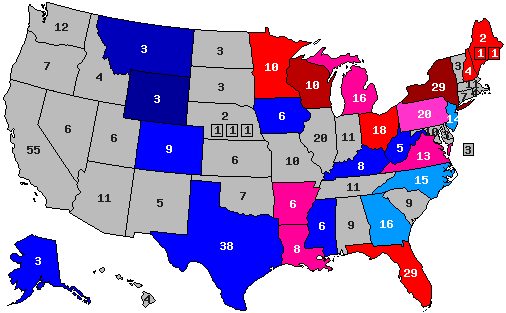 )
)
Hillary Clinton vs. Rand Paul
(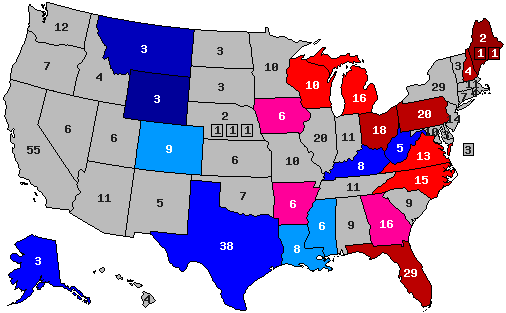 )
)
Hillary Clinton vs. Paul Ryan
()
46-42 Bush/Clinton
44-40 Christie/Clinton
44-41 Clinton/Cruz
December 12-15, 2013
Survey of 1,509 Kentucky voters
http://www.scribd.com/document_downloads/192171096?extension=pdf&from=embed&source=embed
blue, Republican -- red, Democratic
30% -- lead with 40-49% but a margin of 3% or less
40% -- lead with 40-49% but a margin of 4% or more
60% -- lead with 50-54%
70% -- lead with 55-59%
90% -- lead with 60% or more
Hillary Clinton vs. Jeb Bush
(
Hillary Clinton vs. Chris Christie
(
Hillary Clinton vs. Rand Paul
(
Hillary Clinton vs. Paul Ryan
(
Title: Re: 2016 Official Polling Map Thread
Post by: eric82oslo on December 21, 2013, 11:16:28 PM
It's about high time PPP and other pollsters start polling Democratic strongholds like California, Illinois, Washington, Oregon, Nevada, New Mexico, Massachusetts, Maryland, Connecticut and so on.
I've updated my poll database above, which switched Kentucky from Democratic to Republican, going from +2.5% Democratic to +4% Republican, a switch of impressive 6.5%, due to this being the very first time Bush & Christie were included in a Kentucky match-up. Despite this massive change, Hillary is still projected to win the national vote by a 6.6% lead, though that is presuming that every state has an equal importance in the outcome of the national vote, which is of course not the case; Texas will for instance matter a lot more than Alaska or Wyoming. It's thus interesting that Texas is among the states that are currently switching the most strongly towards Hillary. On the other side, New York is trending towards Christie. Florida trends towards Hillary, yet not massively like Texas. Who knows how California will go though. We can only speculate.
I've updated my poll database above, which switched Kentucky from Democratic to Republican, going from +2.5% Democratic to +4% Republican, a switch of impressive 6.5%, due to this being the very first time Bush & Christie were included in a Kentucky match-up. Despite this massive change, Hillary is still projected to win the national vote by a 6.6% lead, though that is presuming that every state has an equal importance in the outcome of the national vote, which is of course not the case; Texas will for instance matter a lot more than Alaska or Wyoming. It's thus interesting that Texas is among the states that are currently switching the most strongly towards Hillary. On the other side, New York is trending towards Christie. Florida trends towards Hillary, yet not massively like Texas. Who knows how California will go though. We can only speculate.
Title: Re: 2016 Official Polling Map Thread
Post by: pbrower2a on January 01, 2014, 10:12:38 AM
I've been slow to do so, but I am ready to drop Paul Ryan in favor of Ted Cruz. Here's why:
1. Paul Ryan shows signs of seeking power within the House of Representatives. Such is shown in his lackluster performance in the Presidential campaign. He wanted to be one of the ten most powerful members of the House more than he wanted to be a heartbeat away from the Presidency.
2. Governor Scott Walker is more likely to be the "Great Midwestern Hope" of the GOP for transforming America into a Christian and Corporate State. He may be abrasive and confrontational -- but that well fits the views of people who want America to be competitive with countries with ultra-cheap labor, who want unions made irrelevant if not outlawed, who want government to represent wealth and bureaucratic power within Corporate America instead of with 'ingrates' who don't realize that their personal poverty is necessary for 'national greatness', who prefer that education train people for servile roles and hard toil instead of offering the ability to judge propaganda, who want the potentially-profitable segments of the public sector sold cheaply to them so that they can be run by profiteering monopolists, and who see dissidents with pure plutocracy as traitors. For standing up to liberals, unions, college students, and environmentalists he is as great a hero to those who want a semi-fascist America as someone who defeated a national enemy. Hell for 90% of the people so that 1% can enjoy sybaritic excess is the norm of (in)human history.
I would replace Paul Ryan with Scott Walker if he were available in polling.
3. We now have plenty of polls with Ted Cruz. He has a following, and if he is less than Presidential as a potential candidate, then such will show much as it did with Mario Rubio this time or Rick Perry the last time -- and if we see him losing Arizona and Missouri we could see someone replacing him in polling. Those with Ryan are now old; PPP did not ask about him in Illinois. Jeb Bush seems more promising than Rubio, who might lose his Senate seat
4. I predict that if Scott Walker is re-elected he will jump to the top of the GOP pack. Until then we get to see how relevant Ted Cruz is.
Title: Re: 2016 Official Polling Map Thread
Post by: pbrower2a on January 01, 2014, 10:22:00 AM
Blank map.
()
(
Title: Re: 2016 Official Polling Map Thread
Post by: pbrower2a on January 01, 2014, 10:26:28 AM
Going back to fill for Clinton vs. Cruz. Start with Kentucky:
http://www.scribd.com/document_downloads/192171096?extension=pdf&from=embed&source=embed
Unambiguous underperformance by Cruz.
Clinton vs. Cruz
blue, Republican -- red, Democratic
30% -- lead with 40-49% but a margin of 3% or less
40% -- lead with 40-49% but a margin of 4% or more
60% -- lead with 50-54%
70% -- lead with 55-59%
90% -- lead with 60% or more
(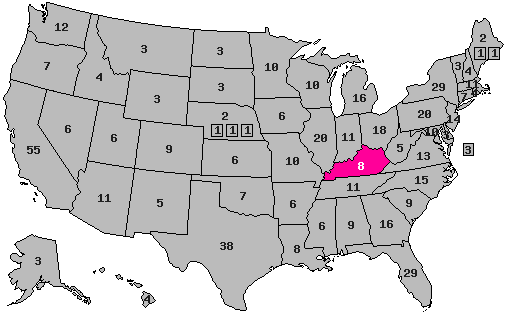 )
)
Quote
49-43 Paul/Clinton
46-42 Bush/Clinton
44-40 Christie/Clinton
44-41 Clinton/Cruz
December 12-15, 2013
Survey of 1,509 Kentucky voters
46-42 Bush/Clinton
44-40 Christie/Clinton
44-41 Clinton/Cruz
December 12-15, 2013
Survey of 1,509 Kentucky voters
http://www.scribd.com/document_downloads/192171096?extension=pdf&from=embed&source=embed
Unambiguous underperformance by Cruz.
Clinton vs. Cruz
blue, Republican -- red, Democratic
30% -- lead with 40-49% but a margin of 3% or less
40% -- lead with 40-49% but a margin of 4% or more
60% -- lead with 50-54%
70% -- lead with 55-59%
90% -- lead with 60% or more
(
Title: Re: 2016 Official Polling Map Thread
Post by: pbrower2a on January 01, 2014, 10:35:57 AM
Iowa, Michigan, North Carolina, Pennsylvania.
The middle shade for Cruz in three of the five states understates the reality because Hillary Clinton has large leads with nearly 50%. She has Pennsylvania by 54-38.
Clinton vs. Cruz
blue, Republican -- red, Democratic
30% -- lead with 40-49% but a margin of 3% or less
40% -- lead with 40-49% but a margin of 4% or more
60% -- lead with 50-54%
70% -- lead with 55-59%
90% -- lead with 60% or more
(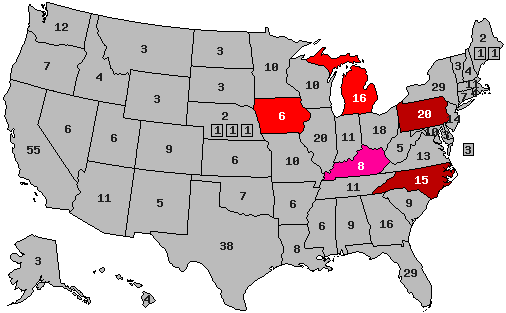 )
)
The middle shade for Cruz in three of the five states understates the reality because Hillary Clinton has large leads with nearly 50%. She has Pennsylvania by 54-38.
Clinton vs. Cruz
blue, Republican -- red, Democratic
30% -- lead with 40-49% but a margin of 3% or less
40% -- lead with 40-49% but a margin of 4% or more
60% -- lead with 50-54%
70% -- lead with 55-59%
90% -- lead with 60% or more
(
Title: Re: 2016 Official Polling Map Thread
Post by: pbrower2a on January 01, 2014, 10:58:33 AM
Back as far as late September -- and I am not using polls by an organization that has "Conservative" in its name or by a newsletter operated by an associate of Newt Gingrich.
FL (Quinn) 52 - 36 percent over Cruz.
MT (PPP) Ted Cruz ......................................................... 50%
Hillary Clinton.................................................. 39%
OH (Quinn) 50 - 35 percent over U.S. Sen. Ted Cruz of Texas.
CO (PPP)
48% Hillary Clinton - 45% Ted Cruz - 7% Not sure
WI (Marquette Law School)
Clinton 55, Cruz 33
TX (PPP)
Cruz leads Clinton only 48/45
ME (PPP)
H Clinton 57 T Cruz 30
CO (Quinn)
Clinton and U.S. Sen. Ted Cruz of Texas tied at 44 - 44 percent (supplants the older PPP poll)
MS (PPP)
Hillary Clinton.................................................. 45%
Ted Cruz ......................................................... 47%
Not sure .......................................................... 9%
WV (PPP)
41% Hillary Clinton - 44% Ted Cruz
Clinton vs. Cruz
blue, Republican -- red, Democratic
30% -- lead with 40-49% but a margin of 3% or less
40% -- lead with 40-49% but a margin of 4% or more
60% -- lead with 50-54%
70% -- lead with 55-59%
90% -- lead with 60% or more
( )
)
FL (Quinn) 52 - 36 percent over Cruz.
MT (PPP) Ted Cruz ......................................................... 50%
Hillary Clinton.................................................. 39%
OH (Quinn) 50 - 35 percent over U.S. Sen. Ted Cruz of Texas.
CO (PPP)
48% Hillary Clinton - 45% Ted Cruz - 7% Not sure
WI (Marquette Law School)
Clinton 55, Cruz 33
TX (PPP)
Cruz leads Clinton only 48/45
ME (PPP)
H Clinton 57 T Cruz 30
CO (Quinn)
Clinton and U.S. Sen. Ted Cruz of Texas tied at 44 - 44 percent (supplants the older PPP poll)
MS (PPP)
Hillary Clinton.................................................. 45%
Ted Cruz ......................................................... 47%
Not sure .......................................................... 9%
WV (PPP)
41% Hillary Clinton - 44% Ted Cruz
Clinton vs. Cruz
blue, Republican -- red, Democratic
30% -- lead with 40-49% but a margin of 3% or less
40% -- lead with 40-49% but a margin of 4% or more
60% -- lead with 50-54%
70% -- lead with 55-59%
90% -- lead with 60% or more
(
Title: Re: 2016 Official Polling Map Thread
Post by: pbrower2a on January 01, 2014, 11:05:00 AM
Clinton vs. Cruz
blue, Republican -- red, Democratic
30% -- lead with 40-49% but a margin of 3% or less
40% -- lead with 40-49% but a margin of 4% or more
60% -- lead with 50-54%
70% -- lead with 55-59%
90% -- lead with 60% or more
()
..........................................................................
With these data points this looks much like Hillary Clinton winning about like Eisenhower over Stevenson in the 1950s or the elder Bush over Dukakis in 1988. It wouldn't be long before we see some fresh Great Right Hope in polling. Ted Cruz has yet to establish himself as Presidential material.
blue, Republican -- red, Democratic
30% -- lead with 40-49% but a margin of 3% or less
40% -- lead with 40-49% but a margin of 4% or more
60% -- lead with 50-54%
70% -- lead with 55-59%
90% -- lead with 60% or more
(
..........................................................................
With these data points this looks much like Hillary Clinton winning about like Eisenhower over Stevenson in the 1950s or the elder Bush over Dukakis in 1988. It wouldn't be long before we see some fresh Great Right Hope in polling. Ted Cruz has yet to establish himself as Presidential material.
Title: Re: 2016 Official Polling Map Thread
Post by: Wolverines34 on January 01, 2014, 11:37:37 PM
wow! amazing maps guys!.
clinton seems to be whipping the floor with everyone, even christie.
clinton seems to be whipping the floor with everyone, even christie.
Title: Re: 2016 Official Polling Map Thread
Post by: pbrower2a on January 02, 2014, 01:15:16 AM
wow! amazing maps guys!.
clinton seems to be whipping the floor with everyone, even christie.
clinton seems to be whipping the floor with everyone, even christie.
If Barack Obama proves all in all a failure as President -- and he still can be -- then the Democrats could lose with the new FDR against the new George W. Bush or (if such is possible) even worse. If he achieves everything that Democrats can imaginably achieve with the Presidency, then the Republicans can win by promising some variant of 'normalcy' nearly a century later.
Hillary Clinton is not 'whipping the floor with Christie'.
Remember -- the Republicans still have the money, and they can use it to convince people of things that make little sense but prove absurd only after the 2020 election.
Title: Re: 2016 Official Polling Map Thread
Post by: IceSpear on January 02, 2014, 07:03:52 AM
wow! amazing maps guys!.
clinton seems to be whipping the floor with everyone, even christie.
clinton seems to be whipping the floor with everyone, even christie.
If Barack Obama proves all in all a failure as President -- and he still can be -- then the Democrats could lose with the new FDR against the new George W. Bush or (if such is possible) even worse.
As I've said in other threads, I think that's absolutely wrong. McCain would've won the election if it took place in mid September 2008 despite the fact that Bush had a 20% approval rating with that very same electorate. Gore and Bush were deadlocked despite Clinton's 65% approval rating. Obama's popularity will be a factor, but it is not anywhere near as big of a factor as everyone thinks. It matters much more in re-election races, not open seats.
Title: Re: 2016 Official Polling Map Thread
Post by: pbrower2a on January 08, 2014, 03:56:18 PM
Posted elsewhere:
Know beforehand:
GOP pollsters Tony Fabrizio and David Lee rolled out a new firm Fabrizio, Lee & Associates that they describe as a successor to Fabrizios former company, Fabrizio McLaughlin & Associates.
[Lee] is certainly at the top of the next generation of GOP pollsters and I am proud to have him as my partner, Fabrizio said in a Tuesday news release.
The name change represents somewhat of a clarification for the firm. In the 1990s, Fabrizio worked with John McLaughlin, but the partnership disbanded amicably over the 1996 presidential campaign, Lee said in an interview with CQ Roll Call. Fabrizio worked for Republican candidate Bob Dole, while McLaughlin polled for Republican rival Steve Forbes.
McLaughlins brother, Jim, continued to work with Fabrizio into the next decade. He left in the early 2000s, but Fabrizio continued to use the McLaughlin name out of convenience, Lee said.
This is the next step in our relationship, Lee added.
The McLaughlin brothers have their own polling firm, McLaughlin & Associates.
http://atr.rollcall.com/republicans-form-new-polling-firm/
Title: Re: 2016 Official Polling Map Thread
Post by: eric82oslo on January 15, 2014, 11:24:28 PM
With a new Harper poll coming out from Michigan yesterday, my stats will have to be updated once more. Hillary lead every one of her 4 opponents by numbers ranging from +2% till +10%, slightly worse than her previous average in the state. Her lead on Christie in the state has thus shrunk from +4.5% till +3.7% right now.
Today though, PPP released two new state polls, which both basically just underscored the already established reality. The New Hampshire poll of Hillary beating Christie by 4% is surprisingly close to the already established consensus of +4.4% in the state. Also the North Carolina poll of Christie +1% was really close to the previous average of 3%.
Current update as of January 16.
The number of total state polls added to the lists below has thus now reached 84.
So here they are - all the 2016 poll averages for each state so far - 26 states having been polled to date - and how far off they are compared to the actual 2012 outcomes. I'm only including the Republican candidate with the best statewide polling.
Alaska: Hillary vs Jeb Bush: R +7%
+7% D improvement
(Updated on August 4)
Arkansas: Hillary vs Chris Christie: D +2%
+22% D improvement
Current Democratic gain
(Updated on August 11)
Colorado: Hillary vs Christie: R +4.75%
+10.1% R improvement
Current Republican gain
(Updated on December 9)
Florida: Hillary vs Christie: D +4%
+3% D improvement
(Updated on November 24)
Georgia: Hillary vs Christie: R +2%
+6% D improvement
(Updated August 8 )
Iowa: Hillary vs Christie: D +0.4%
+5.4% R improvement
(Updated on December 17)
Kansas: Hillary vs Paul Ryan: R +7%
+15% D improvement
(Updated on February 26)
Kentucky: Hillary vs Christie/Jeb Bush: R +4%
+19% D improvement
(Updated on December 22)
Louisiana: Hillary vs Paul Ryan/Rand Paul: R +1%
+16% D improvement
(Updated on August 21)
Maine: Hillary vs Christie: D +8%
+7% R improvement
(Updated on November 13)
Michigan: Hillary vs Christie: D +3.7%
+5.8% R improvement
(Updated on January 16)
Minnesota: Hillary vs Christie: D +6%
+2% R improvement
(Updated on January 22)
Mississippi: Hillary vs Christie: R +9%
+2.5% D improvement
(Updated on November 19)
Montana: Hillary vs Rand Paul: R +13%
+1% D improvement
(Updated on November 24)
New Hampshire: Hillary vs Christie: D +4.3%
+1.3% R improvement
(Updated on January 16)
New Jersey: Hillary vs Christie: D +5.5%
+12.3% R improvement
(Updated on December 12)
New York: Hillary vs Christie: D +20.3%
+7.9% R improvement
(Updated on November 26)
North Carolina: Hillary vs Christie: R +2.3%
+0.3% R improvement
(Updated on January 16)
Ohio: Hillary vs Christie: D +3.3%
+0.3% D improvement
(Updated on November 27)
Pennsylvania: Hillary vs Christie: D +0.7%
+4.7% R improvement
(Updated on December 19)
South Carolina: Hillary vs Marco Rubio: R+7%
+3.5% D improvement
(Updated on November 2)
Texas: Hillary vs Jeb Bush: R +5%
+11% D improvement
(Updated on November 8 )
Virginia: Hillary vs Christie: D +2.5%
+1.4% R improvement
(Updated on November 26)
West Virginia: Hillary vs Jeb Bush: R +14%
+13% D improvement
(Updated on October 1)
Wisconsin: Hillary vs Jeb Bush: D +4%
+3% R improvement
(Updated on October 29, though Bush was not among those polled)
Wyoming: Hillary vs Christie: R +28%
+13% D improvement
(Updated on July 23)
Average all 26 states: Hillary vs Best Republican: R +1.5%
+2.7% D improvement (from Obama 2012) [projecting a 6.6% victory for Hillary]
That gives us this map right now:
()
Red = Democratic lead
Blue = Republican lead
Green = Exact tie
Grey = No polling yet
Green = toss up
20% shade = 0.1-1% lead
30% shade = 1.1-3% lead
40% shade = 3.1-6% lead
50% shade = 6.1-9% lead
60% shade = 9.1-12% lead
70% shade = 12.1-15% lead
80% shade = 15.1-18% lead
90% shade = Above 18.1% lead
In the count of electoral votes, this means the current situation looks like this:
Hillary: 195 EVs (for a total of 13 states)
Best/Tailormade Republican: 118 EVs (for a total of 13 states)
Toss-up: None
No polling: 225 EVs [almost half, including California] (for a total of 24 states + D.C.)
Which means that Hillary has captured a rather impressive 62.3% of all EVs awarded thus far, against a more or less disappointing 37.7% EVs for the tailormade Republican. And only New York, Maine and New Jersey of the solidly Democratic states have been polled so far, against no less than 12 solidly Republican states - the biggest one of them, Texas, included. With California added to Hillary's pie, it'll look even more promising for her. Neither to forget such states as D.C., Vermont, Hawaii & Maryland. It's looking like a landslide right now, even without Colorado and Pennsylvania being in Hillary's column.
This is how the Trendline Map looks so far:
( )
)
The states which right now are showing the strongest improvement for the Democratic (Hillary) or the Republican candidate (in 18 out of 26 cases, Christie is that person):
1. Arkansas: D +22%
2. Kentucky: D +19%
3. Louisiana: D +16%
4. Kansas: D +15%
5. West Vriginia: D +13%
6. Wyoming: D +13%
7. New Jersey: R +12.3%
8. Texas: D +11%
9. Colorado: R +10.1%
10. New York: R +7.9%
11. Maine: R +7%
12. Alaska: D +7%
13. Georgia: D +6%
14. Michigan: R +5.8%
15. Iowa: R +5.4%
16. Pennsylvania: R +4.7%
All of these changes (in the 16 states above) are (more than) statistically significant. We see that (so far) Texas is experiencing a much more rapid change than other demographically quick-changing states like Florida and Georgia. Unfortunately, the 4th quick-changing traditionally Republican state, Arizona, has still not been polled.
The strong D improvement in the Appalachian south (Kentucky, Arkansas, Louisiana, West Virginia (Texas & South Carolina)), makes me curious to see how geographically similar states like Tennessee, Missouri, Indiana and Illinois will play out in their first poll(s). I'm feeling quite confident that all of these 4 states will move considerably towards Hillary as well, although Illinois might possibly be less certain than the first three, as Obama used the state as his campaign base in both of his elections.
The whole list of states having been polled till now, going from Democratic stronghold to Republican stronghold:
New York: D +20.3%
Maine: D +8%
Currently estimated/projected national average: D +6.6%
Minnesota: D +6%
New Jersey: D +5.5% (including Exit Poll from Governor's race)
New Hampshire: D +4.3%
Wisconsin: D +4%
Florida: D +4%
Michigan: D +3.7%
Ohio: D +3.3%
Virginia: D +2.5%
Arkansas: D +2%
Pennsylvania: D +0.7%
Iowa: D +0.4%
Louisiana: R +1%
Georgia: R +2%
North Carolina: R +2.3%
Kentucky: R +4%
Colorado: R +4.75%
Texas: R +5%
Alaska: R +7%
South Carolina: R +7%
Kansas: R +7%
Mississippi: R +9%
Montana: R +13%
West Virginia: R +14%
Wyoming: R +28%
All lists and numbers above are based on no less than 84 individual polls from different pollsters. The vast majority of them conducted in 2013.
Despite the near inmense number of bad polls for Hillary, Obama and Democrats during the past 2-3 month or so, Hillary is still expected to beat the tailor-made Republican (which in 18 of 26 cases happens to be Christie) by an impressive projected 6.6% nationally.
7 or 8 states are currently way too close to call; Virginia, Arkansas, Pennsylvania & Iowa (all leaning towards Hillary), plus Louisiana, Georgia and North Carolina (all leaning Republican). After the last Ohio poll, Ohio could possibly be added to the too-close-to-call states, just barely leaning towards Hillary by an average of 3.3%.
Last updated on January 16.
Today though, PPP released two new state polls, which both basically just underscored the already established reality. The New Hampshire poll of Hillary beating Christie by 4% is surprisingly close to the already established consensus of +4.4% in the state. Also the North Carolina poll of Christie +1% was really close to the previous average of 3%.
Current update as of January 16.
The number of total state polls added to the lists below has thus now reached 84.
So here they are - all the 2016 poll averages for each state so far - 26 states having been polled to date - and how far off they are compared to the actual 2012 outcomes. I'm only including the Republican candidate with the best statewide polling.
Alaska: Hillary vs Jeb Bush: R +7%
+7% D improvement
(Updated on August 4)
Arkansas: Hillary vs Chris Christie: D +2%
+22% D improvement
Current Democratic gain
(Updated on August 11)
Colorado: Hillary vs Christie: R +4.75%
+10.1% R improvement
Current Republican gain
(Updated on December 9)
Florida: Hillary vs Christie: D +4%
+3% D improvement
(Updated on November 24)
Georgia: Hillary vs Christie: R +2%
+6% D improvement
(Updated August 8 )
Iowa: Hillary vs Christie: D +0.4%
+5.4% R improvement
(Updated on December 17)
Kansas: Hillary vs Paul Ryan: R +7%
+15% D improvement
(Updated on February 26)
Kentucky: Hillary vs Christie/Jeb Bush: R +4%
+19% D improvement
(Updated on December 22)
Louisiana: Hillary vs Paul Ryan/Rand Paul: R +1%
+16% D improvement
(Updated on August 21)
Maine: Hillary vs Christie: D +8%
+7% R improvement
(Updated on November 13)
Michigan: Hillary vs Christie: D +3.7%
+5.8% R improvement
(Updated on January 16)
Minnesota: Hillary vs Christie: D +6%
+2% R improvement
(Updated on January 22)
Mississippi: Hillary vs Christie: R +9%
+2.5% D improvement
(Updated on November 19)
Montana: Hillary vs Rand Paul: R +13%
+1% D improvement
(Updated on November 24)
New Hampshire: Hillary vs Christie: D +4.3%
+1.3% R improvement
(Updated on January 16)
New Jersey: Hillary vs Christie: D +5.5%
+12.3% R improvement
(Updated on December 12)
New York: Hillary vs Christie: D +20.3%
+7.9% R improvement
(Updated on November 26)
North Carolina: Hillary vs Christie: R +2.3%
+0.3% R improvement
(Updated on January 16)
Ohio: Hillary vs Christie: D +3.3%
+0.3% D improvement
(Updated on November 27)
Pennsylvania: Hillary vs Christie: D +0.7%
+4.7% R improvement
(Updated on December 19)
South Carolina: Hillary vs Marco Rubio: R+7%
+3.5% D improvement
(Updated on November 2)
Texas: Hillary vs Jeb Bush: R +5%
+11% D improvement
(Updated on November 8 )
Virginia: Hillary vs Christie: D +2.5%
+1.4% R improvement
(Updated on November 26)
West Virginia: Hillary vs Jeb Bush: R +14%
+13% D improvement
(Updated on October 1)
Wisconsin: Hillary vs Jeb Bush: D +4%
+3% R improvement
(Updated on October 29, though Bush was not among those polled)
Wyoming: Hillary vs Christie: R +28%
+13% D improvement
(Updated on July 23)
Average all 26 states: Hillary vs Best Republican: R +1.5%
+2.7% D improvement (from Obama 2012) [projecting a 6.6% victory for Hillary]
That gives us this map right now:
(
Red = Democratic lead
Blue = Republican lead
Green = Exact tie
Grey = No polling yet
Green = toss up
20% shade = 0.1-1% lead
30% shade = 1.1-3% lead
40% shade = 3.1-6% lead
50% shade = 6.1-9% lead
60% shade = 9.1-12% lead
70% shade = 12.1-15% lead
80% shade = 15.1-18% lead
90% shade = Above 18.1% lead
In the count of electoral votes, this means the current situation looks like this:
Hillary: 195 EVs (for a total of 13 states)
Best/Tailormade Republican: 118 EVs (for a total of 13 states)
Toss-up: None
No polling: 225 EVs [almost half, including California] (for a total of 24 states + D.C.)
Which means that Hillary has captured a rather impressive 62.3% of all EVs awarded thus far, against a more or less disappointing 37.7% EVs for the tailormade Republican. And only New York, Maine and New Jersey of the solidly Democratic states have been polled so far, against no less than 12 solidly Republican states - the biggest one of them, Texas, included. With California added to Hillary's pie, it'll look even more promising for her. Neither to forget such states as D.C., Vermont, Hawaii & Maryland. It's looking like a landslide right now, even without Colorado and Pennsylvania being in Hillary's column.
This is how the Trendline Map looks so far:
(
The states which right now are showing the strongest improvement for the Democratic (Hillary) or the Republican candidate (in 18 out of 26 cases, Christie is that person):
1. Arkansas: D +22%
2. Kentucky: D +19%
3. Louisiana: D +16%
4. Kansas: D +15%
5. West Vriginia: D +13%
6. Wyoming: D +13%
7. New Jersey: R +12.3%
8. Texas: D +11%
9. Colorado: R +10.1%
10. New York: R +7.9%
11. Maine: R +7%
12. Alaska: D +7%
13. Georgia: D +6%
14. Michigan: R +5.8%
15. Iowa: R +5.4%
16. Pennsylvania: R +4.7%
All of these changes (in the 16 states above) are (more than) statistically significant. We see that (so far) Texas is experiencing a much more rapid change than other demographically quick-changing states like Florida and Georgia. Unfortunately, the 4th quick-changing traditionally Republican state, Arizona, has still not been polled.
The strong D improvement in the Appalachian south (Kentucky, Arkansas, Louisiana, West Virginia (Texas & South Carolina)), makes me curious to see how geographically similar states like Tennessee, Missouri, Indiana and Illinois will play out in their first poll(s). I'm feeling quite confident that all of these 4 states will move considerably towards Hillary as well, although Illinois might possibly be less certain than the first three, as Obama used the state as his campaign base in both of his elections.
The whole list of states having been polled till now, going from Democratic stronghold to Republican stronghold:
New York: D +20.3%
Maine: D +8%
Currently estimated/projected national average: D +6.6%
Minnesota: D +6%
New Jersey: D +5.5% (including Exit Poll from Governor's race)
New Hampshire: D +4.3%
Wisconsin: D +4%
Florida: D +4%
Michigan: D +3.7%
Ohio: D +3.3%
Virginia: D +2.5%
Arkansas: D +2%
Pennsylvania: D +0.7%
Iowa: D +0.4%
Louisiana: R +1%
Georgia: R +2%
North Carolina: R +2.3%
Kentucky: R +4%
Colorado: R +4.75%
Texas: R +5%
Alaska: R +7%
South Carolina: R +7%
Kansas: R +7%
Mississippi: R +9%
Montana: R +13%
West Virginia: R +14%
Wyoming: R +28%
All lists and numbers above are based on no less than 84 individual polls from different pollsters. The vast majority of them conducted in 2013.
Despite the near inmense number of bad polls for Hillary, Obama and Democrats during the past 2-3 month or so, Hillary is still expected to beat the tailor-made Republican (which in 18 of 26 cases happens to be Christie) by an impressive projected 6.6% nationally.
7 or 8 states are currently way too close to call; Virginia, Arkansas, Pennsylvania & Iowa (all leaning towards Hillary), plus Louisiana, Georgia and North Carolina (all leaning Republican). After the last Ohio poll, Ohio could possibly be added to the too-close-to-call states, just barely leaning towards Hillary by an average of 3.3%.
Last updated on January 16.
Title: Re: 2016 Official Polling Map Thread
Post by: pbrower2a on January 16, 2014, 12:24:47 AM
I haven't included Harper polls commissioned by an organization named "Conservative Intelligence". For much the same reason I would not include polls commissioned by the NAACP.
Title: Re: 2016 Official Polling Map Thread
Post by: pbrower2a on January 17, 2014, 11:15:48 AM
Christie is also the only one of the Republican hopefuls who leads Hillary Clinton in the state (NC), albeit by the razor thin margin of 43/42. Clinton has small leads over Jeb Bush (46/44), Rand Paul (47/43), and Ted Cruz (47/41).
http://www.publicpolicypolling.com/main/2014/01/north-carolinians-strongly-back-teacher-pay-increase.html#more
NH -- Clinton vs. Christie, 43-39, J. Bush 49-38, Cruz 51-32, Paul 50-37
(Really, no change in the map. For reasons explained above I am not showing the Harper poll for "Conservative Intelligence" in Michigan.
blue, Republican -- red, Democratic
30% -- lead with 40-49% but a margin of 3% or less
40% -- lead with 40-49% but a margin of 4% or more
60% -- lead with 50-54%
70% -- lead with 55-59%
90% -- lead with 60% or more
Hillary Clinton vs. Jeb Bush
()
Hillary Clinton vs. Chris Christie
()
Hillary Clinton vs. Rand Paul
()
Hillary Clinton vs. Paul Ryan
()
http://www.publicpolicypolling.com/main/2014/01/north-carolinians-strongly-back-teacher-pay-increase.html#more
NH -- Clinton vs. Christie, 43-39, J. Bush 49-38, Cruz 51-32, Paul 50-37
(Really, no change in the map. For reasons explained above I am not showing the Harper poll for "Conservative Intelligence" in Michigan.
blue, Republican -- red, Democratic
30% -- lead with 40-49% but a margin of 3% or less
40% -- lead with 40-49% but a margin of 4% or more
60% -- lead with 50-54%
70% -- lead with 55-59%
90% -- lead with 60% or more
Hillary Clinton vs. Jeb Bush
(
Hillary Clinton vs. Chris Christie
(
Hillary Clinton vs. Rand Paul
(
Hillary Clinton vs. Paul Ryan
(
Title: Re: 2016 Official Polling Map Thread
Post by: pbrower2a on January 17, 2014, 11:23:48 AM
Hillary Clinton, 47-41 over Cruz in North Carolina, 51-32 over Cruz, NH (PPP)
blue, Republican -- red, Democratic
30% -- lead with 40-49% but a margin of 3% or less
40% -- lead with 40-49% but a margin of 4% or more
60% -- lead with 50-54%
70% -- lead with 55-59%
90% -- lead with 60% or more
(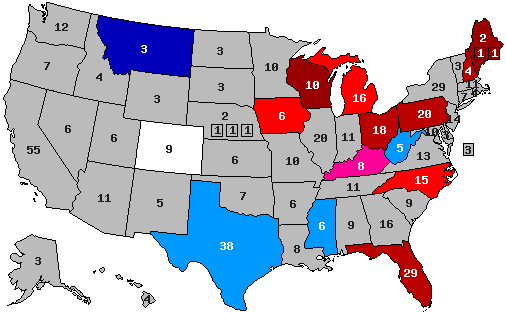 )
)
blue, Republican -- red, Democratic
30% -- lead with 40-49% but a margin of 3% or less
40% -- lead with 40-49% but a margin of 4% or more
60% -- lead with 50-54%
70% -- lead with 55-59%
90% -- lead with 60% or more
(
Title: Re: 2016 Official Polling Map Thread
Post by: MATTROSE94 on January 18, 2014, 06:44:44 PM
Hillary Clinton, 47-41 over Cruz in North Carolina, 51-32 over Cruz, NH (PPP)
blue, Republican -- red, Democratic
30% -- lead with 40-49% but a margin of 3% or less
40% -- lead with 40-49% but a margin of 4% or more
60% -- lead with 50-54%
70% -- lead with 55-59%
90% -- lead with 60% or more
()
blue, Republican -- red, Democratic
30% -- lead with 40-49% but a margin of 3% or less
40% -- lead with 40-49% but a margin of 4% or more
60% -- lead with 50-54%
70% -- lead with 55-59%
90% -- lead with 60% or more
(
Title: Re: 2016 Official Polling Map Thread
Post by: eric82oslo on January 18, 2014, 06:57:57 PM
Hillary Clinton, 47-41 over Cruz in North Carolina, 51-32 over Cruz, NH (PPP)
blue, Republican -- red, Democratic
30% -- lead with 40-49% but a margin of 3% or less
40% -- lead with 40-49% but a margin of 4% or more
60% -- lead with 50-54%
70% -- lead with 55-59%
90% -- lead with 60% or more
()
blue, Republican -- red, Democratic
30% -- lead with 40-49% but a margin of 3% or less
40% -- lead with 40-49% but a margin of 4% or more
60% -- lead with 50-54%
70% -- lead with 55-59%
90% -- lead with 60% or more
(
Texas is changing my friend, and it's changing fast! :P
Title: Re: 2016 Official Polling Map Thread
Post by: New_Conservative on January 19, 2014, 12:49:41 AM
Are you guys taking into account that PPP does have a left-leaning bias?
Title: Re: 2016 Official Polling Map Thread
Post by: Flake on January 19, 2014, 12:59:26 AM
Are you guys taking into account that PPP does have a left-leaning bias?
Actually it was the most accurate pollster in 2012, so I don't think there's much bias.
Title: Re: 2016 Official Polling Map Thread
Post by: Mr. Morden on January 19, 2014, 01:45:15 AM
Are you guys taking into account that PPP does have a left-leaning bias?
Actually it was the most accurate pollster in 2012, so I don't think there's much bias.
By what measure was it the most accurate pollster?
()
Title: Re: 2016 Official Polling Map Thread
Post by: Okay, maybe Mike Johnson is a competent parliamentarian. on January 19, 2014, 04:05:08 AM
Are you guys taking into account that PPP does have a left-leaning bias?
It has that reputation, and it's understandable why it would since it's loosely affiliated with the Democratic Party, but statistically that doesn't seem to actually be the case.
Title: Re: 2016 Official Polling Map Thread
Post by: pbrower2a on January 19, 2014, 12:10:28 PM
Hillary Clinton, 47-41 over Cruz in North Carolina, 51-32 over Cruz, NH (PPP)
blue, Republican -- red, Democratic
30% -- lead with 40-49% but a margin of 3% or less
40% -- lead with 40-49% but a margin of 4% or more
60% -- lead with 50-54%
70% -- lead with 55-59%
90% -- lead with 60% or more
()
blue, Republican -- red, Democratic
30% -- lead with 40-49% but a margin of 3% or less
40% -- lead with 40-49% but a margin of 4% or more
60% -- lead with 50-54%
70% -- lead with 55-59%
90% -- lead with 60% or more
(
Texas is changing my friend, and it's changing fast! :P
Ted Cruz does not have such a strong connection to Texas as one might expect. He was not born there, and even if he is half-Hispanic, he is the wrong sort of Hispanic. He's a right-wing Cuban-American. The vast majority of Texas Hispanics are Mexican-Americans whose political culture is closer to that of New York Jews than to right-wing Cuban-Americans in Florida. Anti-Communism is not the polestar of Mexican-American politics. He's an evangelical Christian, which is very much in the minority of Hispanics of any origin, and being part of a tradition hostile to Roman Catholicism is not good for reaching Catholic voters.
I'm not so sure that Cuban-Americans in Florida are so right-wing as they used to be.
We shall see how well he does in Florida; PPP is polling Florida this weekend. If he isn't even close in Florida his only prospect as a Republican nominee is to go down in a crashing defeat.
Ted Cruz got elected in Texas 56-41; he did worse than Mitt Romney. He has just started a term in the US Senate, and so far he has shown himself an extremist. I'm not discussing what I do with him if he should be down worse in Florida than in North Carolina.
Title: Re: 2016 Official Polling Map Thread
Post by: pbrower2a on January 20, 2014, 09:24:08 AM
Siena, New York
If the 2016 election for president was held today, who would you vote for if the candidates were:
60-32 Clinton/Christie (up from 56-40 in their Nov. poll)
55-35 Cuomo/Christie (Christie was ahead 47-42 in their Nov. poll)
(Nothing else relating to the 2016 Presidential election, but I figure that Jeb Bush, Ted Cruz, Rand Paul, Paul Ryan, and Scott Walker would do even worse in the Empire State). It is surprising that I have no matchups other than Clinton or Cuomo against Christie.
http://www.siena.edu/uploadedfiles/home/parents_and_community/community_page/sri/SNY%20January%202014%20Poll%20Release%20--%20FINAL.pdf
blue, Republican -- red, Democratic
30% -- lead with 40-49% but a margin of 3% or less
40% -- lead with 40-49% but a margin of 4% or more
60% -- lead with 50-54%
70% -- lead with 55-59%
90% -- lead with 60% or more
Hillary Clinton vs. Jeb Bush
()
Hillary Clinton vs. Chris Christie
( )
)
Hillary Clinton vs. Rand Paul
()
Hillary Clinton vs. Paul Ryan
()
If the 2016 election for president was held today, who would you vote for if the candidates were:
60-32 Clinton/Christie (up from 56-40 in their Nov. poll)
55-35 Cuomo/Christie (Christie was ahead 47-42 in their Nov. poll)
(Nothing else relating to the 2016 Presidential election, but I figure that Jeb Bush, Ted Cruz, Rand Paul, Paul Ryan, and Scott Walker would do even worse in the Empire State). It is surprising that I have no matchups other than Clinton or Cuomo against Christie.
http://www.siena.edu/uploadedfiles/home/parents_and_community/community_page/sri/SNY%20January%202014%20Poll%20Release%20--%20FINAL.pdf
blue, Republican -- red, Democratic
30% -- lead with 40-49% but a margin of 3% or less
40% -- lead with 40-49% but a margin of 4% or more
60% -- lead with 50-54%
70% -- lead with 55-59%
90% -- lead with 60% or more
Hillary Clinton vs. Jeb Bush
(
Hillary Clinton vs. Chris Christie
(
Hillary Clinton vs. Rand Paul
(
Hillary Clinton vs. Paul Ryan
(
Title: Re: 2016 Official Polling Map Thread
Post by: eric82oslo on January 20, 2014, 10:10:31 AM
New Jersey has a new poll out, where Hillary is back on her throne, leading Christie with a whooping 21%. This improves Hillary's NJ average by about 5%, and also her national average by 0.2%.
Siena has released its 2nd New York poll on the 2016 election, which translates to the 4th unique NY poll on 2016 regardless of pollster. Out of the 4 polls, this is Hillary's strongest showing against Christie and almost 8% stronger than the previous consensus of polls. Thus her average also improves by 2 percentage points.
The number of total state polls added to the lists below has thus now reached 86.
So here they are - all the 2016 poll averages for each state so far - 26 states having been polled to date - and how far off they are compared to the actual 2012 outcomes. I'm only including the Republican candidate with the best statewide polling.
Alaska: Hillary vs Jeb Bush: R +7%
+7% D improvement
(Updated on August 4)
Arkansas: Hillary vs Chris Christie: D +2%
+22% D improvement
Current Democratic gain
(Updated on August 11)
Colorado: Hillary vs Christie: R +4.75%
+10.1% R improvement
Current Republican gain
(Updated on December 9)
Florida: Hillary vs Christie: D +4%
+3% D improvement
(Updated on November 24)
Georgia: Hillary vs Christie: R +2%
+6% D improvement
(Updated August 8 )
Iowa: Hillary vs Christie: D +0.4%
+5.4% R improvement
(Updated on December 17)
Kansas: Hillary vs Paul Ryan: R +7%
+15% D improvement
(Updated on February 26)
Kentucky: Hillary vs Christie/Jeb Bush: R +4%
+19% D improvement
(Updated on December 22)
Louisiana: Hillary vs Paul Ryan/Rand Paul: R +1%
+16% D improvement
(Updated on August 21)
Maine: Hillary vs Christie: D +8%
+7% R improvement
(Updated on November 13)
Michigan: Hillary vs Christie: D +3.7%
+5.8% R improvement
(Updated on January 16)
Minnesota: Hillary vs Christie: D +6%
+2% R improvement
(Updated on January 22)
Mississippi: Hillary vs Christie: R +9%
+2.5% D improvement
(Updated on November 19)
Montana: Hillary vs Rand Paul: R +13%
+1% D improvement
(Updated on November 24)
New Hampshire: Hillary vs Christie: D +4.3%
+1.3% R improvement
(Updated on January 16)
New Jersey: Hillary vs Christie: D +10.6%
+7.2% R improvement
(Updated on January 22)
New York: Hillary vs Christie: D +22.25%
+5.9% R improvement
(Updated on January 20)
North Carolina: Hillary vs Christie: R +2.3%
+0.3% R improvement
(Updated on January 16)
Ohio: Hillary vs Christie: D +3.3%
+0.3% D improvement
(Updated on November 27)
Pennsylvania: Hillary vs Christie: D +0.7%
+4.7% R improvement
(Updated on December 19)
South Carolina: Hillary vs Marco Rubio: R+7%
+3.5% D improvement
(Updated on November 2)
Texas: Hillary vs Jeb Bush: R +5%
+11% D improvement
(Updated on November 8 )
Virginia: Hillary vs Christie: D +2.5%
+1.4% R improvement
(Updated on November 26)
West Virginia: Hillary vs Jeb Bush: R +14%
+13% D improvement
(Updated on October 1)
Wisconsin: Hillary vs Jeb Bush: D +4%
+3% R improvement
(Updated on October 29, though Bush was not among those polled)
Wyoming: Hillary vs Christie: R +28%
+13% D improvement
(Updated on July 23)
Average all 26 states: Hillary vs Best Republican: R +1.2%
+3.0% D improvement (from Obama 2012) [projecting a 6.9% victory for Hillary]
That gives us this map right now:
( )
)
Red = Democratic lead
Blue = Republican lead
Green = Exact tie
Grey = No polling yet
Green = toss up
20% shade = 0.1-1% lead
30% shade = 1.1-3% lead
40% shade = 3.1-6% lead
50% shade = 6.1-9% lead
60% shade = 9.1-12% lead
70% shade = 12.1-15% lead
80% shade = 15.1-18% lead
90% shade = Above 18.1% lead
In the count of electoral votes, this means the current situation looks like this:
Hillary: 195 EVs (for a total of 13 states)
Best/Tailormade Republican: 118 EVs (for a total of 13 states)
Toss-up: None
No polling: 225 EVs [almost half, including California] (for a total of 24 states + D.C.)
Which means that Hillary has captured a rather impressive 62.3% of all EVs awarded thus far, against a more or less disappointing 37.7% EVs for the tailormade Republican. And only New York, Maine and New Jersey of the solidly Democratic states have been polled so far, against no less than 12 solidly Republican states - the biggest one of them, Texas, included. With California added to Hillary's pie, it'll look even more promising for her. Neither to forget such states as D.C., Vermont, Hawaii & Maryland. It's looking like a landslide right now, even without Colorado and Pennsylvania being in Hillary's column.
This is how the Trendline Map looks so far:
( )
)
The states which right now are showing the strongest improvement for the Democratic (Hillary) or the Republican candidate (in 18 out of 26 cases, Christie is that person):
1. Arkansas: D +22%
2. Kentucky: D +19%
3. Louisiana: D +16%
4. Kansas: D +15%
5. West Vriginia: D +13%
6. Wyoming: D +13%
7. Texas: D +11%
8. Colorado: R +10.1%
9. New Jersey: R +7.2%
10. Maine: R +7%
11. Alaska: D +7%
12. Georgia: D +6%
13. New York: R +5.9%
14. Michigan: R +5.8%
15. Iowa: R +5.4%
16. Pennsylvania: R +4.7%
All of these changes (in the 16 states above) are (more than) statistically significant. We see that (so far) Texas is experiencing a much more rapid change than other demographically quick-changing states like Florida and Georgia. Unfortunately, the 4th quick-changing traditionally Republican state, Arizona, has still not been polled.
The strong D improvement in the Appalachian south (Kentucky, Arkansas, Louisiana, West Virginia (Texas & South Carolina)), makes me curious to see how geographically similar states like Tennessee, Missouri, Indiana and Illinois will play out in their first poll(s). I'm feeling quite confident that all of these 4 states will move considerably towards Hillary as well, although Illinois might possibly be less certain than the first three, as Obama used the state as his campaign base in both of his elections.
The whole list of states having been polled till now, going from Democratic stronghold to Republican stronghold:
New York: D +22.25%
New Jersey: D +10.6%
Maine: D +8%
Currently estimated/projected national average: D +6.9%
Minnesota: D +6%
New Hampshire: D +4.3%
Wisconsin: D +4%
Florida: D +4%
Michigan: D +3.7%
Ohio: D +3.3%
Virginia: D +2.5%
Arkansas: D +2%
Pennsylvania: D +0.7%
Iowa: D +0.4%
Louisiana: R +1%
Georgia: R +2%
North Carolina: R +2.3%
Kentucky: R +4%
Colorado: R +4.75%
Texas: R +5%
Alaska: R +7%
South Carolina: R +7%
Kansas: R +7%
Mississippi: R +9%
Montana: R +13%
West Virginia: R +14%
Wyoming: R +28%
7 or 8 states are currently way too close to call; Virginia, Arkansas, Pennsylvania & Iowa (all leaning towards Hillary), plus Louisiana, Georgia and North Carolina (all leaning Republican). After the last Ohio poll, Ohio could possibly be added to the too-close-to-call states, just barely leaning towards Hillary by an average of 3.3%.
Here are the current stats on Republican candidates:
1. Chris Christie favoured in 18 of 26 states
2. Jeb Bush favoured in 5 states (Texas (!), Wisconsin (!!), Kentucky (!!), West Virginia & Alaska)
3. Paul Ryan favoured in 2 states (Louisiana & Kansas)
4. Rand Paul favoured in 2 states (Louisiana & Montana)
5. Marco Rubio favoured in 1 state (South Carolina)
Current update as of January 22.
Siena has released its 2nd New York poll on the 2016 election, which translates to the 4th unique NY poll on 2016 regardless of pollster. Out of the 4 polls, this is Hillary's strongest showing against Christie and almost 8% stronger than the previous consensus of polls. Thus her average also improves by 2 percentage points.
The number of total state polls added to the lists below has thus now reached 86.
So here they are - all the 2016 poll averages for each state so far - 26 states having been polled to date - and how far off they are compared to the actual 2012 outcomes. I'm only including the Republican candidate with the best statewide polling.
Alaska: Hillary vs Jeb Bush: R +7%
+7% D improvement
(Updated on August 4)
Arkansas: Hillary vs Chris Christie: D +2%
+22% D improvement
Current Democratic gain
(Updated on August 11)
Colorado: Hillary vs Christie: R +4.75%
+10.1% R improvement
Current Republican gain
(Updated on December 9)
Florida: Hillary vs Christie: D +4%
+3% D improvement
(Updated on November 24)
Georgia: Hillary vs Christie: R +2%
+6% D improvement
(Updated August 8 )
Iowa: Hillary vs Christie: D +0.4%
+5.4% R improvement
(Updated on December 17)
Kansas: Hillary vs Paul Ryan: R +7%
+15% D improvement
(Updated on February 26)
Kentucky: Hillary vs Christie/Jeb Bush: R +4%
+19% D improvement
(Updated on December 22)
Louisiana: Hillary vs Paul Ryan/Rand Paul: R +1%
+16% D improvement
(Updated on August 21)
Maine: Hillary vs Christie: D +8%
+7% R improvement
(Updated on November 13)
Michigan: Hillary vs Christie: D +3.7%
+5.8% R improvement
(Updated on January 16)
Minnesota: Hillary vs Christie: D +6%
+2% R improvement
(Updated on January 22)
Mississippi: Hillary vs Christie: R +9%
+2.5% D improvement
(Updated on November 19)
Montana: Hillary vs Rand Paul: R +13%
+1% D improvement
(Updated on November 24)
New Hampshire: Hillary vs Christie: D +4.3%
+1.3% R improvement
(Updated on January 16)
New Jersey: Hillary vs Christie: D +10.6%
+7.2% R improvement
(Updated on January 22)
New York: Hillary vs Christie: D +22.25%
+5.9% R improvement
(Updated on January 20)
North Carolina: Hillary vs Christie: R +2.3%
+0.3% R improvement
(Updated on January 16)
Ohio: Hillary vs Christie: D +3.3%
+0.3% D improvement
(Updated on November 27)
Pennsylvania: Hillary vs Christie: D +0.7%
+4.7% R improvement
(Updated on December 19)
South Carolina: Hillary vs Marco Rubio: R+7%
+3.5% D improvement
(Updated on November 2)
Texas: Hillary vs Jeb Bush: R +5%
+11% D improvement
(Updated on November 8 )
Virginia: Hillary vs Christie: D +2.5%
+1.4% R improvement
(Updated on November 26)
West Virginia: Hillary vs Jeb Bush: R +14%
+13% D improvement
(Updated on October 1)
Wisconsin: Hillary vs Jeb Bush: D +4%
+3% R improvement
(Updated on October 29, though Bush was not among those polled)
Wyoming: Hillary vs Christie: R +28%
+13% D improvement
(Updated on July 23)
Average all 26 states: Hillary vs Best Republican: R +1.2%
+3.0% D improvement (from Obama 2012) [projecting a 6.9% victory for Hillary]
That gives us this map right now:
(
Red = Democratic lead
Blue = Republican lead
Green = Exact tie
Grey = No polling yet
Green = toss up
20% shade = 0.1-1% lead
30% shade = 1.1-3% lead
40% shade = 3.1-6% lead
50% shade = 6.1-9% lead
60% shade = 9.1-12% lead
70% shade = 12.1-15% lead
80% shade = 15.1-18% lead
90% shade = Above 18.1% lead
In the count of electoral votes, this means the current situation looks like this:
Hillary: 195 EVs (for a total of 13 states)
Best/Tailormade Republican: 118 EVs (for a total of 13 states)
Toss-up: None
No polling: 225 EVs [almost half, including California] (for a total of 24 states + D.C.)
Which means that Hillary has captured a rather impressive 62.3% of all EVs awarded thus far, against a more or less disappointing 37.7% EVs for the tailormade Republican. And only New York, Maine and New Jersey of the solidly Democratic states have been polled so far, against no less than 12 solidly Republican states - the biggest one of them, Texas, included. With California added to Hillary's pie, it'll look even more promising for her. Neither to forget such states as D.C., Vermont, Hawaii & Maryland. It's looking like a landslide right now, even without Colorado and Pennsylvania being in Hillary's column.
This is how the Trendline Map looks so far:
(
The states which right now are showing the strongest improvement for the Democratic (Hillary) or the Republican candidate (in 18 out of 26 cases, Christie is that person):
1. Arkansas: D +22%
2. Kentucky: D +19%
3. Louisiana: D +16%
4. Kansas: D +15%
5. West Vriginia: D +13%
6. Wyoming: D +13%
7. Texas: D +11%
8. Colorado: R +10.1%
9. New Jersey: R +7.2%
10. Maine: R +7%
11. Alaska: D +7%
12. Georgia: D +6%
13. New York: R +5.9%
14. Michigan: R +5.8%
15. Iowa: R +5.4%
16. Pennsylvania: R +4.7%
All of these changes (in the 16 states above) are (more than) statistically significant. We see that (so far) Texas is experiencing a much more rapid change than other demographically quick-changing states like Florida and Georgia. Unfortunately, the 4th quick-changing traditionally Republican state, Arizona, has still not been polled.
The strong D improvement in the Appalachian south (Kentucky, Arkansas, Louisiana, West Virginia (Texas & South Carolina)), makes me curious to see how geographically similar states like Tennessee, Missouri, Indiana and Illinois will play out in their first poll(s). I'm feeling quite confident that all of these 4 states will move considerably towards Hillary as well, although Illinois might possibly be less certain than the first three, as Obama used the state as his campaign base in both of his elections.
The whole list of states having been polled till now, going from Democratic stronghold to Republican stronghold:
New York: D +22.25%
New Jersey: D +10.6%
Maine: D +8%
Currently estimated/projected national average: D +6.9%
Minnesota: D +6%
New Hampshire: D +4.3%
Wisconsin: D +4%
Florida: D +4%
Michigan: D +3.7%
Ohio: D +3.3%
Virginia: D +2.5%
Arkansas: D +2%
Pennsylvania: D +0.7%
Iowa: D +0.4%
Louisiana: R +1%
Georgia: R +2%
North Carolina: R +2.3%
Kentucky: R +4%
Colorado: R +4.75%
Texas: R +5%
Alaska: R +7%
South Carolina: R +7%
Kansas: R +7%
Mississippi: R +9%
Montana: R +13%
West Virginia: R +14%
Wyoming: R +28%
7 or 8 states are currently way too close to call; Virginia, Arkansas, Pennsylvania & Iowa (all leaning towards Hillary), plus Louisiana, Georgia and North Carolina (all leaning Republican). After the last Ohio poll, Ohio could possibly be added to the too-close-to-call states, just barely leaning towards Hillary by an average of 3.3%.
Here are the current stats on Republican candidates:
1. Chris Christie favoured in 18 of 26 states
2. Jeb Bush favoured in 5 states (Texas (!), Wisconsin (!!), Kentucky (!!), West Virginia & Alaska)
3. Paul Ryan favoured in 2 states (Louisiana & Kansas)
4. Rand Paul favoured in 2 states (Louisiana & Montana)
5. Marco Rubio favoured in 1 state (South Carolina)
Current update as of January 22.
Title: Re: 2016 Official Polling Map Thread
Post by: pbrower2a on January 21, 2014, 02:45:02 PM
Nationwide:
Quinnipiac: "Bridgegate" takes toll on Christie, now trails Clinton by 8 (Tender Branson)
46-38 Clinton/Christie (was 41-42 in their last poll)
49-39 Clinton/Paul (48-41)
49-38 Clinton/Bush (48-39)
50-35 Clinton/Cruz (50-37)
The drop-off for Christie was 9%, while it was only 2-3% for the other Republicans.
From January 15 - 19, Quinnipiac University surveyed 1,933 registered voters nationwide with a margin of error of +/- 2.2 percentage points. The survey includes 813 Republicans with a margin of error of +/- 3.4 percentage points and 803 Democrats with a margin of error of +/- 3.5 percentage points. Live interviewers call land lines and cell phones.
http://www.quinnipiac.edu/institutes-and-centers/polling-institute/national/release-detail?ReleaseID=1998
Title: Re: 2016 Official Polling Map Thread
Post by: pbrower2a on January 22, 2014, 03:01:27 PM
Rutgers-Eagleton, NJ
The 2016 presidential election is far away, but if the election for president were today, and the
candidates were [ROTATE ORDER: Republican Chris Christie and Democrat Hillary Clinton],
for whom would you vote?
REGISTERED VOTERS
Christie 34%
Clinton 55%
Someone else (vol) 3%
Don't know 8%
Unwgt N= 746
http://www.rci.rutgers.edu/~redlawsk/EP/Tables2014/ChristieRatingsGWBScandalJan2014.pdf
Collapse!
blue, Republican -- red, Democratic
30% -- lead with 40-49% but a margin of 3% or less
40% -- lead with 40-49% but a margin of 4% or more
60% -- lead with 50-54%
70% -- lead with 55-59%
90% -- lead with 60% or more
Hillary Clinton vs. Jeb Bush
()
Hillary Clinton vs. Chris Christie
( )
)
Hillary Clinton vs. Rand Paul
()
Hillary Clinton vs. Paul Ryan
()
The 2016 presidential election is far away, but if the election for president were today, and the
candidates were [ROTATE ORDER: Republican Chris Christie and Democrat Hillary Clinton],
for whom would you vote?
REGISTERED VOTERS
Christie 34%
Clinton 55%
Someone else (vol) 3%
Don't know 8%
Unwgt N= 746
http://www.rci.rutgers.edu/~redlawsk/EP/Tables2014/ChristieRatingsGWBScandalJan2014.pdf
Collapse!
blue, Republican -- red, Democratic
30% -- lead with 40-49% but a margin of 3% or less
40% -- lead with 40-49% but a margin of 4% or more
60% -- lead with 50-54%
70% -- lead with 55-59%
90% -- lead with 60% or more
Hillary Clinton vs. Jeb Bush
(
Hillary Clinton vs. Chris Christie
(
Hillary Clinton vs. Rand Paul
(
Hillary Clinton vs. Paul Ryan
(
Title: Re: 2016 Official Polling Map Thread
Post by: eric82oslo on January 26, 2014, 12:58:53 PM
Average all 26 states: Hillary vs Best Republican: R +1.2%
+3.0% D improvement (from Obama 2012) [projecting a 6.9% victory for Hillary]
The whole list of states having been polled till now, going from Democratic stronghold to Republican stronghold:
New York: D +22.25%
New Jersey: D +10.6%
Maine: D +8%
Currently estimated/projected national average: D +6.9%
Minnesota: D +6%
New Hampshire: D +4.3%
Wisconsin: D +4%
Florida: D +4%
Michigan: D +3.7%
Ohio: D +3.3%
Virginia: D +2.5%
Arkansas: D +2%
Pennsylvania: D +0.7%
Iowa: D +0.4%
Louisiana: R +1%
Georgia: R +2%
North Carolina: R +2.3%
Kentucky: R +4%
Colorado: R +4.75%
Texas: R +5%
Alaska: R +7%
South Carolina: R +7%
Kansas: R +7%
Mississippi: R +9%
Montana: R +13%
West Virginia: R +14%
Wyoming: R +28%
Now, suppose that the remaining 24 states + Washington D.C. all experience a uniform swing like the till now measured national swing of Clinton +3% compared to Obama's 2012 numbers. What would we get in these remaining states? Here's the current answer (filling out with the 26 already polled states' averages):
Washington D.C.: D +86.6%
Hawaii: D +45.7%
Vermont: D +38.6%
Rhode Island: D +30.5%
Maryland: D +29.1%
Massachusetts: D +26.1%
California: D +26.1%
New York: D +22.25%
Delaware: D +21.6%
Connecticut: D +20.3%
Illinois: D +19.9%
Washington: D +17.9%
Oregon: D +15.1%
New Mexico: D +13.2%
New Jersey: D +10.6%
Nevada: D +9.7%
Maine: D +8%
Currently estimated/projected national average: D +6.9%
Minnesota: D +6%
New Hampshire: D +4.3%
Wisconsin: D +4%
Florida: D +4%
Michigan: D +3.7%
Ohio: D +3.3%
Virginia: D +2.5%
Arkansas: D +2%
Pennsylvania: D +0.7%
Iowa: D +0.4%
Louisiana: R +1%
Georgia: R +2%
North Carolina: R +2.3%
Kentucky: R +4%
Colorado: R +4.75%
Texas: R +5%
Arizona: R +6.1%
Missouri: R +6.4%
Alaska: R +7%
South Carolina: R +7%
Kansas: R +7%
Indiana: R +7.2%
Mississippi: R +9%
Montana: R +13%
West Virginia: R +14%
South Dakota: R +15%
North Dakota: R +16.6%
Tennessee: R +17.4%
Nebraska: R +18.8%
Alabama: R +19.2%
Wyoming: R +28%
Idaho: R +28.9%
Oklahoma: R +30.5%
Utah: R +45%
According to these "estimates", the most interesting new states to poll going forward should be these, in descending order of importance/swinging ability:
1. Nevada (D +2.8% more than current national average)
2. New Mexico (D +6.3% more than n.a.)
3. Oregon (D +8.2% more than n.a.)
4. Washington (D +11% more than n.a.)
5. Arizona (R +13% more than n.a.)
6. Illinois (D +13% more than n.a.)
7. Missouri (R +13.3% more than n.a.)
8. Connecticut (D +13.4% more than n.a.)
9. Indiana (R +14.1% more than n.a.)
10. Delaware (D +14.7% more than n.a.)
11. California (D +19.2% more than n.a.)
12. Massachussetts (D +19.2% more than n.a.)
13. South Dakota (R +21.9% more than n.a.)
14. Maryland (D +22.2% more than n.a.)
15. North Dakota (R +23.5% more than n.a.)
16. Rhode Island (D +23.6% more than n.a.)
17. Tennessee (R +24.3% more than n.a.)
The remaining 7 states + D.C. aren't likely to be close in any circumstances.
Here's another fact of the polling done in the 26 states so far. What's the average swing of the 13 Democratic-leaning states (as of 2012) polled so far and what's the average swing of the 13 Republican-leaning states polled thus far? (The only states to have switched colors/allegiance by January 26, 2014 are Colorado & Arkansas.) Well the answer is this:
Average swing of 13 Democratic states polled: R +3.9%
Average swing of 13 Republican states polled: D +9.9%
Now, if we use these metrics above instead, our digital map would rather look like this:
Washington D.C.: D +79.7%
Hawaii: D +38.8%
Vermont: D +31.7%
Rhode Island: D +23.6%
New York: D +22.25%
Maryland: D +22.2%
Massachusetts: D +19.2%
California: D +19.2%
Delaware: D +14.7%
Connecticut: D +13.4%
Illinois: D +13%
Washington: D +11%
New Jersey: D +10.6%
Oregon: D +8.2%
Maine: D +8%
New Mexico: D +6.3%
Minnesota: D +6%
The new estimated/projected national average would then be: D +5.8%
New Hampshire: D +4.3%
Wisconsin: D +4%
Florida: D +4%
Michigan: D +3.7%
Ohio: D +3.3%
Nevada: D +2.8%
Virginia: D +2.5%
Arkansas: D +2%
Arizona: D +0.8%
Pennsylvania: D +0.7%
Missouri: D +0.5%
Iowa: D +0.4%
Indiana: R +0.3%
Louisiana: R +1%
Georgia: R +2%
North Carolina: R +2.3%
Kentucky: R +4%
Colorado: R +4.75%
Texas: R +5%
Alaska: R +7%
South Carolina: R +7%
Kansas: R +7%
South Dakota: R +8.1%
Mississippi: R +9%
North Dakota: R +9.7%
Tennessee: R +10.5%
Nebraska: R +11.9%
Alabama: R +12.3%
Montana: R +13%
West Virginia: R +14%
Idaho: R +22%
Oklahoma: R +23.6%
Wyoming: R +28%
Utah: R +38.1%
The three closest swing/battleground states in 2016 could thus very well be Minnesota and New Mexico, followed by New Hampshire, Wisconsin and Florida. Next in line then follws Michigan, Maine, Oregon, Ohio and Nevada - all seeming like strong possibilities to become crucial battleground states if we rely on this analysis above.
This electoral map would result in 28 states + D.C. supporting Hillary for president, while the other 22 states would support whomever the Republicans decide to nominate. An even more fun fact: With this map we would be taken straight back to the nail-biting 2000 election again, in the sense that no less than 6 states would be decided by a margin of 1% or less!
Moreover, it would give us this state map:
(
Explanation:
30% shade: 0-5% margin
40% shade: 5-10% margin
50% shade: 10-15% margin
60% shade: 15-20% margin
70% shade: 20-25% margin
80% shade: 25-30% margin
90% shade: More than 30% margin
That would give us an amazing 19 battleground states with a winning candidate margin of less than 5%! And that isn't even including the states that would be within 5% of the national popular vote. Then we would have to add another 6 states for a total of 25 states. All in all the map would give us 14 states within 5% of the national popular vote.
And the EV count?
Hillary Clinton: 350 EVs
Republican nominee: 188 EVs
Seems likely/reasonable to you? Be my guest and discuss it if you want.
Title: Re: 2016 Official Polling Map Thread
Post by: IceSpear on January 28, 2014, 11:15:01 AM
That map looks pretty accurate to me if you swap AR and NC.
Title: Re: 2016 Official Polling Map Thread
Post by: pbrower2a on January 30, 2014, 11:30:56 PM
Purple Strategies, Boston Globe, New Hampshire
http://www.bostonglobe.com/metro/2014/01/30/scott-brown-tied-with-jeanne-shaheen-new-hampshire-senate-poll/cWO1QLxO95GlnG3pK7wAUM/story.html
blue, Republican -- red, Democratic
30% -- lead with 40-49% but a margin of 3% or less
40% -- lead with 40-49% but a margin of 4% or more
60% -- lead with 50-54%
70% -- lead with 55-59%
90% -- lead with 60% or more
Hillary Clinton vs. Jeb Bush
()
Hillary Clinton vs. Chris Christie
( )
)
Hillary Clinton vs. Rand Paul
()
Hillary Clinton vs. Paul Ryan
()
Quote
In a head-to-head with Christie, Clinton sits on a statistically insignificant lead of 44 percent to 42 percent, and edges Bush, 46 percent to 42 percent.
...The poll, which carries an error margin of 3 percent for the whole sample, was conducted Jan. 21 through Jan. 23 among 1,052 likely New Hampshire voters.
...The poll, which carries an error margin of 3 percent for the whole sample, was conducted Jan. 21 through Jan. 23 among 1,052 likely New Hampshire voters.
http://www.bostonglobe.com/metro/2014/01/30/scott-brown-tied-with-jeanne-shaheen-new-hampshire-senate-poll/cWO1QLxO95GlnG3pK7wAUM/story.html
blue, Republican -- red, Democratic
30% -- lead with 40-49% but a margin of 3% or less
40% -- lead with 40-49% but a margin of 4% or more
60% -- lead with 50-54%
70% -- lead with 55-59%
90% -- lead with 60% or more
Hillary Clinton vs. Jeb Bush
(
Hillary Clinton vs. Chris Christie
(
Hillary Clinton vs. Rand Paul
(
Hillary Clinton vs. Paul Ryan
(
Title: Re: 2016 Official Polling Map Thread
Post by: pbrower2a on January 31, 2014, 04:04:07 PM
Quinnipiac poll of Florida:
http://www.quinnipiac.edu/institutes-and-centers/polling-institute/florida/release-detail?ReleaseID=2001
Clinton 49%
Bush 43%
Clinton 51%
Rubio 41%
Clinton 53%
Paul 38%
Clinton 51%
Christie 35%
Clinton 52%
Ryan 39%
Clinton 54%
Cruz 34%
The Christie collapse is evident in Florida, one of the two states (Ohio is the other) best described as microcosms of America. If Hillary Clinton can win Florida by a 15% margin against someone not a favorite son and by 6% against a favorite son, then she's going to win the Presidency with an Eisenhower-scale landslide. How tough is that? Except for the LBJ landslide, the highest percentage of the total vote for a Democratic nominee since FDR in 1944 (53.39%) was Obama in 2008 (52.86%).
PPP never released its poll of Florida on the 2016 Presidential election, and I would likely average it with these results. I can't imagine Florida lurching much faster to the political left than the US as a whole.
The New Hampshire poll is probably not wrong for what it measured; it is likely obsolete.
blue, Republican -- red, Democratic
30% -- lead with 40-49% but a margin of 3% or less
40% -- lead with 40-49% but a margin of 4% or more
60% -- lead with 50-54%
70% -- lead with 55-59%
90% -- lead with 60% or more
Hillary Clinton vs. Jeb Bush
( )
)
Hillary Clinton vs. Chris Christie
( )
)
Hillary Clinton vs. Rand Paul
()
Hillary Clinton vs. Paul Ryan
()
http://www.quinnipiac.edu/institutes-and-centers/polling-institute/florida/release-detail?ReleaseID=2001
Clinton 49%
Bush 43%
Clinton 51%
Rubio 41%
Clinton 53%
Paul 38%
Clinton 51%
Christie 35%
Clinton 52%
Ryan 39%
Clinton 54%
Cruz 34%
The Christie collapse is evident in Florida, one of the two states (Ohio is the other) best described as microcosms of America. If Hillary Clinton can win Florida by a 15% margin against someone not a favorite son and by 6% against a favorite son, then she's going to win the Presidency with an Eisenhower-scale landslide. How tough is that? Except for the LBJ landslide, the highest percentage of the total vote for a Democratic nominee since FDR in 1944 (53.39%) was Obama in 2008 (52.86%).
PPP never released its poll of Florida on the 2016 Presidential election, and I would likely average it with these results. I can't imagine Florida lurching much faster to the political left than the US as a whole.
The New Hampshire poll is probably not wrong for what it measured; it is likely obsolete.
blue, Republican -- red, Democratic
30% -- lead with 40-49% but a margin of 3% or less
40% -- lead with 40-49% but a margin of 4% or more
60% -- lead with 50-54%
70% -- lead with 55-59%
90% -- lead with 60% or more
Hillary Clinton vs. Jeb Bush
(
Hillary Clinton vs. Chris Christie
(
Hillary Clinton vs. Rand Paul
(
Hillary Clinton vs. Paul Ryan
(
Title: Re: 2016 Official Polling Map Thread
Post by: pbrower2a on January 31, 2014, 04:27:45 PM
Florida, Quinnipiac:
Clinton vs. Cruz
Clinton 54% -- Cruz 34%
I have yet to take Ted Cruz seriously as a potential Republican nominee for the President. Republican nominees often win Florida by 10% or more ('52, '56, '72, '80, '84, and '88). Democrats have not win Florida by more than 10% since 1948, and it was surprisingly close in the 1964 blowout by LBJ. Carter by 5.3% and Clinton by 6.3% are the two biggest margins for Democratic nominees in Florida.
In case Ted Cruz is seen as a Great Hispanic Hope for Republicans because he is a Cuban-American -- at this spread he would win the votes of Cuban-Americans who still have voodoo dolls of Fidel Castro in which they insert needles and little else among Hispanics. He would likely lose the Cuban-American vote in Florida at this spread.
blue, Republican -- red, Democratic
30% -- lead with 40-49% but a margin of 3% or less
40% -- lead with 40-49% but a margin of 4% or more
60% -- lead with 50-54%
70% -- lead with 55-59%
90% -- lead with 60% or more
(
..........................................................................
With these data points this looks much like Hillary Clinton winning about like Eisenhower over Stevenson in the 1950s or the elder Bush over Dukakis in 1988. It wouldn't be long before we see some fresh Great Right Hope in polling. Ted Cruz has yet to establish himself as Presidential material.
Title: Re: 2016 Official Polling Map Thread
Post by: eric82oslo on January 31, 2014, 06:05:59 PM
We witness a big shift today with our newest supply on Florida. It's the 7th poll officially released on the Sunshine State this season, but only the 2nd one to include Christie as well. And boy do we see tectonic shifts. The previous Republican frontrunner in the state, Christie, see's his average decline from -4% to lackluster -10%. He's basically out of the game in the state now. In comes, instead, Jeb Bush. It means that Florida goes from D +4% to D +7.3%, simultaneously also strenghtening Hillary's Nationwide lead.
Also, Purple Strategies yesterday released what has now become the 5th state poll of New Hampshire, including the four NH polls of 2013. It shows strong numbers for both Christie and Bush, which means a slight improvement of 0.6% for Christie in the state overall.
The number of total state polls added to the lists below has thus now reached 88.
So here they are - all the 2016 poll averages for each state so far - 26 states having been polled to date - and how far off they are compared to the actual 2012 outcomes. I'm only including the Republican candidate with the best statewide polling.
Alaska: Hillary vs Jeb Bush: R +7%
+7% D improvement
(Updated on August 4)
Arkansas: Hillary vs Chris Christie: D +2%
+22% D improvement
Current Democratic gain
(Updated on August 11)
Colorado: Hillary vs Christie: R +4.75%
+10.1% R improvement
Current Republican gain
(Updated on December 9)
Florida: Hillary vs Bush: D +7.3%
+6.4% D improvement
(Updated on January 31)
Georgia: Hillary vs Christie: R +2%
+6% D improvement
(Updated August 8 )
Iowa: Hillary vs Christie: D +0.4%
+5.4% R improvement
(Updated on December 17)
Kansas: Hillary vs Paul Ryan: R +7%
+15% D improvement
(Updated on February 26)
Kentucky: Hillary vs Christie/Jeb Bush: R +4%
+19% D improvement
(Updated on December 22)
Louisiana: Hillary vs Paul Ryan/Rand Paul: R +1%
+16% D improvement
(Updated on August 21)
Maine: Hillary vs Christie: D +8%
+7% R improvement
(Updated on November 13)
Michigan: Hillary vs Christie: D +3.7%
+5.8% R improvement
(Updated on January 16)
Minnesota: Hillary vs Christie: D +6%
+2% R improvement
(Updated on January 22)
Mississippi: Hillary vs Christie: R +9%
+2.5% D improvement
(Updated on November 19)
Montana: Hillary vs Rand Paul: R +13%
+1% D improvement
(Updated on November 24)
New Hampshire: Hillary vs Christie: D +3.7%
+1.9% R improvement
(Updated on January 30)
New Jersey: Hillary vs Christie: D +10.6%
+7.2% R improvement
(Updated on January 22
New York: Hillary vs Christie: D +22.25%
+5.9% R improvement
(Updated on January 20)
North Carolina: Hillary vs Christie: R +2.3%
+0.3% R improvement
(Updated on January 16)
Ohio: Hillary vs Christie: D +3.3%
+0.3% D improvement
(Updated on November 27)
Pennsylvania: Hillary vs Christie: D +0.7%
+4.7% R improvement
(Updated on December 19)
South Carolina: Hillary vs Marco Rubio: R+7%
+3.5% D improvement
(Updated on November 2)
Texas: Hillary vs Jeb Bush: R +5%
+11% D improvement
(Updated on November 8 )
Virginia: Hillary vs Christie: D +2.5%
+1.4% R improvement
(Updated on November 26)
West Virginia: Hillary vs Jeb Bush: R +14%
+13% D improvement
(Updated on October 1)
Wisconsin: Hillary vs Jeb Bush: D +4%
+3% R improvement
(Updated on October 29)
Wyoming: Hillary vs Christie: R +28%
+13% D improvement
(Updated on July 23)
Average all 26 states: Hillary vs Best Republican: R +1.1%
+3.1% D improvement (from Obama 2012) [projecting a 7% victory for Hillary]
That gives us this map right now:
( )
)
Red = Democratic lead
Blue = Republican lead
Green = Exact tie
Grey = No polling yet
Green = toss up
20% shade = 0.1-1% lead
30% shade = 1.1-3% lead
40% shade = 3.1-6% lead
50% shade = 6.1-9% lead
60% shade = 9.1-12% lead
70% shade = 12.1-15% lead
80% shade = 15.1-18% lead
90% shade = Above 18.1% lead
In the count of electoral votes, this means the current situation looks like this:
Hillary: 195 EVs (for a total of 13 states)
Best/Tailormade Republican: 118 EVs (for a total of 13 states)
Toss-up: None
No polling: 225 EVs [almost half, including California] (for a total of 24 states + D.C.)
Which means that Hillary has captured a rather impressive 62.3% of all EVs awarded thus far, against a more or less disappointing 37.7% EVs for the tailormade Republican. And only New York, Maine and New Jersey of the solidly Democratic states have been polled so far, against no less than 12 solidly Republican states - the biggest one of them, Texas, included. With California added to Hillary's pie, it'll look even more promising for her. Neither to forget such states as D.C., Vermont, Hawaii & Maryland. It's looking like a landslide right now, even without Colorado and Pennsylvania being in Hillary's column.
This is how the Trendline Map looks so far:
( )
)
The states which right now are showing the strongest improvement for the Democratic (Hillary) or the Republican candidate (in 17 out of 26 cases, Christie is that person):
1. Arkansas: D +22%
2. Kentucky: D +19%
3. Louisiana: D +16%
4. Kansas: D +15%
5. West Vriginia: D +13%
6. Wyoming: D +13%
7. Texas: D +11%
8. Colorado: R +10.1%
9. New Jersey: R +7.2%
10. Maine: R +7%
11. Alaska: D +7%
12. Florida: D +6.4%
13. Georgia: D +6%
14. New York: R +5.9%
15. Michigan: R +5.8%
16. Iowa: R +5.4%
17. Pennsylvania: R +4.7%
All of these changes (in the 17 states above) are (more than) statistically significant. We see that (so far) Texas is experiencing a much more rapid change than other demographically quick-changing states like Florida and Georgia. Unfortunately, the 4th quick-changing traditionally Republican state, Arizona, has still not been polled.
The strong D improvement in the Appalachian south (Kentucky, Arkansas, Louisiana, West Virginia (Texas & South Carolina)), makes me curious to see how geographically similar states like Tennessee, Missouri, Indiana and Illinois will play out in their first poll(s). I'm feeling quite confident that all of these 4 states will move considerably towards Hillary as well, although Illinois might possibly be less certain than the first three, as Obama used the state as his campaign base in both of his elections.
The whole list of states having been polled till now, going from Democratic stronghold to Republican stronghold:
New York: D +22.25%
New Jersey: D +10.6%
Maine: D +8%
Florida: D +7.3%
Currently estimated/projected national average: D +7%
Minnesota: D +6%
Wisconsin: D +4%
Michigan: D +3.7%
New Hampshire: D +3.7%
Ohio: D +3.3%
Virginia: D +2.5%
Arkansas: D +2%
Pennsylvania: D +0.7%
Iowa: D +0.4%
Louisiana: R +1%
Georgia: R +2%
North Carolina: R +2.3%
Kentucky: R +4%
Colorado: R +4.75%
Texas: R +5%
Alaska: R +7%
South Carolina: R +7%
Kansas: R +7%
Mississippi: R +9%
Montana: R +13%
West Virginia: R +14%
Wyoming: R +28%
7 or 8 states are currently way too close to call; Virginia, Arkansas, Pennsylvania & Iowa (all leaning towards Hillary), plus Louisiana, Georgia and North Carolina (all leaning Republican). After the last Ohio poll, Ohio could possibly be added to the too-close-to-call states, just barely leaning towards Hillary by an average of 3.3%.
Here are the current stats on Republican candidates:
1. Chris Christie favoured in 17 of 26 states
2. Jeb Bush favoured in 6 states (Texas (!), Florida, Wisconsin (!!), Kentucky (!!), West Virginia & Alaska)
3. Paul Ryan favoured in 2 states (Louisiana & Kansas)
4. Rand Paul favoured in 2 states (Louisiana & Montana)
5. Marco Rubio favoured in 1 state (South Carolina)
Current update as of January 31.
Also, Purple Strategies yesterday released what has now become the 5th state poll of New Hampshire, including the four NH polls of 2013. It shows strong numbers for both Christie and Bush, which means a slight improvement of 0.6% for Christie in the state overall.
The number of total state polls added to the lists below has thus now reached 88.
So here they are - all the 2016 poll averages for each state so far - 26 states having been polled to date - and how far off they are compared to the actual 2012 outcomes. I'm only including the Republican candidate with the best statewide polling.
Alaska: Hillary vs Jeb Bush: R +7%
+7% D improvement
(Updated on August 4)
Arkansas: Hillary vs Chris Christie: D +2%
+22% D improvement
Current Democratic gain
(Updated on August 11)
Colorado: Hillary vs Christie: R +4.75%
+10.1% R improvement
Current Republican gain
(Updated on December 9)
Florida: Hillary vs Bush: D +7.3%
+6.4% D improvement
(Updated on January 31)
Georgia: Hillary vs Christie: R +2%
+6% D improvement
(Updated August 8 )
Iowa: Hillary vs Christie: D +0.4%
+5.4% R improvement
(Updated on December 17)
Kansas: Hillary vs Paul Ryan: R +7%
+15% D improvement
(Updated on February 26)
Kentucky: Hillary vs Christie/Jeb Bush: R +4%
+19% D improvement
(Updated on December 22)
Louisiana: Hillary vs Paul Ryan/Rand Paul: R +1%
+16% D improvement
(Updated on August 21)
Maine: Hillary vs Christie: D +8%
+7% R improvement
(Updated on November 13)
Michigan: Hillary vs Christie: D +3.7%
+5.8% R improvement
(Updated on January 16)
Minnesota: Hillary vs Christie: D +6%
+2% R improvement
(Updated on January 22)
Mississippi: Hillary vs Christie: R +9%
+2.5% D improvement
(Updated on November 19)
Montana: Hillary vs Rand Paul: R +13%
+1% D improvement
(Updated on November 24)
New Hampshire: Hillary vs Christie: D +3.7%
+1.9% R improvement
(Updated on January 30)
New Jersey: Hillary vs Christie: D +10.6%
+7.2% R improvement
(Updated on January 22
New York: Hillary vs Christie: D +22.25%
+5.9% R improvement
(Updated on January 20)
North Carolina: Hillary vs Christie: R +2.3%
+0.3% R improvement
(Updated on January 16)
Ohio: Hillary vs Christie: D +3.3%
+0.3% D improvement
(Updated on November 27)
Pennsylvania: Hillary vs Christie: D +0.7%
+4.7% R improvement
(Updated on December 19)
South Carolina: Hillary vs Marco Rubio: R+7%
+3.5% D improvement
(Updated on November 2)
Texas: Hillary vs Jeb Bush: R +5%
+11% D improvement
(Updated on November 8 )
Virginia: Hillary vs Christie: D +2.5%
+1.4% R improvement
(Updated on November 26)
West Virginia: Hillary vs Jeb Bush: R +14%
+13% D improvement
(Updated on October 1)
Wisconsin: Hillary vs Jeb Bush: D +4%
+3% R improvement
(Updated on October 29)
Wyoming: Hillary vs Christie: R +28%
+13% D improvement
(Updated on July 23)
Average all 26 states: Hillary vs Best Republican: R +1.1%
+3.1% D improvement (from Obama 2012) [projecting a 7% victory for Hillary]
That gives us this map right now:
(
Red = Democratic lead
Blue = Republican lead
Green = Exact tie
Grey = No polling yet
Green = toss up
20% shade = 0.1-1% lead
30% shade = 1.1-3% lead
40% shade = 3.1-6% lead
50% shade = 6.1-9% lead
60% shade = 9.1-12% lead
70% shade = 12.1-15% lead
80% shade = 15.1-18% lead
90% shade = Above 18.1% lead
In the count of electoral votes, this means the current situation looks like this:
Hillary: 195 EVs (for a total of 13 states)
Best/Tailormade Republican: 118 EVs (for a total of 13 states)
Toss-up: None
No polling: 225 EVs [almost half, including California] (for a total of 24 states + D.C.)
Which means that Hillary has captured a rather impressive 62.3% of all EVs awarded thus far, against a more or less disappointing 37.7% EVs for the tailormade Republican. And only New York, Maine and New Jersey of the solidly Democratic states have been polled so far, against no less than 12 solidly Republican states - the biggest one of them, Texas, included. With California added to Hillary's pie, it'll look even more promising for her. Neither to forget such states as D.C., Vermont, Hawaii & Maryland. It's looking like a landslide right now, even without Colorado and Pennsylvania being in Hillary's column.
This is how the Trendline Map looks so far:
(
The states which right now are showing the strongest improvement for the Democratic (Hillary) or the Republican candidate (in 17 out of 26 cases, Christie is that person):
1. Arkansas: D +22%
2. Kentucky: D +19%
3. Louisiana: D +16%
4. Kansas: D +15%
5. West Vriginia: D +13%
6. Wyoming: D +13%
7. Texas: D +11%
8. Colorado: R +10.1%
9. New Jersey: R +7.2%
10. Maine: R +7%
11. Alaska: D +7%
12. Florida: D +6.4%
13. Georgia: D +6%
14. New York: R +5.9%
15. Michigan: R +5.8%
16. Iowa: R +5.4%
17. Pennsylvania: R +4.7%
All of these changes (in the 17 states above) are (more than) statistically significant. We see that (so far) Texas is experiencing a much more rapid change than other demographically quick-changing states like Florida and Georgia. Unfortunately, the 4th quick-changing traditionally Republican state, Arizona, has still not been polled.
The strong D improvement in the Appalachian south (Kentucky, Arkansas, Louisiana, West Virginia (Texas & South Carolina)), makes me curious to see how geographically similar states like Tennessee, Missouri, Indiana and Illinois will play out in their first poll(s). I'm feeling quite confident that all of these 4 states will move considerably towards Hillary as well, although Illinois might possibly be less certain than the first three, as Obama used the state as his campaign base in both of his elections.
The whole list of states having been polled till now, going from Democratic stronghold to Republican stronghold:
New York: D +22.25%
New Jersey: D +10.6%
Maine: D +8%
Florida: D +7.3%
Currently estimated/projected national average: D +7%
Minnesota: D +6%
Wisconsin: D +4%
Michigan: D +3.7%
New Hampshire: D +3.7%
Ohio: D +3.3%
Virginia: D +2.5%
Arkansas: D +2%
Pennsylvania: D +0.7%
Iowa: D +0.4%
Louisiana: R +1%
Georgia: R +2%
North Carolina: R +2.3%
Kentucky: R +4%
Colorado: R +4.75%
Texas: R +5%
Alaska: R +7%
South Carolina: R +7%
Kansas: R +7%
Mississippi: R +9%
Montana: R +13%
West Virginia: R +14%
Wyoming: R +28%
7 or 8 states are currently way too close to call; Virginia, Arkansas, Pennsylvania & Iowa (all leaning towards Hillary), plus Louisiana, Georgia and North Carolina (all leaning Republican). After the last Ohio poll, Ohio could possibly be added to the too-close-to-call states, just barely leaning towards Hillary by an average of 3.3%.
Here are the current stats on Republican candidates:
1. Chris Christie favoured in 17 of 26 states
2. Jeb Bush favoured in 6 states (Texas (!), Florida, Wisconsin (!!), Kentucky (!!), West Virginia & Alaska)
3. Paul Ryan favoured in 2 states (Louisiana & Kansas)
4. Rand Paul favoured in 2 states (Louisiana & Montana)
5. Marco Rubio favoured in 1 state (South Carolina)
Current update as of January 31.
Title: Re: 2016 Official Polling Map Thread
Post by: pbrower2a on January 31, 2014, 07:41:10 PM
This is the best scenario that I can see a Republican nominee having if he can't rely upon Florida. He can still win:
(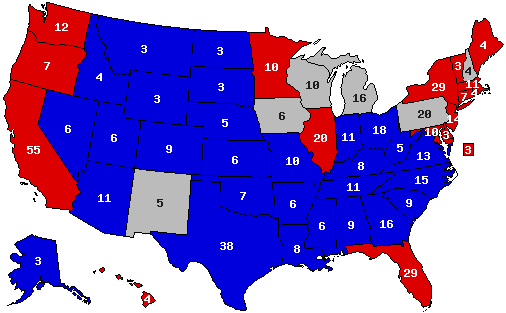 )
)
In essence the Republican nominee has sealed every state that has gone to Dubya twice except Florida (which is lost), but the Democrat is struggling in Iowa, Michigan, New Hampshire, New Mexico, Pennsylvania, and Wisconsin. (I pick those states because Iowa, New Hampshire, and New Mexico all went for Dubya once; Wisconsin was extremely close in 2004; Pennsylvania was second-closest to being the tipping-point state in 2012, and Michigan could be volatile in the event of a disaster in the shaky automobile industry).
The Democratic nominee has locked up 225 electoral votes, and the Republican nominee has locked up 252 electoral votes. The Republican nominee can still lock up the election with Pennsylvania absolutely decisive in favor of the Republican but not absolutely necessary.
Here are five ways with no overlap for a Democrat to win:
1. PA MI WI
2. PA MI NM NH
3. PA MI IA NM
4. PA MI IA NH
5. PA WI IA NM NH
Here are the ways in which a Republican wins, again with no overlap:
1. PA
2. MI IA
3. MI NH
4. MI WI
5. WI IA NH
Shift Nevada and its mere 5 electoral votes into the D category, and things get literally dicey (pun intended) for the Republican. The Democrat gets three more ways in which to win, and the Republican gets four more ways to win -- but those involve more contingencies.
(
In essence the Republican nominee has sealed every state that has gone to Dubya twice except Florida (which is lost), but the Democrat is struggling in Iowa, Michigan, New Hampshire, New Mexico, Pennsylvania, and Wisconsin. (I pick those states because Iowa, New Hampshire, and New Mexico all went for Dubya once; Wisconsin was extremely close in 2004; Pennsylvania was second-closest to being the tipping-point state in 2012, and Michigan could be volatile in the event of a disaster in the shaky automobile industry).
The Democratic nominee has locked up 225 electoral votes, and the Republican nominee has locked up 252 electoral votes. The Republican nominee can still lock up the election with Pennsylvania absolutely decisive in favor of the Republican but not absolutely necessary.
Here are five ways with no overlap for a Democrat to win:
1. PA MI WI
2. PA MI NM NH
3. PA MI IA NM
4. PA MI IA NH
5. PA WI IA NM NH
Here are the ways in which a Republican wins, again with no overlap:
1. PA
2. MI IA
3. MI NH
4. MI WI
5. WI IA NH
Shift Nevada and its mere 5 electoral votes into the D category, and things get literally dicey (pun intended) for the Republican. The Democrat gets three more ways in which to win, and the Republican gets four more ways to win -- but those involve more contingencies.
Title: Re: 2016 Official Polling Map Thread
Post by: eric82oslo on February 06, 2014, 12:06:24 AM
PPP has polled Alaska once again (third time this season). Just like the previous times, Jeb Bush is still the strongest candidate in the state, though Rand Paul is not far behind (does only 1,5% worse). Jeb Bush is ever so slightly expanding his lead in the state (going from +7% to +7.5%.
The number of total state polls added to the lists below has thus now reached 89.
So here they are - all the 2016 poll averages for each state so far - 26 states having been polled to date - and how far off they are compared to the actual 2012 outcomes. I'm only including the Republican candidate with the best statewide polling.
Alaska: Hillary vs Jeb Bush: R +7.5%
+6.5% D improvement
(Updated on February 5, 2014)
Arkansas: Hillary vs Chris Christie: D +2%
+22% D improvement
Current Democratic gain
(Updated on August 11)
Colorado: Hillary vs Christie: R +4.75%
+10.1% R improvement
Current Republican gain
(Updated on December 9)
Florida: Hillary vs Bush: D +7.3%
+6.4% D improvement
(Updated on January 31, 2014)
Georgia: Hillary vs Christie: R +2%
+6% D improvement
(Updated August 8 )
Iowa: Hillary vs Christie: D +0.4%
+5.4% R improvement
(Updated on December 17)
Kansas: Hillary vs Paul Ryan: R +7%
+15% D improvement
(Updated on February 26)
Kentucky: Hillary vs Christie/Jeb Bush: R +4%
+19% D improvement
(Updated on December 22)
Louisiana: Hillary vs Paul Ryan/Rand Paul: R +1%
+16% D improvement
(Updated on August 21)
Maine: Hillary vs Christie: D +8%
+7% R improvement
(Updated on November 13)
Michigan: Hillary vs Christie: D +3.7%
+5.8% R improvement
(Updated on January 16, 2014)
Minnesota: Hillary vs Christie: D +6%
+2% R improvement
(Updated on January 22, 2013)
Mississippi: Hillary vs Christie: R +9%
+2.5% D improvement
(Updated on November 19)
Montana: Hillary vs Rand Paul: R +13%
+1% D improvement
(Updated on November 24)
New Hampshire: Hillary vs Christie: D +3.7%
+1.9% R improvement
(Updated on January 30, 2014)
New Jersey: Hillary vs Christie: D +10.6%
+7.2% R improvement
(Updated on January 22, 2014)
New York: Hillary vs Christie: D +22.25%
+5.9% R improvement
(Updated on January 20, 2014)
North Carolina: Hillary vs Christie: R +2.3%
+0.3% R improvement
(Updated on January 16, 2014)
Ohio: Hillary vs Christie: D +3.3%
+0.3% D improvement
(Updated on November 27)
Pennsylvania: Hillary vs Christie: D +0.7%
+4.7% R improvement
(Updated on December 19)
South Carolina: Hillary vs Marco Rubio: R+7%
+3.5% D improvement
(Updated on November 2)
Texas: Hillary vs Jeb Bush: R +5%
+11% D improvement
(Updated on November 8 )
Virginia: Hillary vs Christie: D +2.5%
+1.4% R improvement
(Updated on November 26)
West Virginia: Hillary vs Jeb Bush: R +14%
+13% D improvement
(Updated on October 1)
Wisconsin: Hillary vs Jeb Bush: D +4%
+3% R improvement
(Updated on October 29)
Wyoming: Hillary vs Christie: R +28%
+13% D improvement
(Updated on July 23)
Average all 26 states: Hillary vs Best Republican: R +1.1%
+3.1% D improvement (from Obama 2012) [projecting a 7% victory for Hillary]
That gives us this map right now:
()
Red = Democratic lead
Blue = Republican lead
Green = Exact tie
Grey = No polling yet
Green = toss up
20% shade = 0.1-1% lead
30% shade = 1.1-3% lead
40% shade = 3.1-6% lead
50% shade = 6.1-9% lead
60% shade = 9.1-12% lead
70% shade = 12.1-15% lead
80% shade = 15.1-18% lead
90% shade = Above 18.1% lead
In the count of electoral votes, this means the current situation looks like this:
Hillary: 195 EVs (for a total of 13 states)
Best/Tailormade Republican: 118 EVs (for a total of 13 states)
Toss-up: None
No polling: 225 EVs [almost half, including California] (for a total of 24 states + D.C.)
Which means that Hillary has captured a rather impressive 62.3% of all EVs awarded thus far, against a more or less disappointing 37.7% EVs for the tailormade Republican. And only New York, Maine and New Jersey of the solidly Democratic states have been polled so far, against no less than 12 solidly Republican states - the biggest one of them, Texas, included. With California added to Hillary's pie, it'll look even more promising for her. Neither to forget such states as D.C., Vermont, Hawaii & Maryland. It's looking like a landslide right now, even without Colorado and Pennsylvania being in Hillary's column.
This is how the Trendline Map looks so far:
()
The states which right now are showing the strongest improvement for the Democratic (Hillary) or the Republican candidate (in 17 out of 26 cases, Christie is that person):
1. Arkansas: D +22%
2. Kentucky: D +19%
3. Louisiana: D +16%
4. Kansas: D +15%
5. West Virginia: D +13%
6. Wyoming: D +13%
7. Texas: D +11%
8. Colorado: R +10.1%
9. New Jersey: R +7.2%
10. Maine: R +7%
11. Alaska: D +6.5%
12. Florida: D +6.4%
13. Georgia: D +6%
14. New York: R +5.9%
15. Michigan: R +5.8%
16. Iowa: R +5.4%
17. Pennsylvania: R +4.7%
All of these changes (in the 17 states above) are (more than) statistically significant. We see that (so far) Texas is experiencing a much more rapid change than other demographically quick-changing states like Florida and Georgia. Unfortunately, the 4th quick-changing traditionally Republican state, Arizona, has still not been polled.
The strong D improvement in the Appalachian south (Kentucky, Arkansas, Louisiana, West Virginia (Texas & South Carolina)), makes me curious to see how geographically similar states like Tennessee, Missouri, Indiana and Illinois will play out in their first poll(s). I'm feeling quite confident that all of these 4 states will move considerably towards Hillary as well, although Illinois might possibly be less certain than the first three, as Obama used the state as his campaign base in both of his elections.
The whole list of states having been polled till now, going from Democratic stronghold to Republican stronghold:
New York: D +22.25%
New Jersey: D +10.6%
Maine: D +8%
Florida: D +7.3%
Currently estimated/projected national average: D +7%
Minnesota: D +6%
Wisconsin: D +4%
Michigan: D +3.7%
New Hampshire: D +3.7%
Ohio: D +3.3%
Virginia: D +2.5%
Arkansas: D +2%
Pennsylvania: D +0.7%
Iowa: D +0.4%
Louisiana: R +1%
Georgia: R +2%
North Carolina: R +2.3%
Kentucky: R +4%
Colorado: R +4.75%
Texas: R +5%
South Carolina: R +7%
Kansas: R +7%
Alaska: R +7.5%
Mississippi: R +9%
Montana: R +13%
West Virginia: R +14%
Wyoming: R +28%
7 or 8 states are currently way too close to call; Virginia, Arkansas, Pennsylvania & Iowa (all leaning towards Hillary), plus Louisiana, Georgia and North Carolina (all leaning Republican). After the last Ohio poll, Ohio could possibly be added to the too-close-to-call states, just barely leaning towards Hillary by an average of 3.3%.
Here are the current stats on Republican candidates:
1. Chris Christie favoured in 17 of 26 states
2. Jeb Bush favoured in 6 states (Texas (!), Florida, Wisconsin (!!), Kentucky (!!), West Virginia & Alaska)
3. Paul Ryan favoured in 2 states (Louisiana & Kansas)
4. Rand Paul favoured in 2 states (Louisiana & Montana)
5. Marco Rubio favoured in 1 state (South Carolina)
Current update as of February 5.
The number of total state polls added to the lists below has thus now reached 89.
So here they are - all the 2016 poll averages for each state so far - 26 states having been polled to date - and how far off they are compared to the actual 2012 outcomes. I'm only including the Republican candidate with the best statewide polling.
Alaska: Hillary vs Jeb Bush: R +7.5%
+6.5% D improvement
(Updated on February 5, 2014)
Arkansas: Hillary vs Chris Christie: D +2%
+22% D improvement
Current Democratic gain
(Updated on August 11)
Colorado: Hillary vs Christie: R +4.75%
+10.1% R improvement
Current Republican gain
(Updated on December 9)
Florida: Hillary vs Bush: D +7.3%
+6.4% D improvement
(Updated on January 31, 2014)
Georgia: Hillary vs Christie: R +2%
+6% D improvement
(Updated August 8 )
Iowa: Hillary vs Christie: D +0.4%
+5.4% R improvement
(Updated on December 17)
Kansas: Hillary vs Paul Ryan: R +7%
+15% D improvement
(Updated on February 26)
Kentucky: Hillary vs Christie/Jeb Bush: R +4%
+19% D improvement
(Updated on December 22)
Louisiana: Hillary vs Paul Ryan/Rand Paul: R +1%
+16% D improvement
(Updated on August 21)
Maine: Hillary vs Christie: D +8%
+7% R improvement
(Updated on November 13)
Michigan: Hillary vs Christie: D +3.7%
+5.8% R improvement
(Updated on January 16, 2014)
Minnesota: Hillary vs Christie: D +6%
+2% R improvement
(Updated on January 22, 2013)
Mississippi: Hillary vs Christie: R +9%
+2.5% D improvement
(Updated on November 19)
Montana: Hillary vs Rand Paul: R +13%
+1% D improvement
(Updated on November 24)
New Hampshire: Hillary vs Christie: D +3.7%
+1.9% R improvement
(Updated on January 30, 2014)
New Jersey: Hillary vs Christie: D +10.6%
+7.2% R improvement
(Updated on January 22, 2014)
New York: Hillary vs Christie: D +22.25%
+5.9% R improvement
(Updated on January 20, 2014)
North Carolina: Hillary vs Christie: R +2.3%
+0.3% R improvement
(Updated on January 16, 2014)
Ohio: Hillary vs Christie: D +3.3%
+0.3% D improvement
(Updated on November 27)
Pennsylvania: Hillary vs Christie: D +0.7%
+4.7% R improvement
(Updated on December 19)
South Carolina: Hillary vs Marco Rubio: R+7%
+3.5% D improvement
(Updated on November 2)
Texas: Hillary vs Jeb Bush: R +5%
+11% D improvement
(Updated on November 8 )
Virginia: Hillary vs Christie: D +2.5%
+1.4% R improvement
(Updated on November 26)
West Virginia: Hillary vs Jeb Bush: R +14%
+13% D improvement
(Updated on October 1)
Wisconsin: Hillary vs Jeb Bush: D +4%
+3% R improvement
(Updated on October 29)
Wyoming: Hillary vs Christie: R +28%
+13% D improvement
(Updated on July 23)
Average all 26 states: Hillary vs Best Republican: R +1.1%
+3.1% D improvement (from Obama 2012) [projecting a 7% victory for Hillary]
That gives us this map right now:
(
Red = Democratic lead
Blue = Republican lead
Green = Exact tie
Grey = No polling yet
Green = toss up
20% shade = 0.1-1% lead
30% shade = 1.1-3% lead
40% shade = 3.1-6% lead
50% shade = 6.1-9% lead
60% shade = 9.1-12% lead
70% shade = 12.1-15% lead
80% shade = 15.1-18% lead
90% shade = Above 18.1% lead
In the count of electoral votes, this means the current situation looks like this:
Hillary: 195 EVs (for a total of 13 states)
Best/Tailormade Republican: 118 EVs (for a total of 13 states)
Toss-up: None
No polling: 225 EVs [almost half, including California] (for a total of 24 states + D.C.)
Which means that Hillary has captured a rather impressive 62.3% of all EVs awarded thus far, against a more or less disappointing 37.7% EVs for the tailormade Republican. And only New York, Maine and New Jersey of the solidly Democratic states have been polled so far, against no less than 12 solidly Republican states - the biggest one of them, Texas, included. With California added to Hillary's pie, it'll look even more promising for her. Neither to forget such states as D.C., Vermont, Hawaii & Maryland. It's looking like a landslide right now, even without Colorado and Pennsylvania being in Hillary's column.
This is how the Trendline Map looks so far:
(
The states which right now are showing the strongest improvement for the Democratic (Hillary) or the Republican candidate (in 17 out of 26 cases, Christie is that person):
1. Arkansas: D +22%
2. Kentucky: D +19%
3. Louisiana: D +16%
4. Kansas: D +15%
5. West Virginia: D +13%
6. Wyoming: D +13%
7. Texas: D +11%
8. Colorado: R +10.1%
9. New Jersey: R +7.2%
10. Maine: R +7%
11. Alaska: D +6.5%
12. Florida: D +6.4%
13. Georgia: D +6%
14. New York: R +5.9%
15. Michigan: R +5.8%
16. Iowa: R +5.4%
17. Pennsylvania: R +4.7%
All of these changes (in the 17 states above) are (more than) statistically significant. We see that (so far) Texas is experiencing a much more rapid change than other demographically quick-changing states like Florida and Georgia. Unfortunately, the 4th quick-changing traditionally Republican state, Arizona, has still not been polled.
The strong D improvement in the Appalachian south (Kentucky, Arkansas, Louisiana, West Virginia (Texas & South Carolina)), makes me curious to see how geographically similar states like Tennessee, Missouri, Indiana and Illinois will play out in their first poll(s). I'm feeling quite confident that all of these 4 states will move considerably towards Hillary as well, although Illinois might possibly be less certain than the first three, as Obama used the state as his campaign base in both of his elections.
The whole list of states having been polled till now, going from Democratic stronghold to Republican stronghold:
New York: D +22.25%
New Jersey: D +10.6%
Maine: D +8%
Florida: D +7.3%
Currently estimated/projected national average: D +7%
Minnesota: D +6%
Wisconsin: D +4%
Michigan: D +3.7%
New Hampshire: D +3.7%
Ohio: D +3.3%
Virginia: D +2.5%
Arkansas: D +2%
Pennsylvania: D +0.7%
Iowa: D +0.4%
Louisiana: R +1%
Georgia: R +2%
North Carolina: R +2.3%
Kentucky: R +4%
Colorado: R +4.75%
Texas: R +5%
South Carolina: R +7%
Kansas: R +7%
Alaska: R +7.5%
Mississippi: R +9%
Montana: R +13%
West Virginia: R +14%
Wyoming: R +28%
7 or 8 states are currently way too close to call; Virginia, Arkansas, Pennsylvania & Iowa (all leaning towards Hillary), plus Louisiana, Georgia and North Carolina (all leaning Republican). After the last Ohio poll, Ohio could possibly be added to the too-close-to-call states, just barely leaning towards Hillary by an average of 3.3%.
Here are the current stats on Republican candidates:
1. Chris Christie favoured in 17 of 26 states
2. Jeb Bush favoured in 6 states (Texas (!), Florida, Wisconsin (!!), Kentucky (!!), West Virginia & Alaska)
3. Paul Ryan favoured in 2 states (Louisiana & Kansas)
4. Rand Paul favoured in 2 states (Louisiana & Montana)
5. Marco Rubio favoured in 1 state (South Carolina)
Current update as of February 5.
Title: Re: 2016 Official Polling Map Thread
Post by: pbrower2a on February 06, 2014, 06:45:08 AM
http://www.publicpolicypolling.com/main/2014/02/alaska-miscellany.html
Clinton 44%
Palin 43%
Bush 47%
Clinton 39%
Paul 47%
Clinton 41%
Huckabee 45%
Clinton 41%
Christie 43%
Clinton 39%
Those are very weak leads for any Republican except for Rand Paul and Jeb Bush. Alaska seems to have a strong libertarian streak (just don't take away the oil dividend!) For what it is worth, Alaska went for John McCain by a margin of 21.5% and for Romney by 14%. Alaska probably won't be competitive in 2016. If the Republican nominee can't win Alaska by at least 10%, then few people in the Eastern Time Zone are going to stay up on Election Night to see how Alaska goes.
Colorado, Quinnipiac
http://www.quinnipiac.edu/institutes-and-centers/polling-institute/colorado/release-detail?ReleaseID=2004
Nothing on Bush. I see a Christie collapse in this poll. Others are essentially unchanged. Colorado elections have been decided late by GOTV drives.
blue, Republican -- red, Democratic
30% -- lead with 40-49% but a margin of 3% or less
40% -- lead with 40-49% but a margin of 4% or more
60% -- lead with 50-54%
70% -- lead with 55-59%
90% -- lead with 60% or more
Hillary Clinton vs. Jeb Bush
()
Hillary Clinton vs. Chris Christie
(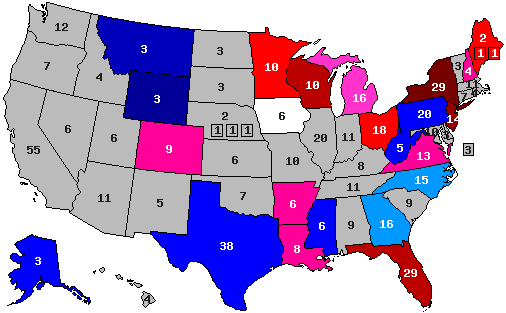 )
)
Hillary Clinton vs. Rand Paul
()
Hillary Clinton vs. Paul Ryan
(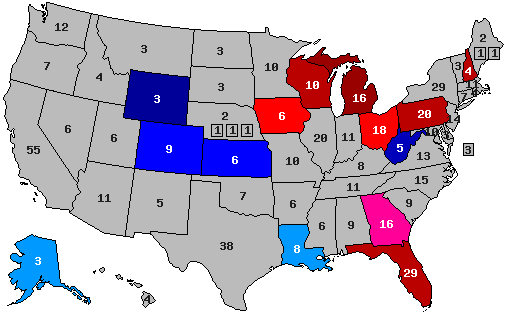 )
)
Clinton 44%
Palin 43%
Bush 47%
Clinton 39%
Paul 47%
Clinton 41%
Huckabee 45%
Clinton 41%
Christie 43%
Clinton 39%
Those are very weak leads for any Republican except for Rand Paul and Jeb Bush. Alaska seems to have a strong libertarian streak (just don't take away the oil dividend!) For what it is worth, Alaska went for John McCain by a margin of 21.5% and for Romney by 14%. Alaska probably won't be competitive in 2016. If the Republican nominee can't win Alaska by at least 10%, then few people in the Eastern Time Zone are going to stay up on Election Night to see how Alaska goes.
Colorado, Quinnipiac
Quote
48-43 Ryan/Clinton (45-43 Ryan)
47-43 Paul/Clinton (47-44 Paul)
43-42 Clinton/Christie (was 46-38 Christie in November)
44-43 Clinton/Cruz (44-44)
47-43 Paul/Clinton (47-44 Paul)
43-42 Clinton/Christie (was 46-38 Christie in November)
44-43 Clinton/Cruz (44-44)
http://www.quinnipiac.edu/institutes-and-centers/polling-institute/colorado/release-detail?ReleaseID=2004
Nothing on Bush. I see a Christie collapse in this poll. Others are essentially unchanged. Colorado elections have been decided late by GOTV drives.
blue, Republican -- red, Democratic
30% -- lead with 40-49% but a margin of 3% or less
40% -- lead with 40-49% but a margin of 4% or more
60% -- lead with 50-54%
70% -- lead with 55-59%
90% -- lead with 60% or more
Hillary Clinton vs. Jeb Bush
(
Hillary Clinton vs. Chris Christie
(
Hillary Clinton vs. Rand Paul
(
Hillary Clinton vs. Paul Ryan
(
Title: Re: 2016 Official Polling Map Thread
Post by: pbrower2a on February 06, 2014, 02:55:08 PM
Ohio, Quinnipiac
51-34 Clinton/Cruz
http://www.quinnipiac.edu/institutes-and-centers/polling-institute/ohio/release-detail?ReleaseID=2010
Needless to say I do not take Ted Cruz seriously. I wouldn't make much of the color change, as it is a change of about 1%. In the last few elections Colorado has tended to break for Democrats late in the campaign season with Democrats turning not-so-likely voters into voters.
blue, Republican -- red, Democratic
30% -- lead with 40-49% but a margin of 3% or less
40% -- lead with 40-49% but a margin of 4% or more
60% -- lead with 50-54%
70% -- lead with 55-59%
90% -- lead with 60% or more
(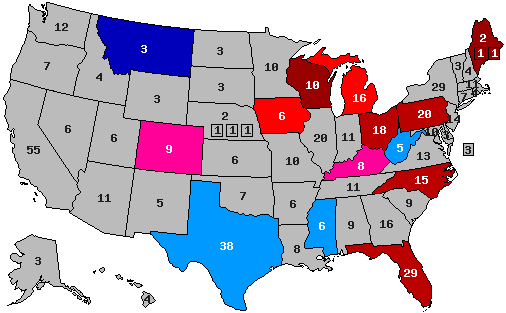 )
)
..........................................................................
With these data points this looks much like Hillary Clinton winning about like Eisenhower over Stevenson in the 1950s or the elder Bush over Dukakis in 1988. It wouldn't be long before we see some fresh Great Right Hope in polling. Ted Cruz has yet to establish himself as Presidential material.
51-34 Clinton/Cruz
http://www.quinnipiac.edu/institutes-and-centers/polling-institute/ohio/release-detail?ReleaseID=2010
Needless to say I do not take Ted Cruz seriously. I wouldn't make much of the color change, as it is a change of about 1%. In the last few elections Colorado has tended to break for Democrats late in the campaign season with Democrats turning not-so-likely voters into voters.
blue, Republican -- red, Democratic
30% -- lead with 40-49% but a margin of 3% or less
40% -- lead with 40-49% but a margin of 4% or more
60% -- lead with 50-54%
70% -- lead with 55-59%
90% -- lead with 60% or more
(
..........................................................................
With these data points this looks much like Hillary Clinton winning about like Eisenhower over Stevenson in the 1950s or the elder Bush over Dukakis in 1988. It wouldn't be long before we see some fresh Great Right Hope in polling. Ted Cruz has yet to establish himself as Presidential material.
Title: Re: 2016 Official Polling Map Thread
Post by: eric82oslo on February 06, 2014, 04:17:47 PM
In Colorado, which has been polled for the 6th time now, it's a very Close race between Chris Christie and Paul Ryan for the lead. Christie is still slightly Ahead, as he's leading Hillary by an average of 3.6%, despite trailing her by 1% in this latest poll. However, the two polls which have also included Ryan, shows him with an average lead of 3.5%, basically the same as Christie's lead. In other words, next time the two get polled in the state, or even just Christie does, it's hard to imagine Ryan not surpassing the New Jersey Governor then. Hillary does improve her Colorado average by 1.15%, though still trailing Obama's 2016 margin in the state by a whooping 9%.
The number of total state polls added to the lists below has thus now reached 90.
So here they are - all the 2016 poll averages for each state so far - 26 states having been polled to date - and how far off they are compared to the actual 2012 outcomes. I'm only including the Republican candidate with the best statewide polling.
Alaska: Hillary vs Jeb Bush: R +7.5%
+6.5% D improvement
(Updated on February 5, 2014)
Arkansas: Hillary vs Chris Christie: D +2%
+22% D improvement
Current Democratic gain
(Updated on August 11)
Colorado: Hillary vs Christie: R +3.6%
+9% R improvement
Current Republican gain
(Updated on February 6, 2014)
Florida: Hillary vs Bush: D +7.3%
+6.4% D improvement
(Updated on January 31, 2014)
Georgia: Hillary vs Christie: R +2%
+6% D improvement
(Updated August 8 )
Iowa: Hillary vs Christie: D +0.4%
+5.4% R improvement
(Updated on December 17)
Kansas: Hillary vs Paul Ryan: R +7%
+15% D improvement
(Updated on February 26)
Kentucky: Hillary vs Christie/Jeb Bush: R +4%
+19% D improvement
(Updated on December 22)
Louisiana: Hillary vs Paul Ryan/Rand Paul: R +1%
+16% D improvement
(Updated on August 21)
Maine: Hillary vs Christie: D +8%
+7% R improvement
(Updated on November 13)
Michigan: Hillary vs Christie: D +3.7%
+5.8% R improvement
(Updated on January 16, 2014)
Minnesota: Hillary vs Christie: D +6%
+2% R improvement
(Updated on January 22, 2013)
Mississippi: Hillary vs Christie: R +9%
+2.5% D improvement
(Updated on November 19)
Montana: Hillary vs Rand Paul: R +13%
+1% D improvement
(Updated on November 24)
New Hampshire: Hillary vs Christie: D +3.7%
+1.9% R improvement
(Updated on January 30, 2014)
New Jersey: Hillary vs Christie: D +10.6%
+7.2% R improvement
(Updated on January 22, 2014)
New York: Hillary vs Christie: D +22.25%
+5.9% R improvement
(Updated on January 20, 2014)
North Carolina: Hillary vs Christie: R +2.3%
+0.3% R improvement
(Updated on January 16, 2014)
Ohio: Hillary vs Christie: D +3.3%
+0.3% D improvement
(Updated on November 27)
Pennsylvania: Hillary vs Christie: D +0.7%
+4.7% R improvement
(Updated on December 19)
South Carolina: Hillary vs Marco Rubio: R+7%
+3.5% D improvement
(Updated on November 2)
Texas: Hillary vs Jeb Bush: R +5%
+11% D improvement
(Updated on November 8 )
Virginia: Hillary vs Christie: D +2.5%
+1.4% R improvement
(Updated on November 26)
West Virginia: Hillary vs Jeb Bush: R +14%
+13% D improvement
(Updated on October 1)
Wisconsin: Hillary vs Jeb Bush: D +4%
+3% R improvement
(Updated on October 29)
Wyoming: Hillary vs Christie: R +28%
+13% D improvement
(Updated on July 23)
Average all 26 states: Hillary vs Best Republican: R +1.1%
+3.1% D improvement (from Obama 2012) [projecting a 7% victory for Hillary]
That gives us this map right now:
()
Red = Democratic lead
Blue = Republican lead
Green = Exact tie
Grey = No polling yet
Green = toss up
20% shade = 0.1-1% lead
30% shade = 1.1-3% lead
40% shade = 3.1-6% lead
50% shade = 6.1-9% lead
60% shade = 9.1-12% lead
70% shade = 12.1-15% lead
80% shade = 15.1-18% lead
90% shade = Above 18.1% lead
In the count of electoral votes, this means the current situation looks like this:
Hillary: 195 EVs (for a total of 13 states)
Best/Tailormade Republican: 118 EVs (for a total of 13 states)
Toss-up: None
No polling: 225 EVs [almost half, including California] (for a total of 24 states + D.C.)
Which means that Hillary has captured a rather impressive 62.3% of all EVs awarded thus far, against a more or less disappointing 37.7% EVs for the tailormade Republican. And only New York, Maine and New Jersey of the solidly Democratic states have been polled so far, against no less than 12 solidly Republican states - the biggest one of them, Texas, included. With California added to Hillary's pie, it'll look even more promising for her. Neither to forget such states as D.C., Vermont, Hawaii & Maryland. It's looking like a landslide right now, even without Colorado and Pennsylvania being in Hillary's column.
This is how the Trendline Map looks so far:
(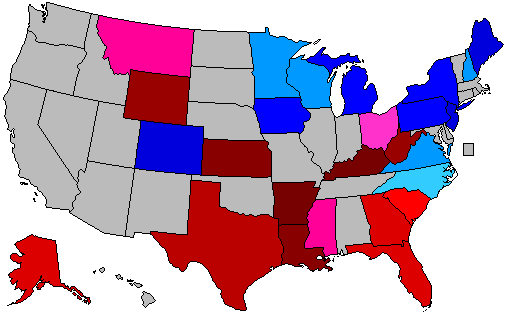 )
)
The states which right now are showing the strongest improvement for the Democratic (Hillary) or the Republican candidate (in 17 out of 26 cases, Christie is that person):
1. Arkansas: D +22%
2. Kentucky: D +19%
3. Louisiana: D +16%
4. Kansas: D +15%
5. West Virginia: D +13%
6. Wyoming: D +13%
7. Texas: D +11%
8. Colorado: R +9%
9. New Jersey: R +7.2%
10. Maine: R +7%
11. Alaska: D +6.5%
12. Florida: D +6.4%
13. Georgia: D +6%
14. New York: R +5.9%
15. Michigan: R +5.8%
16. Iowa: R +5.4%
17. Pennsylvania: R +4.7%
All of these changes (in the 17 states above) are (more than) statistically significant. We see that (so far) Texas is experiencing a much more rapid change than other demographically quick-changing states like Florida and Georgia. Unfortunately, the 4th quick-changing traditionally Republican state, Arizona, has still not been polled.
The strong D improvement in the Appalachian south (Kentucky, Arkansas, Louisiana, West Virginia (Texas & South Carolina)), makes me curious to see how geographically similar states like Tennessee, Missouri, Indiana and Illinois will play out in their first poll(s). I'm feeling quite confident that all of these 4 states will move considerably towards Hillary as well, although Illinois might possibly be less certain than the first three, as Obama used the state as his campaign base in both of his elections.
The whole list of states having been polled till now, going from Democratic stronghold to Republican stronghold:
New York: D +22.25%
New Jersey: D +10.6%
Maine: D +8%
Florida: D +7.3%
Currently estimated/projected national average: D +7%
Minnesota: D +6%
Wisconsin: D +4%
Michigan: D +3.7%
New Hampshire: D +3.7%
Ohio: D +3.3%
Virginia: D +2.5%
Arkansas: D +2%
Pennsylvania: D +0.7%
Iowa: D +0.4%
Louisiana: R +1%
Georgia: R +2%
North Carolina: R +2.3%
Colorado: R +3.6%
Kentucky: R +4%
Texas: R +5%
South Carolina: R +7%
Kansas: R +7%
Alaska: R +7.5%
Mississippi: R +9%
Montana: R +13%
West Virginia: R +14%
Wyoming: R +28%
7 or 8 states are currently way too close to call; Virginia, Arkansas, Pennsylvania & Iowa (all leaning towards Hillary), plus Louisiana, Georgia and North Carolina (all leaning Republican). After the last Ohio poll, Ohio could possibly be added to the too-close-to-call states, just barely leaning towards Hillary by an average of 3.3%.
Here are the current stats on Republican candidates:
1. Chris Christie favoured in 17 of 26 states
2. Jeb Bush favoured in 6 states (Texas (!), Florida, Wisconsin (!!), Kentucky (!!), West Virginia & Alaska)
3. Paul Ryan favoured in 2 states (Louisiana & Kansas [and almost Colorado])
4. Rand Paul favoured in 2 states (Louisiana & Montana)
5. Marco Rubio favoured in 1 state (South Carolina)
Current update as of February 6.
The number of total state polls added to the lists below has thus now reached 90.
So here they are - all the 2016 poll averages for each state so far - 26 states having been polled to date - and how far off they are compared to the actual 2012 outcomes. I'm only including the Republican candidate with the best statewide polling.
Alaska: Hillary vs Jeb Bush: R +7.5%
+6.5% D improvement
(Updated on February 5, 2014)
Arkansas: Hillary vs Chris Christie: D +2%
+22% D improvement
Current Democratic gain
(Updated on August 11)
Colorado: Hillary vs Christie: R +3.6%
+9% R improvement
Current Republican gain
(Updated on February 6, 2014)
Florida: Hillary vs Bush: D +7.3%
+6.4% D improvement
(Updated on January 31, 2014)
Georgia: Hillary vs Christie: R +2%
+6% D improvement
(Updated August 8 )
Iowa: Hillary vs Christie: D +0.4%
+5.4% R improvement
(Updated on December 17)
Kansas: Hillary vs Paul Ryan: R +7%
+15% D improvement
(Updated on February 26)
Kentucky: Hillary vs Christie/Jeb Bush: R +4%
+19% D improvement
(Updated on December 22)
Louisiana: Hillary vs Paul Ryan/Rand Paul: R +1%
+16% D improvement
(Updated on August 21)
Maine: Hillary vs Christie: D +8%
+7% R improvement
(Updated on November 13)
Michigan: Hillary vs Christie: D +3.7%
+5.8% R improvement
(Updated on January 16, 2014)
Minnesota: Hillary vs Christie: D +6%
+2% R improvement
(Updated on January 22, 2013)
Mississippi: Hillary vs Christie: R +9%
+2.5% D improvement
(Updated on November 19)
Montana: Hillary vs Rand Paul: R +13%
+1% D improvement
(Updated on November 24)
New Hampshire: Hillary vs Christie: D +3.7%
+1.9% R improvement
(Updated on January 30, 2014)
New Jersey: Hillary vs Christie: D +10.6%
+7.2% R improvement
(Updated on January 22, 2014)
New York: Hillary vs Christie: D +22.25%
+5.9% R improvement
(Updated on January 20, 2014)
North Carolina: Hillary vs Christie: R +2.3%
+0.3% R improvement
(Updated on January 16, 2014)
Ohio: Hillary vs Christie: D +3.3%
+0.3% D improvement
(Updated on November 27)
Pennsylvania: Hillary vs Christie: D +0.7%
+4.7% R improvement
(Updated on December 19)
South Carolina: Hillary vs Marco Rubio: R+7%
+3.5% D improvement
(Updated on November 2)
Texas: Hillary vs Jeb Bush: R +5%
+11% D improvement
(Updated on November 8 )
Virginia: Hillary vs Christie: D +2.5%
+1.4% R improvement
(Updated on November 26)
West Virginia: Hillary vs Jeb Bush: R +14%
+13% D improvement
(Updated on October 1)
Wisconsin: Hillary vs Jeb Bush: D +4%
+3% R improvement
(Updated on October 29)
Wyoming: Hillary vs Christie: R +28%
+13% D improvement
(Updated on July 23)
Average all 26 states: Hillary vs Best Republican: R +1.1%
+3.1% D improvement (from Obama 2012) [projecting a 7% victory for Hillary]
That gives us this map right now:
(
Red = Democratic lead
Blue = Republican lead
Green = Exact tie
Grey = No polling yet
Green = toss up
20% shade = 0.1-1% lead
30% shade = 1.1-3% lead
40% shade = 3.1-6% lead
50% shade = 6.1-9% lead
60% shade = 9.1-12% lead
70% shade = 12.1-15% lead
80% shade = 15.1-18% lead
90% shade = Above 18.1% lead
In the count of electoral votes, this means the current situation looks like this:
Hillary: 195 EVs (for a total of 13 states)
Best/Tailormade Republican: 118 EVs (for a total of 13 states)
Toss-up: None
No polling: 225 EVs [almost half, including California] (for a total of 24 states + D.C.)
Which means that Hillary has captured a rather impressive 62.3% of all EVs awarded thus far, against a more or less disappointing 37.7% EVs for the tailormade Republican. And only New York, Maine and New Jersey of the solidly Democratic states have been polled so far, against no less than 12 solidly Republican states - the biggest one of them, Texas, included. With California added to Hillary's pie, it'll look even more promising for her. Neither to forget such states as D.C., Vermont, Hawaii & Maryland. It's looking like a landslide right now, even without Colorado and Pennsylvania being in Hillary's column.
This is how the Trendline Map looks so far:
(
The states which right now are showing the strongest improvement for the Democratic (Hillary) or the Republican candidate (in 17 out of 26 cases, Christie is that person):
1. Arkansas: D +22%
2. Kentucky: D +19%
3. Louisiana: D +16%
4. Kansas: D +15%
5. West Virginia: D +13%
6. Wyoming: D +13%
7. Texas: D +11%
8. Colorado: R +9%
9. New Jersey: R +7.2%
10. Maine: R +7%
11. Alaska: D +6.5%
12. Florida: D +6.4%
13. Georgia: D +6%
14. New York: R +5.9%
15. Michigan: R +5.8%
16. Iowa: R +5.4%
17. Pennsylvania: R +4.7%
All of these changes (in the 17 states above) are (more than) statistically significant. We see that (so far) Texas is experiencing a much more rapid change than other demographically quick-changing states like Florida and Georgia. Unfortunately, the 4th quick-changing traditionally Republican state, Arizona, has still not been polled.
The strong D improvement in the Appalachian south (Kentucky, Arkansas, Louisiana, West Virginia (Texas & South Carolina)), makes me curious to see how geographically similar states like Tennessee, Missouri, Indiana and Illinois will play out in their first poll(s). I'm feeling quite confident that all of these 4 states will move considerably towards Hillary as well, although Illinois might possibly be less certain than the first three, as Obama used the state as his campaign base in both of his elections.
The whole list of states having been polled till now, going from Democratic stronghold to Republican stronghold:
New York: D +22.25%
New Jersey: D +10.6%
Maine: D +8%
Florida: D +7.3%
Currently estimated/projected national average: D +7%
Minnesota: D +6%
Wisconsin: D +4%
Michigan: D +3.7%
New Hampshire: D +3.7%
Ohio: D +3.3%
Virginia: D +2.5%
Arkansas: D +2%
Pennsylvania: D +0.7%
Iowa: D +0.4%
Louisiana: R +1%
Georgia: R +2%
North Carolina: R +2.3%
Colorado: R +3.6%
Kentucky: R +4%
Texas: R +5%
South Carolina: R +7%
Kansas: R +7%
Alaska: R +7.5%
Mississippi: R +9%
Montana: R +13%
West Virginia: R +14%
Wyoming: R +28%
7 or 8 states are currently way too close to call; Virginia, Arkansas, Pennsylvania & Iowa (all leaning towards Hillary), plus Louisiana, Georgia and North Carolina (all leaning Republican). After the last Ohio poll, Ohio could possibly be added to the too-close-to-call states, just barely leaning towards Hillary by an average of 3.3%.
Here are the current stats on Republican candidates:
1. Chris Christie favoured in 17 of 26 states
2. Jeb Bush favoured in 6 states (Texas (!), Florida, Wisconsin (!!), Kentucky (!!), West Virginia & Alaska)
3. Paul Ryan favoured in 2 states (Louisiana & Kansas [and almost Colorado])
4. Rand Paul favoured in 2 states (Louisiana & Montana)
5. Marco Rubio favoured in 1 state (South Carolina)
Current update as of February 6.
Title: Re: 2016 Official Polling Map Thread
Post by: eric82oslo on February 12, 2014, 02:40:18 PM
PPP has just polled North Carolina for the 5th time this presidential election cycle (the only one to my knowledge who's been polling the state so far), including for the 4th time with Christie included. Due to Christie having been up on Hillary the three previous times they've clashed together in the state, and Christie still only trailing the frontrunner by 3% in North Carolina, the NJ Governor still retains a very scarce lead in the state by a meager 1%. Christie is btw the only Republican who's ever been ahead of Hillary in the state in any of the 18 match-ups they've conducted. The closest non-Christie Republicans have been to endanger Hillary in the state was when Jeb Bush only trailed her by 1% in December. In other words, right now, North Carolina looks fairly safe for Hillary, unless the underlying conditions should change substatially in the years leading up to the election. This also results in North Carolina going from a slight Republican to a slight Democratic swing relative to 2012. All of the (polled) South except Virginia is now showing Democratic swings.
The number of total state polls added to the lists below has thus now reached 91.
So here they are - all the 2016 poll averages for each state so far - 26 states having been polled to date - and how far off they are compared to the actual 2012 outcomes. I'm only including the Republican candidate with the best statewide polling.
Alaska: Hillary vs Jeb Bush: R +7.5%
+6.5% D improvement
(Updated on February 5, 2014)
Arkansas: Hillary vs Chris Christie: D +2%
+22% D improvement
Current Democratic gain
(Updated on August 11)
Colorado: Hillary vs Christie: R +3.6%
+9% R improvement
Current Republican gain
(Updated on February 6, 2014)
Florida: Hillary vs Bush: D +7.3%
+6.4% D improvement
(Updated on January 31, 2014)
Georgia: Hillary vs Christie: R +2%
+6% D improvement
(Updated August 8 )
Iowa: Hillary vs Christie: D +0.4%
+5.4% R improvement
(Updated on December 17)
Kansas: Hillary vs Paul Ryan: R +7%
+15% D improvement
(Updated on February 26)
Kentucky: Hillary vs Christie/Jeb Bush: R +4%
+19% D improvement
(Updated on December 22)
Louisiana: Hillary vs Paul Ryan/Rand Paul: R +1%
+16% D improvement
(Updated on August 21)
Maine: Hillary vs Christie: D +8%
+7% R improvement
(Updated on November 13)
Michigan: Hillary vs Christie: D +3.7%
+5.8% R improvement
(Updated on January 16, 2014)
Minnesota: Hillary vs Christie: D +6%
+2% R improvement
(Updated on January 22, 2013)
Mississippi: Hillary vs Christie: R +9%
+2.5% D improvement
(Updated on November 19)
Montana: Hillary vs Rand Paul: R +13%
+1% D improvement
(Updated on November 24)
New Hampshire: Hillary vs Christie: D +3.7%
+1.9% R improvement
(Updated on January 30, 2014)
New Jersey: Hillary vs Christie: D +10.6%
+7.2% R improvement
(Updated on January 22, 2014)
New York: Hillary vs Christie: D +22.25%
+5.9% R improvement
(Updated on January 20, 2014)
North Carolina: Hillary vs Christie: R +1%
+1% D improvement
(Updated on February 12, 2014)
Ohio: Hillary vs Christie: D +3.3%
+0.3% D improvement
(Updated on November 27)
Pennsylvania: Hillary vs Christie: D +0.7%
+4.7% R improvement
(Updated on December 19)
South Carolina: Hillary vs Marco Rubio: R+7%
+3.5% D improvement
(Updated on November 2)
Texas: Hillary vs Jeb Bush: R +5%
+11% D improvement
(Updated on November 8 )
Virginia: Hillary vs Christie: D +2.5%
+1.4% R improvement
(Updated on November 26)
West Virginia: Hillary vs Jeb Bush: R +14%
+13% D improvement
(Updated on October 1)
Wisconsin: Hillary vs Jeb Bush: D +4%
+3% R improvement
(Updated on October 29)
Wyoming: Hillary vs Christie: R +28%
+13% D improvement
(Updated on July 23)
Average all 26 states: Hillary vs Best Republican: R +1.1%
+3.2% D improvement (from Obama 2012) [projecting a 7% victory for Hillary]
That gives us this map right now:
(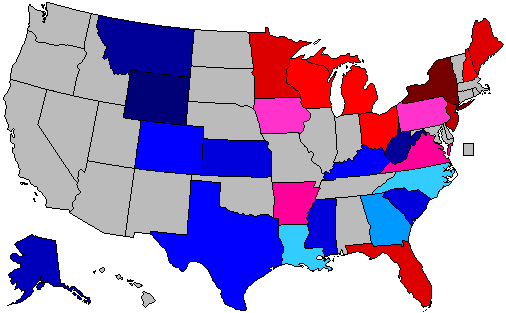 )
)
Red = Democratic lead
Blue = Republican lead
Green = Exact tie
Grey = No polling yet
Green = toss up
20% shade = 0.1-1% lead
30% shade = 1.1-3% lead
40% shade = 3.1-6% lead
50% shade = 6.1-9% lead
60% shade = 9.1-12% lead
70% shade = 12.1-15% lead
80% shade = 15.1-18% lead
90% shade = Above 18.1% lead
In the count of electoral votes, this means the current situation looks like this:
Hillary: 195 EVs (for a total of 13 states)
Best/Tailormade Republican: 118 EVs (for a total of 13 states)
Toss-up: None
No polling: 225 EVs [almost half, including California] (for a total of 24 states + D.C.)
Which means that Hillary has captured a rather impressive 62.3% of all EVs awarded thus far, against a more or less disappointing 37.7% EVs for the tailormade Republican. And only New York, Maine and New Jersey of the solidly Democratic states have been polled so far, against no less than 12 solidly Republican states - the biggest one of them, Texas, included. With California added to Hillary's pie, it'll look even more promising for her. Neither to forget such states as D.C., Vermont, Hawaii & Maryland. It's looking like a landslide right now, even without Colorado and Pennsylvania being in Hillary's column.
This is how the Trendline Map looks so far:
( )
)
The states which right now are showing the strongest improvement for the Democratic (Hillary) or the Republican candidate (in 17 out of 26 cases, Christie is that person):
1. Arkansas: D +22%
2. Kentucky: D +19%
3. Louisiana: D +16%
4. Kansas: D +15%
5. West Virginia: D +13%
6. Wyoming: D +13%
7. Texas: D +11%
8. Colorado: R +9%
9. New Jersey: R +7.2%
10. Maine: R +7%
11. Alaska: D +6.5%
12. Florida: D +6.4%
13. Georgia: D +6%
14. New York: R +5.9%
15. Michigan: R +5.8%
16. Iowa: R +5.4%
17. Pennsylvania: R +4.7%
All of these changes (in the 17 states above) are (more than) statistically significant. We see that (so far) Texas is experiencing a much more rapid change than other demographically quick-changing states like Florida and Georgia. Unfortunately, the 4th quick-changing traditionally Republican state, Arizona, has still not been polled.
The whole list of states having been polled till now, going from Democratic stronghold to Republican stronghold:
New York: D +22.25%
New Jersey: D +10.6%
Maine: D +8%
Florida: D +7.3%
Currently estimated/projected national average: D +7%
Minnesota: D +6%
Wisconsin: D +4%
Michigan: D +3.7%
New Hampshire: D +3.7%
Ohio: D +3.3%
Virginia: D +2.5%
Arkansas: D +2%
Pennsylvania: D +0.7%
Iowa: D +0.4%
North Carolina: R +1%
Louisiana: R +1%
Georgia: R +2%
Colorado: R +3.6%
Kentucky: R +4%
Texas: R +5%
South Carolina: R +7%
Kansas: R +7%
Alaska: R +7.5%
Mississippi: R +9%
Montana: R +13%
West Virginia: R +14%
Wyoming: R +28%
7 or 8 states are currently way too close to call; Virginia, Arkansas, Pennsylvania & Iowa (all leaning towards Hillary), plus North Carolina, Louisiana and Georgia (all leaning Republican). After the last Ohio poll, Ohio could possibly be added to the too-close-to-call states, just barely leaning towards Hillary by an average of 3.3%.
Here are the current stats on Republican candidates:
1. Chris Christie favoured in 17 of 26 states
2. Jeb Bush favoured in 6 states (Texas (!), Florida, Wisconsin (!!), Kentucky (!!), West Virginia & Alaska)
3. Paul Ryan favoured in 2 states (Louisiana & Kansas [and almost Colorado])
4. Rand Paul favoured in 2 states (Louisiana & Montana)
5. Marco Rubio favoured in 1 state (South Carolina)
Current update as of February 12.
The number of total state polls added to the lists below has thus now reached 91.
So here they are - all the 2016 poll averages for each state so far - 26 states having been polled to date - and how far off they are compared to the actual 2012 outcomes. I'm only including the Republican candidate with the best statewide polling.
Alaska: Hillary vs Jeb Bush: R +7.5%
+6.5% D improvement
(Updated on February 5, 2014)
Arkansas: Hillary vs Chris Christie: D +2%
+22% D improvement
Current Democratic gain
(Updated on August 11)
Colorado: Hillary vs Christie: R +3.6%
+9% R improvement
Current Republican gain
(Updated on February 6, 2014)
Florida: Hillary vs Bush: D +7.3%
+6.4% D improvement
(Updated on January 31, 2014)
Georgia: Hillary vs Christie: R +2%
+6% D improvement
(Updated August 8 )
Iowa: Hillary vs Christie: D +0.4%
+5.4% R improvement
(Updated on December 17)
Kansas: Hillary vs Paul Ryan: R +7%
+15% D improvement
(Updated on February 26)
Kentucky: Hillary vs Christie/Jeb Bush: R +4%
+19% D improvement
(Updated on December 22)
Louisiana: Hillary vs Paul Ryan/Rand Paul: R +1%
+16% D improvement
(Updated on August 21)
Maine: Hillary vs Christie: D +8%
+7% R improvement
(Updated on November 13)
Michigan: Hillary vs Christie: D +3.7%
+5.8% R improvement
(Updated on January 16, 2014)
Minnesota: Hillary vs Christie: D +6%
+2% R improvement
(Updated on January 22, 2013)
Mississippi: Hillary vs Christie: R +9%
+2.5% D improvement
(Updated on November 19)
Montana: Hillary vs Rand Paul: R +13%
+1% D improvement
(Updated on November 24)
New Hampshire: Hillary vs Christie: D +3.7%
+1.9% R improvement
(Updated on January 30, 2014)
New Jersey: Hillary vs Christie: D +10.6%
+7.2% R improvement
(Updated on January 22, 2014)
New York: Hillary vs Christie: D +22.25%
+5.9% R improvement
(Updated on January 20, 2014)
North Carolina: Hillary vs Christie: R +1%
+1% D improvement
(Updated on February 12, 2014)
Ohio: Hillary vs Christie: D +3.3%
+0.3% D improvement
(Updated on November 27)
Pennsylvania: Hillary vs Christie: D +0.7%
+4.7% R improvement
(Updated on December 19)
South Carolina: Hillary vs Marco Rubio: R+7%
+3.5% D improvement
(Updated on November 2)
Texas: Hillary vs Jeb Bush: R +5%
+11% D improvement
(Updated on November 8 )
Virginia: Hillary vs Christie: D +2.5%
+1.4% R improvement
(Updated on November 26)
West Virginia: Hillary vs Jeb Bush: R +14%
+13% D improvement
(Updated on October 1)
Wisconsin: Hillary vs Jeb Bush: D +4%
+3% R improvement
(Updated on October 29)
Wyoming: Hillary vs Christie: R +28%
+13% D improvement
(Updated on July 23)
Average all 26 states: Hillary vs Best Republican: R +1.1%
+3.2% D improvement (from Obama 2012) [projecting a 7% victory for Hillary]
That gives us this map right now:
(
Red = Democratic lead
Blue = Republican lead
Green = Exact tie
Grey = No polling yet
Green = toss up
20% shade = 0.1-1% lead
30% shade = 1.1-3% lead
40% shade = 3.1-6% lead
50% shade = 6.1-9% lead
60% shade = 9.1-12% lead
70% shade = 12.1-15% lead
80% shade = 15.1-18% lead
90% shade = Above 18.1% lead
In the count of electoral votes, this means the current situation looks like this:
Hillary: 195 EVs (for a total of 13 states)
Best/Tailormade Republican: 118 EVs (for a total of 13 states)
Toss-up: None
No polling: 225 EVs [almost half, including California] (for a total of 24 states + D.C.)
Which means that Hillary has captured a rather impressive 62.3% of all EVs awarded thus far, against a more or less disappointing 37.7% EVs for the tailormade Republican. And only New York, Maine and New Jersey of the solidly Democratic states have been polled so far, against no less than 12 solidly Republican states - the biggest one of them, Texas, included. With California added to Hillary's pie, it'll look even more promising for her. Neither to forget such states as D.C., Vermont, Hawaii & Maryland. It's looking like a landslide right now, even without Colorado and Pennsylvania being in Hillary's column.
This is how the Trendline Map looks so far:
(
The states which right now are showing the strongest improvement for the Democratic (Hillary) or the Republican candidate (in 17 out of 26 cases, Christie is that person):
1. Arkansas: D +22%
2. Kentucky: D +19%
3. Louisiana: D +16%
4. Kansas: D +15%
5. West Virginia: D +13%
6. Wyoming: D +13%
7. Texas: D +11%
8. Colorado: R +9%
9. New Jersey: R +7.2%
10. Maine: R +7%
11. Alaska: D +6.5%
12. Florida: D +6.4%
13. Georgia: D +6%
14. New York: R +5.9%
15. Michigan: R +5.8%
16. Iowa: R +5.4%
17. Pennsylvania: R +4.7%
All of these changes (in the 17 states above) are (more than) statistically significant. We see that (so far) Texas is experiencing a much more rapid change than other demographically quick-changing states like Florida and Georgia. Unfortunately, the 4th quick-changing traditionally Republican state, Arizona, has still not been polled.
The whole list of states having been polled till now, going from Democratic stronghold to Republican stronghold:
New York: D +22.25%
New Jersey: D +10.6%
Maine: D +8%
Florida: D +7.3%
Currently estimated/projected national average: D +7%
Minnesota: D +6%
Wisconsin: D +4%
Michigan: D +3.7%
New Hampshire: D +3.7%
Ohio: D +3.3%
Virginia: D +2.5%
Arkansas: D +2%
Pennsylvania: D +0.7%
Iowa: D +0.4%
North Carolina: R +1%
Louisiana: R +1%
Georgia: R +2%
Colorado: R +3.6%
Kentucky: R +4%
Texas: R +5%
South Carolina: R +7%
Kansas: R +7%
Alaska: R +7.5%
Mississippi: R +9%
Montana: R +13%
West Virginia: R +14%
Wyoming: R +28%
7 or 8 states are currently way too close to call; Virginia, Arkansas, Pennsylvania & Iowa (all leaning towards Hillary), plus North Carolina, Louisiana and Georgia (all leaning Republican). After the last Ohio poll, Ohio could possibly be added to the too-close-to-call states, just barely leaning towards Hillary by an average of 3.3%.
Here are the current stats on Republican candidates:
1. Chris Christie favoured in 17 of 26 states
2. Jeb Bush favoured in 6 states (Texas (!), Florida, Wisconsin (!!), Kentucky (!!), West Virginia & Alaska)
3. Paul Ryan favoured in 2 states (Louisiana & Kansas [and almost Colorado])
4. Rand Paul favoured in 2 states (Louisiana & Montana)
5. Marco Rubio favoured in 1 state (South Carolina)
Current update as of February 12.
Title: Re: 2016 Official Polling Map Thread
Post by: pbrower2a on February 12, 2014, 10:18:24 PM
North Carolina, PPP:
http://www.publicpolicypolling.com/pdf/2014/PPP_Release_NC_212.pdf
I don't map Huckabee yet. Prospects of the Republicans having command of the next Presidentiad (Ralph Waldo Emerson coined that word) now look very poor. Republicans have not lost North Carolina in a close election since 1976, when Carter depended heavily upon the South for popular and electoral votes. (2008 was not a close election, thank you).
blue, Republican -- red, Democratic
30% -- lead with 40-49% but a margin of 3% or less
40% -- lead with 40-49% but a margin of 4% or more
60% -- lead with 50-54%
70% -- lead with 55-59%
90% -- lead with 60% or more
Hillary Clinton vs. Jeb Bush
(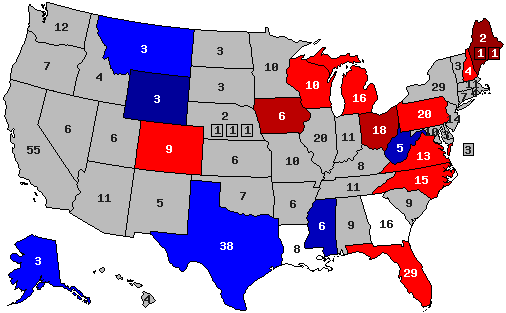 )
)
Hillary Clinton vs. Chris Christie
(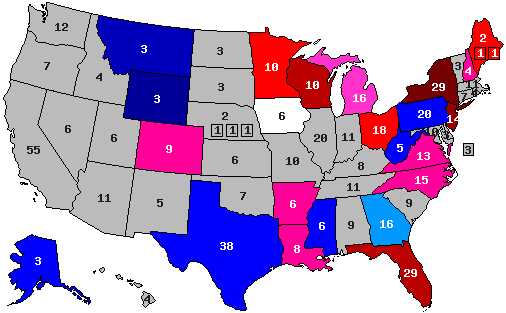 )
)
Hillary Clinton vs. Rand Paul
(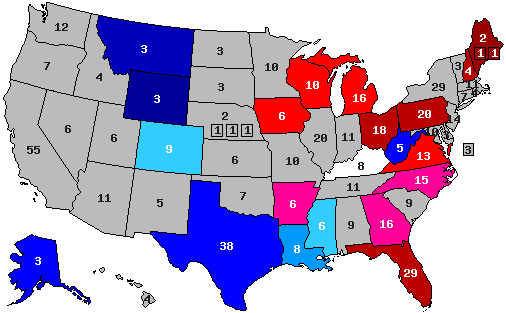 )
)
Hillary Clinton vs. Paul Ryan
()
Quote
Clinton- 47%
Bush- 43%
Clinton- 45%
Christie- 42%
Clinton- 47%
Paul- 44%
Clinton- 48%
Huckabee- 43%
Bush- 43%
Clinton- 45%
Christie- 42%
Clinton- 47%
Paul- 44%
Clinton- 48%
Huckabee- 43%
http://www.publicpolicypolling.com/pdf/2014/PPP_Release_NC_212.pdf
I don't map Huckabee yet. Prospects of the Republicans having command of the next Presidentiad (Ralph Waldo Emerson coined that word) now look very poor. Republicans have not lost North Carolina in a close election since 1976, when Carter depended heavily upon the South for popular and electoral votes. (2008 was not a close election, thank you).
blue, Republican -- red, Democratic
30% -- lead with 40-49% but a margin of 3% or less
40% -- lead with 40-49% but a margin of 4% or more
60% -- lead with 50-54%
70% -- lead with 55-59%
90% -- lead with 60% or more
Hillary Clinton vs. Jeb Bush
(
Hillary Clinton vs. Chris Christie
(
Hillary Clinton vs. Rand Paul
(
Hillary Clinton vs. Paul Ryan
(
Title: Re: 2016 Official Polling Map Thread
Post by: eric82oslo on February 12, 2014, 11:22:19 PM
Hillary Clinton vs. Chris Christie
()
(
You've forgot to include the PPP poll from December that had Christie 4% ahead of Hillary in Kentucky.
http://en.wikipedia.org/wiki/Statewide_opinion_polling_for_the_United_States_presidential_election,_2016#Kentucky
Also there's the Harper poll that showed Christie ahead of Hillary in South Carolina, but I think I remember you not including it cause of the unreliableness of the pollster. Wouldn't take an earthquake for a Republican to be ahead of Hillary in SC though.
Title: Re: 2016 Official Polling Map Thread
Post by: pbrower2a on February 13, 2014, 06:13:38 AM
Missing polls of Kentucky from December (PPP):
Hillary Clinton 42% Jeb Bush 46%
Hillary Clinton 40% Chris Christie 44%
Hillary Clinton 44% Ted Cruz 41%
Hillary Clinton 43% Rand Paul 49%
I recall rejecting the poll involving South Carolina because the organization commissioning for had the word "Conservative" in its name. Hillary Clinton would probably lose South Carolina in just about any binary matchup, but if I were to use a poll with such an ideological bias where credible I might be obliged to use polls commissioned by Left-leaning interests. I have no desire to put in a poll made on behalf of the UAW or the NAACP in Ohio.
blue, Republican -- red, Democratic
30% -- lead with 40-49% but a margin of 3% or less
40% -- lead with 40-49% but a margin of 4% or more
60% -- lead with 50-54%
70% -- lead with 55-59%
90% -- lead with 60% or more
Hillary Clinton vs. Jeb Bush
(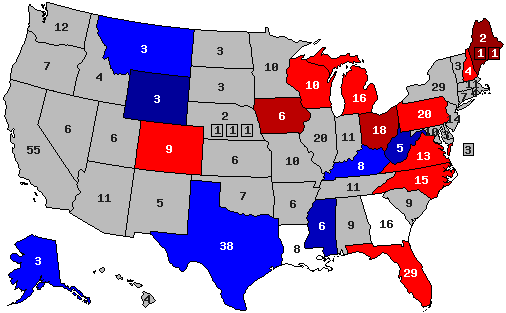 )
)
Hillary Clinton vs. Chris Christie
(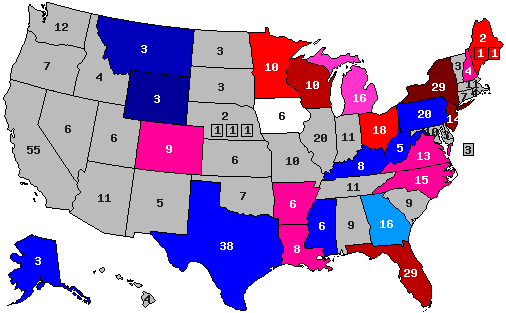 )
)
Hillary Clinton vs. Rand Paul
(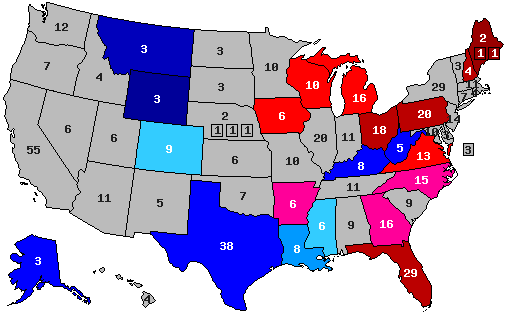 )
)
Hillary Clinton vs. Paul Ryan
()
Hillary Clinton 42% Jeb Bush 46%
Hillary Clinton 40% Chris Christie 44%
Hillary Clinton 44% Ted Cruz 41%
Hillary Clinton 43% Rand Paul 49%
I recall rejecting the poll involving South Carolina because the organization commissioning for had the word "Conservative" in its name. Hillary Clinton would probably lose South Carolina in just about any binary matchup, but if I were to use a poll with such an ideological bias where credible I might be obliged to use polls commissioned by Left-leaning interests. I have no desire to put in a poll made on behalf of the UAW or the NAACP in Ohio.
blue, Republican -- red, Democratic
30% -- lead with 40-49% but a margin of 3% or less
40% -- lead with 40-49% but a margin of 4% or more
60% -- lead with 50-54%
70% -- lead with 55-59%
90% -- lead with 60% or more
Hillary Clinton vs. Jeb Bush
(
Hillary Clinton vs. Chris Christie
(
Hillary Clinton vs. Rand Paul
(
Hillary Clinton vs. Paul Ryan
(
Title: Re: 2016 Official Polling Map Thread
Post by: pbrower2a on February 13, 2014, 06:30:43 AM
You've forgot to include the PPP poll from December that had Christie 4% ahead of Hillary in Kentucky.
http://en.wikipedia.org/wiki/Statewide_opinion_polling_for_the_United_States_presidential_election,_2016#Kentucky
Also there's the Harper poll that showed Christie ahead of Hillary in South Carolina, but I think I remember you not including it cause of the unreliableness of the pollster. Wouldn't take an earthquake for a Republican to be ahead of Hillary in SC though.
Correction made. Thank you. As elsewhere I suspect that Chris Christie has lost such crossover support as he had in other states in Kentucky as well. But we are showing the 'fossil record' and not living reality, right?
.........
Needless to say I do not take Ted Cruz seriously. I wouldn't make much of the color change, as it is a change of about 1%. If he is lagging in Kentucky, then he stands to lose big if the GOP nominee.
blue, Republican -- red, Democratic
30% -- lead with 40-49% but a margin of 3% or less
40% -- lead with 40-49% but a margin of 4% or more
60% -- lead with 50-54%
70% -- lead with 55-59%
90% -- lead with 60% or more
Clinton vs. Cruz
(
..........................................................................
With these data points this looks much like Hillary Clinton winning about like Eisenhower over Stevenson in the 1950s or the elder Bush over Dukakis in 1988. It wouldn't be long before we see some fresh Great Right Hope in polling. Ted Cruz has yet to establish himself as Presidential material.
blue, Republican -- red, Democratic
30% -- lead with 40-49% but a margin of 3% or less
40% -- lead with 40-49% but a margin of 4% or more
60% -- lead with 50-54%
70% -- lead with 55-59%
90% -- lead with 60% or more
(
..........................................................................
With these data points this looks much like Hillary Clinton winning about like Eisenhower over Stevenson in the 1950s or the elder Bush over Dukakis in 1988. It wouldn't be long before we see some fresh Great Right Hope in polling. Ted Cruz has yet to establish himself as Presidential material.
Title: Re: 2016 Official Polling Map Thread
Post by: eric82oslo on February 13, 2014, 12:51:23 PM
New York has been polled for the 5th time, even by three different pollsters. This time it's Quinnipiac getting at it again, showing Hillary with a 27% edge over Christie. It doesn't change the race a whole lot, just adding another point to Hillary's already impressive lead in the state. Now it would be very interesting seeing any other of the leading GOP contenders being matched with Hillary in the state. Perhaps Paul Ryan or Jeb Bush would do better there? Even Rubio or Rand Paul could potentially have a shot - that is doing better than Christie does right now.
Also, Epic-MRA has polled Michigan for the 1st time, 5th time a pollster has polled there this season & the 4th time with Christie included. Unfortunately they only polled the Hillary-Christie match-up, yet nothing changed for the average of that contest. Hillary still leading in the state by 3.75%.
The number of total state polls added to the lists below has thus now reached 93.
So here they are - all the 2016 poll averages for each state so far - 26 states having been polled to date - and how far off they are compared to the actual 2012 outcomes. I'm only including the Republican candidate with the best statewide polling.
Alaska: Hillary vs Jeb Bush: R +7.5%
+6.5% D improvement
(Updated on February 5, 2014)
Arkansas: Hillary vs Chris Christie: D +2%
+22% D improvement
Current Democratic gain
(Updated on August 11)
Colorado: Hillary vs Christie: R +3.6%
+9% R improvement
Current Republican gain
(Updated on February 6, 2014)
Florida: Hillary vs Bush: D +7.3%
+6.4% D improvement
(Updated on January 31, 2014)
Georgia: Hillary vs Christie: R +2%
+6% D improvement
(Updated August 8 )
Iowa: Hillary vs Christie: D +0.4%
+5.4% R improvement
(Updated on December 17)
Kansas: Hillary vs Paul Ryan: R +7%
+15% D improvement
(Updated on February 26)
Kentucky: Hillary vs Christie/Jeb Bush: R +4%
+19% D improvement
(Updated on December 22)
Louisiana: Hillary vs Paul Ryan/Rand Paul: R +1%
+16% D improvement
(Updated on August 21)
Maine: Hillary vs Christie: D +8%
+7% R improvement
(Updated on November 13)
Michigan: Hillary vs Christie: D +3.75%
+5.75% R improvement
(Updated on February 14, 2014)
Minnesota: Hillary vs Christie: D +6%
+2% R improvement
(Updated on January 22, 2013)
Mississippi: Hillary vs Christie: R +9%
+2.5% D improvement
(Updated on November 19)
Montana: Hillary vs Rand Paul: R +13%
+1% D improvement
(Updated on November 24)
New Hampshire: Hillary vs Christie: D +3.7%
+1.9% R improvement
(Updated on January 30, 2014)
New Jersey: Hillary vs Christie: D +10.6%
+7.2% R improvement
(Updated on January 22, 2014)
New York: Hillary vs Christie: D +23.2%
+5% R improvement
(Updated on February 13, 2014)
North Carolina: Hillary vs Christie: R +1%
+1% D improvement
(Updated on February 12, 2014)
Ohio: Hillary vs Christie: D +3.3%
+0.3% D improvement
(Updated on November 27)
Pennsylvania: Hillary vs Christie: D +0.7%
+4.7% R improvement
(Updated on December 19)
South Carolina: Hillary vs Marco Rubio: R+7%
+3.5% D improvement
(Updated on November 2)
Texas: Hillary vs Jeb Bush: R +5%
+11% D improvement
(Updated on November 8 )
Virginia: Hillary vs Christie: D +2.5%
+1.4% R improvement
(Updated on November 26)
West Virginia: Hillary vs Jeb Bush: R +14%
+13% D improvement
(Updated on October 1)
Wisconsin: Hillary vs Jeb Bush: D +4%
+3% R improvement
(Updated on October 29)
Wyoming: Hillary vs Christie: R +28%
+13% D improvement
(Updated on July 23)
Average all 26 states: Hillary vs Best Republican: R +1%
+3.2% D improvement (from Obama 2012) [projecting a 7.1% victory for Hillary]
That gives us this map right now:
()
Red = Democratic lead
Blue = Republican lead
Green = Exact tie
Grey = No polling yet
Green = toss up
20% shade = 0.1-1% lead
30% shade = 1.1-3% lead
40% shade = 3.1-6% lead
50% shade = 6.1-9% lead
60% shade = 9.1-12% lead
70% shade = 12.1-15% lead
80% shade = 15.1-18% lead
90% shade = Above 18.1% lead
In the count of electoral votes, this means the current situation looks like this:
Hillary: 195 EVs (for a total of 13 states)
Best/Tailormade Republican: 118 EVs (for a total of 13 states)
Toss-up: None
No polling: 225 EVs [almost half, including California] (for a total of 24 states + D.C.)
Which means that Hillary has captured a rather impressive 62.3% of all EVs awarded thus far, against a more or less disappointing 37.7% EVs for the tailormade Republican. And only New York, Maine and New Jersey of the solidly Democratic states have been polled so far, against no less than 12 solidly Republican states - the biggest one of them, Texas, included. With California added to Hillary's pie, it'll look even more promising for her. Neither to forget such states as D.C., Vermont, Hawaii & Maryland. It's looking like a landslide right now, even without Colorado and Pennsylvania being in Hillary's column.
This is how the Trendline Map looks so far:
()
The states which right now are showing the strongest improvement for the Democratic (Hillary) or the Republican candidate (in 17 out of 26 cases, Christie is that person):
1. Arkansas: D +22%
2. Kentucky: D +19%
3. Louisiana: D +16%
4. Kansas: D +15%
5. West Virginia: D +13%
6. Wyoming: D +13%
7. Texas: D +11%
8. Colorado: R +9%
9. New Jersey: R +7.2%
10. Maine: R +7%
11. Alaska: D +6.5%
12. Florida: D +6.4%
13. Georgia: D +6%
14. Michigan: R +5.75%
15. Iowa: R +5.4%
16. New York: R +5%
17. Pennsylvania: R +4.7%
All of these changes (in the 17 states above) are (more than) statistically significant. We see that (so far) Texas is experiencing a much more rapid change than other demographically quick-changing states like Florida and Georgia. Unfortunately, the 4th quick-changing traditionally Republican state, Arizona, has still not been polled.
The whole list of states having been polled till now, going from Democratic stronghold to Republican stronghold:
New York: D +23.2%
New Jersey: D +10.6%
Maine: D +8%
Florida: D +7.3%
Currently estimated/projected national average: D +7.1%
Minnesota: D +6%
Wisconsin: D +4%
Michigan: D +3.75%
New Hampshire: D +3.7%
Ohio: D +3.3%
Virginia: D +2.5%
Arkansas: D +2%
Pennsylvania: D +0.7%
Iowa: D +0.4%
North Carolina: R +1%
Louisiana: R +1%
Georgia: R +2%
Colorado: R +3.6%
Kentucky: R +4%
Texas: R +5%
South Carolina: R +7%
Kansas: R +7%
Alaska: R +7.5%
Mississippi: R +9%
Montana: R +13%
West Virginia: R +14%
Wyoming: R +28%
7 or 8 states are currently way too close to call; Virginia, Arkansas, Pennsylvania & Iowa (all leaning towards Hillary), plus North Carolina, Louisiana and Georgia (all leaning Republican). After the last Ohio poll, Ohio could possibly be added to the too-close-to-call states, just barely leaning towards Hillary by an average of 3.3%.
Here are the current stats on Republican candidates:
1. Chris Christie favoured in 17 of 26 states
2. Jeb Bush favoured in 6 states (Texas (!), Florida, Wisconsin (!!), Kentucky (!!), West Virginia & Alaska)
3. Paul Ryan favoured in 2 states (Louisiana & Kansas [and almost Colorado])
4. Rand Paul favoured in 2 states (Louisiana & Montana)
5. Marco Rubio favoured in 1 state (South Carolina)
Current update as of February 14.
Also, Epic-MRA has polled Michigan for the 1st time, 5th time a pollster has polled there this season & the 4th time with Christie included. Unfortunately they only polled the Hillary-Christie match-up, yet nothing changed for the average of that contest. Hillary still leading in the state by 3.75%.
The number of total state polls added to the lists below has thus now reached 93.
So here they are - all the 2016 poll averages for each state so far - 26 states having been polled to date - and how far off they are compared to the actual 2012 outcomes. I'm only including the Republican candidate with the best statewide polling.
Alaska: Hillary vs Jeb Bush: R +7.5%
+6.5% D improvement
(Updated on February 5, 2014)
Arkansas: Hillary vs Chris Christie: D +2%
+22% D improvement
Current Democratic gain
(Updated on August 11)
Colorado: Hillary vs Christie: R +3.6%
+9% R improvement
Current Republican gain
(Updated on February 6, 2014)
Florida: Hillary vs Bush: D +7.3%
+6.4% D improvement
(Updated on January 31, 2014)
Georgia: Hillary vs Christie: R +2%
+6% D improvement
(Updated August 8 )
Iowa: Hillary vs Christie: D +0.4%
+5.4% R improvement
(Updated on December 17)
Kansas: Hillary vs Paul Ryan: R +7%
+15% D improvement
(Updated on February 26)
Kentucky: Hillary vs Christie/Jeb Bush: R +4%
+19% D improvement
(Updated on December 22)
Louisiana: Hillary vs Paul Ryan/Rand Paul: R +1%
+16% D improvement
(Updated on August 21)
Maine: Hillary vs Christie: D +8%
+7% R improvement
(Updated on November 13)
Michigan: Hillary vs Christie: D +3.75%
+5.75% R improvement
(Updated on February 14, 2014)
Minnesota: Hillary vs Christie: D +6%
+2% R improvement
(Updated on January 22, 2013)
Mississippi: Hillary vs Christie: R +9%
+2.5% D improvement
(Updated on November 19)
Montana: Hillary vs Rand Paul: R +13%
+1% D improvement
(Updated on November 24)
New Hampshire: Hillary vs Christie: D +3.7%
+1.9% R improvement
(Updated on January 30, 2014)
New Jersey: Hillary vs Christie: D +10.6%
+7.2% R improvement
(Updated on January 22, 2014)
New York: Hillary vs Christie: D +23.2%
+5% R improvement
(Updated on February 13, 2014)
North Carolina: Hillary vs Christie: R +1%
+1% D improvement
(Updated on February 12, 2014)
Ohio: Hillary vs Christie: D +3.3%
+0.3% D improvement
(Updated on November 27)
Pennsylvania: Hillary vs Christie: D +0.7%
+4.7% R improvement
(Updated on December 19)
South Carolina: Hillary vs Marco Rubio: R+7%
+3.5% D improvement
(Updated on November 2)
Texas: Hillary vs Jeb Bush: R +5%
+11% D improvement
(Updated on November 8 )
Virginia: Hillary vs Christie: D +2.5%
+1.4% R improvement
(Updated on November 26)
West Virginia: Hillary vs Jeb Bush: R +14%
+13% D improvement
(Updated on October 1)
Wisconsin: Hillary vs Jeb Bush: D +4%
+3% R improvement
(Updated on October 29)
Wyoming: Hillary vs Christie: R +28%
+13% D improvement
(Updated on July 23)
Average all 26 states: Hillary vs Best Republican: R +1%
+3.2% D improvement (from Obama 2012) [projecting a 7.1% victory for Hillary]
That gives us this map right now:
(
Red = Democratic lead
Blue = Republican lead
Green = Exact tie
Grey = No polling yet
Green = toss up
20% shade = 0.1-1% lead
30% shade = 1.1-3% lead
40% shade = 3.1-6% lead
50% shade = 6.1-9% lead
60% shade = 9.1-12% lead
70% shade = 12.1-15% lead
80% shade = 15.1-18% lead
90% shade = Above 18.1% lead
In the count of electoral votes, this means the current situation looks like this:
Hillary: 195 EVs (for a total of 13 states)
Best/Tailormade Republican: 118 EVs (for a total of 13 states)
Toss-up: None
No polling: 225 EVs [almost half, including California] (for a total of 24 states + D.C.)
Which means that Hillary has captured a rather impressive 62.3% of all EVs awarded thus far, against a more or less disappointing 37.7% EVs for the tailormade Republican. And only New York, Maine and New Jersey of the solidly Democratic states have been polled so far, against no less than 12 solidly Republican states - the biggest one of them, Texas, included. With California added to Hillary's pie, it'll look even more promising for her. Neither to forget such states as D.C., Vermont, Hawaii & Maryland. It's looking like a landslide right now, even without Colorado and Pennsylvania being in Hillary's column.
This is how the Trendline Map looks so far:
(
The states which right now are showing the strongest improvement for the Democratic (Hillary) or the Republican candidate (in 17 out of 26 cases, Christie is that person):
1. Arkansas: D +22%
2. Kentucky: D +19%
3. Louisiana: D +16%
4. Kansas: D +15%
5. West Virginia: D +13%
6. Wyoming: D +13%
7. Texas: D +11%
8. Colorado: R +9%
9. New Jersey: R +7.2%
10. Maine: R +7%
11. Alaska: D +6.5%
12. Florida: D +6.4%
13. Georgia: D +6%
14. Michigan: R +5.75%
15. Iowa: R +5.4%
16. New York: R +5%
17. Pennsylvania: R +4.7%
All of these changes (in the 17 states above) are (more than) statistically significant. We see that (so far) Texas is experiencing a much more rapid change than other demographically quick-changing states like Florida and Georgia. Unfortunately, the 4th quick-changing traditionally Republican state, Arizona, has still not been polled.
The whole list of states having been polled till now, going from Democratic stronghold to Republican stronghold:
New York: D +23.2%
New Jersey: D +10.6%
Maine: D +8%
Florida: D +7.3%
Currently estimated/projected national average: D +7.1%
Minnesota: D +6%
Wisconsin: D +4%
Michigan: D +3.75%
New Hampshire: D +3.7%
Ohio: D +3.3%
Virginia: D +2.5%
Arkansas: D +2%
Pennsylvania: D +0.7%
Iowa: D +0.4%
North Carolina: R +1%
Louisiana: R +1%
Georgia: R +2%
Colorado: R +3.6%
Kentucky: R +4%
Texas: R +5%
South Carolina: R +7%
Kansas: R +7%
Alaska: R +7.5%
Mississippi: R +9%
Montana: R +13%
West Virginia: R +14%
Wyoming: R +28%
7 or 8 states are currently way too close to call; Virginia, Arkansas, Pennsylvania & Iowa (all leaning towards Hillary), plus North Carolina, Louisiana and Georgia (all leaning Republican). After the last Ohio poll, Ohio could possibly be added to the too-close-to-call states, just barely leaning towards Hillary by an average of 3.3%.
Here are the current stats on Republican candidates:
1. Chris Christie favoured in 17 of 26 states
2. Jeb Bush favoured in 6 states (Texas (!), Florida, Wisconsin (!!), Kentucky (!!), West Virginia & Alaska)
3. Paul Ryan favoured in 2 states (Louisiana & Kansas [and almost Colorado])
4. Rand Paul favoured in 2 states (Louisiana & Montana)
5. Marco Rubio favoured in 1 state (South Carolina)
Current update as of February 14.
Title: Re: 2016 Official Polling Map Thread
Post by: pbrower2a on February 15, 2014, 01:36:26 AM
In view of its dreadful record in the past, I would not trust Epic-MRA for polling in Michigan. That pollster operates only in Michigan.
It has Barack Obama down 37-61, which makes no sense in a State that went 54-45 for the President in 2012. The fault with that poll is that it has a set of "excellent-good-fair-poor" choices. "Fair" in school grading is a C, good enough through a BA degree.
In any event, the poll is still shows much the same as an earlier and more credible poll of Michigan.
Title: Re: 2016 Official Polling Map Thread
Post by: pbrower2a on February 18, 2014, 01:30:33 PM
Louisiana, PPP:
Christie- 44%
Clinton- 43%
Jindal- 47%
Clinton- 45%
Paul- 47%
Clinton- 43%
Huckabee- 49%
Clinton- 44%
Bush- 50%
Clinton- 43%
The closeness of this polling indicates that Republicans have deep trouble against Hillary Clinton nationwide.
blue, Republican -- red, Democratic
30% -- lead with 40-49% but a margin of 3% or less
40% -- lead with 40-49% but a margin of 4% or more
60% -- lead with 50-54%
70% -- lead with 55-59%
90% -- lead with 60% or more
Hillary Clinton vs. Jeb Bush
(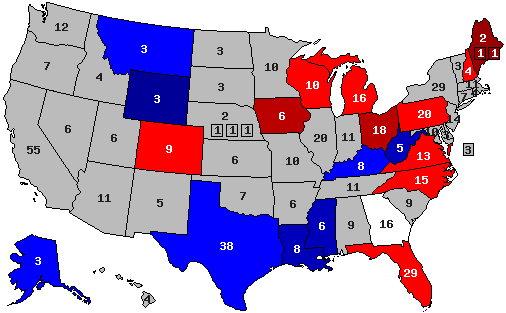 )
)
Hillary Clinton vs. Chris Christie
( )
)
Hillary Clinton vs. Rand Paul
( )
)
Hillary Clinton vs. Paul Ryan
()
Christie- 44%
Clinton- 43%
Jindal- 47%
Clinton- 45%
Paul- 47%
Clinton- 43%
Huckabee- 49%
Clinton- 44%
Bush- 50%
Clinton- 43%
The closeness of this polling indicates that Republicans have deep trouble against Hillary Clinton nationwide.
blue, Republican -- red, Democratic
30% -- lead with 40-49% but a margin of 3% or less
40% -- lead with 40-49% but a margin of 4% or more
60% -- lead with 50-54%
70% -- lead with 55-59%
90% -- lead with 60% or more
Hillary Clinton vs. Jeb Bush
(
Hillary Clinton vs. Chris Christie
(
Hillary Clinton vs. Rand Paul
(
Hillary Clinton vs. Paul Ryan
(
Title: Re: 2016 Official Polling Map Thread
Post by: eric82oslo on February 18, 2014, 03:30:24 PM
Louisiana has been polled for the 4th time, once again by PPP. 4 Republicans are still ahead of Hillary in the state, while Christie is tied to her and their Governor Jindal is trailing her by 2.5%. Paul Ryan is still ahead by 1%, Rand Paul by 2.5%, while Jeb Bush has opened a strong 3.5% lead. However, it's Mike Huckabee, who's been included for the first time in the state, who flashes the most impressive lead, being a whole 5% ahead of the Dem frontrunner.
The number of total state polls added to the lists below has thus now reached 94.
So here they are - all the 2016 poll averages for each state so far - 26 states having been polled to date - and how far off they are compared to the actual 2012 outcomes. I'm only including the Republican candidate with the best statewide polling.
Alaska: Hillary vs Jeb Bush: R +7.5%
+6.5% D improvement
(Updated on February 5, 2014)
Arkansas: Hillary vs Chris Christie: D +2%
+22% D improvement
Current Democratic gain
(Updated on August 11)
Colorado: Hillary vs Christie: R +3.6%
+9% R improvement
Current Republican gain
(Updated on February 6, 2014)
Florida: Hillary vs Bush: D +7.3%
+6.4% D improvement
(Updated on January 31, 2014)
Georgia: Hillary vs Christie: R +2%
+6% D improvement
(Updated August 8 )
Iowa: Hillary vs Christie: D +0.4%
+5.4% R improvement
(Updated on December 17)
Kansas: Hillary vs Paul Ryan: R +7%
+15% D improvement
(Updated on February 26)
Kentucky: Hillary vs Christie/Jeb Bush: R +4%
+19% D improvement
(Updated on December 22)
Louisiana: Hillary vs Mike Huckabee: R +5%
+12% D improvement
(Updated on February 18, 2014)
Maine: Hillary vs Christie: D +8%
+7% R improvement
(Updated on November 13)
Michigan: Hillary vs Christie: D +3.75%
+5.75% R improvement
(Updated on February 14, 2014)
Minnesota: Hillary vs Christie: D +6%
+2% R improvement
(Updated on January 22, 2013)
Mississippi: Hillary vs Christie: R +9%
+2.5% D improvement
(Updated on November 19)
Montana: Hillary vs Rand Paul: R +13%
+1% D improvement
(Updated on November 24)
New Hampshire: Hillary vs Christie: D +3.7%
+1.9% R improvement
(Updated on January 30, 2014)
New Jersey: Hillary vs Christie: D +10.6%
+7.2% R improvement
(Updated on January 22, 2014)
New York: Hillary vs Christie: D +23.2%
+5% R improvement
(Updated on February 13, 2014)
North Carolina: Hillary vs Christie: R +1%
+1% D improvement
(Updated on February 12, 2014)
Ohio: Hillary vs Christie: D +3.3%
+0.3% D improvement
(Updated on November 27)
Pennsylvania: Hillary vs Christie: D +0.7%
+4.7% R improvement
(Updated on December 19)
South Carolina: Hillary vs Marco Rubio: R+7%
+3.5% D improvement
(Updated on November 2)
Texas: Hillary vs Jeb Bush: R +5%
+11% D improvement
(Updated on November 8 )
Virginia: Hillary vs Christie: D +2.5%
+1.4% R improvement
(Updated on November 26)
West Virginia: Hillary vs Jeb Bush: R +14%
+13% D improvement
(Updated on October 1)
Wisconsin: Hillary vs Jeb Bush: D +4%
+3% R improvement
(Updated on October 29)
Wyoming: Hillary vs Christie: R +28%
+13% D improvement
(Updated on July 23)
Average all 26 states: Hillary vs Best Republican: R +1.2%
+3.1% D improvement (from Obama 2012) [projecting a 6.9% victory for Hillary]
That gives us this map right now:
(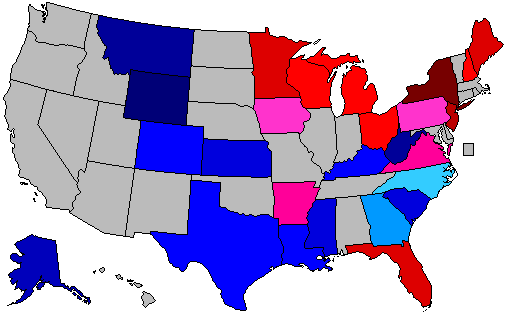 )
)
Red = Democratic lead
Blue = Republican lead
Green = Exact tie
Grey = No polling yet
Green = toss up
20% shade = 0.1-1% lead
30% shade = 1.1-3% lead
40% shade = 3.1-6% lead
50% shade = 6.1-9% lead
60% shade = 9.1-12% lead
70% shade = 12.1-15% lead
80% shade = 15.1-18% lead
90% shade = Above 18.1% lead
In the count of electoral votes, this means the current situation looks like this:
Hillary: 195 EVs (for a total of 13 states)
Best/Tailormade Republican: 118 EVs (for a total of 13 states)
Toss-up: None
No polling: 225 EVs [almost half, including California] (for a total of 24 states + D.C.)
Which means that Hillary has captured a rather impressive 62.3% of all EVs awarded thus far, against a more or less disappointing 37.7% EVs for the tailormade Republican. And only New York, Maine and New Jersey of the solidly Democratic states have been polled so far, against no less than 12 solidly Republican states - the biggest one of them, Texas, included. With California added to Hillary's pie, it'll look even more promising for her. Neither to forget such states as D.C., Vermont, Hawaii & Maryland. It's looking like a landslide right now, even without Colorado and Pennsylvania being in Hillary's column.
This is how the Trendline Map looks so far:
( )
)
The states which right now are showing the strongest improvement for the Democratic (Hillary) or the Republican candidate (in 17 out of 26 cases, Christie is that person):
1. Arkansas: D +22%
2. Kentucky: D +19%
3. Kansas: D +15%
4. West Virginia: D +13%
5. Wyoming: D +13%
6. Louisiana: D +12%
7. Texas: D +11%
8. Colorado: R +9%
9. New Jersey: R +7.2%
10. Maine: R +7%
11. Alaska: D +6.5%
12. Florida: D +6.4%
13. Georgia: D +6%
14. Michigan: R +5.75%
15. Iowa: R +5.4%
16. New York: R +5%
17. Pennsylvania: R +4.7%
All of these changes (in the 17 states above) are (more than) statistically significant. We see that (so far) Texas is experiencing a much more rapid change than other demographically quick-changing states like Florida and Georgia. Unfortunately, the 4th quick-changing traditionally Republican state, Arizona, has still not been polled.
The whole list of states having been polled till now, going from Democratic stronghold to Republican stronghold:
New York: D +23.2%
New Jersey: D +10.6%
Maine: D +8%
Florida: D +7.3%
Currently estimated/projected national average: D +6.9%
Minnesota: D +6%
Wisconsin: D +4%
Michigan: D +3.75%
New Hampshire: D +3.7%
Ohio: D +3.3%
Virginia: D +2.5%
Arkansas: D +2%
Pennsylvania: D +0.7%
Iowa: D +0.4%
North Carolina: R +1%
Georgia: R +2%
Colorado: R +3.6%
Kentucky: R +4%
Louisiana: R +5%
Texas: R +5%
South Carolina: R +7%
Kansas: R +7%
Alaska: R +7.5%
Mississippi: R +9%
Montana: R +13%
West Virginia: R +14%
Wyoming: R +28%
6 or 7 states are currently way too close to call; Virginia, Arkansas, Pennsylvania & Iowa (all leaning towards Hillary), plus North Carolina and Georgia (all leaning Republican). After the last Ohio poll, Ohio could possibly be added to the too-close-to-call states, just barely leaning towards Hillary by an average of 3.3%.
Here are the current stats on Republican candidates:
1. Chris Christie favoured in 17 of 26 states
2. Jeb Bush favoured in 6 states (Texas (!), Florida, Wisconsin (!!), Kentucky (!!), West Virginia & Alaska)
3. Marco Rubio favoured in 1 state (South Carolina)
4. Mike Huckabee favoured in 1 state (Louisiana)
5. Paul Ryan favoured in 1 state (Kansas [and almost Colorado])
6. Rand Paul favoured in 1 state (Montana)
Current update as of February 18.
The number of total state polls added to the lists below has thus now reached 94.
So here they are - all the 2016 poll averages for each state so far - 26 states having been polled to date - and how far off they are compared to the actual 2012 outcomes. I'm only including the Republican candidate with the best statewide polling.
Alaska: Hillary vs Jeb Bush: R +7.5%
+6.5% D improvement
(Updated on February 5, 2014)
Arkansas: Hillary vs Chris Christie: D +2%
+22% D improvement
Current Democratic gain
(Updated on August 11)
Colorado: Hillary vs Christie: R +3.6%
+9% R improvement
Current Republican gain
(Updated on February 6, 2014)
Florida: Hillary vs Bush: D +7.3%
+6.4% D improvement
(Updated on January 31, 2014)
Georgia: Hillary vs Christie: R +2%
+6% D improvement
(Updated August 8 )
Iowa: Hillary vs Christie: D +0.4%
+5.4% R improvement
(Updated on December 17)
Kansas: Hillary vs Paul Ryan: R +7%
+15% D improvement
(Updated on February 26)
Kentucky: Hillary vs Christie/Jeb Bush: R +4%
+19% D improvement
(Updated on December 22)
Louisiana: Hillary vs Mike Huckabee: R +5%
+12% D improvement
(Updated on February 18, 2014)
Maine: Hillary vs Christie: D +8%
+7% R improvement
(Updated on November 13)
Michigan: Hillary vs Christie: D +3.75%
+5.75% R improvement
(Updated on February 14, 2014)
Minnesota: Hillary vs Christie: D +6%
+2% R improvement
(Updated on January 22, 2013)
Mississippi: Hillary vs Christie: R +9%
+2.5% D improvement
(Updated on November 19)
Montana: Hillary vs Rand Paul: R +13%
+1% D improvement
(Updated on November 24)
New Hampshire: Hillary vs Christie: D +3.7%
+1.9% R improvement
(Updated on January 30, 2014)
New Jersey: Hillary vs Christie: D +10.6%
+7.2% R improvement
(Updated on January 22, 2014)
New York: Hillary vs Christie: D +23.2%
+5% R improvement
(Updated on February 13, 2014)
North Carolina: Hillary vs Christie: R +1%
+1% D improvement
(Updated on February 12, 2014)
Ohio: Hillary vs Christie: D +3.3%
+0.3% D improvement
(Updated on November 27)
Pennsylvania: Hillary vs Christie: D +0.7%
+4.7% R improvement
(Updated on December 19)
South Carolina: Hillary vs Marco Rubio: R+7%
+3.5% D improvement
(Updated on November 2)
Texas: Hillary vs Jeb Bush: R +5%
+11% D improvement
(Updated on November 8 )
Virginia: Hillary vs Christie: D +2.5%
+1.4% R improvement
(Updated on November 26)
West Virginia: Hillary vs Jeb Bush: R +14%
+13% D improvement
(Updated on October 1)
Wisconsin: Hillary vs Jeb Bush: D +4%
+3% R improvement
(Updated on October 29)
Wyoming: Hillary vs Christie: R +28%
+13% D improvement
(Updated on July 23)
Average all 26 states: Hillary vs Best Republican: R +1.2%
+3.1% D improvement (from Obama 2012) [projecting a 6.9% victory for Hillary]
That gives us this map right now:
(
Red = Democratic lead
Blue = Republican lead
Green = Exact tie
Grey = No polling yet
Green = toss up
20% shade = 0.1-1% lead
30% shade = 1.1-3% lead
40% shade = 3.1-6% lead
50% shade = 6.1-9% lead
60% shade = 9.1-12% lead
70% shade = 12.1-15% lead
80% shade = 15.1-18% lead
90% shade = Above 18.1% lead
In the count of electoral votes, this means the current situation looks like this:
Hillary: 195 EVs (for a total of 13 states)
Best/Tailormade Republican: 118 EVs (for a total of 13 states)
Toss-up: None
No polling: 225 EVs [almost half, including California] (for a total of 24 states + D.C.)
Which means that Hillary has captured a rather impressive 62.3% of all EVs awarded thus far, against a more or less disappointing 37.7% EVs for the tailormade Republican. And only New York, Maine and New Jersey of the solidly Democratic states have been polled so far, against no less than 12 solidly Republican states - the biggest one of them, Texas, included. With California added to Hillary's pie, it'll look even more promising for her. Neither to forget such states as D.C., Vermont, Hawaii & Maryland. It's looking like a landslide right now, even without Colorado and Pennsylvania being in Hillary's column.
This is how the Trendline Map looks so far:
(
The states which right now are showing the strongest improvement for the Democratic (Hillary) or the Republican candidate (in 17 out of 26 cases, Christie is that person):
1. Arkansas: D +22%
2. Kentucky: D +19%
3. Kansas: D +15%
4. West Virginia: D +13%
5. Wyoming: D +13%
6. Louisiana: D +12%
7. Texas: D +11%
8. Colorado: R +9%
9. New Jersey: R +7.2%
10. Maine: R +7%
11. Alaska: D +6.5%
12. Florida: D +6.4%
13. Georgia: D +6%
14. Michigan: R +5.75%
15. Iowa: R +5.4%
16. New York: R +5%
17. Pennsylvania: R +4.7%
All of these changes (in the 17 states above) are (more than) statistically significant. We see that (so far) Texas is experiencing a much more rapid change than other demographically quick-changing states like Florida and Georgia. Unfortunately, the 4th quick-changing traditionally Republican state, Arizona, has still not been polled.
The whole list of states having been polled till now, going from Democratic stronghold to Republican stronghold:
New York: D +23.2%
New Jersey: D +10.6%
Maine: D +8%
Florida: D +7.3%
Currently estimated/projected national average: D +6.9%
Minnesota: D +6%
Wisconsin: D +4%
Michigan: D +3.75%
New Hampshire: D +3.7%
Ohio: D +3.3%
Virginia: D +2.5%
Arkansas: D +2%
Pennsylvania: D +0.7%
Iowa: D +0.4%
North Carolina: R +1%
Georgia: R +2%
Colorado: R +3.6%
Kentucky: R +4%
Louisiana: R +5%
Texas: R +5%
South Carolina: R +7%
Kansas: R +7%
Alaska: R +7.5%
Mississippi: R +9%
Montana: R +13%
West Virginia: R +14%
Wyoming: R +28%
6 or 7 states are currently way too close to call; Virginia, Arkansas, Pennsylvania & Iowa (all leaning towards Hillary), plus North Carolina and Georgia (all leaning Republican). After the last Ohio poll, Ohio could possibly be added to the too-close-to-call states, just barely leaning towards Hillary by an average of 3.3%.
Here are the current stats on Republican candidates:
1. Chris Christie favoured in 17 of 26 states
2. Jeb Bush favoured in 6 states (Texas (!), Florida, Wisconsin (!!), Kentucky (!!), West Virginia & Alaska)
3. Marco Rubio favoured in 1 state (South Carolina)
4. Mike Huckabee favoured in 1 state (Louisiana)
5. Paul Ryan favoured in 1 state (Kansas [and almost Colorado])
6. Rand Paul favoured in 1 state (Montana)
Current update as of February 18.
Title: Re: 2016 Official Polling Map Thread
Post by: pbrower2a on February 19, 2014, 10:32:53 AM
Even if one thinks that slight recent leads for Hillary Clinton in Arkansas, Kentucky, and Louisiana are unsustainable -- that if she has a 45-43 lead then the 45 is close to her ceiling in such states -- she has leads in some others consistent with at the least a near-repetition of 2012 for Barack Obama. (I do not average except within a week; obviously a PPP poll in March 2014 thoroughly supplants one from October 2013). So in such a state she might have a ceiling of 47% and win the state only if some third-party nominee guts the R total.
On the other side, republicans could be close to their ceilings in such states as Colorado and Iowa, and a recent 46-45 lead for a Republican could end up 52-47 for Clinton.
In 2008 we saw polls with Obama up 45-44 in North Dakota and South Dakota. He ended up losing those states something like 54-46.
Title: Re: 2016 Official Polling Map Thread
Post by: pbrower2a on February 19, 2014, 11:03:21 AM
It's telling that Ted Cruz was not shown in the PPP poll of Louisiana. In view of his poor performances he seems to now get the neglect that he deserves as a potential Republican nominee. I have kept polling for him separate from that for Bush, Christie, Paul, and Ryan.
This may show more relevance to the 2016 election: the voting behavior of the states from 1992 to 2012 in Presidential elections. So here we go:
all Republican (6R): navy 101
all but once Republican (5R, 1D): 55
4 Republican, 2 Democratic: 61
split evenly: 38
for the winner every time (4 Democratic, 2 Republican): 24
all but once Democratic (1R, 5D): red 15
all Democratic (6D): maroon 243
(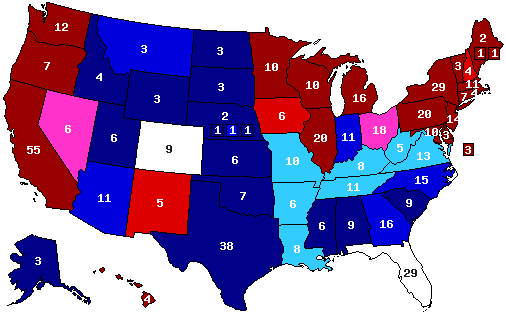 )
)
This may show more relevance to the 2016 election: the voting behavior of the states from 1992 to 2012 in Presidential elections. So here we go:
all Republican (6R): navy 101
all but once Republican (5R, 1D): 55
4 Republican, 2 Democratic: 61
split evenly: 38
for the winner every time (4 Democratic, 2 Republican): 24
all but once Democratic (1R, 5D): red 15
all Democratic (6D): maroon 243
(
Title: Re: 2016 Official Polling Map Thread
Post by: eric82oslo on February 20, 2014, 08:26:28 AM
Thanks to Quinnipiac we now have our 4th poll of 2016 match-ups from the ultimate battleground state of Ohio. Because Christie previously have been lightyears ahead of everyone else on the Republican side, he keeps his lead for now, even by a considerable margin. On this last occasion though, he only polled shared third the best on the Republican side, after Paul Ryan and Ohio's own Governor John Kasich. Nevertheless, Christie slips in the crucial state by about 2.5%, going down from -3.3% to the current -5.75%.
The number of total state polls added to the lists below has thus now reached 95.
So here they are - all the 2016 poll averages for each state so far - 26 states having been polled to date - and how far off they are compared to the actual 2012 outcomes. I'm only including the Republican candidate with the best statewide polling.
Alaska: Hillary vs Jeb Bush: R +7.5%
+6.5% D improvement
(Updated on February 5, 2014)
Arkansas: Hillary vs Chris Christie: D +2%
+22% D improvement
Current Democratic gain
(Updated on August 11)
Colorado: Hillary vs Christie: R +3.6%
+9% R improvement
Current Republican gain
(Updated on February 6, 2014)
Florida: Hillary vs Bush: D +7.3%
+6.4% D improvement
(Updated on January 31, 2014)
Georgia: Hillary vs Christie: R +2%
+6% D improvement
(Updated August 8 )
Iowa: Hillary vs Christie: D +0.4%
+5.4% R improvement
(Updated on December 17)
Kansas: Hillary vs Paul Ryan: R +7%
+15% D improvement
(Updated on February 26)
Kentucky: Hillary vs Christie/Jeb Bush: R +4%
+19% D improvement
(Updated on December 22)
Louisiana: Hillary vs Mike Huckabee: R +5%
+12% D improvement
(Updated on February 18, 2014)
Maine: Hillary vs Christie: D +8%
+7% R improvement
(Updated on November 13)
Michigan: Hillary vs Christie: D +3.75%
+5.75% R improvement
(Updated on February 14, 2014)
Minnesota: Hillary vs Christie: D +6%
+2% R improvement
(Updated on January 22, 2013)
Mississippi: Hillary vs Christie: R +9%
+2.5% D improvement
(Updated on November 19)
Montana: Hillary vs Rand Paul: R +13%
+1% D improvement
(Updated on November 24)
New Hampshire: Hillary vs Christie: D +3.7%
+1.9% R improvement
(Updated on January 30, 2014)
New Jersey: Hillary vs Christie: D +10.6%
+7.2% R improvement
(Updated on January 22, 2014)
New York: Hillary vs Christie: D +23.2%
+5% R improvement
(Updated on February 13, 2014)
North Carolina: Hillary vs Christie: R +1%
+1% D improvement
(Updated on February 12, 2014)
Ohio: Hillary vs Christie: D +5.75%
+2.8% D improvement
(Updated on February 20, 2014)
Pennsylvania: Hillary vs Christie: D +0.7%
+4.7% R improvement
(Updated on December 19)
South Carolina: Hillary vs Marco Rubio: R+7%
+3.5% D improvement
(Updated on November 2)
Texas: Hillary vs Jeb Bush: R +5%
+11% D improvement
(Updated on November 8 )
Virginia: Hillary vs Christie: D +2.5%
+1.4% R improvement
(Updated on November 26)
West Virginia: Hillary vs Jeb Bush: R +14%
+13% D improvement
(Updated on October 1)
Wisconsin: Hillary vs Jeb Bush: D +4%
+3% R improvement
(Updated on October 29)
Wyoming: Hillary vs Christie: R +28%
+13% D improvement
(Updated on July 23)
Average all 26 states: Hillary vs Best Republican: R +1.1%
+3.2% D improvement (from Obama 2012) [projecting a 7% victory for Hillary]
That gives us this map right now:
()
Red = Democratic lead
Blue = Republican lead
Green = Exact tie
Grey = No polling yet
Green = toss up
20% shade = 0.1-1% lead
30% shade = 1.1-3% lead
40% shade = 3.1-6% lead
50% shade = 6.1-9% lead
60% shade = 9.1-12% lead
70% shade = 12.1-15% lead
80% shade = 15.1-18% lead
90% shade = Above 18.1% lead
In the count of electoral votes, this means the current situation looks like this:
Hillary: 195 EVs (for a total of 13 states)
Best/Tailormade Republican: 118 EVs (for a total of 13 states)
Toss-up: None
No polling: 225 EVs [almost half, including California] (for a total of 24 states + D.C.)
Which means that Hillary has captured a rather impressive 62.3% of all EVs awarded thus far, against a more or less disappointing 37.7% EVs for the tailormade Republican. And only New York, Maine and New Jersey of the solidly Democratic states have been polled so far, against no less than 12 solidly Republican states - the biggest one of them, Texas, included. With California added to Hillary's pie, it'll look even more promising for her. Neither to forget such states as D.C., Vermont, Hawaii & Maryland. It's looking like a landslide right now, even without Colorado and Pennsylvania being in Hillary's column.
This is how the Trendline Map looks so far:
( )
)
The states which right now are showing the strongest improvement for the Democratic (Hillary) or the Republican candidate (in 17 out of 26 cases, Christie is that person):
1. Arkansas: D +22%
2. Kentucky: D +19%
3. Kansas: D +15%
4. West Virginia: D +13%
5. Wyoming: D +13%
6. Louisiana: D +12%
7. Texas: D +11%
8. Colorado: R +9%
9. New Jersey: R +7.2%
10. Maine: R +7%
11. Alaska: D +6.5%
12. Florida: D +6.4%
13. Georgia: D +6%
14. Michigan: R +5.75%
15. Iowa: R +5.4%
16. New York: R +5%
17. Pennsylvania: R +4.7%
All of these changes (in the 17 states above) are (more than) statistically significant. We see that (so far) Texas is experiencing a much more rapid change than other demographically quick-changing states like Florida and Georgia. Unfortunately, the 4th quick-changing traditionally Republican state, Arizona, has still not been polled.
The whole list of states having been polled till now, going from Democratic stronghold to Republican stronghold:
New York: D +23.2%
New Jersey: D +10.6%
Maine: D +8%
Florida: D +7.3%
Currently estimated/projected national average: D +7%
Minnesota: D +6%
Ohio: D +5.75%
Wisconsin: D +4%
Michigan: D +3.75%
New Hampshire: D +3.7%
Virginia: D +2.5%
Arkansas: D +2%
Pennsylvania: D +0.7%
Iowa: D +0.4%
North Carolina: R +1%
Georgia: R +2%
Colorado: R +3.6%
Kentucky: R +4%
Louisiana: R +5%
Texas: R +5%
South Carolina: R +7%
Kansas: R +7%
Alaska: R +7.5%
Mississippi: R +9%
Montana: R +13%
West Virginia: R +14%
Wyoming: R +28%
6 states are currently way too close to call; Virginia, Arkansas, Pennsylvania & Iowa (all leaning towards Hillary), plus North Carolina and Georgia (all leaning Republican).
Here are the current stats on Republican candidates:
1. Chris Christie favoured in 17 of 26 states
2. Jeb Bush favoured in 6 states (Texas (!), Florida, Wisconsin (!!), Kentucky (!!), West Virginia & Alaska)
3. Marco Rubio favoured in 1 state (South Carolina)
4. Mike Huckabee favoured in 1 state (Louisiana)
5. Paul Ryan favoured in 1 state (Kansas [and almost Colorado])
6. Rand Paul favoured in 1 state (Montana)
Current update as of February 20.
The number of total state polls added to the lists below has thus now reached 95.
So here they are - all the 2016 poll averages for each state so far - 26 states having been polled to date - and how far off they are compared to the actual 2012 outcomes. I'm only including the Republican candidate with the best statewide polling.
Alaska: Hillary vs Jeb Bush: R +7.5%
+6.5% D improvement
(Updated on February 5, 2014)
Arkansas: Hillary vs Chris Christie: D +2%
+22% D improvement
Current Democratic gain
(Updated on August 11)
Colorado: Hillary vs Christie: R +3.6%
+9% R improvement
Current Republican gain
(Updated on February 6, 2014)
Florida: Hillary vs Bush: D +7.3%
+6.4% D improvement
(Updated on January 31, 2014)
Georgia: Hillary vs Christie: R +2%
+6% D improvement
(Updated August 8 )
Iowa: Hillary vs Christie: D +0.4%
+5.4% R improvement
(Updated on December 17)
Kansas: Hillary vs Paul Ryan: R +7%
+15% D improvement
(Updated on February 26)
Kentucky: Hillary vs Christie/Jeb Bush: R +4%
+19% D improvement
(Updated on December 22)
Louisiana: Hillary vs Mike Huckabee: R +5%
+12% D improvement
(Updated on February 18, 2014)
Maine: Hillary vs Christie: D +8%
+7% R improvement
(Updated on November 13)
Michigan: Hillary vs Christie: D +3.75%
+5.75% R improvement
(Updated on February 14, 2014)
Minnesota: Hillary vs Christie: D +6%
+2% R improvement
(Updated on January 22, 2013)
Mississippi: Hillary vs Christie: R +9%
+2.5% D improvement
(Updated on November 19)
Montana: Hillary vs Rand Paul: R +13%
+1% D improvement
(Updated on November 24)
New Hampshire: Hillary vs Christie: D +3.7%
+1.9% R improvement
(Updated on January 30, 2014)
New Jersey: Hillary vs Christie: D +10.6%
+7.2% R improvement
(Updated on January 22, 2014)
New York: Hillary vs Christie: D +23.2%
+5% R improvement
(Updated on February 13, 2014)
North Carolina: Hillary vs Christie: R +1%
+1% D improvement
(Updated on February 12, 2014)
Ohio: Hillary vs Christie: D +5.75%
+2.8% D improvement
(Updated on February 20, 2014)
Pennsylvania: Hillary vs Christie: D +0.7%
+4.7% R improvement
(Updated on December 19)
South Carolina: Hillary vs Marco Rubio: R+7%
+3.5% D improvement
(Updated on November 2)
Texas: Hillary vs Jeb Bush: R +5%
+11% D improvement
(Updated on November 8 )
Virginia: Hillary vs Christie: D +2.5%
+1.4% R improvement
(Updated on November 26)
West Virginia: Hillary vs Jeb Bush: R +14%
+13% D improvement
(Updated on October 1)
Wisconsin: Hillary vs Jeb Bush: D +4%
+3% R improvement
(Updated on October 29)
Wyoming: Hillary vs Christie: R +28%
+13% D improvement
(Updated on July 23)
Average all 26 states: Hillary vs Best Republican: R +1.1%
+3.2% D improvement (from Obama 2012) [projecting a 7% victory for Hillary]
That gives us this map right now:
(
Red = Democratic lead
Blue = Republican lead
Green = Exact tie
Grey = No polling yet
Green = toss up
20% shade = 0.1-1% lead
30% shade = 1.1-3% lead
40% shade = 3.1-6% lead
50% shade = 6.1-9% lead
60% shade = 9.1-12% lead
70% shade = 12.1-15% lead
80% shade = 15.1-18% lead
90% shade = Above 18.1% lead
In the count of electoral votes, this means the current situation looks like this:
Hillary: 195 EVs (for a total of 13 states)
Best/Tailormade Republican: 118 EVs (for a total of 13 states)
Toss-up: None
No polling: 225 EVs [almost half, including California] (for a total of 24 states + D.C.)
Which means that Hillary has captured a rather impressive 62.3% of all EVs awarded thus far, against a more or less disappointing 37.7% EVs for the tailormade Republican. And only New York, Maine and New Jersey of the solidly Democratic states have been polled so far, against no less than 12 solidly Republican states - the biggest one of them, Texas, included. With California added to Hillary's pie, it'll look even more promising for her. Neither to forget such states as D.C., Vermont, Hawaii & Maryland. It's looking like a landslide right now, even without Colorado and Pennsylvania being in Hillary's column.
This is how the Trendline Map looks so far:
(
The states which right now are showing the strongest improvement for the Democratic (Hillary) or the Republican candidate (in 17 out of 26 cases, Christie is that person):
1. Arkansas: D +22%
2. Kentucky: D +19%
3. Kansas: D +15%
4. West Virginia: D +13%
5. Wyoming: D +13%
6. Louisiana: D +12%
7. Texas: D +11%
8. Colorado: R +9%
9. New Jersey: R +7.2%
10. Maine: R +7%
11. Alaska: D +6.5%
12. Florida: D +6.4%
13. Georgia: D +6%
14. Michigan: R +5.75%
15. Iowa: R +5.4%
16. New York: R +5%
17. Pennsylvania: R +4.7%
All of these changes (in the 17 states above) are (more than) statistically significant. We see that (so far) Texas is experiencing a much more rapid change than other demographically quick-changing states like Florida and Georgia. Unfortunately, the 4th quick-changing traditionally Republican state, Arizona, has still not been polled.
The whole list of states having been polled till now, going from Democratic stronghold to Republican stronghold:
New York: D +23.2%
New Jersey: D +10.6%
Maine: D +8%
Florida: D +7.3%
Currently estimated/projected national average: D +7%
Minnesota: D +6%
Ohio: D +5.75%
Wisconsin: D +4%
Michigan: D +3.75%
New Hampshire: D +3.7%
Virginia: D +2.5%
Arkansas: D +2%
Pennsylvania: D +0.7%
Iowa: D +0.4%
North Carolina: R +1%
Georgia: R +2%
Colorado: R +3.6%
Kentucky: R +4%
Louisiana: R +5%
Texas: R +5%
South Carolina: R +7%
Kansas: R +7%
Alaska: R +7.5%
Mississippi: R +9%
Montana: R +13%
West Virginia: R +14%
Wyoming: R +28%
6 states are currently way too close to call; Virginia, Arkansas, Pennsylvania & Iowa (all leaning towards Hillary), plus North Carolina and Georgia (all leaning Republican).
Here are the current stats on Republican candidates:
1. Chris Christie favoured in 17 of 26 states
2. Jeb Bush favoured in 6 states (Texas (!), Florida, Wisconsin (!!), Kentucky (!!), West Virginia & Alaska)
3. Marco Rubio favoured in 1 state (South Carolina)
4. Mike Huckabee favoured in 1 state (Louisiana)
5. Paul Ryan favoured in 1 state (Kansas [and almost Colorado])
6. Rand Paul favoured in 1 state (Montana)
Current update as of February 20.
Title: Re: 2016 Official Polling Map Thread
Post by: pbrower2a on February 20, 2014, 12:11:02 PM
Ohio update from Quinnipiac:
http://www.quinnipiac.edu/institutes-and-centers/polling-institute/ohio/release-detail?ReleaseID=2010
A Republican nominee could have a difficult time winning Indiana if he loses Ohio by 9% or more. 51% is close to the max-out position for any Democrat in Ohio -- unless there's a 60-40 split of the popular vote.
blue, Republican -- red, Democratic
30% -- lead with 40-49% but a margin of 3% or less
40% -- lead with 40-49% but a margin of 4% or more
60% -- lead with 50-54%
70% -- lead with 55-59%
90% -- lead with 60% or more
Hillary Clinton vs. Jeb Bush
()
Hillary Clinton vs. Chris Christie
()
Hillary Clinton vs. Rand Paul
()
Hillary Clinton vs. Paul Ryan
()
Quote
Clinton 51%
Bush 36%
Clinton 50%
Rubio 36%
Clinton 51%
Paul 38%
Clinton 49%
Ryan 40%
Clinton 51%
Cruz 34%
Clinton 51%
Kasich 39%
Clinton 49%
Christie 36%
Bush 36%
Clinton 50%
Rubio 36%
Clinton 51%
Paul 38%
Clinton 49%
Ryan 40%
Clinton 51%
Cruz 34%
Clinton 51%
Kasich 39%
Clinton 49%
Christie 36%
http://www.quinnipiac.edu/institutes-and-centers/polling-institute/ohio/release-detail?ReleaseID=2010
A Republican nominee could have a difficult time winning Indiana if he loses Ohio by 9% or more. 51% is close to the max-out position for any Democrat in Ohio -- unless there's a 60-40 split of the popular vote.
blue, Republican -- red, Democratic
30% -- lead with 40-49% but a margin of 3% or less
40% -- lead with 40-49% but a margin of 4% or more
60% -- lead with 50-54%
70% -- lead with 55-59%
90% -- lead with 60% or more
Hillary Clinton vs. Jeb Bush
(
Hillary Clinton vs. Chris Christie
(
Hillary Clinton vs. Rand Paul
(
Hillary Clinton vs. Paul Ryan
(
Title: Re: 2016 Official Polling Map Thread
Post by: pbrower2a on February 20, 2014, 01:07:52 PM
Quote
Colorado, Quinnipiac
44-43 Clinton/Cruz (44-44)
http://www.quinnipiac.edu/institutes-and-centers/polling-institute/colorado/release-detail?ReleaseID=2004
44-43 Clinton/Cruz (44-44)
http://www.quinnipiac.edu/institutes-and-centers/polling-institute/colorado/release-detail?ReleaseID=2004
Needless to say I do not take Ted Cruz seriously. I wouldn't make much of the color change, as it is a change of about 1%.
Quinnipiac asked about Cruz in Ohio:
51 - 34 percent over U.S. Sen. Ted Cruz of Texas
http://www.quinnipiac.edu/institutes-and-centers/polling-institute/ohio/release-detail?ReleaseID=2010
Enough said.
blue, Republican -- red, Democratic
30% -- lead with 40-49% but a margin of 3% or less
40% -- lead with 40-49% but a margin of 4% or more
60% -- lead with 50-54%
70% -- lead with 55-59%
90% -- lead with 60% or more
(
..........................................................................
With these data points this looks much like Hillary Clinton winning about like Eisenhower over Stevenson in the 1950s or the elder Bush over Dukakis in 1988. It wouldn't be long before we see some fresh Great Right Hope in polling. Ted Cruz has yet to establish himself as Presidential material.
Title: Re: 2016 Official Polling Map Thread
Post by: eric82oslo on February 24, 2014, 02:23:45 PM
PPP has polled Kansas for the 2nd time this season, yet the 4 Republican candidates they tested this time again Clinton, were tested for the first time in the state. Best of them all did Jeb Bush, leading her by 9%, thus substituting the previous leader in the state, Paul Ryan. This means that Kansas is slowly drifting away from any chances of a Hillary upset, unsurprisingly. Jeb Bush is now the presumably strongest general election candidate in no less than 7 of the 26 states tested, including the very important states of Texas and Florida.
The number of total state polls added to the lists below has thus now reached 96.
So here they are - all the 2016 poll averages for each state so far - 26 states having been polled to date - and how far off they are compared to the actual 2012 outcomes. I'm only including the Republican candidate with the best statewide polling.
Alaska: Hillary vs Jeb Bush: R +7.5%
+6.5% D improvement
(Updated on February 5, 2014)
Arkansas: Hillary vs Chris Christie: D +2%
+22% D improvement
Current Democratic gain
(Updated on August 11)
Colorado: Hillary vs Christie: R +3.6%
+9% R improvement
Current Republican gain
(Updated on February 6, 2014)
Florida: Hillary vs Bush: D +7.3%
+6.4% D improvement
(Updated on January 31, 2014)
Georgia: Hillary vs Christie: R +2%
+6% D improvement
(Updated August 8 )
Iowa: Hillary vs Christie: D +0.4%
+5.4% R improvement
(Updated on December 17)
Kansas: Hillary vs Jeb Bush: R +9%
+13% D improvement
(Updated on February 24, 2014)
Kentucky: Hillary vs Christie/Bush: R +4%
+19% D improvement
(Updated on December 22)
Louisiana: Hillary vs Mike Huckabee: R +5%
+12% D improvement
(Updated on February 18, 2014)
Maine: Hillary vs Christie: D +8%
+7% R improvement
(Updated on November 13)
Michigan: Hillary vs Christie: D +3.75%
+5.75% R improvement
(Updated on February 14, 2014)
Minnesota: Hillary vs Christie: D +6%
+2% R improvement
(Updated on January 22, 2013)
Mississippi: Hillary vs Christie: R +9%
+2.5% D improvement
(Updated on November 19)
Montana: Hillary vs Rand Paul: R +13%
+1% D improvement
(Updated on November 24)
New Hampshire: Hillary vs Christie: D +3.7%
+1.9% R improvement
(Updated on January 30, 2014)
New Jersey: Hillary vs Christie: D +10.6%
+7.2% R improvement
(Updated on January 22, 2014)
New York: Hillary vs Christie: D +23.2%
+5% R improvement
(Updated on February 13, 2014)
North Carolina: Hillary vs Christie: R +1%
+1% D improvement
(Updated on February 12, 2014)
Ohio: Hillary vs Christie: D +5.75%
+2.8% D improvement
(Updated on February 20, 2014)
Pennsylvania: Hillary vs Christie: D +0.7%
+4.7% R improvement
(Updated on December 19)
South Carolina: Hillary vs Marco Rubio: R+7%
+3.5% D improvement
(Updated on November 2)
Texas: Hillary vs Jeb Bush: R +5%
+11% D improvement
(Updated on November 8 )
Virginia: Hillary vs Christie: D +2.5%
+1.4% R improvement
(Updated on November 26)
West Virginia: Hillary vs Jeb Bush: R +14%
+13% D improvement
(Updated on October 1)
Wisconsin: Hillary vs Jeb Bush: D +4%
+3% R improvement
(Updated on October 29)
Wyoming: Hillary vs Christie: R +28%
+13% D improvement
(Updated on July 23)
Average all 26 states: Hillary vs Best Republican: R +1.2%
+3.1% D improvement (from Obama 2012) [projecting a 6.95% victory for Hillary]
That gives us this map right now:
()
Red = Democratic lead
Blue = Republican lead
Green = Exact tie
Grey = No polling yet
Green = toss up
20% shade = 0.1-1% lead
30% shade = 1.1-3% lead
40% shade = 3.1-6% lead
50% shade = 6.1-9% lead
60% shade = 9.1-12% lead
70% shade = 12.1-15% lead
80% shade = 15.1-18% lead
90% shade = Above 18.1% lead
In the count of electoral votes, this means the current situation looks like this:
Hillary: 195 EVs (for a total of 13 states)
Best/Tailormade Republican: 118 EVs (for a total of 13 states)
Toss-up: None
No polling: 225 EVs [almost half, including California] (for a total of 24 states + D.C.)
Which means that Hillary has captured a rather impressive 62.3% of all EVs awarded thus far, against a more or less disappointing 37.7% EVs for the tailormade Republican. And only New York, Maine and New Jersey of the solidly Democratic states have been polled so far, against no less than 12 solidly Republican states - the biggest one of them, Texas, included. With California added to Hillary's pie, it'll look even more promising for her. Neither to forget such states as D.C., Vermont, Hawaii & Maryland. It's looking like a landslide right now, even without Colorado and Pennsylvania being in Hillary's column.
This is how the Trendline Map looks so far:
(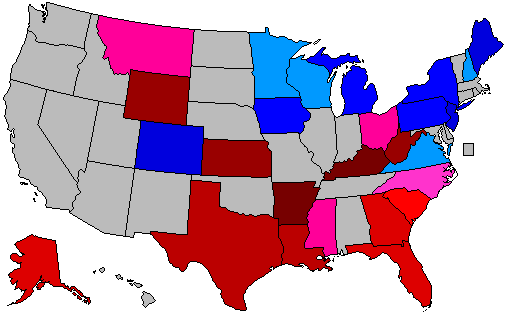 )
)
The states which right now are showing the strongest improvement for the Democratic (Hillary) or the Republican candidate (in 17 out of 26 cases, Christie is that person):
1. Arkansas: D +22%
2. Kentucky: D +19%
3. Kansas: D +13%
4. West Virginia: D +13%
5. Wyoming: D +13%
6. Louisiana: D +12%
7. Texas: D +11%
8. Colorado: R +9%
9. New Jersey: R +7.2%
10. Maine: R +7%
11. Alaska: D +6.5%
12. Florida: D +6.4%
13. Georgia: D +6%
14. Michigan: R +5.75%
15. Iowa: R +5.4%
16. New York: R +5%
17. Pennsylvania: R +4.7%
All of these changes (in the 17 states above) are (more than) statistically significant. We see that (so far) Texas is experiencing a much more rapid change than other demographically quick-changing states like Florida and Georgia. Unfortunately, the 4th quick-changing traditionally Republican state, Arizona, has still not been polled.
The whole list of states having been polled till now, going from Democratic stronghold to Republican stronghold:
New York: D +23.2%
New Jersey: D +10.6%
Maine: D +8%
Florida: D +7.3%
Currently estimated/projected national average: D +6.95%
Minnesota: D +6%
Ohio: D +5.75%
Wisconsin: D +4%
Michigan: D +3.75%
New Hampshire: D +3.7%
Virginia: D +2.5%
Arkansas: D +2%
Pennsylvania: D +0.7%
Iowa: D +0.4%
North Carolina: R +1%
Georgia: R +2%
Colorado: R +3.6%
Kentucky: R +4%
Louisiana: R +5%
Texas: R +5%
South Carolina: R +7%
Alaska: R +7.5%
Mississippi: R +9%
Kansas: R +9%
Montana: R +13%
West Virginia: R +14%
Wyoming: R +28%
6 states are currently way too close to call; Virginia, Arkansas, Pennsylvania & Iowa (all leaning towards Hillary), plus North Carolina and Georgia (all leaning Republican).
Here are the current stats on Republican candidates:
1. Chris Christie favoured in 17 of 26 states
2. Jeb Bush favoured in 7 states (Texas (!), Florida, Wisconsin (!!), Kentucky (!!), Kansas, West Virginia & Alaska)
3. Marco Rubio favoured in 1 state (South Carolina)
4. Mike Huckabee favoured in 1 state (Louisiana)
5. Rand Paul favoured in 1 state (Montana)
Current update as of February 24.
The number of total state polls added to the lists below has thus now reached 96.
So here they are - all the 2016 poll averages for each state so far - 26 states having been polled to date - and how far off they are compared to the actual 2012 outcomes. I'm only including the Republican candidate with the best statewide polling.
Alaska: Hillary vs Jeb Bush: R +7.5%
+6.5% D improvement
(Updated on February 5, 2014)
Arkansas: Hillary vs Chris Christie: D +2%
+22% D improvement
Current Democratic gain
(Updated on August 11)
Colorado: Hillary vs Christie: R +3.6%
+9% R improvement
Current Republican gain
(Updated on February 6, 2014)
Florida: Hillary vs Bush: D +7.3%
+6.4% D improvement
(Updated on January 31, 2014)
Georgia: Hillary vs Christie: R +2%
+6% D improvement
(Updated August 8 )
Iowa: Hillary vs Christie: D +0.4%
+5.4% R improvement
(Updated on December 17)
Kansas: Hillary vs Jeb Bush: R +9%
+13% D improvement
(Updated on February 24, 2014)
Kentucky: Hillary vs Christie/Bush: R +4%
+19% D improvement
(Updated on December 22)
Louisiana: Hillary vs Mike Huckabee: R +5%
+12% D improvement
(Updated on February 18, 2014)
Maine: Hillary vs Christie: D +8%
+7% R improvement
(Updated on November 13)
Michigan: Hillary vs Christie: D +3.75%
+5.75% R improvement
(Updated on February 14, 2014)
Minnesota: Hillary vs Christie: D +6%
+2% R improvement
(Updated on January 22, 2013)
Mississippi: Hillary vs Christie: R +9%
+2.5% D improvement
(Updated on November 19)
Montana: Hillary vs Rand Paul: R +13%
+1% D improvement
(Updated on November 24)
New Hampshire: Hillary vs Christie: D +3.7%
+1.9% R improvement
(Updated on January 30, 2014)
New Jersey: Hillary vs Christie: D +10.6%
+7.2% R improvement
(Updated on January 22, 2014)
New York: Hillary vs Christie: D +23.2%
+5% R improvement
(Updated on February 13, 2014)
North Carolina: Hillary vs Christie: R +1%
+1% D improvement
(Updated on February 12, 2014)
Ohio: Hillary vs Christie: D +5.75%
+2.8% D improvement
(Updated on February 20, 2014)
Pennsylvania: Hillary vs Christie: D +0.7%
+4.7% R improvement
(Updated on December 19)
South Carolina: Hillary vs Marco Rubio: R+7%
+3.5% D improvement
(Updated on November 2)
Texas: Hillary vs Jeb Bush: R +5%
+11% D improvement
(Updated on November 8 )
Virginia: Hillary vs Christie: D +2.5%
+1.4% R improvement
(Updated on November 26)
West Virginia: Hillary vs Jeb Bush: R +14%
+13% D improvement
(Updated on October 1)
Wisconsin: Hillary vs Jeb Bush: D +4%
+3% R improvement
(Updated on October 29)
Wyoming: Hillary vs Christie: R +28%
+13% D improvement
(Updated on July 23)
Average all 26 states: Hillary vs Best Republican: R +1.2%
+3.1% D improvement (from Obama 2012) [projecting a 6.95% victory for Hillary]
That gives us this map right now:
(
Red = Democratic lead
Blue = Republican lead
Green = Exact tie
Grey = No polling yet
Green = toss up
20% shade = 0.1-1% lead
30% shade = 1.1-3% lead
40% shade = 3.1-6% lead
50% shade = 6.1-9% lead
60% shade = 9.1-12% lead
70% shade = 12.1-15% lead
80% shade = 15.1-18% lead
90% shade = Above 18.1% lead
In the count of electoral votes, this means the current situation looks like this:
Hillary: 195 EVs (for a total of 13 states)
Best/Tailormade Republican: 118 EVs (for a total of 13 states)
Toss-up: None
No polling: 225 EVs [almost half, including California] (for a total of 24 states + D.C.)
Which means that Hillary has captured a rather impressive 62.3% of all EVs awarded thus far, against a more or less disappointing 37.7% EVs for the tailormade Republican. And only New York, Maine and New Jersey of the solidly Democratic states have been polled so far, against no less than 12 solidly Republican states - the biggest one of them, Texas, included. With California added to Hillary's pie, it'll look even more promising for her. Neither to forget such states as D.C., Vermont, Hawaii & Maryland. It's looking like a landslide right now, even without Colorado and Pennsylvania being in Hillary's column.
This is how the Trendline Map looks so far:
(
The states which right now are showing the strongest improvement for the Democratic (Hillary) or the Republican candidate (in 17 out of 26 cases, Christie is that person):
1. Arkansas: D +22%
2. Kentucky: D +19%
3. Kansas: D +13%
4. West Virginia: D +13%
5. Wyoming: D +13%
6. Louisiana: D +12%
7. Texas: D +11%
8. Colorado: R +9%
9. New Jersey: R +7.2%
10. Maine: R +7%
11. Alaska: D +6.5%
12. Florida: D +6.4%
13. Georgia: D +6%
14. Michigan: R +5.75%
15. Iowa: R +5.4%
16. New York: R +5%
17. Pennsylvania: R +4.7%
All of these changes (in the 17 states above) are (more than) statistically significant. We see that (so far) Texas is experiencing a much more rapid change than other demographically quick-changing states like Florida and Georgia. Unfortunately, the 4th quick-changing traditionally Republican state, Arizona, has still not been polled.
The whole list of states having been polled till now, going from Democratic stronghold to Republican stronghold:
New York: D +23.2%
New Jersey: D +10.6%
Maine: D +8%
Florida: D +7.3%
Currently estimated/projected national average: D +6.95%
Minnesota: D +6%
Ohio: D +5.75%
Wisconsin: D +4%
Michigan: D +3.75%
New Hampshire: D +3.7%
Virginia: D +2.5%
Arkansas: D +2%
Pennsylvania: D +0.7%
Iowa: D +0.4%
North Carolina: R +1%
Georgia: R +2%
Colorado: R +3.6%
Kentucky: R +4%
Louisiana: R +5%
Texas: R +5%
South Carolina: R +7%
Alaska: R +7.5%
Mississippi: R +9%
Kansas: R +9%
Montana: R +13%
West Virginia: R +14%
Wyoming: R +28%
6 states are currently way too close to call; Virginia, Arkansas, Pennsylvania & Iowa (all leaning towards Hillary), plus North Carolina and Georgia (all leaning Republican).
Here are the current stats on Republican candidates:
1. Chris Christie favoured in 17 of 26 states
2. Jeb Bush favoured in 7 states (Texas (!), Florida, Wisconsin (!!), Kentucky (!!), Kansas, West Virginia & Alaska)
3. Marco Rubio favoured in 1 state (South Carolina)
4. Mike Huckabee favoured in 1 state (Louisiana)
5. Rand Paul favoured in 1 state (Montana)
Current update as of February 24.
Title: Re: 2016 Official Polling Map Thread
Post by: pbrower2a on February 24, 2014, 03:05:25 PM
Kansas, PPP:
Surprisingly close. Hillary Clinton's ceiling in Kansas is probably around 45% (which is about how Carter did in Kansas in 1976) because the state is Kansas. As I have said elsewhere on some other states, Kansas may never vote for a Democratic nominee for President, but when it is close, then things are very bad for the Republican. Only one Republican breaks the magic 50% line against Hillary Clinton at this stage. They probably all would. If the Devil ran as a Republican nominee in Kansas, he'd probably win.
blue, Republican -- red, Democratic
30% -- lead with 40-49% but a margin of 3% or less
40% -- lead with 40-49% but a margin of 4% or more
60% -- lead with 50-54%
70% -- lead with 55-59%
90% -- lead with 60% or more
Hillary Clinton vs. Jeb Bush
( )
)
Hillary Clinton vs. Chris Christie
(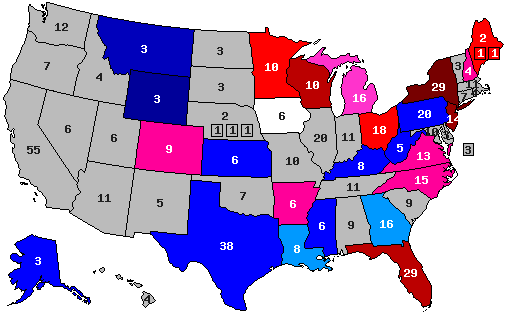 )
)
Hillary Clinton vs. Rand Paul
(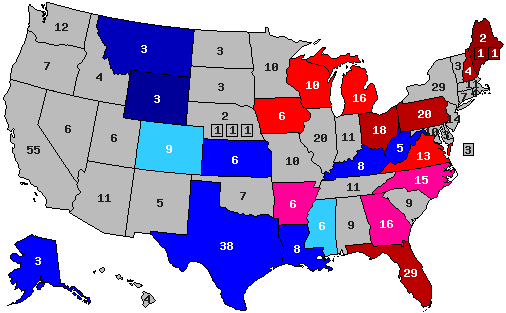 )
)
Hillary Clinton vs. Paul Ryan
()
Quote
Bush- 50%
Clinton- 41%
Huckabee- 49%
Clinton- 42%
Paul- 48%
Clinton- 41%
Christie- 46%
Clinton- 39%
Clinton- 41%
Huckabee- 49%
Clinton- 42%
Paul- 48%
Clinton- 41%
Christie- 46%
Clinton- 39%
Surprisingly close. Hillary Clinton's ceiling in Kansas is probably around 45% (which is about how Carter did in Kansas in 1976) because the state is Kansas. As I have said elsewhere on some other states, Kansas may never vote for a Democratic nominee for President, but when it is close, then things are very bad for the Republican. Only one Republican breaks the magic 50% line against Hillary Clinton at this stage. They probably all would. If the Devil ran as a Republican nominee in Kansas, he'd probably win.
blue, Republican -- red, Democratic
30% -- lead with 40-49% but a margin of 3% or less
40% -- lead with 40-49% but a margin of 4% or more
60% -- lead with 50-54%
70% -- lead with 55-59%
90% -- lead with 60% or more
Hillary Clinton vs. Jeb Bush
(
Hillary Clinton vs. Chris Christie
(
Hillary Clinton vs. Rand Paul
(
Hillary Clinton vs. Paul Ryan
(
Title: Re: 2016 Official Polling Map Thread
Post by: eric82oslo on February 24, 2014, 03:08:18 PM
How come you have Hillary beating Rand Paul and Chris Christie in Kansas?
Title: Re: 2016 Official Polling Map Thread
Post by: pbrower2a on February 24, 2014, 06:13:56 PM
How come you have Hillary beating Rand Paul and Chris Christie in Kansas?
Not any more.
Title: Re: 2016 Official Polling Map Thread
Post by: pbrower2a on February 27, 2014, 06:56:04 AM
Quinnipiac, Pennsylvania
Clinton 46%
Christie 41%
Clinton 53%
Paul 38%
Clinton 54%
Cruz 34%
Clinton 53%
Bush 36%
Clinton 53%
Santorum 37%
Nothing on Ryan... or Huckabee. Christie still has (or has regained) some recognition as a moderate, or else the bridge scandal seems to not trouble Pennsylvanians as severely as it has done recently. Maybe the concern about manipulation of traffic to punish contrary politicians doesn't seem possible or relevant in Pennsylvania. What had been a Christie lead over Clinton in the last Quinnipiac poll has gone -- and how!
The others ... well, in essence these make Hillary Clinton's lags in Kansas look trivial by contrast. Kansas is very sure R, and Pennsylvania is close to the tipping point. Win a state like Pennsylvania by 5% and you win the Presidential election.
Hillary Clinton is well above 50% against the others. Not only must the others win over every potential undecided voter; they must cut into the usual D vote in Pennsylvania, which is asking for the impossible -- barring a breaking scandal or a huge cultural change that favors just about any right-wing Republican. Against those, she wins with a margin ranging from those characteristic of Eisenhower in the 1950s to Reagan in 1984.
.........................
blue, Republican -- red, Democratic
30% -- lead with 40-49% but a margin of 3% or less
40% -- lead with 40-49% but a margin of 4% or more
60% -- lead with 50-54%
70% -- lead with 55-59%
90% -- lead with 60% or more
Hillary Clinton vs. Jeb Bush
(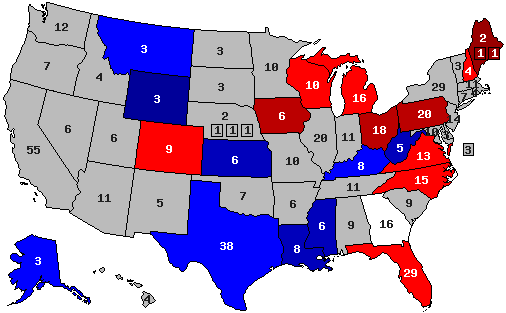 )
)
Hillary Clinton vs. Chris Christie
(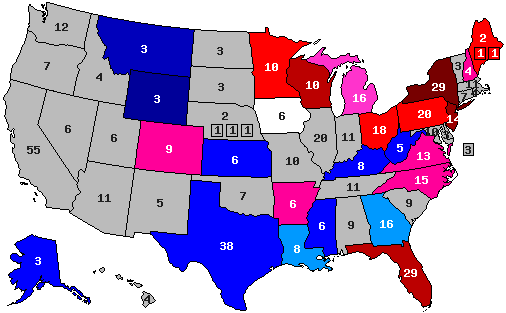 )
)
Hillary Clinton vs. Rand Paul
()
Hillary Clinton vs. Paul Ryan
()
Clinton 46%
Christie 41%
Clinton 53%
Paul 38%
Clinton 54%
Cruz 34%
Clinton 53%
Bush 36%
Clinton 53%
Santorum 37%
Nothing on Ryan... or Huckabee. Christie still has (or has regained) some recognition as a moderate, or else the bridge scandal seems to not trouble Pennsylvanians as severely as it has done recently. Maybe the concern about manipulation of traffic to punish contrary politicians doesn't seem possible or relevant in Pennsylvania. What had been a Christie lead over Clinton in the last Quinnipiac poll has gone -- and how!
The others ... well, in essence these make Hillary Clinton's lags in Kansas look trivial by contrast. Kansas is very sure R, and Pennsylvania is close to the tipping point. Win a state like Pennsylvania by 5% and you win the Presidential election.
Hillary Clinton is well above 50% against the others. Not only must the others win over every potential undecided voter; they must cut into the usual D vote in Pennsylvania, which is asking for the impossible -- barring a breaking scandal or a huge cultural change that favors just about any right-wing Republican. Against those, she wins with a margin ranging from those characteristic of Eisenhower in the 1950s to Reagan in 1984.
.........................
blue, Republican -- red, Democratic
30% -- lead with 40-49% but a margin of 3% or less
40% -- lead with 40-49% but a margin of 4% or more
60% -- lead with 50-54%
70% -- lead with 55-59%
90% -- lead with 60% or more
Hillary Clinton vs. Jeb Bush
(
Hillary Clinton vs. Chris Christie
(
Hillary Clinton vs. Rand Paul
(
Hillary Clinton vs. Paul Ryan
(
Title: Re: 2016 Official Polling Map Thread
Post by: pbrower2a on February 27, 2014, 07:25:48 AM
For reasons beyond my understanding, Quinnipiac polled PA on Hillary Clinton vs. Ted Cruz.
Clinton 54%
Cruz 34%
blue, Republican -- red, Democratic
30% -- lead with 40-49% but a margin of 3% or less
40% -- lead with 40-49% but a margin of 4% or more
60% -- lead with 50-54%
70% -- lead with 55-59%
90% -- lead with 60% or more
()
So maybe I can have a little fun. Unless a state offers a clear ceiling for someone short of 50% (think of polls that had Obama up 45-44 in the Dakotas and Montana in 2008), undecided votes generally go ineffectively toward the eventual loser, making things closer than the early margins in polls.
...If Ted Cruz picked up 80% of the gap between him and Hillary Clinton (which suggests a ceiling around 60% for any Democratic nominee for President in Pennsylvania), then Hillary Clinton would win Pennsylvania 58-42. I don't see Cruz losing Pennsylvania by a margin like 65-35 as by Goldwater in 1964. Like Mondale in 1984 or Stevenson in the 1950s?
Pennsylvania was Eisenhower's 36th best state in 1952 and 32nd-best state in 1956 -- and 46th-best state for Reagan in 1984. The closest binary election to a blowout by a Democratic nominee (Clinton in the 1990s is not binary due to Ross Perot) since 1964 for a Democrat was 2008, and then it was the 19th-best state for Obama, who won the state 54-44.
Cruz gets no advantage from any vote that would vote for a Democrat so long as the Democrat isn't black. Cruz loses nationwide about 56-44, and avoids getting 50 or fewer electoral votes because he wins Texas... barely.
If you think I take Ted Cruz as a political joke -- I don't. He is simply too awful a political figure to be so taken.
Clinton 54%
Cruz 34%
blue, Republican -- red, Democratic
30% -- lead with 40-49% but a margin of 3% or less
40% -- lead with 40-49% but a margin of 4% or more
60% -- lead with 50-54%
70% -- lead with 55-59%
90% -- lead with 60% or more
(
So maybe I can have a little fun. Unless a state offers a clear ceiling for someone short of 50% (think of polls that had Obama up 45-44 in the Dakotas and Montana in 2008), undecided votes generally go ineffectively toward the eventual loser, making things closer than the early margins in polls.
...If Ted Cruz picked up 80% of the gap between him and Hillary Clinton (which suggests a ceiling around 60% for any Democratic nominee for President in Pennsylvania), then Hillary Clinton would win Pennsylvania 58-42. I don't see Cruz losing Pennsylvania by a margin like 65-35 as by Goldwater in 1964. Like Mondale in 1984 or Stevenson in the 1950s?
Pennsylvania was Eisenhower's 36th best state in 1952 and 32nd-best state in 1956 -- and 46th-best state for Reagan in 1984. The closest binary election to a blowout by a Democratic nominee (Clinton in the 1990s is not binary due to Ross Perot) since 1964 for a Democrat was 2008, and then it was the 19th-best state for Obama, who won the state 54-44.
Cruz gets no advantage from any vote that would vote for a Democrat so long as the Democrat isn't black. Cruz loses nationwide about 56-44, and avoids getting 50 or fewer electoral votes because he wins Texas... barely.
If you think I take Ted Cruz as a political joke -- I don't. He is simply too awful a political figure to be so taken.
Title: Re: 2016 Official Polling Map Thread
Post by: eric82oslo on February 27, 2014, 08:13:02 AM
Qunnipiac has polled Pennsylvania voters for the 4th time and for the 6th time when we include PPP polls of the state as well. Christie was included in the state match-ups for the 4th time, yet not losing much ground compared to the 3 previous polls in the state. He was previously ever so slightly behind Hillary - in the latest poll he still trails her by only 5%. Meaning the average given us by these 4 polls is Christie trailing Hillary by 1.75% - not at all bad by a next state Governor who's been through the whirlwind of a hurricane lately. All other GOPers trail Hillary by double digits however, even using the averages of all 6 state polls conducted. 2nd strongest Republicans are Jeb Bush & Rand Paul, each trailing Hillary by 12.5%. Their "favourite" son Rick Santorum is 14.5% behind, same as for Paul Ryan. The respective numbers are -16.5% for both Marco Rubio & Ted Cruz.
Also, PPP has conducted its 3rd match-up poll in Iowa, making it the 7th 2016 poll of Iowa so far. It's the 6th Iowa poll where Christie has been tried against Hillary. As Christie, unlike in Pennsylvania, is the weakest GOP candidate tried against her this time (of the 4 tested), Hillary's lead against Christie is slightly expanded, from 0.4% to the current 1.3%. Mike Huckabee is the 2nd strongest GOP contender in the state, only trailing Hillary by 4%. Unlike in Pennsylvania, most GOP contenders, including Cruz, are fairly competitive though.
The total number of state polls added to the lists below has thus now reached 98.
So here they are - all the 2016 poll averages for each state so far - 26 states having been polled to date - and how far off they are compared to the actual 2012 outcomes. I'm only including the Republican candidate with the best statewide polling.
Alaska: Hillary vs Jeb Bush: R +7.5%
+6.5% D improvement
(Updated on February 5, 2014)
Arkansas: Hillary vs Chris Christie: D +2%
+22% D improvement
Current Democratic gain
(Updated on August 11)
Colorado: Hillary vs Christie: R +3.6%
+9% R improvement
Current Republican gain
(Updated on February 6, 2014)
Florida: Hillary vs Bush: D +7.3%
+6.4% D improvement
(Updated on January 31, 2014)
Georgia: Hillary vs Christie: R +2%
+6% D improvement
(Updated August 8 )
Iowa: Hillary vs Christie: D +1.3%
+4.5% R improvement
(Updated on February 27, 2014)
Kansas: Hillary vs Jeb Bush: R +9%
+13% D improvement
(Updated on February 24, 2014)
Kentucky: Hillary vs Christie/Bush: R +4%
+19% D improvement
(Updated on December 22)
Louisiana: Hillary vs Mike Huckabee: R +5%
+12% D improvement
(Updated on February 18, 2014)
Maine: Hillary vs Christie: D +8%
+7% R improvement
(Updated on November 13)
Michigan: Hillary vs Christie: D +3.75%
+5.75% R improvement
(Updated on February 14, 2014)
Minnesota: Hillary vs Christie: D +6%
+2% R improvement
(Updated on January 22, 2013)
Mississippi: Hillary vs Christie: R +9%
+2.5% D improvement
(Updated on November 19)
Montana: Hillary vs Rand Paul: R +13%
+1% D improvement
(Updated on November 24)
New Hampshire: Hillary vs Christie: D +3.7%
+1.9% R improvement
(Updated on January 30, 2014)
New Jersey: Hillary vs Christie: D +10.6%
+7.2% R improvement
(Updated on January 22, 2014)
New York: Hillary vs Christie: D +23.2%
+5% R improvement
(Updated on February 13, 2014)
North Carolina: Hillary vs Christie: R +1%
+1% D improvement
(Updated on February 12, 2014)
Ohio: Hillary vs Christie: D +5.75%
+2.8% D improvement
(Updated on February 20, 2014)
Pennsylvania: Hillary vs Christie: D +1.75%
+3.6% R improvement
(Updated on February 27, 2014)
South Carolina: Hillary vs Marco Rubio: R+7%
+3.5% D improvement
(Updated on November 2)
Texas: Hillary vs Jeb Bush: R +5%
+11% D improvement
(Updated on November 8 )
Virginia: Hillary vs Christie: D +2.5%
+1.4% R improvement
(Updated on November 26)
West Virginia: Hillary vs Jeb Bush: R +14%
+13% D improvement
(Updated on October 1)
Wisconsin: Hillary vs Jeb Bush: D +4%
+3% R improvement
(Updated on October 29)
Wyoming: Hillary vs Christie: R +28%
+13% D improvement
(Updated on July 23)
Average all 26 states: Hillary vs Best Republican: R +1.1%
+3.2% D improvement (from Obama 2012) [projecting a 7.0% victory for Hillary]
That gives us this map right now:
( )
)
Red = Democratic lead
Blue = Republican lead
Green = Exact tie
Grey = No polling yet
Green = toss up
20% shade = 0.1-1% lead
30% shade = 1.1-3% lead
40% shade = 3.1-6% lead
50% shade = 6.1-9% lead
60% shade = 9.1-12% lead
70% shade = 12.1-15% lead
80% shade = 15.1-18% lead
90% shade = Above 18.1% lead
In the count of electoral votes, this means the current situation looks like this:
Hillary: 195 EVs (for a total of 13 states)
Best/Tailormade Republican: 118 EVs (for a total of 13 states)
Toss-up: None
No polling: 225 EVs [almost half, including California] (for a total of 24 states + D.C.)
Which means that Hillary has captured a rather impressive 62.3% of all EVs awarded thus far, against a more or less disappointing 37.7% EVs for the tailormade Republican. And only New York, Maine and New Jersey of the solidly Democratic states have been polled so far, against no less than 12 solidly Republican states - the biggest one of them, Texas, included. With California added to Hillary's pie, it'll look even more promising for her. Neither to forget such states as D.C., Vermont, Hawaii & Maryland. It's looking like a landslide right now, even without Colorado and Pennsylvania being in Hillary's column.
This is how the Trendline Map looks so far:
()
The states which right now are showing the strongest improvement for the Democratic (Hillary) or the Republican candidate (in 17 out of 26 cases, Christie is that person):
1. Arkansas: D +22%
2. Kentucky: D +19%
3. Kansas: D +13%
4. West Virginia: D +13%
5. Wyoming: D +13%
6. Louisiana: D +12%
7. Texas: D +11%
8. Colorado: R +9%
9. New Jersey: R +7.2%
10. Maine: R +7%
11. Alaska: D +6.5%
12. Florida: D +6.4%
13. Georgia: D +6%
14. Michigan: R +5.75%
15. New York: R +5%
16. Iowa: R +4.5%
All of these changes (in the 16 states above) are (more than) statistically significant. We see that (so far) Texas is experiencing a much more rapid change than other demographically quick-changing states like Florida and Georgia. Unfortunately, the 4th quick-changing traditionally Republican state, Arizona, has still not been polled. Yet PPP will poll this state (finally) next week, so hopefully we'll get some fresh numbers then.
The whole list of states having been polled till now, going from Democratic stronghold to Republican stronghold:
New York: D +23.2%
New Jersey: D +10.6%
Maine: D +8%
Florida: D +7.3%
Currently estimated/projected national average: D +7.0%
Minnesota: D +6%
Ohio: D +5.75%
Wisconsin: D +4%
Michigan: D +3.75%
New Hampshire: D +3.7%
Virginia: D +2.5%
Arkansas: D +2%
Pennsylvania: D +1.75%
Iowa: D +1.3%
North Carolina: R +1%
Georgia: R +2%
Colorado: R +3.6%
Kentucky: R +4%
Louisiana: R +5%
Texas: R +5%
South Carolina: R +7%
Alaska: R +7.5%
Mississippi: R +9%
Kansas: R +9%
Montana: R +13%
West Virginia: R +14%
Wyoming: R +28%
6 states are currently way too close to call; Virginia, Arkansas, Pennsylvania & Iowa (all leaning towards Hillary), plus North Carolina and Georgia (all leaning Republican).
Here are the current stats on Republican candidates:
1. Chris Christie favoured in 17 of 26 states
2. Jeb Bush favoured in 7 states (Texas (!), Florida, Wisconsin (!!), Kentucky (!!), Kansas, West Virginia & Alaska)
3. Marco Rubio favoured in 1 state (South Carolina)
4. Mike Huckabee favoured in 1 state (Louisiana)
5. Rand Paul favoured in 1 state (Montana)
Current update as of February 27.
Also, PPP has conducted its 3rd match-up poll in Iowa, making it the 7th 2016 poll of Iowa so far. It's the 6th Iowa poll where Christie has been tried against Hillary. As Christie, unlike in Pennsylvania, is the weakest GOP candidate tried against her this time (of the 4 tested), Hillary's lead against Christie is slightly expanded, from 0.4% to the current 1.3%. Mike Huckabee is the 2nd strongest GOP contender in the state, only trailing Hillary by 4%. Unlike in Pennsylvania, most GOP contenders, including Cruz, are fairly competitive though.
The total number of state polls added to the lists below has thus now reached 98.
So here they are - all the 2016 poll averages for each state so far - 26 states having been polled to date - and how far off they are compared to the actual 2012 outcomes. I'm only including the Republican candidate with the best statewide polling.
Alaska: Hillary vs Jeb Bush: R +7.5%
+6.5% D improvement
(Updated on February 5, 2014)
Arkansas: Hillary vs Chris Christie: D +2%
+22% D improvement
Current Democratic gain
(Updated on August 11)
Colorado: Hillary vs Christie: R +3.6%
+9% R improvement
Current Republican gain
(Updated on February 6, 2014)
Florida: Hillary vs Bush: D +7.3%
+6.4% D improvement
(Updated on January 31, 2014)
Georgia: Hillary vs Christie: R +2%
+6% D improvement
(Updated August 8 )
Iowa: Hillary vs Christie: D +1.3%
+4.5% R improvement
(Updated on February 27, 2014)
Kansas: Hillary vs Jeb Bush: R +9%
+13% D improvement
(Updated on February 24, 2014)
Kentucky: Hillary vs Christie/Bush: R +4%
+19% D improvement
(Updated on December 22)
Louisiana: Hillary vs Mike Huckabee: R +5%
+12% D improvement
(Updated on February 18, 2014)
Maine: Hillary vs Christie: D +8%
+7% R improvement
(Updated on November 13)
Michigan: Hillary vs Christie: D +3.75%
+5.75% R improvement
(Updated on February 14, 2014)
Minnesota: Hillary vs Christie: D +6%
+2% R improvement
(Updated on January 22, 2013)
Mississippi: Hillary vs Christie: R +9%
+2.5% D improvement
(Updated on November 19)
Montana: Hillary vs Rand Paul: R +13%
+1% D improvement
(Updated on November 24)
New Hampshire: Hillary vs Christie: D +3.7%
+1.9% R improvement
(Updated on January 30, 2014)
New Jersey: Hillary vs Christie: D +10.6%
+7.2% R improvement
(Updated on January 22, 2014)
New York: Hillary vs Christie: D +23.2%
+5% R improvement
(Updated on February 13, 2014)
North Carolina: Hillary vs Christie: R +1%
+1% D improvement
(Updated on February 12, 2014)
Ohio: Hillary vs Christie: D +5.75%
+2.8% D improvement
(Updated on February 20, 2014)
Pennsylvania: Hillary vs Christie: D +1.75%
+3.6% R improvement
(Updated on February 27, 2014)
South Carolina: Hillary vs Marco Rubio: R+7%
+3.5% D improvement
(Updated on November 2)
Texas: Hillary vs Jeb Bush: R +5%
+11% D improvement
(Updated on November 8 )
Virginia: Hillary vs Christie: D +2.5%
+1.4% R improvement
(Updated on November 26)
West Virginia: Hillary vs Jeb Bush: R +14%
+13% D improvement
(Updated on October 1)
Wisconsin: Hillary vs Jeb Bush: D +4%
+3% R improvement
(Updated on October 29)
Wyoming: Hillary vs Christie: R +28%
+13% D improvement
(Updated on July 23)
Average all 26 states: Hillary vs Best Republican: R +1.1%
+3.2% D improvement (from Obama 2012) [projecting a 7.0% victory for Hillary]
That gives us this map right now:
(
Red = Democratic lead
Blue = Republican lead
Green = Exact tie
Grey = No polling yet
Green = toss up
20% shade = 0.1-1% lead
30% shade = 1.1-3% lead
40% shade = 3.1-6% lead
50% shade = 6.1-9% lead
60% shade = 9.1-12% lead
70% shade = 12.1-15% lead
80% shade = 15.1-18% lead
90% shade = Above 18.1% lead
In the count of electoral votes, this means the current situation looks like this:
Hillary: 195 EVs (for a total of 13 states)
Best/Tailormade Republican: 118 EVs (for a total of 13 states)
Toss-up: None
No polling: 225 EVs [almost half, including California] (for a total of 24 states + D.C.)
Which means that Hillary has captured a rather impressive 62.3% of all EVs awarded thus far, against a more or less disappointing 37.7% EVs for the tailormade Republican. And only New York, Maine and New Jersey of the solidly Democratic states have been polled so far, against no less than 12 solidly Republican states - the biggest one of them, Texas, included. With California added to Hillary's pie, it'll look even more promising for her. Neither to forget such states as D.C., Vermont, Hawaii & Maryland. It's looking like a landslide right now, even without Colorado and Pennsylvania being in Hillary's column.
This is how the Trendline Map looks so far:
(
The states which right now are showing the strongest improvement for the Democratic (Hillary) or the Republican candidate (in 17 out of 26 cases, Christie is that person):
1. Arkansas: D +22%
2. Kentucky: D +19%
3. Kansas: D +13%
4. West Virginia: D +13%
5. Wyoming: D +13%
6. Louisiana: D +12%
7. Texas: D +11%
8. Colorado: R +9%
9. New Jersey: R +7.2%
10. Maine: R +7%
11. Alaska: D +6.5%
12. Florida: D +6.4%
13. Georgia: D +6%
14. Michigan: R +5.75%
15. New York: R +5%
16. Iowa: R +4.5%
All of these changes (in the 16 states above) are (more than) statistically significant. We see that (so far) Texas is experiencing a much more rapid change than other demographically quick-changing states like Florida and Georgia. Unfortunately, the 4th quick-changing traditionally Republican state, Arizona, has still not been polled. Yet PPP will poll this state (finally) next week, so hopefully we'll get some fresh numbers then.
The whole list of states having been polled till now, going from Democratic stronghold to Republican stronghold:
New York: D +23.2%
New Jersey: D +10.6%
Maine: D +8%
Florida: D +7.3%
Currently estimated/projected national average: D +7.0%
Minnesota: D +6%
Ohio: D +5.75%
Wisconsin: D +4%
Michigan: D +3.75%
New Hampshire: D +3.7%
Virginia: D +2.5%
Arkansas: D +2%
Pennsylvania: D +1.75%
Iowa: D +1.3%
North Carolina: R +1%
Georgia: R +2%
Colorado: R +3.6%
Kentucky: R +4%
Louisiana: R +5%
Texas: R +5%
South Carolina: R +7%
Alaska: R +7.5%
Mississippi: R +9%
Kansas: R +9%
Montana: R +13%
West Virginia: R +14%
Wyoming: R +28%
6 states are currently way too close to call; Virginia, Arkansas, Pennsylvania & Iowa (all leaning towards Hillary), plus North Carolina and Georgia (all leaning Republican).
Here are the current stats on Republican candidates:
1. Chris Christie favoured in 17 of 26 states
2. Jeb Bush favoured in 7 states (Texas (!), Florida, Wisconsin (!!), Kentucky (!!), Kansas, West Virginia & Alaska)
3. Marco Rubio favoured in 1 state (South Carolina)
4. Mike Huckabee favoured in 1 state (Louisiana)
5. Rand Paul favoured in 1 state (Montana)
Current update as of February 27.
Title: Re: 2016 Official Polling Map Thread
Post by: pbrower2a on February 27, 2014, 08:20:07 AM
Pennsylvania probably is in Hillary's column. The Q poll supplants an earlier Q poll and follows the bridge scandal. Hillary is still down compared to Obama in 2012 in Pennsylvania, but by much less.
Title: Re: 2016 Official Polling Map Thread
Post by: pbrower2a on February 27, 2014, 12:10:08 PM
Iowa, PPP:
Hillary Clinton.................................................. 46%
Mike Huckabee ............................................... 42%
Hillary Clinton.................................................. 45%
Jeb Bush......................................................... 41%
Hillary Clinton.................................................. 47%
Rand Paul ....................................................... 42%
Hillary Clinton.................................................. 45%
Chris Christie .................................................. 39%
Q5 In the last presidential election, did you vote for Barack Obama or Mitt Romney?
Barack Obama................................................ 49%
Mitt Romney.................................................... 43%
http://www.publicpolicypolling.com/pdf/2014/PPP_Release_IA_227.pdf
Not slipping away from the Democrats this time. Nothing on Ted Cruz (as if I care).
.........................
blue, Republican -- red, Democratic
30% -- lead with 40-49% but a margin of 3% or less
40% -- lead with 40-49% but a margin of 4% or more
60% -- lead with 50-54%
70% -- lead with 55-59%
90% -- lead with 60% or more
Hillary Clinton vs. Jeb Bush
( )
)
Hillary Clinton vs. Chris Christie
(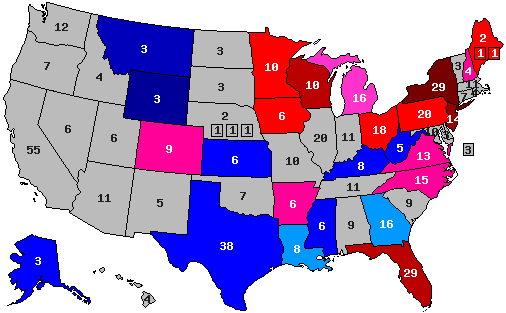 )
)
Hillary Clinton vs. Rand Paul
()
Hillary Clinton vs. Paul Ryan
()
Hillary Clinton.................................................. 46%
Mike Huckabee ............................................... 42%
Hillary Clinton.................................................. 45%
Jeb Bush......................................................... 41%
Hillary Clinton.................................................. 47%
Rand Paul ....................................................... 42%
Hillary Clinton.................................................. 45%
Chris Christie .................................................. 39%
Q5 In the last presidential election, did you vote for Barack Obama or Mitt Romney?
Barack Obama................................................ 49%
Mitt Romney.................................................... 43%
http://www.publicpolicypolling.com/pdf/2014/PPP_Release_IA_227.pdf
Not slipping away from the Democrats this time. Nothing on Ted Cruz (as if I care).
.........................
blue, Republican -- red, Democratic
30% -- lead with 40-49% but a margin of 3% or less
40% -- lead with 40-49% but a margin of 4% or more
60% -- lead with 50-54%
70% -- lead with 55-59%
90% -- lead with 60% or more
Hillary Clinton vs. Jeb Bush
(
Hillary Clinton vs. Chris Christie
(
Hillary Clinton vs. Rand Paul
(
Hillary Clinton vs. Paul Ryan
(
Title: Re: 2016 Official Polling Map Thread
Post by: eric82oslo on March 03, 2014, 09:40:12 AM
Christopher Newport University has polled Virginia voters for 2016 match-ups for the first time. Of all pollsters who've polled the state - going as far back as to April 2012 to find the first one - this is the 11th Virginia poll we're including and the 10th one to include Hillary in match-ups as well (the very first one only included Mark Warner). In fact, in the 3 polls where both Hillary and home state Governor turned Senator Warner have both been tested, Mark has fairly easily out-polled Hillary in all three. However, Warner seriously struggles against Christie in the state, just like Hillary does. And the only match-up done between Warner and Christie showed Mark only 1% ahead, which is less than the average Hillary lead her match-ups with the same guy, Christie. With this latest poll, Hillary's lead over Christie has in fact shrunk by a nano size, from 2.5% to 2.4%. In other words, Bridgegate seems not to have influenced the race much at all in this crucial battleground. All the other GOP candidates are trailing Hillary with about 10% or more.
The total number of state polls added to the lists below has thus now reached 99.
So here they are - all the 2016 poll averages for each state so far - 26 states having been polled to date - and how far off they are compared to the actual 2012 outcomes. I'm only including the Republican candidate with the best statewide polling.
Alaska: Hillary vs Jeb Bush: R +7.5%
+6.5% D improvement
(Updated on February 5, 2014)
Arkansas: Hillary vs Chris Christie: D +2%
+22% D improvement
Current Democratic gain
(Updated on August 11)
Colorado: Hillary vs Christie: R +3.6%
+9% R improvement
Current Republican gain
(Updated on February 6, 2014)
Florida: Hillary vs Bush: D +7.3%
+6.4% D improvement
(Updated on January 31, 2014)
Georgia: Hillary vs Christie: R +2%
+6% D improvement
(Updated August 8 )
Iowa: Hillary vs Christie: D +1.3%
+4.5% R improvement
(Updated on February 27, 2014)
Kansas: Hillary vs Jeb Bush: R +9%
+13% D improvement
(Updated on February 24, 2014)
Kentucky: Hillary vs Christie/Bush: R +4%
+19% D improvement
(Updated on December 22)
Louisiana: Hillary vs Mike Huckabee: R +5%
+12% D improvement
(Updated on February 18, 2014)
Maine: Hillary vs Christie: D +8%
+7% R improvement
(Updated on November 13)
Michigan: Hillary vs Christie: D +3.75%
+5.75% R improvement
(Updated on February 14, 2014)
Minnesota: Hillary vs Christie: D +6%
+2% R improvement
(Updated on January 22, 2013)
Mississippi: Hillary vs Christie: R +9%
+2.5% D improvement
(Updated on November 19)
Montana: Hillary vs Rand Paul: R +13%
+1% D improvement
(Updated on November 24)
New Hampshire: Hillary vs Christie: D +3.7%
+1.9% R improvement
(Updated on January 30, 2014)
New Jersey: Hillary vs Christie: D +10.6%
+7.2% R improvement
(Updated on January 22, 2014)
New York: Hillary vs Christie: D +23.2%
+5% R improvement
(Updated on February 13, 2014)
North Carolina: Hillary vs Christie: R +1%
+1% D improvement
(Updated on February 12, 2014)
Ohio: Hillary vs Christie: D +5.75%
+2.8% D improvement
(Updated on February 20, 2014)
Pennsylvania: Hillary vs Christie: D +1.75%
+3.6% R improvement
(Updated on February 27, 2014)
South Carolina: Hillary vs Marco Rubio: R+7%
+3.5% D improvement
(Updated on November 2)
Texas: Hillary vs Jeb Bush: R +5%
+11% D improvement
(Updated on November 8 )
Virginia: Hillary vs Christie: D +2.4%
+1.5% R improvement
(Updated on March 3, 2013)
West Virginia: Hillary vs Jeb Bush: R +14%
+13% D improvement
(Updated on October 1)
Wisconsin: Hillary vs Jeb Bush: D +4%
+3% R improvement
(Updated on October 29)
Wyoming: Hillary vs Christie: R +28%
+13% D improvement
(Updated on July 23)
Average all 26 states: Hillary vs Best Republican: R +1.1%
+3.2% D improvement (from Obama 2012) [projecting a 7.0% victory for Hillary]
That gives us this map right now:
()
Red = Democratic lead
Blue = Republican lead
Green = Exact tie
Grey = No polling yet
Green = toss up
20% shade = 0.1-1% lead
30% shade = 1.1-3% lead
40% shade = 3.1-6% lead
50% shade = 6.1-9% lead
60% shade = 9.1-12% lead
70% shade = 12.1-15% lead
80% shade = 15.1-18% lead
90% shade = Above 18.1% lead
In the count of electoral votes, this means the current situation looks like this:
Hillary: 195 EVs (for a total of 13 states)
Best/Tailormade Republican: 118 EVs (for a total of 13 states)
Toss-up: None
No polling: 225 EVs [almost half, including California] (for a total of 24 states + D.C.)
Which means that Hillary has captured a rather impressive 62.3% of all EVs awarded thus far, against a more or less disappointing 37.7% EVs for the tailormade Republican. And only New York, Maine and New Jersey of the solidly Democratic states have been polled so far, against no less than 12 solidly Republican states - the biggest one of them, Texas, included. With California added to Hillary's pie, it'll look even more promising for her. Neither to forget such states as D.C., Vermont, Hawaii & Maryland. It's looking like a landslide right now, even without Colorado and Pennsylvania being in Hillary's column.
This is how the Trendline Map looks so far:
()
The states which right now are showing the strongest improvement for the Democratic (Hillary) or the Republican candidate (in 17 out of 26 cases, Christie is that person):
1. Arkansas: D +22%
2. Kentucky: D +19%
3. Kansas: D +13%
4. West Virginia: D +13%
5. Wyoming: D +13%
6. Louisiana: D +12%
7. Texas: D +11%
8. Colorado: R +9%
9. New Jersey: R +7.2%
10. Maine: R +7%
11. Alaska: D +6.5%
12. Florida: D +6.4%
13. Georgia: D +6%
14. Michigan: R +5.75%
15. New York: R +5%
16. Iowa: R +4.5%
All of these changes (in the 16 states above) are (more than) statistically significant. We see that (so far) Texas is experiencing a much more rapid change than other demographically quick-changing states like Florida and Georgia. Unfortunately, the 4th quick-changing traditionally Republican state, Arizona, has still not been polled. Yet PPP will poll this state (finally) next week, so hopefully we'll get some fresh numbers then.
The whole list of states having been polled till now, going from Democratic stronghold to Republican stronghold:
New York: D +23.2%
New Jersey: D +10.6%
Maine: D +8%
Florida: D +7.3%
Currently estimated/projected national average: D +7.0%
Minnesota: D +6%
Ohio: D +5.75%
Wisconsin: D +4%
Michigan: D +3.75%
New Hampshire: D +3.7%
Virginia: D +2.4%
Arkansas: D +2%
Pennsylvania: D +1.75%
Iowa: D +1.3%
North Carolina: R +1%
Georgia: R +2%
Colorado: R +3.6%
Kentucky: R +4%
Louisiana: R +5%
Texas: R +5%
South Carolina: R +7%
Alaska: R +7.5%
Mississippi: R +9%
Kansas: R +9%
Montana: R +13%
West Virginia: R +14%
Wyoming: R +28%
6 states are currently way too close to call; Virginia, Arkansas, Pennsylvania & Iowa (all leaning towards Hillary), plus North Carolina and Georgia (all leaning Republican).
Here are the current stats on Republican candidates:
1. Chris Christie favoured in 17 of 26 states
2. Jeb Bush favoured in 7 states (Texas (!), Florida, Wisconsin (!!), Kentucky (!!), Kansas, West Virginia & Alaska)
3. Marco Rubio favoured in 1 state (South Carolina)
4. Mike Huckabee favoured in 1 state (Louisiana)
5. Rand Paul favoured in 1 state (Montana)
Current update as of March 3.
The total number of state polls added to the lists below has thus now reached 99.
So here they are - all the 2016 poll averages for each state so far - 26 states having been polled to date - and how far off they are compared to the actual 2012 outcomes. I'm only including the Republican candidate with the best statewide polling.
Alaska: Hillary vs Jeb Bush: R +7.5%
+6.5% D improvement
(Updated on February 5, 2014)
Arkansas: Hillary vs Chris Christie: D +2%
+22% D improvement
Current Democratic gain
(Updated on August 11)
Colorado: Hillary vs Christie: R +3.6%
+9% R improvement
Current Republican gain
(Updated on February 6, 2014)
Florida: Hillary vs Bush: D +7.3%
+6.4% D improvement
(Updated on January 31, 2014)
Georgia: Hillary vs Christie: R +2%
+6% D improvement
(Updated August 8 )
Iowa: Hillary vs Christie: D +1.3%
+4.5% R improvement
(Updated on February 27, 2014)
Kansas: Hillary vs Jeb Bush: R +9%
+13% D improvement
(Updated on February 24, 2014)
Kentucky: Hillary vs Christie/Bush: R +4%
+19% D improvement
(Updated on December 22)
Louisiana: Hillary vs Mike Huckabee: R +5%
+12% D improvement
(Updated on February 18, 2014)
Maine: Hillary vs Christie: D +8%
+7% R improvement
(Updated on November 13)
Michigan: Hillary vs Christie: D +3.75%
+5.75% R improvement
(Updated on February 14, 2014)
Minnesota: Hillary vs Christie: D +6%
+2% R improvement
(Updated on January 22, 2013)
Mississippi: Hillary vs Christie: R +9%
+2.5% D improvement
(Updated on November 19)
Montana: Hillary vs Rand Paul: R +13%
+1% D improvement
(Updated on November 24)
New Hampshire: Hillary vs Christie: D +3.7%
+1.9% R improvement
(Updated on January 30, 2014)
New Jersey: Hillary vs Christie: D +10.6%
+7.2% R improvement
(Updated on January 22, 2014)
New York: Hillary vs Christie: D +23.2%
+5% R improvement
(Updated on February 13, 2014)
North Carolina: Hillary vs Christie: R +1%
+1% D improvement
(Updated on February 12, 2014)
Ohio: Hillary vs Christie: D +5.75%
+2.8% D improvement
(Updated on February 20, 2014)
Pennsylvania: Hillary vs Christie: D +1.75%
+3.6% R improvement
(Updated on February 27, 2014)
South Carolina: Hillary vs Marco Rubio: R+7%
+3.5% D improvement
(Updated on November 2)
Texas: Hillary vs Jeb Bush: R +5%
+11% D improvement
(Updated on November 8 )
Virginia: Hillary vs Christie: D +2.4%
+1.5% R improvement
(Updated on March 3, 2013)
West Virginia: Hillary vs Jeb Bush: R +14%
+13% D improvement
(Updated on October 1)
Wisconsin: Hillary vs Jeb Bush: D +4%
+3% R improvement
(Updated on October 29)
Wyoming: Hillary vs Christie: R +28%
+13% D improvement
(Updated on July 23)
Average all 26 states: Hillary vs Best Republican: R +1.1%
+3.2% D improvement (from Obama 2012) [projecting a 7.0% victory for Hillary]
That gives us this map right now:
(
Red = Democratic lead
Blue = Republican lead
Green = Exact tie
Grey = No polling yet
Green = toss up
20% shade = 0.1-1% lead
30% shade = 1.1-3% lead
40% shade = 3.1-6% lead
50% shade = 6.1-9% lead
60% shade = 9.1-12% lead
70% shade = 12.1-15% lead
80% shade = 15.1-18% lead
90% shade = Above 18.1% lead
In the count of electoral votes, this means the current situation looks like this:
Hillary: 195 EVs (for a total of 13 states)
Best/Tailormade Republican: 118 EVs (for a total of 13 states)
Toss-up: None
No polling: 225 EVs [almost half, including California] (for a total of 24 states + D.C.)
Which means that Hillary has captured a rather impressive 62.3% of all EVs awarded thus far, against a more or less disappointing 37.7% EVs for the tailormade Republican. And only New York, Maine and New Jersey of the solidly Democratic states have been polled so far, against no less than 12 solidly Republican states - the biggest one of them, Texas, included. With California added to Hillary's pie, it'll look even more promising for her. Neither to forget such states as D.C., Vermont, Hawaii & Maryland. It's looking like a landslide right now, even without Colorado and Pennsylvania being in Hillary's column.
This is how the Trendline Map looks so far:
(
The states which right now are showing the strongest improvement for the Democratic (Hillary) or the Republican candidate (in 17 out of 26 cases, Christie is that person):
1. Arkansas: D +22%
2. Kentucky: D +19%
3. Kansas: D +13%
4. West Virginia: D +13%
5. Wyoming: D +13%
6. Louisiana: D +12%
7. Texas: D +11%
8. Colorado: R +9%
9. New Jersey: R +7.2%
10. Maine: R +7%
11. Alaska: D +6.5%
12. Florida: D +6.4%
13. Georgia: D +6%
14. Michigan: R +5.75%
15. New York: R +5%
16. Iowa: R +4.5%
All of these changes (in the 16 states above) are (more than) statistically significant. We see that (so far) Texas is experiencing a much more rapid change than other demographically quick-changing states like Florida and Georgia. Unfortunately, the 4th quick-changing traditionally Republican state, Arizona, has still not been polled. Yet PPP will poll this state (finally) next week, so hopefully we'll get some fresh numbers then.
The whole list of states having been polled till now, going from Democratic stronghold to Republican stronghold:
New York: D +23.2%
New Jersey: D +10.6%
Maine: D +8%
Florida: D +7.3%
Currently estimated/projected national average: D +7.0%
Minnesota: D +6%
Ohio: D +5.75%
Wisconsin: D +4%
Michigan: D +3.75%
New Hampshire: D +3.7%
Virginia: D +2.4%
Arkansas: D +2%
Pennsylvania: D +1.75%
Iowa: D +1.3%
North Carolina: R +1%
Georgia: R +2%
Colorado: R +3.6%
Kentucky: R +4%
Louisiana: R +5%
Texas: R +5%
South Carolina: R +7%
Alaska: R +7.5%
Mississippi: R +9%
Kansas: R +9%
Montana: R +13%
West Virginia: R +14%
Wyoming: R +28%
6 states are currently way too close to call; Virginia, Arkansas, Pennsylvania & Iowa (all leaning towards Hillary), plus North Carolina and Georgia (all leaning Republican).
Here are the current stats on Republican candidates:
1. Chris Christie favoured in 17 of 26 states
2. Jeb Bush favoured in 7 states (Texas (!), Florida, Wisconsin (!!), Kentucky (!!), Kansas, West Virginia & Alaska)
3. Marco Rubio favoured in 1 state (South Carolina)
4. Mike Huckabee favoured in 1 state (Louisiana)
5. Rand Paul favoured in 1 state (Montana)
Current update as of March 3.
Title: Re: 2016 Official Polling Map Thread
Post by: pbrower2a on March 03, 2014, 04:16:40 PM
Virginia, Christopher Newport University (with which I am unfamiliar)
Clinton 43%
Christie 41%
Clinton 52%
Huckabee 37%
Clinton 52%
Ryan 37%
Clinton 47%
Cruz 37%
Clinton 51%
Bush 38%
Clinton 47%
Paul 40%
Clinton 48%
Rubio 40%
Clinton 46%
Walker 35%
.........................
Neither Huckabee not Walker is popular in Virginia. Because Virginia is very close to the national average in voting for President, Republicans are in extreme trouble if they nominate anyone other than Chris Christie, and in a poor position if they nominate Christie.
I've been curious about Walker because he would be a hero of the Right for his 'heroic' stances against Big Labor and Big Government.
blue, Republican -- red, Democratic
30% -- lead with 40-49% but a margin of 3% or less
40% -- lead with 40-49% but a margin of 4% or more
60% -- lead with 50-54%
70% -- lead with 55-59%
90% -- lead with 60% or more
Hillary Clinton vs. Jeb Bush
(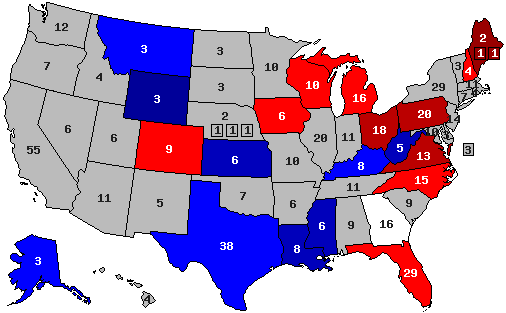 )
)
Hillary Clinton vs. Chris Christie
()
Hillary Clinton vs. Rand Paul
()
Hillary Clinton vs. Paul Ryan
(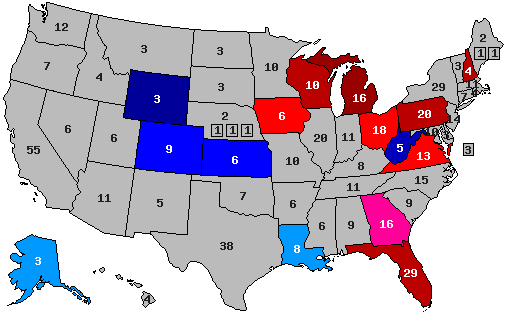 )
)
Clinton 43%
Christie 41%
Clinton 52%
Huckabee 37%
Clinton 52%
Ryan 37%
Clinton 47%
Cruz 37%
Clinton 51%
Bush 38%
Clinton 47%
Paul 40%
Clinton 48%
Rubio 40%
Clinton 46%
Walker 35%
.........................
Neither Huckabee not Walker is popular in Virginia. Because Virginia is very close to the national average in voting for President, Republicans are in extreme trouble if they nominate anyone other than Chris Christie, and in a poor position if they nominate Christie.
I've been curious about Walker because he would be a hero of the Right for his 'heroic' stances against Big Labor and Big Government.
blue, Republican -- red, Democratic
30% -- lead with 40-49% but a margin of 3% or less
40% -- lead with 40-49% but a margin of 4% or more
60% -- lead with 50-54%
70% -- lead with 55-59%
90% -- lead with 60% or more
Hillary Clinton vs. Jeb Bush
(
Hillary Clinton vs. Chris Christie
(
Hillary Clinton vs. Rand Paul
(
Hillary Clinton vs. Paul Ryan
(
Title: Re: 2016 Official Polling Map Thread
Post by: pbrower2a on March 04, 2014, 08:34:54 AM
Three university polls.
Rutgers, NJ; Siena, NY; Roanoke, VA
http://www.siena.edu/uploadedfiles/home/parents_and_community/community_page/sri/independent_research/Issues0214%20Crosstabs%20State%20Comparison.pdf
New Jersey
Clinton 51%
Christie 41%
Clinton 58%
Paul 29%
Clinton 58%
Ryan 33%
New York
Clinton 64%
Christie 28%
Clinton 67%
Paul 24%
Clinton 64%
Ryan 27%
Virginia
Clinton 48%
Christie 40%
Clinton 52%
Paul 38%
Clinton 51%
Ryan 40%
(In practice I average polls within a week).
............................
PPP will soon have polls for Arizona.
blue, Republican -- red, Democratic
30% -- lead with 40-49% but a margin of 3% or less
40% -- lead with 40-49% but a margin of 4% or more
60% -- lead with 50-54%
70% -- lead with 55-59%
90% -- lead with 60% or more
Hillary Clinton vs. Jeb Bush
()
Hillary Clinton vs. Chris Christie
(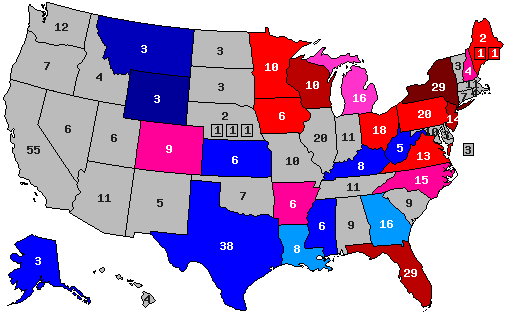 )
)
Hillary Clinton vs. Rand Paul
(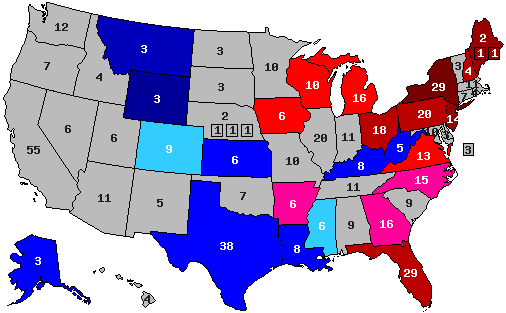 )
)
Hillary Clinton vs. Paul Ryan
(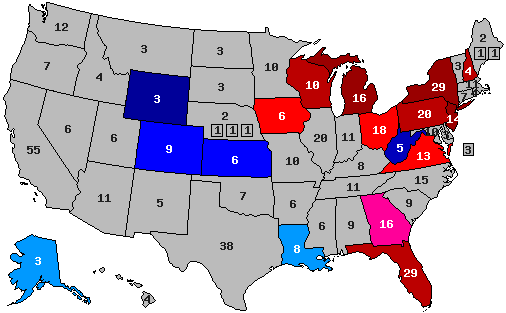 )
)
Rutgers, NJ; Siena, NY; Roanoke, VA
http://www.siena.edu/uploadedfiles/home/parents_and_community/community_page/sri/independent_research/Issues0214%20Crosstabs%20State%20Comparison.pdf
New Jersey
Clinton 51%
Christie 41%
Clinton 58%
Paul 29%
Clinton 58%
Ryan 33%
New York
Clinton 64%
Christie 28%
Clinton 67%
Paul 24%
Clinton 64%
Ryan 27%
Virginia
Clinton 48%
Christie 40%
Clinton 52%
Paul 38%
Clinton 51%
Ryan 40%
(In practice I average polls within a week).
............................
PPP will soon have polls for Arizona.
blue, Republican -- red, Democratic
30% -- lead with 40-49% but a margin of 3% or less
40% -- lead with 40-49% but a margin of 4% or more
60% -- lead with 50-54%
70% -- lead with 55-59%
90% -- lead with 60% or more
Hillary Clinton vs. Jeb Bush
(
Hillary Clinton vs. Chris Christie
(
Hillary Clinton vs. Rand Paul
(
Hillary Clinton vs. Paul Ryan
(
Title: Re: 2016 Official Polling Map Thread
Post by: eric82oslo on March 04, 2014, 08:50:42 AM
Thanks to one and the same polling institute, Siena, we have 3 new state polls out today, covering Virginia (for the 12th time), New Jersey (for the 6th time, I'm not including the Governor race exit poll anymore [simply lost the numbers]) and New York (for the 6th time). As a matter of fact, Christie remains the strongest GOP contender in all 3 states by a substantial margin, yet trails Hillary even more than before in New York and Virginia - down from -25% to -28% in New York. New Jersey however remains unchanged. Hillary's projected national popular vote win stands now at +7.2%, basically the same win as she's currently projected to obtain in the crucial battleground of Florida as well.
The total number of state polls added to the lists below has thus now reached 101.
So here they are - all the 2016 poll averages for each state so far - 26 states having been polled to date - and how far off they are compared to the actual 2012 outcomes. I'm only including the Republican candidate with the best statewide polling.
Alaska: Hillary vs Jeb Bush: R +7.5%
+6.5% D improvement
(Updated on February 5, 2014)
Arkansas: Hillary vs Chris Christie: D +2%
+22% D improvement
Current Democratic gain
(Updated on August 11)
Colorado: Hillary vs Christie: R +3.6%
+9% R improvement
Current Republican gain
(Updated on February 6, 2014)
Florida: Hillary vs Bush: D +7.3%
+6.4% D improvement
(Updated on January 31, 2014)
Georgia: Hillary vs Christie: R +2%
+6% D improvement
(Updated August 8 )
Iowa: Hillary vs Christie: D +1.3%
+4.5% R improvement
(Updated on February 27, 2014)
Kansas: Hillary vs Jeb Bush: R +9%
+13% D improvement
(Updated on February 24, 2014)
Kentucky: Hillary vs Christie/Bush: R +4%
+19% D improvement
(Updated on December 22)
Louisiana: Hillary vs Mike Huckabee: R +5%
+12% D improvement
(Updated on February 18, 2014)
Maine: Hillary vs Christie: D +8%
+7% R improvement
(Updated on November 13)
Michigan: Hillary vs Christie: D +3.75%
+5.75% R improvement
(Updated on February 14, 2014)
Minnesota: Hillary vs Christie: D +6%
+2% R improvement
(Updated on January 22, 2013)
Mississippi: Hillary vs Christie: R +9%
+2.5% D improvement
(Updated on November 19)
Montana: Hillary vs Rand Paul: R +13%
+1% D improvement
(Updated on November 24)
New Hampshire: Hillary vs Christie: D +3.7%
+1.9% R improvement
(Updated on January 30, 2014)
New Jersey: Hillary vs Christie: D +10.5%
+7.3% R improvement
(Updated on March 4, 2014)
New York: Hillary vs Christie: D +28%
+0.2% R improvement
(Updated on March 4, 2014)
North Carolina: Hillary vs Christie: R +1%
+1% D improvement
(Updated on February 12, 2014)
Ohio: Hillary vs Christie: D +5.75%
+2.8% D improvement
(Updated on February 20, 2014)
Pennsylvania: Hillary vs Christie: D +1.75%
+3.6% R improvement
(Updated on February 27, 2014)
South Carolina: Hillary vs Marco Rubio: R+7%
+3.5% D improvement
(Updated on November 2)
Texas: Hillary vs Jeb Bush: R +5%
+11% D improvement
(Updated on November 8 )
Virginia: Hillary vs Christie: D +3.1%
+0.8% R improvement
(Updated on March 4, 2013)
West Virginia: Hillary vs Jeb Bush: R +14%
+13% D improvement
(Updated on October 1)
Wisconsin: Hillary vs Jeb Bush: D +4%
+3% R improvement
(Updated on October 29)
Wyoming: Hillary vs Christie: R +28%
+13% D improvement
(Updated on July 23)
Average all 26 states: Hillary vs Best Republican: R +0.9%
+3.4% D improvement (from Obama 2012) [projecting a 7.2% victory for Hillary]
That gives us this map right now:
(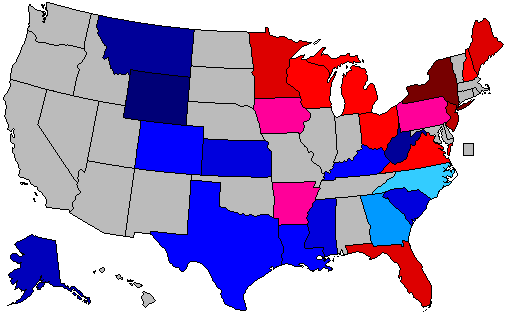 )
)
Red = Democratic lead
Blue = Republican lead
Green = Exact tie
Grey = No polling yet
Green = toss up
20% shade = 0.1-1% lead
30% shade = 1.1-3% lead
40% shade = 3.1-6% lead
50% shade = 6.1-9% lead
60% shade = 9.1-12% lead
70% shade = 12.1-15% lead
80% shade = 15.1-18% lead
90% shade = Above 18.1% lead
In the count of electoral votes, this means the current situation looks like this:
Hillary: 195 EVs (for a total of 13 states)
Best/Tailormade Republican: 118 EVs (for a total of 13 states)
Toss-up: None
No polling: 225 EVs [almost half, including California] (for a total of 24 states + D.C.)
Which means that Hillary has captured a rather impressive 62.3% of all EVs awarded thus far, against a more or less disappointing 37.7% EVs for the tailormade Republican. And only New York, Maine and New Jersey of the solidly Democratic states have been polled so far, against no less than 12 solidly Republican states - the biggest one of them, Texas, included. With California added to Hillary's pie, it'll look even more promising for her. Neither to forget such states as D.C., Vermont, Hawaii & Maryland. It's looking like a landslide right now, even without Colorado and Pennsylvania being in Hillary's column.
This is how the Trendline Map looks so far:
(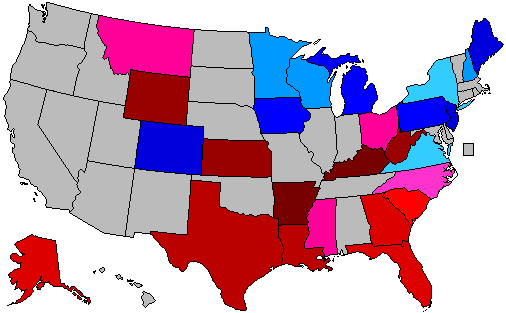 )
)
The states which right now are showing the strongest improvement for the Democratic (Hillary) or the Republican candidate (in 17 out of 26 cases, Christie is that person):
1. Arkansas: D +22%
2. Kentucky: D +19%
3. Kansas: D +13%
4. West Virginia: D +13%
5. Wyoming: D +13%
6. Louisiana: D +12%
7. Texas: D +11%
8. Colorado: R +9%
9. New Jersey: R +7.3%
10. Maine: R +7%
11. Alaska: D +6.5%
12. Florida: D +6.4%
13. Georgia: D +6%
14. Michigan: R +5.75%
15. Iowa: R +4.5%
All of these changes (in the 15 states above) are (more than) statistically significant. We see that (so far) Texas is experiencing a much more rapid change than other demographically quick-changing states like Florida and Georgia. Unfortunately, the 4th quick-changing traditionally Republican state, Arizona, has still not been polled. Yet PPP will poll this state (finally) next week, so hopefully we'll get some fresh numbers then.
The whole list of states having been polled till now, going from Democratic stronghold to Republican stronghold:
New York: D +28%
New Jersey: D +10.5%
Maine: D +8%
Florida: D +7.3%
Currently estimated/projected national average: D +7.2%
Minnesota: D +6%
Ohio: D +5.75%
Wisconsin: D +4%
Michigan: D +3.75%
New Hampshire: D +3.7%
Virginia: D +3.1%
Arkansas: D +2%
Pennsylvania: D +1.75%
Iowa: D +1.3%
North Carolina: R +1%
Georgia: R +2%
Colorado: R +3.6%
Kentucky: R +4%
Louisiana: R +5%
Texas: R +5%
South Carolina: R +7%
Alaska: R +7.5%
Mississippi: R +9%
Kansas: R +9%
Montana: R +13%
West Virginia: R +14%
Wyoming: R +28%
6 states are currently way too close to call; Virginia, Arkansas, Pennsylvania & Iowa (all leaning towards Hillary), plus North Carolina and Georgia (all leaning Republican).
Here are the current stats on Republican candidates:
1. Chris Christie favoured in 17 of 26 states
2. Jeb Bush favoured in 7 states (Texas (!), Florida, Wisconsin (!!), Kentucky (!!), Kansas, West Virginia & Alaska)
3. Marco Rubio favoured in 1 state (South Carolina)
4. Mike Huckabee favoured in 1 state (Louisiana)
5. Rand Paul favoured in 1 state (Montana)
Current update as of March 4.
The total number of state polls added to the lists below has thus now reached 101.
So here they are - all the 2016 poll averages for each state so far - 26 states having been polled to date - and how far off they are compared to the actual 2012 outcomes. I'm only including the Republican candidate with the best statewide polling.
Alaska: Hillary vs Jeb Bush: R +7.5%
+6.5% D improvement
(Updated on February 5, 2014)
Arkansas: Hillary vs Chris Christie: D +2%
+22% D improvement
Current Democratic gain
(Updated on August 11)
Colorado: Hillary vs Christie: R +3.6%
+9% R improvement
Current Republican gain
(Updated on February 6, 2014)
Florida: Hillary vs Bush: D +7.3%
+6.4% D improvement
(Updated on January 31, 2014)
Georgia: Hillary vs Christie: R +2%
+6% D improvement
(Updated August 8 )
Iowa: Hillary vs Christie: D +1.3%
+4.5% R improvement
(Updated on February 27, 2014)
Kansas: Hillary vs Jeb Bush: R +9%
+13% D improvement
(Updated on February 24, 2014)
Kentucky: Hillary vs Christie/Bush: R +4%
+19% D improvement
(Updated on December 22)
Louisiana: Hillary vs Mike Huckabee: R +5%
+12% D improvement
(Updated on February 18, 2014)
Maine: Hillary vs Christie: D +8%
+7% R improvement
(Updated on November 13)
Michigan: Hillary vs Christie: D +3.75%
+5.75% R improvement
(Updated on February 14, 2014)
Minnesota: Hillary vs Christie: D +6%
+2% R improvement
(Updated on January 22, 2013)
Mississippi: Hillary vs Christie: R +9%
+2.5% D improvement
(Updated on November 19)
Montana: Hillary vs Rand Paul: R +13%
+1% D improvement
(Updated on November 24)
New Hampshire: Hillary vs Christie: D +3.7%
+1.9% R improvement
(Updated on January 30, 2014)
New Jersey: Hillary vs Christie: D +10.5%
+7.3% R improvement
(Updated on March 4, 2014)
New York: Hillary vs Christie: D +28%
+0.2% R improvement
(Updated on March 4, 2014)
North Carolina: Hillary vs Christie: R +1%
+1% D improvement
(Updated on February 12, 2014)
Ohio: Hillary vs Christie: D +5.75%
+2.8% D improvement
(Updated on February 20, 2014)
Pennsylvania: Hillary vs Christie: D +1.75%
+3.6% R improvement
(Updated on February 27, 2014)
South Carolina: Hillary vs Marco Rubio: R+7%
+3.5% D improvement
(Updated on November 2)
Texas: Hillary vs Jeb Bush: R +5%
+11% D improvement
(Updated on November 8 )
Virginia: Hillary vs Christie: D +3.1%
+0.8% R improvement
(Updated on March 4, 2013)
West Virginia: Hillary vs Jeb Bush: R +14%
+13% D improvement
(Updated on October 1)
Wisconsin: Hillary vs Jeb Bush: D +4%
+3% R improvement
(Updated on October 29)
Wyoming: Hillary vs Christie: R +28%
+13% D improvement
(Updated on July 23)
Average all 26 states: Hillary vs Best Republican: R +0.9%
+3.4% D improvement (from Obama 2012) [projecting a 7.2% victory for Hillary]
That gives us this map right now:
(
Red = Democratic lead
Blue = Republican lead
Green = Exact tie
Grey = No polling yet
Green = toss up
20% shade = 0.1-1% lead
30% shade = 1.1-3% lead
40% shade = 3.1-6% lead
50% shade = 6.1-9% lead
60% shade = 9.1-12% lead
70% shade = 12.1-15% lead
80% shade = 15.1-18% lead
90% shade = Above 18.1% lead
In the count of electoral votes, this means the current situation looks like this:
Hillary: 195 EVs (for a total of 13 states)
Best/Tailormade Republican: 118 EVs (for a total of 13 states)
Toss-up: None
No polling: 225 EVs [almost half, including California] (for a total of 24 states + D.C.)
Which means that Hillary has captured a rather impressive 62.3% of all EVs awarded thus far, against a more or less disappointing 37.7% EVs for the tailormade Republican. And only New York, Maine and New Jersey of the solidly Democratic states have been polled so far, against no less than 12 solidly Republican states - the biggest one of them, Texas, included. With California added to Hillary's pie, it'll look even more promising for her. Neither to forget such states as D.C., Vermont, Hawaii & Maryland. It's looking like a landslide right now, even without Colorado and Pennsylvania being in Hillary's column.
This is how the Trendline Map looks so far:
(
The states which right now are showing the strongest improvement for the Democratic (Hillary) or the Republican candidate (in 17 out of 26 cases, Christie is that person):
1. Arkansas: D +22%
2. Kentucky: D +19%
3. Kansas: D +13%
4. West Virginia: D +13%
5. Wyoming: D +13%
6. Louisiana: D +12%
7. Texas: D +11%
8. Colorado: R +9%
9. New Jersey: R +7.3%
10. Maine: R +7%
11. Alaska: D +6.5%
12. Florida: D +6.4%
13. Georgia: D +6%
14. Michigan: R +5.75%
15. Iowa: R +4.5%
All of these changes (in the 15 states above) are (more than) statistically significant. We see that (so far) Texas is experiencing a much more rapid change than other demographically quick-changing states like Florida and Georgia. Unfortunately, the 4th quick-changing traditionally Republican state, Arizona, has still not been polled. Yet PPP will poll this state (finally) next week, so hopefully we'll get some fresh numbers then.
The whole list of states having been polled till now, going from Democratic stronghold to Republican stronghold:
New York: D +28%
New Jersey: D +10.5%
Maine: D +8%
Florida: D +7.3%
Currently estimated/projected national average: D +7.2%
Minnesota: D +6%
Ohio: D +5.75%
Wisconsin: D +4%
Michigan: D +3.75%
New Hampshire: D +3.7%
Virginia: D +3.1%
Arkansas: D +2%
Pennsylvania: D +1.75%
Iowa: D +1.3%
North Carolina: R +1%
Georgia: R +2%
Colorado: R +3.6%
Kentucky: R +4%
Louisiana: R +5%
Texas: R +5%
South Carolina: R +7%
Alaska: R +7.5%
Mississippi: R +9%
Kansas: R +9%
Montana: R +13%
West Virginia: R +14%
Wyoming: R +28%
6 states are currently way too close to call; Virginia, Arkansas, Pennsylvania & Iowa (all leaning towards Hillary), plus North Carolina and Georgia (all leaning Republican).
Here are the current stats on Republican candidates:
1. Chris Christie favoured in 17 of 26 states
2. Jeb Bush favoured in 7 states (Texas (!), Florida, Wisconsin (!!), Kentucky (!!), Kansas, West Virginia & Alaska)
3. Marco Rubio favoured in 1 state (South Carolina)
4. Mike Huckabee favoured in 1 state (Louisiana)
5. Rand Paul favoured in 1 state (Montana)
Current update as of March 4.
Title: Re: 2016 Official Polling Map Thread
Post by: pbrower2a on March 04, 2014, 12:18:00 PM
Some Presidential nominees have won all three states (NJ, NY, VA). Those who have beginning in 1912 are:
Wilson 1912
Hoover 1928
FDR all four times
Eisenhower 1952 and 1956
LBJ 1964
Nixon 1972
Reagan 1980 and 1984
Obama 2008 and 2012
It's not rare (14 times, and it is split almost evenly D-R). In all such instances, anyone who won all three states won the Presidential election.
The closest elections nationwide involving anyone winning all three states were FDR 1944 and the two with Barack Obama. Hillary Clinton, should she win in 2016 with all three states would be no exception.
Title: Re: 2016 Official Polling Map Thread
Post by: eric82oslo on March 06, 2014, 01:26:12 PM
And finally it happened. We know how the landscape looks like in the future crucial battleground of Arizona as well. :D Which means we've now reached a consensus in no less than 27 states - very well! Right now, Arizona is about 8.4% more Republican than the nation as a whole - if we are to believe this poll. However, that margin is likely to shrink even more until election day 2016, since the Arizona demographic is among the 3-5 state demographics changing the quickest these days.
The total number of state polls added to the lists below has thus now reached 102.
So here they are - all the 2016 poll averages for each state so far - 27 states having been polled to date - and how far off they are compared to the actual 2012 outcomes. I'm only including the Republican candidate with the best statewide polling.
Alaska: Hillary vs Jeb Bush: R +7.5%
+6.5% D improvement
(Updated on February 5, 2014)
Arizona: Hillary vs Bush: R +1%
+8% D improvement
(Updated on March 6, 2014)
Arkansas: Hillary vs Chris Christie: D +2%
+22% D improvement
Current Democratic gain
(Updated on August 11)
Colorado: Hillary vs Christie: R +3.6%
+9% R improvement
Current Republican gain
(Updated on February 6, 2014)
Florida: Hillary vs Bush: D +7.3%
+6.4% D improvement
(Updated on January 31, 2014)
Georgia: Hillary vs Christie: R +2%
+6% D improvement
(Updated August 8 )
Iowa: Hillary vs Christie: D +1.3%
+4.5% R improvement
(Updated on February 27, 2014)
Kansas: Hillary vs Jeb Bush: R +9%
+13% D improvement
(Updated on February 24, 2014)
Kentucky: Hillary vs Christie/Bush: R +4%
+19% D improvement
(Updated on December 22)
Louisiana: Hillary vs Mike Huckabee: R +5%
+12% D improvement
(Updated on February 18, 2014)
Maine: Hillary vs Christie: D +8%
+7% R improvement
(Updated on November 13)
Michigan: Hillary vs Christie: D +3.75%
+5.75% R improvement
(Updated on February 14, 2014)
Minnesota: Hillary vs Christie: D +6%
+2% R improvement
(Updated on January 22, 2013)
Mississippi: Hillary vs Christie: R +9%
+2.5% D improvement
(Updated on November 19)
Montana: Hillary vs Rand Paul: R +13%
+1% D improvement
(Updated on November 24)
New Hampshire: Hillary vs Christie: D +3.7%
+1.9% R improvement
(Updated on January 30, 2014)
New Jersey: Hillary vs Christie: D +10.5%
+7.3% R improvement
(Updated on March 4, 2014)
New York: Hillary vs Christie: D +28%
+0.2% R improvement
(Updated on March 4, 2014)
North Carolina: Hillary vs Christie: R +1%
+1% D improvement
(Updated on February 12, 2014)
Ohio: Hillary vs Christie: D +5.75%
+2.8% D improvement
(Updated on February 20, 2014)
Pennsylvania: Hillary vs Christie: D +1.75%
+3.6% R improvement
(Updated on February 27, 2014)
South Carolina: Hillary vs Marco Rubio: R+7%
+3.5% D improvement
(Updated on November 2)
Texas: Hillary vs Jeb Bush: R +5%
+11% D improvement
(Updated on November 8 )
Virginia: Hillary vs Christie: D +3.1%
+0.8% R improvement
(Updated on March 4, 2013)
West Virginia: Hillary vs Jeb Bush: R +14%
+13% D improvement
(Updated on October 1)
Wisconsin: Hillary vs Jeb Bush: D +4%
+3% R improvement
(Updated on October 29)
Wyoming: Hillary vs Christie: R +28%
+13% D improvement
(Updated on July 23)
Average all 27 states: Hillary vs Best Republican: R +0.9%
+3.5% D improvement (from Obama 2012) [projecting a 7.4% victory for Hillary]
That gives us this map right now:
( )
)
Red = Democratic lead
Blue = Republican lead
Green = Exact tie
Grey = No polling yet
Green = toss up
20% shade = 0.1-1% lead
30% shade = 1.1-3% lead
40% shade = 3.1-6% lead
50% shade = 6.1-9% lead
60% shade = 9.1-12% lead
70% shade = 12.1-15% lead
80% shade = 15.1-18% lead
90% shade = Above 18.1% lead
In the count of electoral votes, this means the current situation looks like this:
Hillary: 195 EVs (for a total of 13 states)
Best/Tailormade Republican: 129 EVs (for a total of 14 states)
Toss-up: None
No polling: 214 EVs [almost half, including California] (for a total of 24 states + D.C.)
Which means that Hillary has captured a rather impressive 60.2% of all EVs awarded thus far, against a more or less disappointing 39.8% EVs for the tailormade Republican. And only New York, Maine and New Jersey of the solidly Democratic states have been polled so far, against no less than 12 solidly Republican states - the biggest one of them, Texas, included. With California added to Hillary's pie, it'll look even more promising for her. Neither to forget such states as D.C., Vermont, Hawaii & Maryland. It's looking like a landslide right now, even without Colorado being in Hillary's column.
This is how the Trendline Map looks so far:
(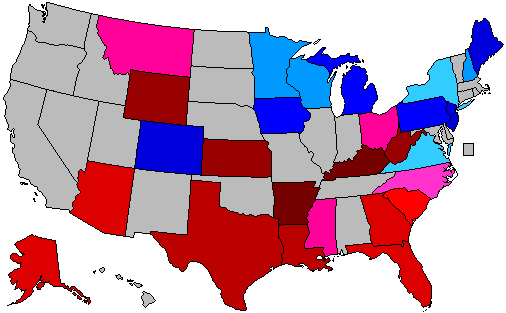 )
)
The states which right now are showing the strongest improvement for the Democratic (Hillary) or the Republican candidate (in 17 out of 27 cases, Christie is that person):
1. Arkansas: D +22%
2. Kentucky: D +19%
3. Kansas: D +13%
4. West Virginia: D +13%
5. Wyoming: D +13%
6. Louisiana: D +12%
7. Texas: D +11%
8. Colorado: R +9%
9. Arizona: D +8%
10. New Jersey: R +7.3%
11. Maine: R +7%
12. Alaska: D +6.5%
13. Florida: D +6.4%
14. Georgia: D +6%
15. Michigan: R +5.75%
16. Iowa: R +4.5%
All of these changes (in the 16 states above) are (more than) statistically significant. We see that (so far) Texas is experiencing a much more rapid change than other demographically quick-changing states like Florida and Georgia, yet even Arizona is changing very rapidly.
The whole list of states having been polled till now, going from Democratic stronghold to Republican stronghold:
New York: D +28%
New Jersey: D +10.5%
Maine: D +8%
Currently estimated/projected national average: D +7.4%
Florida: D +7.3%
Minnesota: D +6%
Ohio: D +5.75%
Wisconsin: D +4%
Michigan: D +3.75%
New Hampshire: D +3.7%
Virginia: D +3.1%
Arkansas: D +2%
Pennsylvania: D +1.75%
Iowa: D +1.3%
North Carolina: R +1%
Arizona: R +1%
Georgia: R +2%
Colorado: R +3.6%
Kentucky: R +4%
Louisiana: R +5%
Texas: R +5%
South Carolina: R +7%
Alaska: R +7.5%
Mississippi: R +9%
Kansas: R +9%
Montana: R +13%
West Virginia: R +14%
Wyoming: R +28%
7 states are currently way too close to call; Virginia, Arkansas, Pennsylvania & Iowa (all leaning towards Hillary), plus Arizona, North Carolina and Georgia (all leaning Republican).
Here are the current stats on Republican candidates:
1. Chris Christie favoured in 17 of 26 states
2. Jeb Bush favoured in 8 states (Texas (!), Florida, Wisconsin (!!), Arizona, Kentucky (!!), Kansas, West Virginia & Alaska)
3. Marco Rubio favoured in 1 state (South Carolina)
4. Mike Huckabee favoured in 1 state (Louisiana)
5. Rand Paul favoured in 1 state (Montana)
Current update as of March 6.
The total number of state polls added to the lists below has thus now reached 102.
So here they are - all the 2016 poll averages for each state so far - 27 states having been polled to date - and how far off they are compared to the actual 2012 outcomes. I'm only including the Republican candidate with the best statewide polling.
Alaska: Hillary vs Jeb Bush: R +7.5%
+6.5% D improvement
(Updated on February 5, 2014)
Arizona: Hillary vs Bush: R +1%
+8% D improvement
(Updated on March 6, 2014)
Arkansas: Hillary vs Chris Christie: D +2%
+22% D improvement
Current Democratic gain
(Updated on August 11)
Colorado: Hillary vs Christie: R +3.6%
+9% R improvement
Current Republican gain
(Updated on February 6, 2014)
Florida: Hillary vs Bush: D +7.3%
+6.4% D improvement
(Updated on January 31, 2014)
Georgia: Hillary vs Christie: R +2%
+6% D improvement
(Updated August 8 )
Iowa: Hillary vs Christie: D +1.3%
+4.5% R improvement
(Updated on February 27, 2014)
Kansas: Hillary vs Jeb Bush: R +9%
+13% D improvement
(Updated on February 24, 2014)
Kentucky: Hillary vs Christie/Bush: R +4%
+19% D improvement
(Updated on December 22)
Louisiana: Hillary vs Mike Huckabee: R +5%
+12% D improvement
(Updated on February 18, 2014)
Maine: Hillary vs Christie: D +8%
+7% R improvement
(Updated on November 13)
Michigan: Hillary vs Christie: D +3.75%
+5.75% R improvement
(Updated on February 14, 2014)
Minnesota: Hillary vs Christie: D +6%
+2% R improvement
(Updated on January 22, 2013)
Mississippi: Hillary vs Christie: R +9%
+2.5% D improvement
(Updated on November 19)
Montana: Hillary vs Rand Paul: R +13%
+1% D improvement
(Updated on November 24)
New Hampshire: Hillary vs Christie: D +3.7%
+1.9% R improvement
(Updated on January 30, 2014)
New Jersey: Hillary vs Christie: D +10.5%
+7.3% R improvement
(Updated on March 4, 2014)
New York: Hillary vs Christie: D +28%
+0.2% R improvement
(Updated on March 4, 2014)
North Carolina: Hillary vs Christie: R +1%
+1% D improvement
(Updated on February 12, 2014)
Ohio: Hillary vs Christie: D +5.75%
+2.8% D improvement
(Updated on February 20, 2014)
Pennsylvania: Hillary vs Christie: D +1.75%
+3.6% R improvement
(Updated on February 27, 2014)
South Carolina: Hillary vs Marco Rubio: R+7%
+3.5% D improvement
(Updated on November 2)
Texas: Hillary vs Jeb Bush: R +5%
+11% D improvement
(Updated on November 8 )
Virginia: Hillary vs Christie: D +3.1%
+0.8% R improvement
(Updated on March 4, 2013)
West Virginia: Hillary vs Jeb Bush: R +14%
+13% D improvement
(Updated on October 1)
Wisconsin: Hillary vs Jeb Bush: D +4%
+3% R improvement
(Updated on October 29)
Wyoming: Hillary vs Christie: R +28%
+13% D improvement
(Updated on July 23)
Average all 27 states: Hillary vs Best Republican: R +0.9%
+3.5% D improvement (from Obama 2012) [projecting a 7.4% victory for Hillary]
That gives us this map right now:
(
Red = Democratic lead
Blue = Republican lead
Green = Exact tie
Grey = No polling yet
Green = toss up
20% shade = 0.1-1% lead
30% shade = 1.1-3% lead
40% shade = 3.1-6% lead
50% shade = 6.1-9% lead
60% shade = 9.1-12% lead
70% shade = 12.1-15% lead
80% shade = 15.1-18% lead
90% shade = Above 18.1% lead
In the count of electoral votes, this means the current situation looks like this:
Hillary: 195 EVs (for a total of 13 states)
Best/Tailormade Republican: 129 EVs (for a total of 14 states)
Toss-up: None
No polling: 214 EVs [almost half, including California] (for a total of 24 states + D.C.)
Which means that Hillary has captured a rather impressive 60.2% of all EVs awarded thus far, against a more or less disappointing 39.8% EVs for the tailormade Republican. And only New York, Maine and New Jersey of the solidly Democratic states have been polled so far, against no less than 12 solidly Republican states - the biggest one of them, Texas, included. With California added to Hillary's pie, it'll look even more promising for her. Neither to forget such states as D.C., Vermont, Hawaii & Maryland. It's looking like a landslide right now, even without Colorado being in Hillary's column.
This is how the Trendline Map looks so far:
(
The states which right now are showing the strongest improvement for the Democratic (Hillary) or the Republican candidate (in 17 out of 27 cases, Christie is that person):
1. Arkansas: D +22%
2. Kentucky: D +19%
3. Kansas: D +13%
4. West Virginia: D +13%
5. Wyoming: D +13%
6. Louisiana: D +12%
7. Texas: D +11%
8. Colorado: R +9%
9. Arizona: D +8%
10. New Jersey: R +7.3%
11. Maine: R +7%
12. Alaska: D +6.5%
13. Florida: D +6.4%
14. Georgia: D +6%
15. Michigan: R +5.75%
16. Iowa: R +4.5%
All of these changes (in the 16 states above) are (more than) statistically significant. We see that (so far) Texas is experiencing a much more rapid change than other demographically quick-changing states like Florida and Georgia, yet even Arizona is changing very rapidly.
The whole list of states having been polled till now, going from Democratic stronghold to Republican stronghold:
New York: D +28%
New Jersey: D +10.5%
Maine: D +8%
Currently estimated/projected national average: D +7.4%
Florida: D +7.3%
Minnesota: D +6%
Ohio: D +5.75%
Wisconsin: D +4%
Michigan: D +3.75%
New Hampshire: D +3.7%
Virginia: D +3.1%
Arkansas: D +2%
Pennsylvania: D +1.75%
Iowa: D +1.3%
North Carolina: R +1%
Arizona: R +1%
Georgia: R +2%
Colorado: R +3.6%
Kentucky: R +4%
Louisiana: R +5%
Texas: R +5%
South Carolina: R +7%
Alaska: R +7.5%
Mississippi: R +9%
Kansas: R +9%
Montana: R +13%
West Virginia: R +14%
Wyoming: R +28%
7 states are currently way too close to call; Virginia, Arkansas, Pennsylvania & Iowa (all leaning towards Hillary), plus Arizona, North Carolina and Georgia (all leaning Republican).
Here are the current stats on Republican candidates:
1. Chris Christie favoured in 17 of 26 states
2. Jeb Bush favoured in 8 states (Texas (!), Florida, Wisconsin (!!), Arizona, Kentucky (!!), Kansas, West Virginia & Alaska)
3. Marco Rubio favoured in 1 state (South Carolina)
4. Mike Huckabee favoured in 1 state (Louisiana)
5. Rand Paul favoured in 1 state (Montana)
Current update as of March 6.
Title: Re: 2016 Official Polling Map Thread
Post by: pbrower2a on March 06, 2014, 03:13:51 PM
PPP will soon have now has polls for Arizona.
Arizona, after going for John McCain only by 8% in 2008, an unusually-small margin for a Favorite Son, looked as if it would be a swing state in 2012 or 2016.
http://www.publicpolicypolling.com/main/2014/03/mccain-least-popular-senator-in-country.html
blue, Republican -- red, Democratic
30% -- lead with 40-49% but a margin of 3% or less
40% -- lead with 40-49% but a margin of 4% or more
60% -- lead with 50-54%
70% -- lead with 55-59%
90% -- lead with 60% or more
Hillary Clinton vs. Jeb Bush
(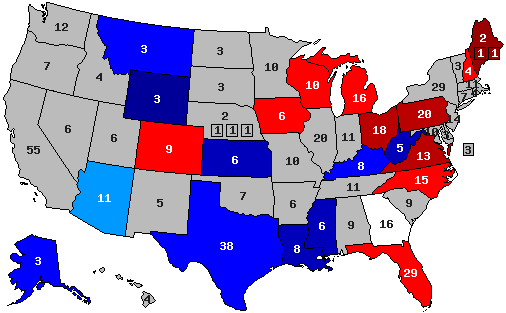 )
)
Hillary Clinton vs. Chris Christie
(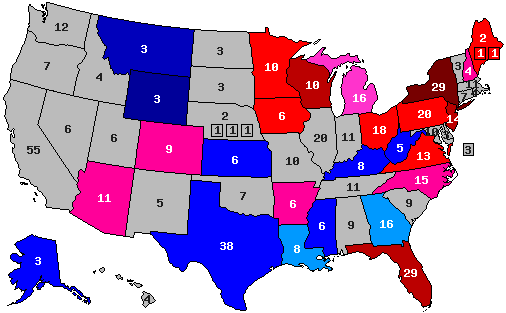 )
)
Hillary Clinton vs. Rand Paul
( )
)
Hillary Clinton vs. Paul Ryan
()
Arizona, after going for John McCain only by 8% in 2008, an unusually-small margin for a Favorite Son, looked as if it would be a swing state in 2012 or 2016.
Quote
-The Presidential race in Arizona in 2016 could be interesting as well. Hillary Clinton narrowly trails Jeb Bush (45/44), but leads Chris Christie (44/41), Rand Paul (46/43), and Mike Huckabee (47/41). Arizona could finally reach its long anticipated battleground status this cycle.
http://www.publicpolicypolling.com/main/2014/03/mccain-least-popular-senator-in-country.html
blue, Republican -- red, Democratic
30% -- lead with 40-49% but a margin of 3% or less
40% -- lead with 40-49% but a margin of 4% or more
60% -- lead with 50-54%
70% -- lead with 55-59%
90% -- lead with 60% or more
Hillary Clinton vs. Jeb Bush
(
Hillary Clinton vs. Chris Christie
(
Hillary Clinton vs. Rand Paul
(
Hillary Clinton vs. Paul Ryan
(
Title: Re: 2016 Official Polling Map Thread
Post by: pbrower2a on March 12, 2014, 01:42:44 PM
North Carolina, PPP:
http://www.publicpolicypolling.com/main/2014/03/north-carolinians-want-duke-to-pay.html
Clinton 47
Bush 46
Clinton 46
Christie 42
Clinton 49
Paul 43
Clinton 49
Huckabee 42
Hillary Clinton vs. Jeb Bush
( )
)
Hillary Clinton vs. Chris Christie
(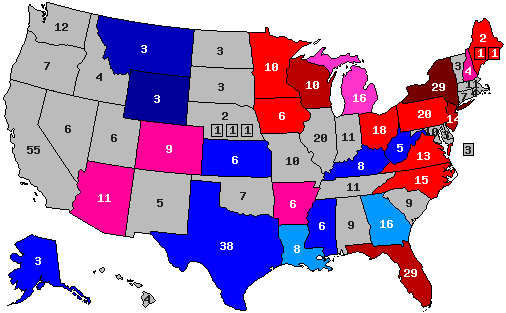 )
)
Hillary Clinton vs. Rand Paul
( )
)
Hillary Clinton vs. Paul Ryan
()
http://www.publicpolicypolling.com/main/2014/03/north-carolinians-want-duke-to-pay.html
Clinton 47
Bush 46
Clinton 46
Christie 42
Clinton 49
Paul 43
Clinton 49
Huckabee 42
Hillary Clinton vs. Jeb Bush
(
Hillary Clinton vs. Chris Christie
(
Hillary Clinton vs. Rand Paul
(
Hillary Clinton vs. Paul Ryan
(
Title: Re: 2016 Official Polling Map Thread
Post by: eric82oslo on March 12, 2014, 03:24:45 PM
With the 6th and latest PPP poll of North Carolina, the state has turned into an absolute toss-up. Though in reality, Hillary is the actual leader of the state, since she's lead both Christie as well as any other Republican candidate for at least the past two polls. In fact, Christie is the only Republican in any of the polls to have been ahead of Clinton, yet he has been trailing Hillary by an average of 3.5% in the last two North Carolina polls.
The total number of state polls added to the lists below has thus now reached 103.
So here they are - all the 2016 poll averages for each state so far - 27 states having been polled to date - and how far off they are compared to the actual 2012 outcomes. I'm only including the Republican candidate with the best statewide polling.
Alaska: Hillary vs Jeb Bush: R +7.5%
+6.5% D improvement
(Updated on February 5, 2014)
Arizona: Hillary vs Bush: R +1%
+8% D improvement
(Updated on March 6, 2014)
Arkansas: Hillary vs Chris Christie: D +2%
+22% D improvement
Current Democratic gain
(Updated on August 11)
Colorado: Hillary vs Christie: R +3.6%
+9% R improvement
Current Republican gain
(Updated on February 6, 2014)
Florida: Hillary vs Bush: D +7.3%
+6.4% D improvement
(Updated on January 31, 2014)
Georgia: Hillary vs Christie: R +2%
+6% D improvement
(Updated August 8 )
Iowa: Hillary vs Christie: D +1.3%
+4.5% R improvement
(Updated on February 27, 2014)
Kansas: Hillary vs Jeb Bush: R +9%
+13% D improvement
(Updated on February 24, 2014)
Kentucky: Hillary vs Christie/Bush: R +4%
+19% D improvement
(Updated on December 22)
Louisiana: Hillary vs Mike Huckabee: R +5%
+12% D improvement
(Updated on February 18, 2014)
Maine: Hillary vs Christie: D +8%
+7% R improvement
(Updated on November 13)
Michigan: Hillary vs Christie: D +3.75%
+5.75% R improvement
(Updated on February 14, 2014)
Minnesota: Hillary vs Christie: D +6%
+2% R improvement
(Updated on January 22, 2013)
Mississippi: Hillary vs Christie: R +9%
+2.5% D improvement
(Updated on November 19)
Montana: Hillary vs Rand Paul: R +13%
+1% D improvement
(Updated on November 24)
New Hampshire: Hillary vs Christie: D +3.7%
+1.9% R improvement
(Updated on January 30, 2014)
New Jersey: Hillary vs Christie: D +10.5%
+7.3% R improvement
(Updated on March 4, 2014)
New York: Hillary vs Christie: D +28%
+0.2% R improvement
(Updated on March 4, 2014)
North Carolina: Hillary vs Christie: D +0.0%
+2% D improvement
(Updated on March 12, 2014)
Ohio: Hillary vs Christie: D +5.75%
+2.8% D improvement
(Updated on February 20, 2014)
Pennsylvania: Hillary vs Christie: D +1.75%
+3.6% R improvement
(Updated on February 27, 2014)
South Carolina: Hillary vs Marco Rubio: R+7%
+3.5% D improvement
(Updated on November 2)
Texas: Hillary vs Jeb Bush: R +5%
+11% D improvement
(Updated on November 8 )
Virginia: Hillary vs Christie: D +3.1%
+0.8% R improvement
(Updated on March 4, 2013)
West Virginia: Hillary vs Jeb Bush: R +14%
+13% D improvement
(Updated on October 1)
Wisconsin: Hillary vs Jeb Bush: D +4%
+3% R improvement
(Updated on October 29)
Wyoming: Hillary vs Christie: R +28%
+13% D improvement
(Updated on July 23)
Average all 27 states: Hillary vs Best Republican: R +0.9%
+3.6% D improvement (from Obama 2012) [projecting a 7.5% victory for Hillary]
That gives us this map right now:
(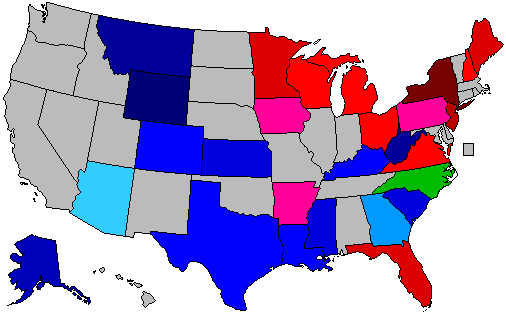 )
)
Red = Democratic lead
Blue = Republican lead
Green = Exact tie
Grey = No polling yet
Green = toss up
20% shade = 0.1-1% lead
30% shade = 1.1-3% lead
40% shade = 3.1-6% lead
50% shade = 6.1-9% lead
60% shade = 9.1-12% lead
70% shade = 12.1-15% lead
80% shade = 15.1-18% lead
90% shade = Above 18.1% lead
In the count of electoral votes, this means the current situation looks like this:
Hillary: 195 EVs (for a total of 13 states)
Best/Tailormade Republican: 114 EVs (for a total of 13 states)
Toss-up: 15 EVs (North Carolina)
No polling: 214 EVs [almost half, including California] (for a total of 24 states + D.C.)
Which means that Hillary has captured a rather impressive 63.1% of all EVs awarded thus far, against a more or less disappointing 36.9% EVs for the tailormade Republican. And only New York, Maine and New Jersey of the solidly Democratic states have been polled so far, against no less than 12 solidly Republican states - the biggest one of them, Texas, included. With California added to Hillary's pie, it'll look even more promising for her. Neither to forget such states as D.C., Vermont, Hawaii & Maryland. It's looking like a landslide right now, even without Colorado being in Hillary's column.
This is how the Trendline Map looks so far:
(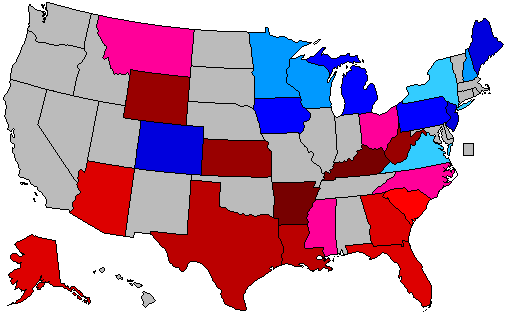 )
)
The states which right now are showing the strongest improvement for the Democratic (Hillary) or the Republican candidate (in 17 out of 27 cases, Christie is that person):
1. Arkansas: D +22%
2. Kentucky: D +19%
3. Kansas: D +13%
4. West Virginia: D +13%
5. Wyoming: D +13%
6. Louisiana: D +12%
7. Texas: D +11%
8. Colorado: R +9%
9. Arizona: D +8%
10. New Jersey: R +7.3%
11. Maine: R +7%
12. Alaska: D +6.5%
13. Florida: D +6.4%
14. Georgia: D +6%
15. Michigan: R +5.75%
16. Iowa: R +4.5%
All of these changes (in the 16 states above) are (more than) statistically significant. We see that (so far) Texas is experiencing a much more rapid change than other demographically quick-changing states like Florida and Georgia, yet even Arizona is changing very rapidly.
The whole list of states having been polled till now, going from Democratic stronghold to Republican stronghold:
New York: D +28%
New Jersey: D +10.5%
Maine: D +8%
Currently estimated/projected national average: D +7.5%
Florida: D +7.3%
Minnesota: D +6%
Ohio: D +5.75%
Wisconsin: D +4%
Michigan: D +3.75%
New Hampshire: D +3.7%
Virginia: D +3.1%
Arkansas: D +2%
Pennsylvania: D +1.75%
Iowa: D +1.3%
North Carolina: D +0.0%
Arizona: R +1%
Georgia: R +2%
Colorado: R +3.6%
Kentucky: R +4%
Louisiana: R +5%
Texas: R +5%
South Carolina: R +7%
Alaska: R +7.5%
Mississippi: R +9%
Kansas: R +9%
Montana: R +13%
West Virginia: R +14%
Wyoming: R +28%
7 states are currently way too close to call; Virginia, Arkansas, Pennsylvania & Iowa (all leaning towards Hillary), the toss up state of North Carolina, plus Arizona and Georgia (both leaning Republican).
Here are the current stats on Republican candidates:
1. Chris Christie favoured in 17 of 26 states
2. Jeb Bush favoured in 8 states (Texas (!), Florida, Wisconsin (!!), Arizona, Kentucky (!!), Kansas, West Virginia & Alaska)
3. Marco Rubio favoured in 1 state (South Carolina)
4. Mike Huckabee favoured in 1 state (Louisiana)
5. Rand Paul favoured in 1 state (Montana)
Current update as of March 12.
The total number of state polls added to the lists below has thus now reached 103.
So here they are - all the 2016 poll averages for each state so far - 27 states having been polled to date - and how far off they are compared to the actual 2012 outcomes. I'm only including the Republican candidate with the best statewide polling.
Alaska: Hillary vs Jeb Bush: R +7.5%
+6.5% D improvement
(Updated on February 5, 2014)
Arizona: Hillary vs Bush: R +1%
+8% D improvement
(Updated on March 6, 2014)
Arkansas: Hillary vs Chris Christie: D +2%
+22% D improvement
Current Democratic gain
(Updated on August 11)
Colorado: Hillary vs Christie: R +3.6%
+9% R improvement
Current Republican gain
(Updated on February 6, 2014)
Florida: Hillary vs Bush: D +7.3%
+6.4% D improvement
(Updated on January 31, 2014)
Georgia: Hillary vs Christie: R +2%
+6% D improvement
(Updated August 8 )
Iowa: Hillary vs Christie: D +1.3%
+4.5% R improvement
(Updated on February 27, 2014)
Kansas: Hillary vs Jeb Bush: R +9%
+13% D improvement
(Updated on February 24, 2014)
Kentucky: Hillary vs Christie/Bush: R +4%
+19% D improvement
(Updated on December 22)
Louisiana: Hillary vs Mike Huckabee: R +5%
+12% D improvement
(Updated on February 18, 2014)
Maine: Hillary vs Christie: D +8%
+7% R improvement
(Updated on November 13)
Michigan: Hillary vs Christie: D +3.75%
+5.75% R improvement
(Updated on February 14, 2014)
Minnesota: Hillary vs Christie: D +6%
+2% R improvement
(Updated on January 22, 2013)
Mississippi: Hillary vs Christie: R +9%
+2.5% D improvement
(Updated on November 19)
Montana: Hillary vs Rand Paul: R +13%
+1% D improvement
(Updated on November 24)
New Hampshire: Hillary vs Christie: D +3.7%
+1.9% R improvement
(Updated on January 30, 2014)
New Jersey: Hillary vs Christie: D +10.5%
+7.3% R improvement
(Updated on March 4, 2014)
New York: Hillary vs Christie: D +28%
+0.2% R improvement
(Updated on March 4, 2014)
North Carolina: Hillary vs Christie: D +0.0%
+2% D improvement
(Updated on March 12, 2014)
Ohio: Hillary vs Christie: D +5.75%
+2.8% D improvement
(Updated on February 20, 2014)
Pennsylvania: Hillary vs Christie: D +1.75%
+3.6% R improvement
(Updated on February 27, 2014)
South Carolina: Hillary vs Marco Rubio: R+7%
+3.5% D improvement
(Updated on November 2)
Texas: Hillary vs Jeb Bush: R +5%
+11% D improvement
(Updated on November 8 )
Virginia: Hillary vs Christie: D +3.1%
+0.8% R improvement
(Updated on March 4, 2013)
West Virginia: Hillary vs Jeb Bush: R +14%
+13% D improvement
(Updated on October 1)
Wisconsin: Hillary vs Jeb Bush: D +4%
+3% R improvement
(Updated on October 29)
Wyoming: Hillary vs Christie: R +28%
+13% D improvement
(Updated on July 23)
Average all 27 states: Hillary vs Best Republican: R +0.9%
+3.6% D improvement (from Obama 2012) [projecting a 7.5% victory for Hillary]
That gives us this map right now:
(
Red = Democratic lead
Blue = Republican lead
Green = Exact tie
Grey = No polling yet
Green = toss up
20% shade = 0.1-1% lead
30% shade = 1.1-3% lead
40% shade = 3.1-6% lead
50% shade = 6.1-9% lead
60% shade = 9.1-12% lead
70% shade = 12.1-15% lead
80% shade = 15.1-18% lead
90% shade = Above 18.1% lead
In the count of electoral votes, this means the current situation looks like this:
Hillary: 195 EVs (for a total of 13 states)
Best/Tailormade Republican: 114 EVs (for a total of 13 states)
Toss-up: 15 EVs (North Carolina)
No polling: 214 EVs [almost half, including California] (for a total of 24 states + D.C.)
Which means that Hillary has captured a rather impressive 63.1% of all EVs awarded thus far, against a more or less disappointing 36.9% EVs for the tailormade Republican. And only New York, Maine and New Jersey of the solidly Democratic states have been polled so far, against no less than 12 solidly Republican states - the biggest one of them, Texas, included. With California added to Hillary's pie, it'll look even more promising for her. Neither to forget such states as D.C., Vermont, Hawaii & Maryland. It's looking like a landslide right now, even without Colorado being in Hillary's column.
This is how the Trendline Map looks so far:
(
The states which right now are showing the strongest improvement for the Democratic (Hillary) or the Republican candidate (in 17 out of 27 cases, Christie is that person):
1. Arkansas: D +22%
2. Kentucky: D +19%
3. Kansas: D +13%
4. West Virginia: D +13%
5. Wyoming: D +13%
6. Louisiana: D +12%
7. Texas: D +11%
8. Colorado: R +9%
9. Arizona: D +8%
10. New Jersey: R +7.3%
11. Maine: R +7%
12. Alaska: D +6.5%
13. Florida: D +6.4%
14. Georgia: D +6%
15. Michigan: R +5.75%
16. Iowa: R +4.5%
All of these changes (in the 16 states above) are (more than) statistically significant. We see that (so far) Texas is experiencing a much more rapid change than other demographically quick-changing states like Florida and Georgia, yet even Arizona is changing very rapidly.
The whole list of states having been polled till now, going from Democratic stronghold to Republican stronghold:
New York: D +28%
New Jersey: D +10.5%
Maine: D +8%
Currently estimated/projected national average: D +7.5%
Florida: D +7.3%
Minnesota: D +6%
Ohio: D +5.75%
Wisconsin: D +4%
Michigan: D +3.75%
New Hampshire: D +3.7%
Virginia: D +3.1%
Arkansas: D +2%
Pennsylvania: D +1.75%
Iowa: D +1.3%
North Carolina: D +0.0%
Arizona: R +1%
Georgia: R +2%
Colorado: R +3.6%
Kentucky: R +4%
Louisiana: R +5%
Texas: R +5%
South Carolina: R +7%
Alaska: R +7.5%
Mississippi: R +9%
Kansas: R +9%
Montana: R +13%
West Virginia: R +14%
Wyoming: R +28%
7 states are currently way too close to call; Virginia, Arkansas, Pennsylvania & Iowa (all leaning towards Hillary), the toss up state of North Carolina, plus Arizona and Georgia (both leaning Republican).
Here are the current stats on Republican candidates:
1. Chris Christie favoured in 17 of 26 states
2. Jeb Bush favoured in 8 states (Texas (!), Florida, Wisconsin (!!), Arizona, Kentucky (!!), Kansas, West Virginia & Alaska)
3. Marco Rubio favoured in 1 state (South Carolina)
4. Mike Huckabee favoured in 1 state (Louisiana)
5. Rand Paul favoured in 1 state (Montana)
Current update as of March 12.
Title: Re: 2016 Official Polling Map Thread
Post by: pbrower2a on March 12, 2014, 07:24:49 PM
North Carolina as a toss-up? It's been done. 2008, a disastrous year for the GOP.
Title: Re: 2016 Official Polling Map Thread
Post by: eric82oslo on March 13, 2014, 09:48:33 AM
With the 8th 2016 poll from Iowa, including the 4th one from Quinnipiac, we now find major movement towards Hillary in the state. Christie slumps from trailing Hillary by 1.3% on average in the state, to now being 3.0% behind. He still remains undoubtedly the GOP candidate with the best shot though, yet now only from the perspective of levelling out polls over time.
The total number of state polls added to the lists below has thus now reached 104.
So here they are - all the 2016 poll averages for each state so far - 27 states having been polled to date - and how far off they are compared to the actual 2012 outcomes. I'm only including the Republican candidate with the best statewide polling.
Alaska: Hillary vs Jeb Bush: R +7.5%
+6.5% D improvement
(Updated on February 5, 2014)
Arizona: Hillary vs Bush: R +1%
+8% D improvement
(Updated on March 6, 2014)
Arkansas: Hillary vs Chris Christie: D +2%
+22% D improvement
Current Democratic gain
(Updated on August 11)
Colorado: Hillary vs Christie: R +3.6%
+9% R improvement
Current Republican gain
(Updated on February 6, 2014)
Florida: Hillary vs Bush: D +7.3%
+6.4% D improvement
(Updated on January 31, 2014)
Georgia: Hillary vs Christie: R +2%
+6% D improvement
(Updated August 8 )
Iowa: Hillary vs Christie: D +3.0%
+2.8% R improvement
(Updated on March 13, 2014)
Kansas: Hillary vs Jeb Bush: R +9%
+13% D improvement
(Updated on February 24, 2014)
Kentucky: Hillary vs Christie/Bush: R +4%
+19% D improvement
(Updated on December 22)
Louisiana: Hillary vs Mike Huckabee: R +5%
+12% D improvement
(Updated on February 18, 2014)
Maine: Hillary vs Christie: D +8%
+7% R improvement
(Updated on November 13)
Michigan: Hillary vs Christie: D +3.75%
+5.75% R improvement
(Updated on February 14, 2014)
Minnesota: Hillary vs Christie: D +6%
+2% R improvement
(Updated on January 22, 2013)
Mississippi: Hillary vs Christie: R +9%
+2.5% D improvement
(Updated on November 19)
Montana: Hillary vs Rand Paul: R +13%
+1% D improvement
(Updated on November 24)
New Hampshire: Hillary vs Christie: D +3.7%
+1.9% R improvement
(Updated on January 30, 2014)
New Jersey: Hillary vs Christie: D +10.5%
+7.3% R improvement
(Updated on March 4, 2014)
New York: Hillary vs Christie: D +28%
+0.2% R improvement
(Updated on March 4, 2014)
North Carolina: Hillary vs Christie: D +0.0%
+2% D improvement
(Updated on March 12, 2014)
Ohio: Hillary vs Christie: D +5.75%
+2.8% D improvement
(Updated on February 20, 2014)
Pennsylvania: Hillary vs Christie: D +1.75%
+3.6% R improvement
(Updated on February 27, 2014)
South Carolina: Hillary vs Marco Rubio: R+7%
+3.5% D improvement
(Updated on November 2)
Texas: Hillary vs Jeb Bush: R +5%
+11% D improvement
(Updated on November 8 )
Virginia: Hillary vs Christie: D +3.1%
+0.8% R improvement
(Updated on March 4, 2014)
West Virginia: Hillary vs Jeb Bush: R +14%
+13% D improvement
(Updated on October 1)
Wisconsin: Hillary vs Jeb Bush: D +4%
+3% R improvement
(Updated on October 29)
Wyoming: Hillary vs Christie: R +28%
+13% D improvement
(Updated on July 23)
Average all 27 states: Hillary vs Best Republican: R +0.8%
+3.7% D improvement (from Obama 2012) [projecting a 7.6% victory for Hillary]
That gives us this map right now:
()
Red = Democratic lead
Blue = Republican lead
Green = Exact tie
Grey = No polling yet
Green = toss up
20% shade = 0.1-1% lead
30% shade = 1.1-3% lead
40% shade = 3.1-6% lead
50% shade = 6.1-9% lead
60% shade = 9.1-12% lead
70% shade = 12.1-15% lead
80% shade = 15.1-18% lead
90% shade = Above 18.1% lead
In the count of electoral votes, this means the current situation looks like this:
Hillary: 195 EVs (for a total of 13 states)
Best/Tailormade Republican: 114 EVs (for a total of 13 states)
Toss-up: 15 EVs (North Carolina)
No polling: 214 EVs [almost half, including California] (for a total of 24 states + D.C.)
Which means that Hillary has captured a rather impressive 63.1% of all EVs awarded thus far, against a more or less disappointing 36.9% EVs for the tailormade Republican. And only New York, Maine and New Jersey of the solidly Democratic states have been polled so far, against no less than 12 solidly Republican states - the biggest one of them, Texas, included. With California added to Hillary's pie, it'll look even more promising for her. Neither to forget such states as D.C., Vermont, Hawaii & Maryland. It's looking like a landslide right now, even without Colorado being in Hillary's column.
This is how the Trendline Map looks so far:
(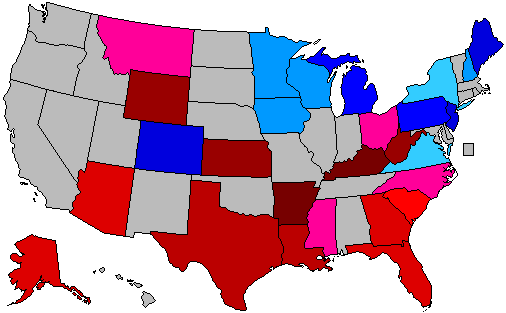 )
)
The states which right now are showing the strongest improvement for the Democratic (Hillary) or the Republican candidate (in 17 out of 27 cases, Christie is that person):
1. Arkansas: D +22%
2. Kentucky: D +19%
3. Kansas: D +13%
4. West Virginia: D +13%
5. Wyoming: D +13%
6. Louisiana: D +12%
7. Texas: D +11%
8. Colorado: R +9%
9. Arizona: D +8%
10. New Jersey: R +7.3%
11. Maine: R +7%
12. Alaska: D +6.5%
13. Florida: D +6.4%
14. Georgia: D +6%
15. Michigan: R +5.75%
All of these changes (in the 15 states above) are (more than) statistically significant. We see that (so far) Texas is experiencing a much more rapid change than other demographically quick-changing states like Florida and Georgia, yet even Arizona is changing very rapidly.
The whole list of states having been polled till now, going from Democratic stronghold to Republican stronghold:
New York: D +28%
New Jersey: D +10.5%
Maine: D +8%
Currently estimated/projected national average: D +7.6%
Florida: D +7.3%
Minnesota: D +6%
Ohio: D +5.75%
Wisconsin: D +4%
Michigan: D +3.75%
New Hampshire: D +3.7%
Virginia: D +3.1%
Iowa: D +3.0%
Arkansas: D +2%
Pennsylvania: D +1.75%
North Carolina: D +0.0%
Arizona: R +1%
Georgia: R +2%
Colorado: R +3.6%
Kentucky: R +4%
Louisiana: R +5%
Texas: R +5%
South Carolina: R +7%
Alaska: R +7.5%
Mississippi: R +9%
Kansas: R +9%
Montana: R +13%
West Virginia: R +14%
Wyoming: R +28%
7 states are currently way too close to call; Virginia, Iowa, Arkansas & Pennsylvania (all leaning towards Hillary), the toss up state of North Carolina, plus Arizona and Georgia (both leaning Republican).
Here are the current stats on Republican candidates:
1. Chris Christie favoured in 17 of 26 states
2. Jeb Bush favoured in 8 states (Texas (!), Florida, Wisconsin (!!), Arizona, Kentucky (!!), Kansas, West Virginia & Alaska)
3. Marco Rubio favoured in 1 state (South Carolina)
4. Mike Huckabee favoured in 1 state (Louisiana)
5. Rand Paul favoured in 1 state (Montana)
Current update as of March 13.
The total number of state polls added to the lists below has thus now reached 104.
So here they are - all the 2016 poll averages for each state so far - 27 states having been polled to date - and how far off they are compared to the actual 2012 outcomes. I'm only including the Republican candidate with the best statewide polling.
Alaska: Hillary vs Jeb Bush: R +7.5%
+6.5% D improvement
(Updated on February 5, 2014)
Arizona: Hillary vs Bush: R +1%
+8% D improvement
(Updated on March 6, 2014)
Arkansas: Hillary vs Chris Christie: D +2%
+22% D improvement
Current Democratic gain
(Updated on August 11)
Colorado: Hillary vs Christie: R +3.6%
+9% R improvement
Current Republican gain
(Updated on February 6, 2014)
Florida: Hillary vs Bush: D +7.3%
+6.4% D improvement
(Updated on January 31, 2014)
Georgia: Hillary vs Christie: R +2%
+6% D improvement
(Updated August 8 )
Iowa: Hillary vs Christie: D +3.0%
+2.8% R improvement
(Updated on March 13, 2014)
Kansas: Hillary vs Jeb Bush: R +9%
+13% D improvement
(Updated on February 24, 2014)
Kentucky: Hillary vs Christie/Bush: R +4%
+19% D improvement
(Updated on December 22)
Louisiana: Hillary vs Mike Huckabee: R +5%
+12% D improvement
(Updated on February 18, 2014)
Maine: Hillary vs Christie: D +8%
+7% R improvement
(Updated on November 13)
Michigan: Hillary vs Christie: D +3.75%
+5.75% R improvement
(Updated on February 14, 2014)
Minnesota: Hillary vs Christie: D +6%
+2% R improvement
(Updated on January 22, 2013)
Mississippi: Hillary vs Christie: R +9%
+2.5% D improvement
(Updated on November 19)
Montana: Hillary vs Rand Paul: R +13%
+1% D improvement
(Updated on November 24)
New Hampshire: Hillary vs Christie: D +3.7%
+1.9% R improvement
(Updated on January 30, 2014)
New Jersey: Hillary vs Christie: D +10.5%
+7.3% R improvement
(Updated on March 4, 2014)
New York: Hillary vs Christie: D +28%
+0.2% R improvement
(Updated on March 4, 2014)
North Carolina: Hillary vs Christie: D +0.0%
+2% D improvement
(Updated on March 12, 2014)
Ohio: Hillary vs Christie: D +5.75%
+2.8% D improvement
(Updated on February 20, 2014)
Pennsylvania: Hillary vs Christie: D +1.75%
+3.6% R improvement
(Updated on February 27, 2014)
South Carolina: Hillary vs Marco Rubio: R+7%
+3.5% D improvement
(Updated on November 2)
Texas: Hillary vs Jeb Bush: R +5%
+11% D improvement
(Updated on November 8 )
Virginia: Hillary vs Christie: D +3.1%
+0.8% R improvement
(Updated on March 4, 2014)
West Virginia: Hillary vs Jeb Bush: R +14%
+13% D improvement
(Updated on October 1)
Wisconsin: Hillary vs Jeb Bush: D +4%
+3% R improvement
(Updated on October 29)
Wyoming: Hillary vs Christie: R +28%
+13% D improvement
(Updated on July 23)
Average all 27 states: Hillary vs Best Republican: R +0.8%
+3.7% D improvement (from Obama 2012) [projecting a 7.6% victory for Hillary]
That gives us this map right now:
(
Red = Democratic lead
Blue = Republican lead
Green = Exact tie
Grey = No polling yet
Green = toss up
20% shade = 0.1-1% lead
30% shade = 1.1-3% lead
40% shade = 3.1-6% lead
50% shade = 6.1-9% lead
60% shade = 9.1-12% lead
70% shade = 12.1-15% lead
80% shade = 15.1-18% lead
90% shade = Above 18.1% lead
In the count of electoral votes, this means the current situation looks like this:
Hillary: 195 EVs (for a total of 13 states)
Best/Tailormade Republican: 114 EVs (for a total of 13 states)
Toss-up: 15 EVs (North Carolina)
No polling: 214 EVs [almost half, including California] (for a total of 24 states + D.C.)
Which means that Hillary has captured a rather impressive 63.1% of all EVs awarded thus far, against a more or less disappointing 36.9% EVs for the tailormade Republican. And only New York, Maine and New Jersey of the solidly Democratic states have been polled so far, against no less than 12 solidly Republican states - the biggest one of them, Texas, included. With California added to Hillary's pie, it'll look even more promising for her. Neither to forget such states as D.C., Vermont, Hawaii & Maryland. It's looking like a landslide right now, even without Colorado being in Hillary's column.
This is how the Trendline Map looks so far:
(
The states which right now are showing the strongest improvement for the Democratic (Hillary) or the Republican candidate (in 17 out of 27 cases, Christie is that person):
1. Arkansas: D +22%
2. Kentucky: D +19%
3. Kansas: D +13%
4. West Virginia: D +13%
5. Wyoming: D +13%
6. Louisiana: D +12%
7. Texas: D +11%
8. Colorado: R +9%
9. Arizona: D +8%
10. New Jersey: R +7.3%
11. Maine: R +7%
12. Alaska: D +6.5%
13. Florida: D +6.4%
14. Georgia: D +6%
15. Michigan: R +5.75%
All of these changes (in the 15 states above) are (more than) statistically significant. We see that (so far) Texas is experiencing a much more rapid change than other demographically quick-changing states like Florida and Georgia, yet even Arizona is changing very rapidly.
The whole list of states having been polled till now, going from Democratic stronghold to Republican stronghold:
New York: D +28%
New Jersey: D +10.5%
Maine: D +8%
Currently estimated/projected national average: D +7.6%
Florida: D +7.3%
Minnesota: D +6%
Ohio: D +5.75%
Wisconsin: D +4%
Michigan: D +3.75%
New Hampshire: D +3.7%
Virginia: D +3.1%
Iowa: D +3.0%
Arkansas: D +2%
Pennsylvania: D +1.75%
North Carolina: D +0.0%
Arizona: R +1%
Georgia: R +2%
Colorado: R +3.6%
Kentucky: R +4%
Louisiana: R +5%
Texas: R +5%
South Carolina: R +7%
Alaska: R +7.5%
Mississippi: R +9%
Kansas: R +9%
Montana: R +13%
West Virginia: R +14%
Wyoming: R +28%
7 states are currently way too close to call; Virginia, Iowa, Arkansas & Pennsylvania (all leaning towards Hillary), the toss up state of North Carolina, plus Arizona and Georgia (both leaning Republican).
Here are the current stats on Republican candidates:
1. Chris Christie favoured in 17 of 26 states
2. Jeb Bush favoured in 8 states (Texas (!), Florida, Wisconsin (!!), Arizona, Kentucky (!!), Kansas, West Virginia & Alaska)
3. Marco Rubio favoured in 1 state (South Carolina)
4. Mike Huckabee favoured in 1 state (Louisiana)
5. Rand Paul favoured in 1 state (Montana)
Current update as of March 13.
Title: Re: 2016 Official Polling Map Thread
Post by: pbrower2a on March 13, 2014, 01:30:11 PM
Quinnipiac poll of Iowa:
http://www.quinnipiac.edu/institutes-and-centers/polling-institute/iowa/release-detail?ReleaseID=2019
Clinton 48%
Christie 35%
Clinton 49%
Paul 39%
Clinton 51%
Cruz 35%
Clinton 51%
Bush 37%
Not much wriggle room for Republicans. Q did ask about Cruz, but in view of how far behind he is in Iowa, a state just slightly D in 50-50 elections since about 1992 is one that he wouldn't make close. Republican nominees can win without Iowa... if this is how Iowa looks in the summer of 2016, then the only question about the Presidential election is actuarial in nature.
I'd have rather seen how Scott Walker would do in Iowa than how Ted Cruz would. PPP will be polling Wisconsin soon enough.
Hillary Clinton vs. Jeb Bush
(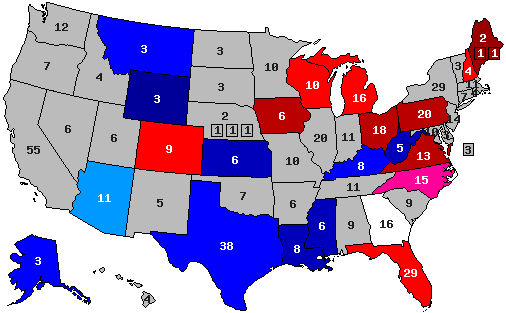 )
)
Hillary Clinton vs. Chris Christie
()
Hillary Clinton vs. Rand Paul
()
Hillary Clinton vs. Paul Ryan
()
http://www.quinnipiac.edu/institutes-and-centers/polling-institute/iowa/release-detail?ReleaseID=2019
Clinton 48%
Christie 35%
Clinton 49%
Paul 39%
Clinton 51%
Cruz 35%
Clinton 51%
Bush 37%
Not much wriggle room for Republicans. Q did ask about Cruz, but in view of how far behind he is in Iowa, a state just slightly D in 50-50 elections since about 1992 is one that he wouldn't make close. Republican nominees can win without Iowa... if this is how Iowa looks in the summer of 2016, then the only question about the Presidential election is actuarial in nature.
I'd have rather seen how Scott Walker would do in Iowa than how Ted Cruz would. PPP will be polling Wisconsin soon enough.
Hillary Clinton vs. Jeb Bush
(
Hillary Clinton vs. Chris Christie
(
Hillary Clinton vs. Rand Paul
(
Hillary Clinton vs. Paul Ryan
(
Title: Re: 2016 Official Polling Map Thread
Post by: pbrower2a on March 15, 2014, 07:23:43 PM
Paul needs to start campaigning fast
He may see the writing on the wall.
Title: Re: 2016 Official Polling Map Thread
Post by: hopper on March 15, 2014, 09:33:13 PM
Jeb Bush looks like the front runner on the R side now. Who would have thought that 1 year ago?
Title: Re: 2016 Official Polling Map Thread
Post by: eric82oslo on March 19, 2014, 08:00:18 PM
The 7th 2016 poll has been released from Colorado, making it also the 3rd Colorado poll by PPP. Hillary leads all her opponents by at least 3% (at least 7% for all except Rand Paul). On average of all the polls done in Colorado, 3 Republicans are still ahead of Hillary. Paul Ryan now leads the pack (lucky for him he wasn't polled this time) being 3.5% ahead of her. Second is now Christie, still averaging a lead of 1.8% in the state. The third lucky Republican is Rand Paul, squeeking out a tiny lead of 0.6%. The remaining Republicans - Huckabee, Cruz, Bush and Rubio - are all trailing Hillary in Colorado. Thus, since Ryan wasn't included in this poll, Colorado hardly trends for now.
The total number of state polls added to the lists below has thus now reached 105.
So here they are - all the 2016 poll averages for each state so far - 27 states having been polled to date - and how far off they are compared to the actual 2012 outcomes. I'm only including the Republican candidate with the best statewide polling.
Alaska: Hillary vs Jeb Bush: R +7.5%
+6.5% D improvement
(Updated on February 5, 2014)
Arizona: Hillary vs Bush: R +1%
+8% D improvement
(Updated on March 6, 2014)
Arkansas: Hillary vs Chris Christie: D +2%
+22% D improvement
Current Democratic gain
(Updated on August 11)
Colorado: Hillary vs Paul Ryan: R +3.5%
+8.9% R improvement
Current Republican gain
(Updated on March 20, 2014)
Florida: Hillary vs Bush: D +7.3%
+6.4% D improvement
(Updated on January 31, 2014)
Georgia: Hillary vs Christie: R +2%
+6% D improvement
(Updated August 8 )
Iowa: Hillary vs Christie: D +3.0%
+2.8% R improvement
(Updated on March 13, 2014)
Kansas: Hillary vs Bush: R +9%
+13% D improvement
(Updated on February 24, 2014)
Kentucky: Hillary vs Christie/Bush: R +4%
+19% D improvement
(Updated on December 22)
Louisiana: Hillary vs Mike Huckabee: R +5%
+12% D improvement
(Updated on February 18, 2014)
Maine: Hillary vs Christie: D +8%
+7% R improvement
(Updated on November 13)
Michigan: Hillary vs Christie: D +3.75%
+5.75% R improvement
(Updated on February 14, 2014)
Minnesota: Hillary vs Christie: D +6%
+2% R improvement
(Updated on January 22, 2013)
Mississippi: Hillary vs Christie: R +9%
+2.5% D improvement
(Updated on November 19)
Montana: Hillary vs Rand Paul: R +13%
+1% D improvement
(Updated on November 24)
New Hampshire: Hillary vs Christie: D +3.7%
+1.9% R improvement
(Updated on January 30, 2014)
New Jersey: Hillary vs Christie: D +10.5%
+7.3% R improvement
(Updated on March 4, 2014)
New York: Hillary vs Christie: D +28%
+0.2% R improvement
(Updated on March 4, 2014)
North Carolina: Hillary vs Christie: D +0.0%
+2% D improvement
(Updated on March 12, 2014)
Ohio: Hillary vs Christie: D +5.75%
+2.8% D improvement
(Updated on February 20, 2014)
Pennsylvania: Hillary vs Christie: D +1.75%
+3.6% R improvement
(Updated on February 27, 2014)
South Carolina: Hillary vs Marco Rubio: R+7%
+3.5% D improvement
(Updated on November 2)
Texas: Hillary vs Bush: R +5%
+11% D improvement
(Updated on November 8 )
Virginia: Hillary vs Christie: D +3.1%
+0.8% R improvement
(Updated on March 4, 2014)
West Virginia: Hillary vs Bush: R +14%
+13% D improvement
(Updated on October 1)
Wisconsin: Hillary vs Bush: D +4%
+3% R improvement
(Updated on October 29)
Wyoming: Hillary vs Christie: R +28%
+13% D improvement
(Updated on July 23)
Average all 27 states: Hillary vs Best Republican: R +0.8%
+3.7% D improvement (from Obama 2012) [projecting a 7.6% victory for Hillary]
That gives us this map right now:
()
Red = Democratic lead
Blue = Republican lead
Green = Exact tie
Grey = No polling yet
Green = toss up
20% shade = 0.1-1% lead
30% shade = 1.1-3% lead
40% shade = 3.1-6% lead
50% shade = 6.1-9% lead
60% shade = 9.1-12% lead
70% shade = 12.1-15% lead
80% shade = 15.1-18% lead
90% shade = Above 18.1% lead
In the count of electoral votes, this means the current situation looks like this:
Hillary: 195 EVs (for a total of 13 states)
Best/Tailormade Republican: 114 EVs (for a total of 13 states)
Toss-up: 15 EVs (North Carolina)
No polling: 214 EVs [almost half, including California] (for a total of 23 states + D.C.)
Which means that Hillary has captured a rather impressive 63.1% of all EVs awarded thus far, against a more or less disappointing 36.9% EVs for the tailormade Republican. And only New York, Maine and New Jersey of the solidly Democratic states have been polled so far, against no less than 12 solidly Republican states - the biggest one of them, Texas, included. With California added to Hillary's pie, it'll look even more promising for her. Neither to forget such states as D.C., Vermont, Hawaii & Maryland. It's looking like a landslide right now, even without Colorado being in Hillary's column.
This is how the Trendline Map looks so far:
()
The states which right now are showing the strongest improvement for the Democratic (Hillary) or the Republican candidate (in 16 out of 27 cases, Christie is that person):
1. Arkansas: D +22%
2. Kentucky: D +19%
3. Kansas: D +13%
4. West Virginia: D +13%
5. Wyoming: D +13%
6. Louisiana: D +12%
7. Texas: D +11%
8. Colorado: R +8.9%
9. Arizona: D +8%
10. New Jersey: R +7.3%
11. Maine: R +7%
12. Alaska: D +6.5%
13. Florida: D +6.4%
14. Georgia: D +6%
15. Michigan: R +5.75%
All of these changes (in the 15 states above) are (more than) statistically significant. We see that (so far) Texas is experiencing a much more rapid change than other demographically quick-changing states like Florida and Georgia, yet even Arizona is changing very rapidly.
The whole list of states having been polled till now, going from Democratic stronghold to Republican stronghold:
New York: D +28%
New Jersey: D +10.5%
Maine: D +8%
Currently estimated/projected national average: D +7.6%
Florida: D +7.3%
Minnesota: D +6%
Ohio: D +5.75%
Wisconsin: D +4%
Michigan: D +3.75%
New Hampshire: D +3.7%
Virginia: D +3.1%
Iowa: D +3.0%
Arkansas: D +2%
Pennsylvania: D +1.75%
North Carolina: D +0.0%
Arizona: R +1%
Georgia: R +2%
Colorado: R +3.5%
Kentucky: R +4%
Louisiana: R +5%
Texas: R +5%
South Carolina: R +7%
Alaska: R +7.5%
Mississippi: R +9%
Kansas: R +9%
Montana: R +13%
West Virginia: R +14%
Wyoming: R +28%
7 states are currently way too close to call; Virginia, Iowa, Arkansas & Pennsylvania (all leaning towards Hillary), the toss up state of North Carolina, plus Arizona and Georgia (both leaning Republican). If we discard Ryan's lead in Colorado, Colorado could be added as the 8th to close to call state right now.
Here are the current stats on Republican candidates:
1. Chris Christie favoured in 16 of 27 states
2. Jeb Bush favoured in 8 states (Texas (!), Florida, Wisconsin (!!), Arizona, Kentucky (!!), Kansas, West Virginia & Alaska)
3. Paul Ryan favoured in 1 state (Colorado)
4. Marco Rubio favoured in 1 state (South Carolina)
5. Mike Huckabee favoured in 1 state (Louisiana)
6. Rand Paul favoured in 1 state (Montana)
Current update as of March 20.
The total number of state polls added to the lists below has thus now reached 105.
So here they are - all the 2016 poll averages for each state so far - 27 states having been polled to date - and how far off they are compared to the actual 2012 outcomes. I'm only including the Republican candidate with the best statewide polling.
Alaska: Hillary vs Jeb Bush: R +7.5%
+6.5% D improvement
(Updated on February 5, 2014)
Arizona: Hillary vs Bush: R +1%
+8% D improvement
(Updated on March 6, 2014)
Arkansas: Hillary vs Chris Christie: D +2%
+22% D improvement
Current Democratic gain
(Updated on August 11)
Colorado: Hillary vs Paul Ryan: R +3.5%
+8.9% R improvement
Current Republican gain
(Updated on March 20, 2014)
Florida: Hillary vs Bush: D +7.3%
+6.4% D improvement
(Updated on January 31, 2014)
Georgia: Hillary vs Christie: R +2%
+6% D improvement
(Updated August 8 )
Iowa: Hillary vs Christie: D +3.0%
+2.8% R improvement
(Updated on March 13, 2014)
Kansas: Hillary vs Bush: R +9%
+13% D improvement
(Updated on February 24, 2014)
Kentucky: Hillary vs Christie/Bush: R +4%
+19% D improvement
(Updated on December 22)
Louisiana: Hillary vs Mike Huckabee: R +5%
+12% D improvement
(Updated on February 18, 2014)
Maine: Hillary vs Christie: D +8%
+7% R improvement
(Updated on November 13)
Michigan: Hillary vs Christie: D +3.75%
+5.75% R improvement
(Updated on February 14, 2014)
Minnesota: Hillary vs Christie: D +6%
+2% R improvement
(Updated on January 22, 2013)
Mississippi: Hillary vs Christie: R +9%
+2.5% D improvement
(Updated on November 19)
Montana: Hillary vs Rand Paul: R +13%
+1% D improvement
(Updated on November 24)
New Hampshire: Hillary vs Christie: D +3.7%
+1.9% R improvement
(Updated on January 30, 2014)
New Jersey: Hillary vs Christie: D +10.5%
+7.3% R improvement
(Updated on March 4, 2014)
New York: Hillary vs Christie: D +28%
+0.2% R improvement
(Updated on March 4, 2014)
North Carolina: Hillary vs Christie: D +0.0%
+2% D improvement
(Updated on March 12, 2014)
Ohio: Hillary vs Christie: D +5.75%
+2.8% D improvement
(Updated on February 20, 2014)
Pennsylvania: Hillary vs Christie: D +1.75%
+3.6% R improvement
(Updated on February 27, 2014)
South Carolina: Hillary vs Marco Rubio: R+7%
+3.5% D improvement
(Updated on November 2)
Texas: Hillary vs Bush: R +5%
+11% D improvement
(Updated on November 8 )
Virginia: Hillary vs Christie: D +3.1%
+0.8% R improvement
(Updated on March 4, 2014)
West Virginia: Hillary vs Bush: R +14%
+13% D improvement
(Updated on October 1)
Wisconsin: Hillary vs Bush: D +4%
+3% R improvement
(Updated on October 29)
Wyoming: Hillary vs Christie: R +28%
+13% D improvement
(Updated on July 23)
Average all 27 states: Hillary vs Best Republican: R +0.8%
+3.7% D improvement (from Obama 2012) [projecting a 7.6% victory for Hillary]
That gives us this map right now:
(
Red = Democratic lead
Blue = Republican lead
Green = Exact tie
Grey = No polling yet
Green = toss up
20% shade = 0.1-1% lead
30% shade = 1.1-3% lead
40% shade = 3.1-6% lead
50% shade = 6.1-9% lead
60% shade = 9.1-12% lead
70% shade = 12.1-15% lead
80% shade = 15.1-18% lead
90% shade = Above 18.1% lead
In the count of electoral votes, this means the current situation looks like this:
Hillary: 195 EVs (for a total of 13 states)
Best/Tailormade Republican: 114 EVs (for a total of 13 states)
Toss-up: 15 EVs (North Carolina)
No polling: 214 EVs [almost half, including California] (for a total of 23 states + D.C.)
Which means that Hillary has captured a rather impressive 63.1% of all EVs awarded thus far, against a more or less disappointing 36.9% EVs for the tailormade Republican. And only New York, Maine and New Jersey of the solidly Democratic states have been polled so far, against no less than 12 solidly Republican states - the biggest one of them, Texas, included. With California added to Hillary's pie, it'll look even more promising for her. Neither to forget such states as D.C., Vermont, Hawaii & Maryland. It's looking like a landslide right now, even without Colorado being in Hillary's column.
This is how the Trendline Map looks so far:
(
The states which right now are showing the strongest improvement for the Democratic (Hillary) or the Republican candidate (in 16 out of 27 cases, Christie is that person):
1. Arkansas: D +22%
2. Kentucky: D +19%
3. Kansas: D +13%
4. West Virginia: D +13%
5. Wyoming: D +13%
6. Louisiana: D +12%
7. Texas: D +11%
8. Colorado: R +8.9%
9. Arizona: D +8%
10. New Jersey: R +7.3%
11. Maine: R +7%
12. Alaska: D +6.5%
13. Florida: D +6.4%
14. Georgia: D +6%
15. Michigan: R +5.75%
All of these changes (in the 15 states above) are (more than) statistically significant. We see that (so far) Texas is experiencing a much more rapid change than other demographically quick-changing states like Florida and Georgia, yet even Arizona is changing very rapidly.
The whole list of states having been polled till now, going from Democratic stronghold to Republican stronghold:
New York: D +28%
New Jersey: D +10.5%
Maine: D +8%
Currently estimated/projected national average: D +7.6%
Florida: D +7.3%
Minnesota: D +6%
Ohio: D +5.75%
Wisconsin: D +4%
Michigan: D +3.75%
New Hampshire: D +3.7%
Virginia: D +3.1%
Iowa: D +3.0%
Arkansas: D +2%
Pennsylvania: D +1.75%
North Carolina: D +0.0%
Arizona: R +1%
Georgia: R +2%
Colorado: R +3.5%
Kentucky: R +4%
Louisiana: R +5%
Texas: R +5%
South Carolina: R +7%
Alaska: R +7.5%
Mississippi: R +9%
Kansas: R +9%
Montana: R +13%
West Virginia: R +14%
Wyoming: R +28%
7 states are currently way too close to call; Virginia, Iowa, Arkansas & Pennsylvania (all leaning towards Hillary), the toss up state of North Carolina, plus Arizona and Georgia (both leaning Republican). If we discard Ryan's lead in Colorado, Colorado could be added as the 8th to close to call state right now.
Here are the current stats on Republican candidates:
1. Chris Christie favoured in 16 of 27 states
2. Jeb Bush favoured in 8 states (Texas (!), Florida, Wisconsin (!!), Arizona, Kentucky (!!), Kansas, West Virginia & Alaska)
3. Paul Ryan favoured in 1 state (Colorado)
4. Marco Rubio favoured in 1 state (South Carolina)
5. Mike Huckabee favoured in 1 state (Louisiana)
6. Rand Paul favoured in 1 state (Montana)
Current update as of March 20.
Title: Re: 2016 Official Polling Map Thread
Post by: pbrower2a on March 20, 2014, 11:13:21 AM
I'd have rather seen how Scott Walker would do in Iowa than how Ted Cruz would. PPP will be polling Wisconsin soon enough.
Whoops! It's Colorado. R disaster nonetheless.
http://www.publicpolicypolling.com/main/2014/03/colorado-happy-with-marijuana-legalization-supports-gay-marriage.html
Clinton 47
Paul 44
Clinton 45
Christie 38
Clinton 48
Huckabee 41
Clinton 48
Bush 39
Clinton 49
Cruz 40
I'm dropping the Colorado poll for Paul Ryan, as the poll is old and I see no reason for Ryan to do better than any other Republican in Colorado; besides, I think Ryan is going after power within the House of Representatives after a lackluster VP run.
I may replace Ryan with Huckabee.
Hillary Clinton vs. Jeb Bush
(
Hillary Clinton vs. Chris Christie
(
Hillary Clinton vs. Rand Paul
(
Hillary Clinton vs. Paul Ryan
(
blue, Republican -- red, Democratic
30% -- lead with 40-49% but a margin of 3% or less
40% -- lead with 40-49% but a margin of 4% or more
60% -- lead with 50-54%
70% -- lead with 55-59%
90% -- lead with 60% or more
Title: Re: 2016 Official Polling Map Thread
Post by: pbrower2a on March 20, 2014, 12:07:40 PM
Blank map -- setting it up for Mike Huckabee as a potential candidate against Hillary Clinton. He gets attention now. Purpose: to remove consideration for Paul Ryan, whom I no longer consider relevant as a candidate for the Presidency in 2016. Seeking the Presidency and seeking power within the House seem incompatible, and except for Dick Cheney (chosen by Dubya for administrative talents more than for the ability to campaign or deliver a critical state) and Gerald Ford (freakish situation) we haven't had a successful campaigner for the Presidency or Vice-Presidency who has never gone 'beyond' the House of Representatives in an electoral career.
Mike Huckabee has been a Governor, indeed of a State whence one of the most successful campaigners ever came from despite having few electoral votes in that state. (That of course is Bill Clinton of Arkansas).
The map. Backtracking begins shortly.
Blank map.
()
blue, Republican -- red, Democratic
30% -- lead with 40-49% but a margin of 3% or less
40% -- lead with 40-49% but a margin of 4% or more
60% -- lead with 50-54%
70% -- lead with 55-59%
90% -- lead with 60% or more
Mike Huckabee has been a Governor, indeed of a State whence one of the most successful campaigners ever came from despite having few electoral votes in that state. (That of course is Bill Clinton of Arkansas).
The map. Backtracking begins shortly.
Blank map.
(
blue, Republican -- red, Democratic
30% -- lead with 40-49% but a margin of 3% or less
40% -- lead with 40-49% but a margin of 4% or more
60% -- lead with 50-54%
70% -- lead with 55-59%
90% -- lead with 60% or more
Title: Re: 2016 Official Polling Map Thread
Post by: pbrower2a on March 20, 2014, 12:48:20 PM
Most polls come from PPP (indeed, all but one) and all are from February or March 2014.
Colorado, PPP:
Clinton 48 - Huckabee 41
Louisiana, PPP:
Huckabee- 49% - Clinton- 44%
Kansas, PPP:
Huckabee- 49% Clinton- 42%
Iowa, PPP:
Hillary Clinton.................................................. 46%
Mike Huckabee ............................................... 42%
Christopher Newport University, Virginia:
Clinton 52% Huckabee 37%
Arizona, PPP:
Hillary Clinton... leads Mike Huckabee (47/41)
North Carolina, PPP:
Clinton 49 Huckabee 42
Alaska, PPP:
Huckabee 45% Clinton 41%
Hillary Clinton vs. Mike Huckabee
( )
)
blue, Republican -- red, Democratic
30% -- lead with 40-49% but a margin of 3% or less
40% -- lead with 40-49% but a margin of 4% or more
60% -- lead with 50-54%
70% -- lead with 55-59%
90% -- lead with 60% or more
Colorado, PPP:
Clinton 48 - Huckabee 41
Louisiana, PPP:
Huckabee- 49% - Clinton- 44%
Kansas, PPP:
Huckabee- 49% Clinton- 42%
Iowa, PPP:
Hillary Clinton.................................................. 46%
Mike Huckabee ............................................... 42%
Christopher Newport University, Virginia:
Clinton 52% Huckabee 37%
Arizona, PPP:
Hillary Clinton... leads Mike Huckabee (47/41)
North Carolina, PPP:
Clinton 49 Huckabee 42
Alaska, PPP:
Huckabee 45% Clinton 41%
Hillary Clinton vs. Mike Huckabee
(
blue, Republican -- red, Democratic
30% -- lead with 40-49% but a margin of 3% or less
40% -- lead with 40-49% but a margin of 4% or more
60% -- lead with 50-54%
70% -- lead with 55-59%
90% -- lead with 60% or more
Title: Re: 2016 Official Polling Map Thread
Post by: pbrower2a on March 20, 2014, 01:18:37 PM
I have enough data points for incorporating Mike Huckabee into the four-way contrast. The polls in question include five legitimate swing states:
Iowa, which is at most on the fringe of competition if the Democrat wins the Presidency, and was very close in the last two Democratic losses of the Presidential election (D+3); tipping-point state in 2008
Colorado, very close to the national average in 2008 and 2012 and the tipping point state of 2012 (R+2)
Virginia, which may have gone D in only four Presidential elections since World War II, but will now be close in a close election (R+3)
North Carolina, which needs to be a clear R victory for Republicans to truly have a chance to get elected (R+5)
Arizona, a state whose demographics can hurt the Republicans badly in 2016 (about R+10 in 2008 and 2012, but that could be about R+5 in 2016)
A Republican nominee really needs to win four of these five states (and Florida and Ohio) to have a reasonable chance of winning the Presidency in 2016 -- and the only one of these states that the Republicans can afford to lose is Iowa -- unless he's picking up such states as Minnesota, Wisconsin, Michigan, and Pennsylvania. The map does not rule that out for Huckabee yet, but if he is losing all the states that he is behind in now on Election Day, 2016 he might concede the election before the results come in from the West Coast.
Title: Re: 2016 Official Polling Map Thread
Post by: pbrower2a on March 27, 2014, 06:14:21 AM
Quinnipiac, Virginia:
Secretary Clinton squeaks by New Jersey Gov. Christopher Christie 45 - 41 percent and tops other possible Republican contenders in the 2016 presidential race:
47 - 39 percent over former Florida Gov. Jeb Bush;
48 - 42 percent over U.S. Sen. Rand Paul of Kentucky;
49 - 41 over former Arkansas Gov. Mike Huckabee.
http://www.quinnipiac.edu/institutes-and-centers/polling-institute/virginia/release-detail?ReleaseID=2025
Hillary Clinton vs. Jeb Bush
()
Hillary Clinton vs. Chris Christie
(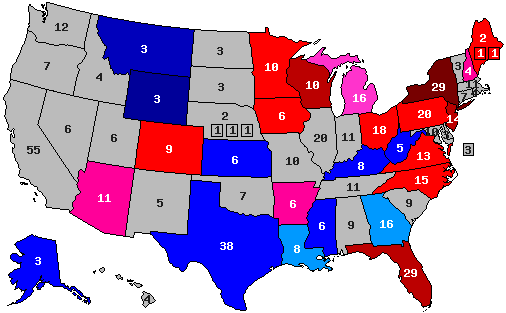 )
)
Hillary Clinton vs. Rand Paul
(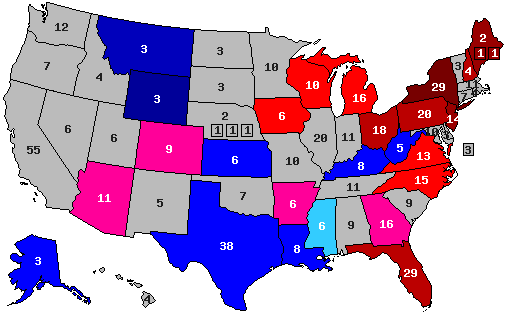 )
)
Hillary Clinton vs. Paul Ryan
(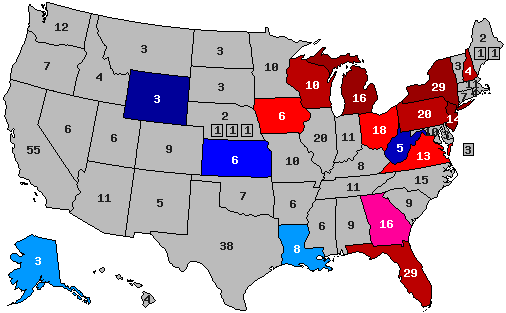 )
)
blue, Republican -- red, Democratic
30% -- lead with 40-49% but a margin of 3% or less
40% -- lead with 40-49% but a margin of 4% or more
60% -- lead with 50-54%
70% -- lead with 55-59%
90% -- lead with 60% or more
Secretary Clinton squeaks by New Jersey Gov. Christopher Christie 45 - 41 percent and tops other possible Republican contenders in the 2016 presidential race:
47 - 39 percent over former Florida Gov. Jeb Bush;
48 - 42 percent over U.S. Sen. Rand Paul of Kentucky;
49 - 41 over former Arkansas Gov. Mike Huckabee.
http://www.quinnipiac.edu/institutes-and-centers/polling-institute/virginia/release-detail?ReleaseID=2025
Hillary Clinton vs. Jeb Bush
(
Hillary Clinton vs. Chris Christie
(
Hillary Clinton vs. Rand Paul
(
Hillary Clinton vs. Paul Ryan
(
blue, Republican -- red, Democratic
30% -- lead with 40-49% but a margin of 3% or less
40% -- lead with 40-49% but a margin of 4% or more
60% -- lead with 50-54%
70% -- lead with 55-59%
90% -- lead with 60% or more
Title: Re: 2016 Official Polling Map Thread
Post by: pbrower2a on March 27, 2014, 06:27:12 AM
In case you didn't put much credibility in a university pollster of Virginia that you may have never heard from, another university pollster (Quinnipiac) that you have heard much of pares a likely Clinton lead over Huckabee.
Secretary Clinton squeaks by New Jersey Gov. Christopher Christie 45 - 41 percent ...
http://www.quinnipiac.edu/institutes-and-centers/polling-institute/virginia/release-detail?ReleaseID=2025
An 8-point lead is fairly close to what Barack Obama did in 2008 and 2012.
... What will it take for me to replace Paul Ryan, who had a disastrous campaign for VP in 2012 and would be running from the House of Representatives whence nobody has successfully campaigned for the Presidency since the 19th century, with Mike Huckabee? Pollsters seem to not be taking Ryan seriously.
A Wisconsin poll that excludes Ryan but has Huckabee?
Mike Huckabee needs not begin an official campaign for a nearly two years yet. He's getting much publicity on FoX "News" Channel, and really can't make an official campaign while having a show on FoX "News". Company policy. He's savvy about media -- savvy enough to avoid hostile audiences for now.
Hillary Clinton vs. Mike Huckabee
(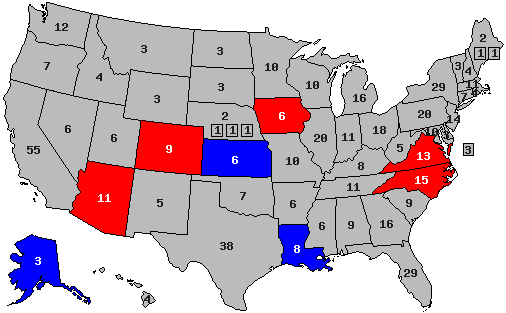 )
)
blue, Republican -- red, Democratic
30% -- lead with 40-49% but a margin of 3% or less
40% -- lead with 40-49% but a margin of 4% or more
60% -- lead with 50-54%
70% -- lead with 55-59%
90% -- lead with 60% or more
Secretary Clinton squeaks by New Jersey Gov. Christopher Christie 45 - 41 percent ...
Quote
49 - 41 over former Arkansas Gov. Mike Huckabee.
http://www.quinnipiac.edu/institutes-and-centers/polling-institute/virginia/release-detail?ReleaseID=2025
An 8-point lead is fairly close to what Barack Obama did in 2008 and 2012.
... What will it take for me to replace Paul Ryan, who had a disastrous campaign for VP in 2012 and would be running from the House of Representatives whence nobody has successfully campaigned for the Presidency since the 19th century, with Mike Huckabee? Pollsters seem to not be taking Ryan seriously.
A Wisconsin poll that excludes Ryan but has Huckabee?
Mike Huckabee needs not begin an official campaign for a nearly two years yet. He's getting much publicity on FoX "News" Channel, and really can't make an official campaign while having a show on FoX "News". Company policy. He's savvy about media -- savvy enough to avoid hostile audiences for now.
Hillary Clinton vs. Mike Huckabee
(
blue, Republican -- red, Democratic
30% -- lead with 40-49% but a margin of 3% or less
40% -- lead with 40-49% but a margin of 4% or more
60% -- lead with 50-54%
70% -- lead with 55-59%
90% -- lead with 60% or more
Title: Re: 2016 Official Polling Map Thread
Post by: eric82oslo on March 27, 2014, 12:08:01 PM
Finally we have a new state which we can happily and proudly add to the list: New Mexico! :) This state, like in the previous two presidential elections, doesn't even look close at this time. Closest to Hillary is their very own and very popular Governor Susana Martinez, yet even she trails her by a whooping 14%. Even more surprising though, a whole 4 Republicans actually outperform Christie in the state, including - believe it or not - Ted Cruz!
We also got the 12th 2016 poll from Virginia that includes Hillary match-ups. And what it kept showing was that Christie remains far ahead of his Republican competitors, which he has been in all other Virginia 2016 polls as well. However, with this poll added, Christie trails Hillary slightly more now in the state, going down from -3.1% to -3.2%.
Despite Hillary's strong numbers though in these two new polls, her predicted 2016 victory in the nation as a whole however remains unchanged at +7.6%.
The total number of state polls added to the lists below has thus now reached 107.
So here they are - all the 2016 poll averages for each state so far - 28 states having been polled to date - and how far off they are compared to the actual 2012 outcomes. I'm only including the Republican candidate with the best statewide polling.
Alaska: Hillary vs Jeb Bush: R +7.5%
+6.5% D improvement
(Updated on February 5, 2014)
Arizona: Hillary vs Bush: R +1%
+8% D improvement
(Updated on March 6, 2014)
Arkansas: Hillary vs Chris Christie: D +2%
+22% D improvement
Current Democratic gain
(Updated on August 11)
Colorado: Hillary vs Paul Ryan: R +3.5%
+8.9% R improvement
Current Republican gain
(Updated on March 20, 2014)
Florida: Hillary vs Bush: D +7.3%
+6.4% D improvement
(Updated on January 31, 2014)
Georgia: Hillary vs Christie: R +2%
+6% D improvement
(Updated August 8 )
Iowa: Hillary vs Christie: D +3.0%
+2.8% R improvement
(Updated on March 13, 2014)
Kansas: Hillary vs Bush: R +9%
+13% D improvement
(Updated on February 24, 2014)
Kentucky: Hillary vs Christie/Bush: R +4%
+19% D improvement
(Updated on December 22)
Louisiana: Hillary vs Mike Huckabee: R +5%
+12% D improvement
(Updated on February 18, 2014)
Maine: Hillary vs Christie: D +8%
+7% R improvement
(Updated on November 13)
Michigan: Hillary vs Christie: D +3.75%
+5.75% R improvement
(Updated on February 14, 2014)
Minnesota: Hillary vs Christie: D +6%
+2% R improvement
(Updated on January 22, 2013)
Mississippi: Hillary vs Christie: R +9%
+2.5% D improvement
(Updated on November 19)
Montana: Hillary vs Rand Paul: R +13%
+1% D improvement
(Updated on November 24)
New Hampshire: Hillary vs Christie: D +3.7%
+1.9% R improvement
(Updated on January 30, 2014)
New Jersey: Hillary vs Christie: D +10.5%
+7.3% R improvement
(Updated on March 4, 2014)
New Mexico: Hillary vs Susana Martinez: D +14%
+4% D improvement
(Updated on March 27, 2014)
New York: Hillary vs Christie: D +28%
+0.2% R improvement
(Updated on March 4, 2014)
North Carolina: Hillary vs Christie: D +0.0%
+2% D improvement
(Updated on March 12, 2014)
Ohio: Hillary vs Christie: D +5.75%
+2.8% D improvement
(Updated on February 20, 2014)
Pennsylvania: Hillary vs Christie: D +1.75%
+3.6% R improvement
(Updated on February 27, 2014)
South Carolina: Hillary vs Marco Rubio: R+7%
+3.5% D improvement
(Updated on November 2)
Texas: Hillary vs Bush: R +5%
+11% D improvement
(Updated on November 8 )
Virginia: Hillary vs Christie: D +3.22%
+0.6% R improvement
(Updated on March 27, 2014)
West Virginia: Hillary vs Bush: R +14%
+13% D improvement
(Updated on October 1)
Wisconsin: Hillary vs Bush: D +4%
+3% R improvement
(Updated on October 29)
Wyoming: Hillary vs Christie: R +28%
+13% D improvement
(Updated on July 23)
Average all 28 states: Hillary vs Best Republican: R +0.25%
+3.7% D improvement (from Obama 2012) [projecting a 7.6% victory for Hillary]
That gives us this map right now:
(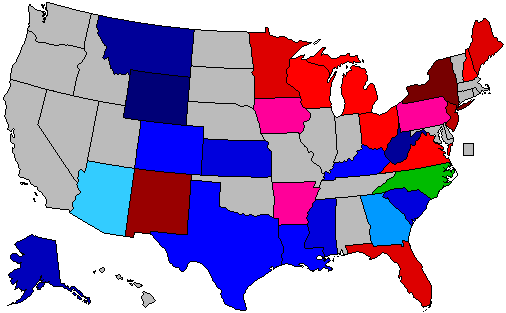 )
)
Red = Democratic lead
Blue = Republican lead
Green = Exact tie
Grey = No polling yet
Green = toss up
20% shade = 0.1-1% lead
30% shade = 1.1-3% lead
40% shade = 3.1-6% lead
50% shade = 6.1-9% lead
60% shade = 9.1-12% lead
70% shade = 12.1-15% lead
80% shade = 15.1-18% lead
90% shade = Above 18.1% lead
In the count of electoral votes, this means the current situation looks like this:
Hillary: 200 EVs (for a total of 14 states)
Best/Tailormade Republican: 114 EVs (for a total of 13 states)
Toss-up: 15 EVs (North Carolina)
No polling: 209 EVs [almost half, including California] (for a total of 22 states + D.C.)
Which means that Hillary has captured a rather impressive 60.8% of all EVs awarded thus far, against a more or less disappointing 34.65% EVs for the tailormade Republican. (The remaining 4.55% are North Carolina's toss-up territory.) And only New York, Maine and New Jersey of the solidly Democratic states have been polled so far, against no less than 12 solidly Republican states - the biggest one of them, Texas, included. With California added to Hillary's pie, it'll look even more promising for her. Neither to forget such states as D.C., Vermont, Hawaii & Maryland. It's looking like a landslide right now, even without Colorado being in Hillary's column.
This is how the Trendline Map looks so far:
(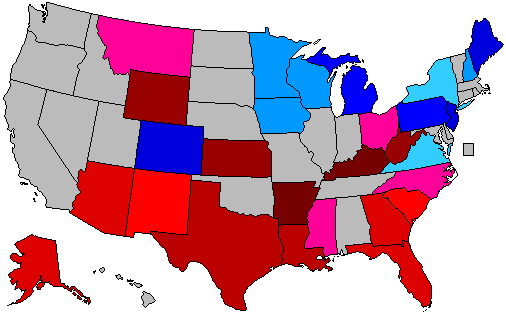 )
)
The states which right now are showing the strongest improvement for the Democratic (Hillary) or the Republican candidate (in 16 out of 28 cases, Christie is that person):
1. Arkansas: D +22%
2. Kentucky: D +19%
3. Kansas: D +13%
4. West Virginia: D +13%
5. Wyoming: D +13%
6. Louisiana: D +12%
7. Texas: D +11%
8. Colorado: R +8.9%
9. Arizona: D +8%
10. New Jersey: R +7.3%
11. Maine: R +7%
12. Alaska: D +6.5%
13. Florida: D +6.4%
14. Georgia: D +6%
15. Michigan: R +5.75%
All of these changes (in the 15 states above) are (more than) statistically significant. We see that (so far) Texas is experiencing a much more rapid change than other demographically quick-changing states like Florida and Georgia, yet even Arizona is changing very rapidly.
The whole list of states having been polled till now, going from Democratic stronghold to Republican stronghold:
New York: D +28%
New Mexico: D +14%
New Jersey: D +10.5%
Maine: D +8%
Currently estimated/projected national average: D +7.6%
Florida: D +7.3%
Minnesota: D +6%
Ohio: D +5.75%
Wisconsin: D +4%
Michigan: D +3.75%
New Hampshire: D +3.7%
Virginia: D +3.2%
Iowa: D +3.0%
Arkansas: D +2%
Pennsylvania: D +1.75%
North Carolina: D +0.0%
Arizona: R +1%
Georgia: R +2%
Colorado: R +3.5%
Kentucky: R +4%
Louisiana: R +5%
Texas: R +5%
South Carolina: R +7%
Alaska: R +7.5%
Mississippi: R +9%
Kansas: R +9%
Montana: R +13%
West Virginia: R +14%
Wyoming: R +28%
8 states are currently way too close to call; Virginia, Iowa, Arkansas & Pennsylvania (all leaning towards Hillary), the toss up state of North Carolina, plus Arizona, Georgia & Colorado (all leaning Republican).
Here are the current stats on Republican candidates:
1. Chris Christie favoured in 16 of 28 states
2. Jeb Bush favoured in 8 states (Texas (!), Florida, Wisconsin (!!), Arizona, Kentucky (!!), Kansas, West Virginia & Alaska)
3. Paul Ryan favoured in 1 state (Colorado)
4. Marco Rubio favoured in 1 state (South Carolina)
5. Mike Huckabee favoured in 1 state (Louisiana)
6. Susana Martinez favoured in 1 state (New Mexico)
7. Rand Paul favoured in 1 state (Montana)
Current update as of March 27.
We also got the 12th 2016 poll from Virginia that includes Hillary match-ups. And what it kept showing was that Christie remains far ahead of his Republican competitors, which he has been in all other Virginia 2016 polls as well. However, with this poll added, Christie trails Hillary slightly more now in the state, going down from -3.1% to -3.2%.
Despite Hillary's strong numbers though in these two new polls, her predicted 2016 victory in the nation as a whole however remains unchanged at +7.6%.
The total number of state polls added to the lists below has thus now reached 107.
So here they are - all the 2016 poll averages for each state so far - 28 states having been polled to date - and how far off they are compared to the actual 2012 outcomes. I'm only including the Republican candidate with the best statewide polling.
Alaska: Hillary vs Jeb Bush: R +7.5%
+6.5% D improvement
(Updated on February 5, 2014)
Arizona: Hillary vs Bush: R +1%
+8% D improvement
(Updated on March 6, 2014)
Arkansas: Hillary vs Chris Christie: D +2%
+22% D improvement
Current Democratic gain
(Updated on August 11)
Colorado: Hillary vs Paul Ryan: R +3.5%
+8.9% R improvement
Current Republican gain
(Updated on March 20, 2014)
Florida: Hillary vs Bush: D +7.3%
+6.4% D improvement
(Updated on January 31, 2014)
Georgia: Hillary vs Christie: R +2%
+6% D improvement
(Updated August 8 )
Iowa: Hillary vs Christie: D +3.0%
+2.8% R improvement
(Updated on March 13, 2014)
Kansas: Hillary vs Bush: R +9%
+13% D improvement
(Updated on February 24, 2014)
Kentucky: Hillary vs Christie/Bush: R +4%
+19% D improvement
(Updated on December 22)
Louisiana: Hillary vs Mike Huckabee: R +5%
+12% D improvement
(Updated on February 18, 2014)
Maine: Hillary vs Christie: D +8%
+7% R improvement
(Updated on November 13)
Michigan: Hillary vs Christie: D +3.75%
+5.75% R improvement
(Updated on February 14, 2014)
Minnesota: Hillary vs Christie: D +6%
+2% R improvement
(Updated on January 22, 2013)
Mississippi: Hillary vs Christie: R +9%
+2.5% D improvement
(Updated on November 19)
Montana: Hillary vs Rand Paul: R +13%
+1% D improvement
(Updated on November 24)
New Hampshire: Hillary vs Christie: D +3.7%
+1.9% R improvement
(Updated on January 30, 2014)
New Jersey: Hillary vs Christie: D +10.5%
+7.3% R improvement
(Updated on March 4, 2014)
New Mexico: Hillary vs Susana Martinez: D +14%
+4% D improvement
(Updated on March 27, 2014)
New York: Hillary vs Christie: D +28%
+0.2% R improvement
(Updated on March 4, 2014)
North Carolina: Hillary vs Christie: D +0.0%
+2% D improvement
(Updated on March 12, 2014)
Ohio: Hillary vs Christie: D +5.75%
+2.8% D improvement
(Updated on February 20, 2014)
Pennsylvania: Hillary vs Christie: D +1.75%
+3.6% R improvement
(Updated on February 27, 2014)
South Carolina: Hillary vs Marco Rubio: R+7%
+3.5% D improvement
(Updated on November 2)
Texas: Hillary vs Bush: R +5%
+11% D improvement
(Updated on November 8 )
Virginia: Hillary vs Christie: D +3.22%
+0.6% R improvement
(Updated on March 27, 2014)
West Virginia: Hillary vs Bush: R +14%
+13% D improvement
(Updated on October 1)
Wisconsin: Hillary vs Bush: D +4%
+3% R improvement
(Updated on October 29)
Wyoming: Hillary vs Christie: R +28%
+13% D improvement
(Updated on July 23)
Average all 28 states: Hillary vs Best Republican: R +0.25%
+3.7% D improvement (from Obama 2012) [projecting a 7.6% victory for Hillary]
That gives us this map right now:
(
Red = Democratic lead
Blue = Republican lead
Green = Exact tie
Grey = No polling yet
Green = toss up
20% shade = 0.1-1% lead
30% shade = 1.1-3% lead
40% shade = 3.1-6% lead
50% shade = 6.1-9% lead
60% shade = 9.1-12% lead
70% shade = 12.1-15% lead
80% shade = 15.1-18% lead
90% shade = Above 18.1% lead
In the count of electoral votes, this means the current situation looks like this:
Hillary: 200 EVs (for a total of 14 states)
Best/Tailormade Republican: 114 EVs (for a total of 13 states)
Toss-up: 15 EVs (North Carolina)
No polling: 209 EVs [almost half, including California] (for a total of 22 states + D.C.)
Which means that Hillary has captured a rather impressive 60.8% of all EVs awarded thus far, against a more or less disappointing 34.65% EVs for the tailormade Republican. (The remaining 4.55% are North Carolina's toss-up territory.) And only New York, Maine and New Jersey of the solidly Democratic states have been polled so far, against no less than 12 solidly Republican states - the biggest one of them, Texas, included. With California added to Hillary's pie, it'll look even more promising for her. Neither to forget such states as D.C., Vermont, Hawaii & Maryland. It's looking like a landslide right now, even without Colorado being in Hillary's column.
This is how the Trendline Map looks so far:
(
The states which right now are showing the strongest improvement for the Democratic (Hillary) or the Republican candidate (in 16 out of 28 cases, Christie is that person):
1. Arkansas: D +22%
2. Kentucky: D +19%
3. Kansas: D +13%
4. West Virginia: D +13%
5. Wyoming: D +13%
6. Louisiana: D +12%
7. Texas: D +11%
8. Colorado: R +8.9%
9. Arizona: D +8%
10. New Jersey: R +7.3%
11. Maine: R +7%
12. Alaska: D +6.5%
13. Florida: D +6.4%
14. Georgia: D +6%
15. Michigan: R +5.75%
All of these changes (in the 15 states above) are (more than) statistically significant. We see that (so far) Texas is experiencing a much more rapid change than other demographically quick-changing states like Florida and Georgia, yet even Arizona is changing very rapidly.
The whole list of states having been polled till now, going from Democratic stronghold to Republican stronghold:
New York: D +28%
New Mexico: D +14%
New Jersey: D +10.5%
Maine: D +8%
Currently estimated/projected national average: D +7.6%
Florida: D +7.3%
Minnesota: D +6%
Ohio: D +5.75%
Wisconsin: D +4%
Michigan: D +3.75%
New Hampshire: D +3.7%
Virginia: D +3.2%
Iowa: D +3.0%
Arkansas: D +2%
Pennsylvania: D +1.75%
North Carolina: D +0.0%
Arizona: R +1%
Georgia: R +2%
Colorado: R +3.5%
Kentucky: R +4%
Louisiana: R +5%
Texas: R +5%
South Carolina: R +7%
Alaska: R +7.5%
Mississippi: R +9%
Kansas: R +9%
Montana: R +13%
West Virginia: R +14%
Wyoming: R +28%
8 states are currently way too close to call; Virginia, Iowa, Arkansas & Pennsylvania (all leaning towards Hillary), the toss up state of North Carolina, plus Arizona, Georgia & Colorado (all leaning Republican).
Here are the current stats on Republican candidates:
1. Chris Christie favoured in 16 of 28 states
2. Jeb Bush favoured in 8 states (Texas (!), Florida, Wisconsin (!!), Arizona, Kentucky (!!), Kansas, West Virginia & Alaska)
3. Paul Ryan favoured in 1 state (Colorado)
4. Marco Rubio favoured in 1 state (South Carolina)
5. Mike Huckabee favoured in 1 state (Louisiana)
6. Susana Martinez favoured in 1 state (New Mexico)
7. Rand Paul favoured in 1 state (Montana)
Current update as of March 27.
Title: Re: 2016 Official Polling Map Thread
Post by: pbrower2a on March 27, 2014, 06:54:03 PM
Quote
Martinez would trail Hillary Clinton 53/39 in a hypothetical contest in the state. That does make her the strongest potential Republican candidate though. Clinton would also lead Rand Paul 51/36, Jeb Bush 53/37, Ted Cruz 54/37, Chris Christie 53/35, and Mike Huckabee 55/34. New Mexico hasn't been close in the last two Presidential elections and if Clinton runs that trend looks likely to continue in 2016.
http://www.publicpolicypolling.com/main/2014/03/new-mexico-miscellany.html
Hillary Clinton vs. Jeb Bush
(
Hillary Clinton vs. Chris Christie
(
Hillary Clinton vs. Rand Paul
(
Hillary Clinton vs. Paul Ryan
(
blue, Republican -- red, Democratic
30% -- lead with 40-49% but a margin of 3% or less
40% -- lead with 40-49% but a margin of 4% or more
60% -- lead with 50-54%
70% -- lead with 55-59%
90% -- lead with 60% or more
Title: Re: 2016 Official Polling Map Thread
Post by: pbrower2a on March 27, 2014, 07:00:06 PM
New Mexico, PPP -- and Huckabee is not doing well there. Of course, New Mexico is no longer a legitimate swing state.
Hillary Clinton vs. Mike Huckabee
(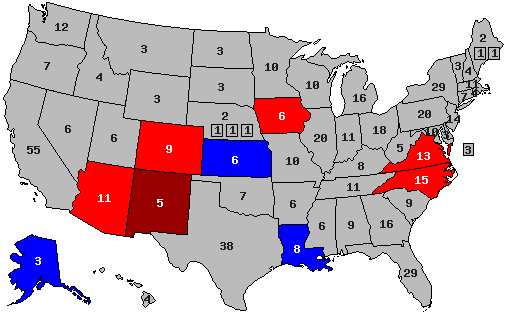 )
)
blue, Republican -- red, Democratic
30% -- lead with 40-49% but a margin of 3% or less
40% -- lead with 40-49% but a margin of 4% or more
60% -- lead with 50-54%
70% -- lead with 55-59%
90% -- lead with 60% or more
Hillary Clinton vs. Mike Huckabee
(
blue, Republican -- red, Democratic
30% -- lead with 40-49% but a margin of 3% or less
40% -- lead with 40-49% but a margin of 4% or more
60% -- lead with 50-54%
70% -- lead with 55-59%
90% -- lead with 60% or more
Title: Re: 2016 Official Polling Map Thread
Post by: pbrower2a on March 27, 2014, 07:02:52 PM
Shall I replace the map for Ryan with the map for Huckabee?
Title: Re: 2016 Official Polling Map Thread
Post by: pbrower2a on March 28, 2014, 05:31:36 AM
Shall I replace the map for Ryan with the map for Huckabee?
I think that would be a good idea. Ryan does not seem to be viable, but at least Huckabee has chance.
I concur. All in all, someone can be an ex-governor, go into the media as a political outsider, and win the Presidency by winning support as a conservative critic of liberals (Carter) and people 'not conservative enough' (Ford). That's what Ronald Reagan did. Arkansas is not too small to have a current or former Governor become President (Bill Clinton did that). Obviously I am not saying that Mike Huckabee would do as well in a Presidential campaign as either. I can imagine him winning the nomination, which is enough.
With Paul Ryan I have problems. Recent nominees for VP who have done badly in their one opportunity generally don't get nominated for President. William Miller? Sargent Shriver? Geraldine Ferraro? Sarah Palin? We all saw what sort of campaigner he was in 2012; as the chance for winning the Presidency waned he started defending his House seat.
He has never won a statewide election in his own state. Successful candidates for the Presidency and Vice- Presidency since 1960 have all done so before such runs. (Dick Cheney won for the at-large Congressional district of Wyoming, so that qualifies him on this criterion). I would have to qualify him as having won a statewide election in Wisconsin had he won Wisconsin as a VP nominee. Heck, George H W Bush had won all three states that he was associated in 1980 and 1984 -- his birth state (Maine, reliably D in Presidential elections after 1988), the state in which he spend his childhood years and college career (Connecticut, likewise), and the state in which he had some business and political career (Texas, not a sure thing for Republicans until 2000). The elder Bush at least had some impressive diplomatic and Cabinet posts.
With a comparatively-safe seat he may be interested in power in the House. He's more likely to become Speaker of the House than President of the United States, and that is arguably the second-most powerful office in the US government.
Finally he is not a war hero, so he could never turn a war record into Presidential success despite never holding statewide office as did Dwight Eisenhower.
I haven't seen many recent polls for Ryan but I have seen some for Huckabee. Those for Ryan are getting old even if there are more for him than for Huckabee. I see two precedents for Mike Huckabee becoming President of the United States (Reagan! Clinton!) and none for Paul Ryan.
Here's what a set of maps with Huckabee but not Ryan would look like:
Hillary Clinton vs. Jeb Bush
(
Hillary Clinton vs. Chris Christie
(
Hillary Clinton vs. Mike Huckabee
(
Hillary Clinton vs. Rand Paul
(
blue, Republican -- red, Democratic
30% -- lead with 40-49% but a margin of 3% or less
40% -- lead with 40-49% but a margin of 4% or more
60% -- lead with 50-54%
70% -- lead with 55-59%
90% -- lead with 60% or more
Title: Re: 2016 Official Polling Map Thread
Post by: pbrower2a on April 09, 2014, 02:54:03 PM
Quote
-It looks like Michigan will remain solidly in the blue column if Hillary Clinton runs for President in 2016. She leads her potential Republican opponents in the state by anywhere from 9 to 12 points: it's 46/37 over Chris Christie, 48/39 over Rand Paul, 49/38 over Jeb Bush, and 50/38 over Mike Huckabee.
http://www.publicpolicypolling.com/main/2014/04/michigan-miscellany.html
Basically, Hillary Clinton would win Michigan much as Obama did in 2012. The narrow lead that she seemed to have over Christie has ballooned significantly, and no Republican seems to now have much of a chance to win the State's 16 electoral votes in 2016 against her. Huckabee really has no chance here.
In other news, Michigan is Detroit Tiger country... and Tiger fans expect to see a big Cat Show in October as the end of the baseball season.
PPP no longer shows Paul Ryan in Michigan
Hillary Clinton vs. Jeb Bush
(
Hillary Clinton vs. Chris Christie
(
Hillary Clinton vs. Mike Huckabee
(
Hillary Clinton vs. Rand Paul
(
blue, Republican -- red, Democratic
30% -- lead with 40-49% but a margin of 3% or less
40% -- lead with 40-49% but a margin of 4% or more
60% -- lead with 50-54%
70% -- lead with 55-59%
90% -- lead with 60% or more
Title: Re: 2016 Official Polling Map Thread
Post by: eric82oslo on April 09, 2014, 04:23:12 PM
With Michigan's 7th 2016 match-up poll, Hillary is able to expand further her lead in the state - although not by astronomical values. Her four previous match-ups with Christie in the state were very tight, thus Hillary is only expanding from a +3.75% to a +4.8% lead.
The total number of state polls added to the lists below has thus now reached 108.
So here they are - all the 2016 poll averages for each state so far - 28 states having been polled to date - and how far off they are compared to the actual 2012 outcomes. I'm only including the Republican candidate with the best statewide polling.
Alaska: Hillary vs Jeb Bush: R +7.5%
+6.5% D improvement
(Updated on February 5, 2014)
Arizona: Hillary vs Bush: R +1%
+8% D improvement
(Updated on March 6, 2014)
Arkansas: Hillary vs Chris Christie: D +2%
+22% D improvement
Current Democratic gain
(Updated on August 11)
Colorado: Hillary vs Paul Ryan: R +3.5%
+8.9% R improvement
Current Republican gain
(Updated on March 20, 2014)
Florida: Hillary vs Bush: D +7.3%
+6.4% D improvement
(Updated on January 31, 2014)
Georgia: Hillary vs Christie: R +2%
+6% D improvement
(Updated August 8 )
Iowa: Hillary vs Christie: D +3.0%
+2.8% R improvement
(Updated on March 13, 2014)
Kansas: Hillary vs Bush: R +9%
+13% D improvement
(Updated on February 24, 2014)
Kentucky: Hillary vs Christie/Bush: R +4%
+19% D improvement
(Updated on December 22)
Louisiana: Hillary vs Mike Huckabee: R +5%
+12% D improvement
(Updated on February 18, 2014)
Maine: Hillary vs Christie: D +8%
+7% R improvement
(Updated on November 13)
Michigan: Hillary vs Christie: D +4.8%
+4.7% R improvement
(Updated on April 9, 2014)
Minnesota: Hillary vs Christie: D +6%
+2% R improvement
(Updated on January 22, 2013)
Mississippi: Hillary vs Christie: R +9%
+2.5% D improvement
(Updated on November 19)
Montana: Hillary vs Rand Paul: R +13%
+1% D improvement
(Updated on November 24)
New Hampshire: Hillary vs Christie: D +3.7%
+1.9% R improvement
(Updated on January 30, 2014)
New Jersey: Hillary vs Christie: D +10.5%
+7.3% R improvement
(Updated on March 4, 2014)
New Mexico: Hillary vs Susana Martinez: D +14%
+4% D improvement
(Updated on March 27, 2014)
New York: Hillary vs Christie: D +28%
+0.2% R improvement
(Updated on March 4, 2014)
North Carolina: Hillary vs Christie: D +0.0%
+2% D improvement
(Updated on March 12, 2014)
Ohio: Hillary vs Christie: D +5.75%
+2.8% D improvement
(Updated on February 20, 2014)
Pennsylvania: Hillary vs Christie: D +1.75%
+3.6% R improvement
(Updated on February 27, 2014)
South Carolina: Hillary vs Marco Rubio: R+7%
+3.5% D improvement
(Updated on November 2)
Texas: Hillary vs Bush: R +5%
+11% D improvement
(Updated on November 8 )
Virginia: Hillary vs Christie: D +3.22%
+0.6% R improvement
(Updated on March 27, 2014)
West Virginia: Hillary vs Bush: R +14%
+13% D improvement
(Updated on October 1)
Wisconsin: Hillary vs Bush: D +4%
+3% R improvement
(Updated on October 29)
Wyoming: Hillary vs Christie: R +28%
+13% D improvement
(Updated on July 23)
Average all 28 states: Hillary vs Best Republican: R +0.2%
+3.7% D improvement (from Obama 2012) [projecting a 7.6% victory for Hillary]
That gives us this map right now:
()
Red = Democratic lead
Blue = Republican lead
Green = Exact tie
Grey = No polling yet
Green = toss up
20% shade = 0.1-1% lead
30% shade = 1.1-3% lead
40% shade = 3.1-6% lead
50% shade = 6.1-9% lead
60% shade = 9.1-12% lead
70% shade = 12.1-15% lead
80% shade = 15.1-18% lead
90% shade = Above 18.1% lead
In the count of electoral votes, this means the current situation looks like this:
Hillary: 200 EVs (for a total of 14 states)
Best/Tailormade Republican: 114 EVs (for a total of 13 states)
Toss-up: 15 EVs (North Carolina)
No polling: 209 EVs [almost half, including California] (for a total of 22 states + D.C.)
Which means that Hillary has captured a rather impressive 60.8% of all EVs awarded thus far, against a more or less disappointing 34.65% EVs for the tailormade Republican. (The remaining 4.55% are North Carolina's toss-up territory.) And only New York, Maine and New Jersey of the solidly Democratic states have been polled so far, against no less than 12 solidly Republican states - the biggest one of them, Texas, included. With California added to Hillary's pie, it'll look even more promising for her. Neither to forget such states as D.C., Vermont, Hawaii & Maryland. It's looking like a landslide right now, even without Colorado being in Hillary's column.
This is how the Trendline Map looks so far:
()
The states which right now are showing the strongest improvement for the Democratic (Hillary) or the Republican candidate (in 16 out of 28 cases, Christie is that person):
1. Arkansas: D +22%
2. Kentucky: D +19%
3. Kansas: D +13%
4. West Virginia: D +13%
5. Wyoming: D +13%
6. Louisiana: D +12%
7. Texas: D +11%
8. Colorado: R +8.9%
9. Arizona: D +8%
10. New Jersey: R +7.3%
11. Maine: R +7%
12. Alaska: D +6.5%
13. Florida: D +6.4%
14. Georgia: D +6%
15. Michigan: R +4.7%
All of these changes (in the 15 states above) are (more than) statistically significant. We see that (so far) Texas is experiencing a much more rapid change than other demographically quick-changing states like Florida and Georgia, yet even Arizona is changing very rapidly.
The whole list of states having been polled till now, going from Democratic stronghold to Republican stronghold:
New York: D +28%
New Mexico: D +14%
New Jersey: D +10.5%
Maine: D +8%
Currently estimated/projected national average: D +7.6%
Florida: D +7.3%
Minnesota: D +6%
Ohio: D +5.75%
Michigan: D +4.8%
Wisconsin: D +4%
New Hampshire: D +3.7%
Virginia: D +3.2%
Iowa: D +3.0%
Arkansas: D +2%
Pennsylvania: D +1.75%
North Carolina: D +0.0%
Arizona: R +1%
Georgia: R +2%
Colorado: R +3.5%
Kentucky: R +4%
Louisiana: R +5%
Texas: R +5%
South Carolina: R +7%
Alaska: R +7.5%
Mississippi: R +9%
Kansas: R +9%
Montana: R +13%
West Virginia: R +14%
Wyoming: R +28%
8 states are currently way too close to call; Virginia, Iowa, Arkansas & Pennsylvania (all leaning towards Hillary), the toss up state of North Carolina, plus Arizona, Georgia & Colorado (all leaning Republican).
Here are the current stats on Republican candidates:
1. Chris Christie favoured in 16 of 28 states
2. Jeb Bush favoured in 8 states (Texas (!), Florida, Wisconsin (!!), Arizona, Kentucky (!!), Kansas, West Virginia & Alaska)
3. Paul Ryan favoured in 1 state (Colorado)
4. Marco Rubio favoured in 1 state (South Carolina)
5. Mike Huckabee favoured in 1 state (Louisiana)
6. Susana Martinez favoured in 1 state (New Mexico)
7. Rand Paul favoured in 1 state (Montana)
Current update as of April 9.
The total number of state polls added to the lists below has thus now reached 108.
So here they are - all the 2016 poll averages for each state so far - 28 states having been polled to date - and how far off they are compared to the actual 2012 outcomes. I'm only including the Republican candidate with the best statewide polling.
Alaska: Hillary vs Jeb Bush: R +7.5%
+6.5% D improvement
(Updated on February 5, 2014)
Arizona: Hillary vs Bush: R +1%
+8% D improvement
(Updated on March 6, 2014)
Arkansas: Hillary vs Chris Christie: D +2%
+22% D improvement
Current Democratic gain
(Updated on August 11)
Colorado: Hillary vs Paul Ryan: R +3.5%
+8.9% R improvement
Current Republican gain
(Updated on March 20, 2014)
Florida: Hillary vs Bush: D +7.3%
+6.4% D improvement
(Updated on January 31, 2014)
Georgia: Hillary vs Christie: R +2%
+6% D improvement
(Updated August 8 )
Iowa: Hillary vs Christie: D +3.0%
+2.8% R improvement
(Updated on March 13, 2014)
Kansas: Hillary vs Bush: R +9%
+13% D improvement
(Updated on February 24, 2014)
Kentucky: Hillary vs Christie/Bush: R +4%
+19% D improvement
(Updated on December 22)
Louisiana: Hillary vs Mike Huckabee: R +5%
+12% D improvement
(Updated on February 18, 2014)
Maine: Hillary vs Christie: D +8%
+7% R improvement
(Updated on November 13)
Michigan: Hillary vs Christie: D +4.8%
+4.7% R improvement
(Updated on April 9, 2014)
Minnesota: Hillary vs Christie: D +6%
+2% R improvement
(Updated on January 22, 2013)
Mississippi: Hillary vs Christie: R +9%
+2.5% D improvement
(Updated on November 19)
Montana: Hillary vs Rand Paul: R +13%
+1% D improvement
(Updated on November 24)
New Hampshire: Hillary vs Christie: D +3.7%
+1.9% R improvement
(Updated on January 30, 2014)
New Jersey: Hillary vs Christie: D +10.5%
+7.3% R improvement
(Updated on March 4, 2014)
New Mexico: Hillary vs Susana Martinez: D +14%
+4% D improvement
(Updated on March 27, 2014)
New York: Hillary vs Christie: D +28%
+0.2% R improvement
(Updated on March 4, 2014)
North Carolina: Hillary vs Christie: D +0.0%
+2% D improvement
(Updated on March 12, 2014)
Ohio: Hillary vs Christie: D +5.75%
+2.8% D improvement
(Updated on February 20, 2014)
Pennsylvania: Hillary vs Christie: D +1.75%
+3.6% R improvement
(Updated on February 27, 2014)
South Carolina: Hillary vs Marco Rubio: R+7%
+3.5% D improvement
(Updated on November 2)
Texas: Hillary vs Bush: R +5%
+11% D improvement
(Updated on November 8 )
Virginia: Hillary vs Christie: D +3.22%
+0.6% R improvement
(Updated on March 27, 2014)
West Virginia: Hillary vs Bush: R +14%
+13% D improvement
(Updated on October 1)
Wisconsin: Hillary vs Bush: D +4%
+3% R improvement
(Updated on October 29)
Wyoming: Hillary vs Christie: R +28%
+13% D improvement
(Updated on July 23)
Average all 28 states: Hillary vs Best Republican: R +0.2%
+3.7% D improvement (from Obama 2012) [projecting a 7.6% victory for Hillary]
That gives us this map right now:
(
Red = Democratic lead
Blue = Republican lead
Green = Exact tie
Grey = No polling yet
Green = toss up
20% shade = 0.1-1% lead
30% shade = 1.1-3% lead
40% shade = 3.1-6% lead
50% shade = 6.1-9% lead
60% shade = 9.1-12% lead
70% shade = 12.1-15% lead
80% shade = 15.1-18% lead
90% shade = Above 18.1% lead
In the count of electoral votes, this means the current situation looks like this:
Hillary: 200 EVs (for a total of 14 states)
Best/Tailormade Republican: 114 EVs (for a total of 13 states)
Toss-up: 15 EVs (North Carolina)
No polling: 209 EVs [almost half, including California] (for a total of 22 states + D.C.)
Which means that Hillary has captured a rather impressive 60.8% of all EVs awarded thus far, against a more or less disappointing 34.65% EVs for the tailormade Republican. (The remaining 4.55% are North Carolina's toss-up territory.) And only New York, Maine and New Jersey of the solidly Democratic states have been polled so far, against no less than 12 solidly Republican states - the biggest one of them, Texas, included. With California added to Hillary's pie, it'll look even more promising for her. Neither to forget such states as D.C., Vermont, Hawaii & Maryland. It's looking like a landslide right now, even without Colorado being in Hillary's column.
This is how the Trendline Map looks so far:
(
The states which right now are showing the strongest improvement for the Democratic (Hillary) or the Republican candidate (in 16 out of 28 cases, Christie is that person):
1. Arkansas: D +22%
2. Kentucky: D +19%
3. Kansas: D +13%
4. West Virginia: D +13%
5. Wyoming: D +13%
6. Louisiana: D +12%
7. Texas: D +11%
8. Colorado: R +8.9%
9. Arizona: D +8%
10. New Jersey: R +7.3%
11. Maine: R +7%
12. Alaska: D +6.5%
13. Florida: D +6.4%
14. Georgia: D +6%
15. Michigan: R +4.7%
All of these changes (in the 15 states above) are (more than) statistically significant. We see that (so far) Texas is experiencing a much more rapid change than other demographically quick-changing states like Florida and Georgia, yet even Arizona is changing very rapidly.
The whole list of states having been polled till now, going from Democratic stronghold to Republican stronghold:
New York: D +28%
New Mexico: D +14%
New Jersey: D +10.5%
Maine: D +8%
Currently estimated/projected national average: D +7.6%
Florida: D +7.3%
Minnesota: D +6%
Ohio: D +5.75%
Michigan: D +4.8%
Wisconsin: D +4%
New Hampshire: D +3.7%
Virginia: D +3.2%
Iowa: D +3.0%
Arkansas: D +2%
Pennsylvania: D +1.75%
North Carolina: D +0.0%
Arizona: R +1%
Georgia: R +2%
Colorado: R +3.5%
Kentucky: R +4%
Louisiana: R +5%
Texas: R +5%
South Carolina: R +7%
Alaska: R +7.5%
Mississippi: R +9%
Kansas: R +9%
Montana: R +13%
West Virginia: R +14%
Wyoming: R +28%
8 states are currently way too close to call; Virginia, Iowa, Arkansas & Pennsylvania (all leaning towards Hillary), the toss up state of North Carolina, plus Arizona, Georgia & Colorado (all leaning Republican).
Here are the current stats on Republican candidates:
1. Chris Christie favoured in 16 of 28 states
2. Jeb Bush favoured in 8 states (Texas (!), Florida, Wisconsin (!!), Arizona, Kentucky (!!), Kansas, West Virginia & Alaska)
3. Paul Ryan favoured in 1 state (Colorado)
4. Marco Rubio favoured in 1 state (South Carolina)
5. Mike Huckabee favoured in 1 state (Louisiana)
6. Susana Martinez favoured in 1 state (New Mexico)
7. Rand Paul favoured in 1 state (Montana)
Current update as of April 9.
Title: Re: 2016 Official Polling Map Thread
Post by: pbrower2a on April 09, 2014, 08:30:22 PM
Eric -- you might as well recognize that the pollsters are no longer asking about Paul Ryan as a Presidential candidate. The Colorado poll involving Paul Ryan is very old and now likely irrelevant.
I think that Ryan is seeking power within the House either in leadership on a committee of his choosing or as Speaker of the House. Huckabee seems more relevant to pollsters now. Rand Paul may excite the Libertarian culture in Colorado enough to make the state close but even he can't give the state to the GOP.
PPP may release a poll on North Carolina this week; it will be polling Texas next week.
Title: Re: 2016 Official Polling Map Thread
Post by: eric82oslo on April 10, 2014, 04:41:49 PM
Eric -- you might as well recognize that the pollsters are no longer asking about Paul Ryan as a Presidential candidate. The Colorado poll involving Paul Ryan is very old and now likely irrelevant.
I think that Ryan is seeking power within the House either in leadership on a committee of his choosing or as Speaker of the House. Huckabee seems more relevant to pollsters now. Rand Paul may excite the Libertarian culture in Colorado enough to make the state close but even he can't give the state to the GOP.
I think that Ryan is seeking power within the House either in leadership on a committee of his choosing or as Speaker of the House. Huckabee seems more relevant to pollsters now. Rand Paul may excite the Libertarian culture in Colorado enough to make the state close but even he can't give the state to the GOP.
Last time Ryan was polled in Colorado was February 2 this year, only two months ago, so it's certainly too early to remove him completely. Qunnipiac has included him in their two most recent Colorado polls, while PPP has never included him even once in Colorado.
Title: Re: 2016 Official Polling Map Thread
Post by: eric82oslo on April 10, 2014, 04:59:49 PM
PPP has just released their 7th North Carolina 2016 match-ups poll, including the 6th straight to include both Christie and Bush. Those are also the two candidates who makes by far the strongest race against Hillary in the state. Hillary has for the very first time opened a lead against all GOP candidates, including a very slim 0.33% lead over Christie. At second best we find Jeb Bush, trailing her by only 2.2% on average.
The total number of state polls added to the lists below has thus now reached 109.
So here they are - all the 2016 poll averages for each state so far - 28 states having been polled to date - and how far off they are compared to the actual 2012 outcomes. I'm only including the Republican candidate with the best statewide polling.
Alaska: Hillary vs Jeb Bush: R +7.5%
+6.5% D improvement
(Updated on February 5, 2014)
Arizona: Hillary vs Bush: R +1%
+8% D improvement
(Updated on March 6, 2014)
Arkansas: Hillary vs Chris Christie: D +2%
+22% D improvement
Current Democratic gain
(Updated on August 11)
Colorado: Hillary vs Paul Ryan: R +3.5%
+8.9% R improvement
Current Republican gain
(Updated on March 20, 2014)
Florida: Hillary vs Bush: D +7.3%
+6.4% D improvement
(Updated on January 31, 2014)
Georgia: Hillary vs Christie: R +2%
+6% D improvement
(Updated August 8 )
Iowa: Hillary vs Christie: D +3.0%
+2.8% R improvement
(Updated on March 13, 2014)
Kansas: Hillary vs Bush: R +9%
+13% D improvement
(Updated on February 24, 2014)
Kentucky: Hillary vs Christie/Bush: R +4%
+19% D improvement
(Updated on December 22)
Louisiana: Hillary vs Mike Huckabee: R +5%
+12% D improvement
(Updated on February 18, 2014)
Maine: Hillary vs Christie: D +8%
+7% R improvement
(Updated on November 13)
Michigan: Hillary vs Christie: D +4.8%
+4.7% R improvement
(Updated on April 9, 2014)
Minnesota: Hillary vs Christie: D +6%
+2% R improvement
(Updated on January 22, 2013)
Mississippi: Hillary vs Christie: R +9%
+2.5% D improvement
(Updated on November 19)
Montana: Hillary vs Rand Paul: R +13%
+1% D improvement
(Updated on November 24)
New Hampshire: Hillary vs Christie: D +3.7%
+1.9% R improvement
(Updated on January 30, 2014)
New Jersey: Hillary vs Christie: D +10.5%
+7.3% R improvement
(Updated on March 4, 2014)
New Mexico: Hillary vs Susana Martinez: D +14%
+4% D improvement
(Updated on March 27, 2014)
New York: Hillary vs Christie: D +28%
+0.2% R improvement
(Updated on March 4, 2014)
North Carolina: Hillary vs Christie: D +0.33%
+2.4% D improvement
Current Democratic gain
(Updated on April 10, 2014)
Ohio: Hillary vs Christie: D +5.75%
+2.8% D improvement
(Updated on February 20, 2014)
Pennsylvania: Hillary vs Christie: D +1.75%
+3.6% R improvement
(Updated on February 27, 2014)
South Carolina: Hillary vs Marco Rubio: R+7%
+3.5% D improvement
(Updated on November 2)
Texas: Hillary vs Bush: R +5%
+11% D improvement
(Updated on November 8 )
Virginia: Hillary vs Christie: D +3.22%
+0.6% R improvement
(Updated on March 27, 2014)
West Virginia: Hillary vs Bush: R +14%
+13% D improvement
(Updated on October 1)
Wisconsin: Hillary vs Bush: D +4%
+3% R improvement
(Updated on October 29)
Wyoming: Hillary vs Christie: R +28%
+13% D improvement
(Updated on July 23)
Average all 28 states: Hillary vs Best Republican: R +0.2%
+3.7% D improvement (from Obama 2012) [projecting a 7.6% victory for Hillary]
That gives us this map right now:
(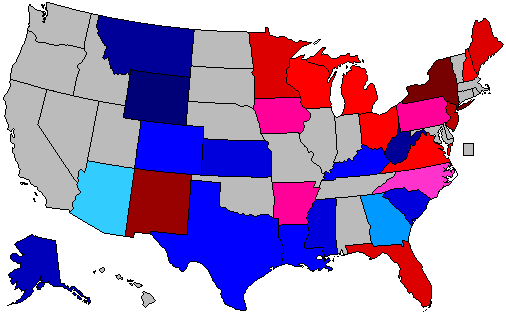 )
)
Red = Democratic lead
Blue = Republican lead
Green = Exact tie
Grey = No polling yet
Green = toss up
20% shade = 0.1-1% lead
30% shade = 1.1-3% lead
40% shade = 3.1-6% lead
50% shade = 6.1-9% lead
60% shade = 9.1-12% lead
70% shade = 12.1-15% lead
80% shade = 15.1-18% lead
90% shade = Above 18.1% lead
In the count of electoral votes, this means the current situation looks like this:
Hillary: 215 EVs (for a total of 15 states)
Best/Tailormade Republican: 114 EVs (for a total of 13 states)
Toss-up: None
No polling: 209 EVs [almost half, including California] (for a total of 22 states + D.C.)
Which means that Hillary has captured a rather impressive 65.35% of all EVs awarded thus far, against a more or less disappointing 34.65% EVs for the tailormade Republican. (The remaining 4.55% are North Carolina's toss-up territory.) And only New York, Maine and New Jersey of the solidly Democratic states have been polled so far, against no less than 12 solidly Republican states - the biggest one of them, Texas, included. With California added to Hillary's pie, it'll look even more promising for her. Neither to forget such states as D.C., Vermont, Hawaii & Maryland. It's looking like a landslide right now, even without Colorado being in Hillary's column.
This is how the Trendline Map looks so far:
()
The states which right now are showing the strongest improvement for the Democratic (Hillary) or the Republican candidate (in 16 out of 28 cases, Christie is that person):
1. Arkansas: D +22%
2. Kentucky: D +19%
3. Kansas: D +13%
4. West Virginia: D +13%
5. Wyoming: D +13%
6. Louisiana: D +12%
7. Texas: D +11%
8. Colorado: R +8.9%
9. Arizona: D +8%
10. New Jersey: R +7.3%
11. Maine: R +7%
12. Alaska: D +6.5%
13. Florida: D +6.4%
14. Georgia: D +6%
15. Michigan: R +4.7%
All of these changes (in the 15 states above) are (more than) statistically significant. We see that (so far) Texas is experiencing a much more rapid change than other demographically quick-changing states like Florida and Georgia, yet even Arizona is changing very rapidly.
The whole list of states having been polled till now, going from Democratic stronghold to Republican stronghold:
New York: D +28%
New Mexico: D +14%
New Jersey: D +10.5%
Maine: D +8%
Currently estimated/projected national average: D +7.6%
Florida: D +7.3%
Minnesota: D +6%
Ohio: D +5.75%
Michigan: D +4.8%
Wisconsin: D +4%
New Hampshire: D +3.7%
Virginia: D +3.2%
Iowa: D +3.0%
Arkansas: D +2%
Pennsylvania: D +1.75%
North Carolina: D +0.3%
Arizona: R +1%
Georgia: R +2%
Colorado: R +3.5%
Kentucky: R +4%
Louisiana: R +5%
Texas: R +5%
South Carolina: R +7%
Alaska: R +7.5%
Mississippi: R +9%
Kansas: R +9%
Montana: R +13%
West Virginia: R +14%
Wyoming: R +28%
8 states are currently way too close to call; Virginia, Iowa, Arkansas, Pennsylvania & North Carolina (all leaning towards Hillary), as well as Arizona, Georgia & Colorado (all leaning Republican).
Here are the current stats on Republican candidates:
1. Chris Christie favoured in 16 of 28 states
2. Jeb Bush favoured in 8 states (Texas (!), Florida, Wisconsin (!!), Arizona, Kentucky (!!), Kansas, West Virginia & Alaska)
3. Paul Ryan favoured in 1 state (Colorado)
4. Marco Rubio favoured in 1 state (South Carolina)
5. Mike Huckabee favoured in 1 state (Louisiana)
6. Susana Martinez favoured in 1 state (New Mexico)
7. Rand Paul favoured in 1 state (Montana)
Current update as of April 10.
The total number of state polls added to the lists below has thus now reached 109.
So here they are - all the 2016 poll averages for each state so far - 28 states having been polled to date - and how far off they are compared to the actual 2012 outcomes. I'm only including the Republican candidate with the best statewide polling.
Alaska: Hillary vs Jeb Bush: R +7.5%
+6.5% D improvement
(Updated on February 5, 2014)
Arizona: Hillary vs Bush: R +1%
+8% D improvement
(Updated on March 6, 2014)
Arkansas: Hillary vs Chris Christie: D +2%
+22% D improvement
Current Democratic gain
(Updated on August 11)
Colorado: Hillary vs Paul Ryan: R +3.5%
+8.9% R improvement
Current Republican gain
(Updated on March 20, 2014)
Florida: Hillary vs Bush: D +7.3%
+6.4% D improvement
(Updated on January 31, 2014)
Georgia: Hillary vs Christie: R +2%
+6% D improvement
(Updated August 8 )
Iowa: Hillary vs Christie: D +3.0%
+2.8% R improvement
(Updated on March 13, 2014)
Kansas: Hillary vs Bush: R +9%
+13% D improvement
(Updated on February 24, 2014)
Kentucky: Hillary vs Christie/Bush: R +4%
+19% D improvement
(Updated on December 22)
Louisiana: Hillary vs Mike Huckabee: R +5%
+12% D improvement
(Updated on February 18, 2014)
Maine: Hillary vs Christie: D +8%
+7% R improvement
(Updated on November 13)
Michigan: Hillary vs Christie: D +4.8%
+4.7% R improvement
(Updated on April 9, 2014)
Minnesota: Hillary vs Christie: D +6%
+2% R improvement
(Updated on January 22, 2013)
Mississippi: Hillary vs Christie: R +9%
+2.5% D improvement
(Updated on November 19)
Montana: Hillary vs Rand Paul: R +13%
+1% D improvement
(Updated on November 24)
New Hampshire: Hillary vs Christie: D +3.7%
+1.9% R improvement
(Updated on January 30, 2014)
New Jersey: Hillary vs Christie: D +10.5%
+7.3% R improvement
(Updated on March 4, 2014)
New Mexico: Hillary vs Susana Martinez: D +14%
+4% D improvement
(Updated on March 27, 2014)
New York: Hillary vs Christie: D +28%
+0.2% R improvement
(Updated on March 4, 2014)
North Carolina: Hillary vs Christie: D +0.33%
+2.4% D improvement
Current Democratic gain
(Updated on April 10, 2014)
Ohio: Hillary vs Christie: D +5.75%
+2.8% D improvement
(Updated on February 20, 2014)
Pennsylvania: Hillary vs Christie: D +1.75%
+3.6% R improvement
(Updated on February 27, 2014)
South Carolina: Hillary vs Marco Rubio: R+7%
+3.5% D improvement
(Updated on November 2)
Texas: Hillary vs Bush: R +5%
+11% D improvement
(Updated on November 8 )
Virginia: Hillary vs Christie: D +3.22%
+0.6% R improvement
(Updated on March 27, 2014)
West Virginia: Hillary vs Bush: R +14%
+13% D improvement
(Updated on October 1)
Wisconsin: Hillary vs Bush: D +4%
+3% R improvement
(Updated on October 29)
Wyoming: Hillary vs Christie: R +28%
+13% D improvement
(Updated on July 23)
Average all 28 states: Hillary vs Best Republican: R +0.2%
+3.7% D improvement (from Obama 2012) [projecting a 7.6% victory for Hillary]
That gives us this map right now:
(
Red = Democratic lead
Blue = Republican lead
Green = Exact tie
Grey = No polling yet
Green = toss up
20% shade = 0.1-1% lead
30% shade = 1.1-3% lead
40% shade = 3.1-6% lead
50% shade = 6.1-9% lead
60% shade = 9.1-12% lead
70% shade = 12.1-15% lead
80% shade = 15.1-18% lead
90% shade = Above 18.1% lead
In the count of electoral votes, this means the current situation looks like this:
Hillary: 215 EVs (for a total of 15 states)
Best/Tailormade Republican: 114 EVs (for a total of 13 states)
Toss-up: None
No polling: 209 EVs [almost half, including California] (for a total of 22 states + D.C.)
Which means that Hillary has captured a rather impressive 65.35% of all EVs awarded thus far, against a more or less disappointing 34.65% EVs for the tailormade Republican. (The remaining 4.55% are North Carolina's toss-up territory.) And only New York, Maine and New Jersey of the solidly Democratic states have been polled so far, against no less than 12 solidly Republican states - the biggest one of them, Texas, included. With California added to Hillary's pie, it'll look even more promising for her. Neither to forget such states as D.C., Vermont, Hawaii & Maryland. It's looking like a landslide right now, even without Colorado being in Hillary's column.
This is how the Trendline Map looks so far:
(
The states which right now are showing the strongest improvement for the Democratic (Hillary) or the Republican candidate (in 16 out of 28 cases, Christie is that person):
1. Arkansas: D +22%
2. Kentucky: D +19%
3. Kansas: D +13%
4. West Virginia: D +13%
5. Wyoming: D +13%
6. Louisiana: D +12%
7. Texas: D +11%
8. Colorado: R +8.9%
9. Arizona: D +8%
10. New Jersey: R +7.3%
11. Maine: R +7%
12. Alaska: D +6.5%
13. Florida: D +6.4%
14. Georgia: D +6%
15. Michigan: R +4.7%
All of these changes (in the 15 states above) are (more than) statistically significant. We see that (so far) Texas is experiencing a much more rapid change than other demographically quick-changing states like Florida and Georgia, yet even Arizona is changing very rapidly.
The whole list of states having been polled till now, going from Democratic stronghold to Republican stronghold:
New York: D +28%
New Mexico: D +14%
New Jersey: D +10.5%
Maine: D +8%
Currently estimated/projected national average: D +7.6%
Florida: D +7.3%
Minnesota: D +6%
Ohio: D +5.75%
Michigan: D +4.8%
Wisconsin: D +4%
New Hampshire: D +3.7%
Virginia: D +3.2%
Iowa: D +3.0%
Arkansas: D +2%
Pennsylvania: D +1.75%
North Carolina: D +0.3%
Arizona: R +1%
Georgia: R +2%
Colorado: R +3.5%
Kentucky: R +4%
Louisiana: R +5%
Texas: R +5%
South Carolina: R +7%
Alaska: R +7.5%
Mississippi: R +9%
Kansas: R +9%
Montana: R +13%
West Virginia: R +14%
Wyoming: R +28%
8 states are currently way too close to call; Virginia, Iowa, Arkansas, Pennsylvania & North Carolina (all leaning towards Hillary), as well as Arizona, Georgia & Colorado (all leaning Republican).
Here are the current stats on Republican candidates:
1. Chris Christie favoured in 16 of 28 states
2. Jeb Bush favoured in 8 states (Texas (!), Florida, Wisconsin (!!), Arizona, Kentucky (!!), Kansas, West Virginia & Alaska)
3. Paul Ryan favoured in 1 state (Colorado)
4. Marco Rubio favoured in 1 state (South Carolina)
5. Mike Huckabee favoured in 1 state (Louisiana)
6. Susana Martinez favoured in 1 state (New Mexico)
7. Rand Paul favoured in 1 state (Montana)
Current update as of April 10.
Title: Re: 2016 Official Polling Map Thread
Post by: GaussLaw on April 10, 2014, 07:22:40 PM
I'm new here, so this question may sound dumb.
But when you say Christie is "favored" in so-and-so many states, does that mean he leads in the primary in those states or that he performs the best against Hillary in those states?
But when you say Christie is "favored" in so-and-so many states, does that mean he leads in the primary in those states or that he performs the best against Hillary in those states?
Title: Re: 2016 Official Polling Map Thread
Post by: eric82oslo on April 10, 2014, 07:43:56 PM
I'm new here, so this question may sound dumb.
But when you say Christie is "favored" in so-and-so many states, does that mean he leads in the primary in those states or that he performs the best against Hillary in those states?
But when you say Christie is "favored" in so-and-so many states, does that mean he leads in the primary in those states or that he performs the best against Hillary in those states?
The last one, that he performs better against Hillary in the state than the other Republican candidates where we have match-ups available. :)
Title: Re: 2016 Official Polling Map Thread
Post by: pbrower2a on April 10, 2014, 08:20:34 PM
PPP, NC
http://www.publicpolicypolling.com/main/2014/04/north-carolina-miscellany.html#more
Hillary Clinton vs. Jeb Bush
(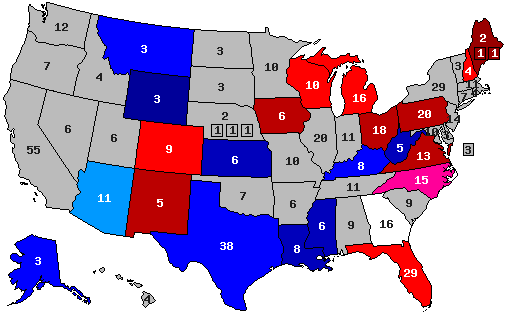 )
)
Hillary Clinton vs. Chris Christie
(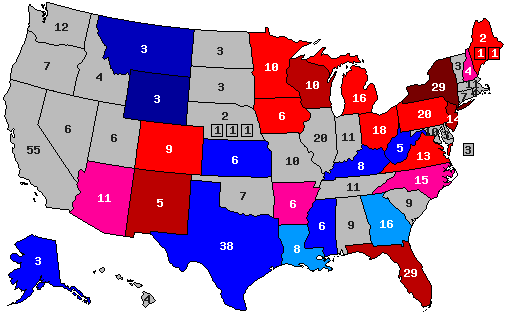 )
)
Hillary Clinton vs. Mike Huckabee
(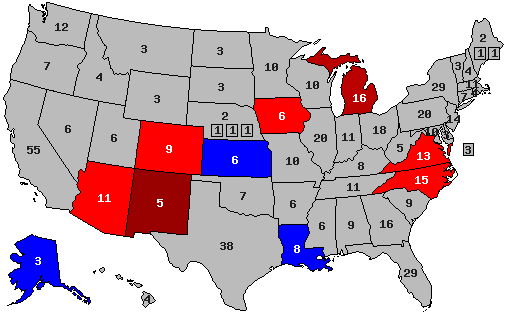 )
)
Hillary Clinton vs. Rand Paul
(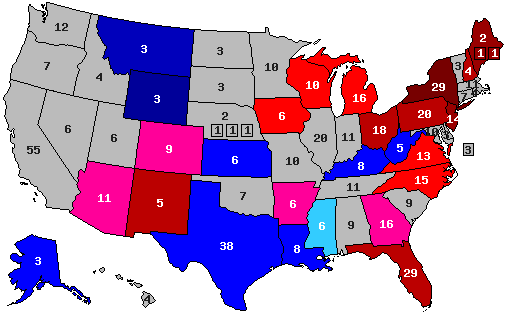 )
)
blue, Republican -- red, Democratic
30% -- lead with 40-49% but a margin of 3% or less
40% -- lead with 40-49% but a margin of 4% or more
60% -- lead with 50-54%
70% -- lead with 55-59%
90% -- lead with 60% or more
Quote
PPP continues to find that North Carolina is likely to maintain its new found swing state status in 2016 if Hillary Clinton is the Democratic candidate for President. Clinton leads all of her potential Republican opponents in the state by small margins- it's 45/44 over Jeb Bush, 46/44 over Chris Christie, 47/43 over Rand Paul, and 48/43 over Mike Huckabee. Huckabee is the first choice of Republican voters in the state- 22% say they'd like him as the nominee to 18% for Jeb Bush, 12% each for Chris Christie and Ted Cruz, 9% each for Rand Paul and Paul Ryan, 7% for Scott Walker, 5% for Marco Rubio, and 2% for Bobby Jindal. Huckabee leads based on his strength with 'very conservative' voters, while Bush does better with moderates.
http://www.publicpolicypolling.com/main/2014/04/north-carolina-miscellany.html#more
Hillary Clinton vs. Jeb Bush
(
Hillary Clinton vs. Chris Christie
(
Hillary Clinton vs. Mike Huckabee
(
Hillary Clinton vs. Rand Paul
(
blue, Republican -- red, Democratic
30% -- lead with 40-49% but a margin of 3% or less
40% -- lead with 40-49% but a margin of 4% or more
60% -- lead with 50-54%
70% -- lead with 55-59%
90% -- lead with 60% or more
Title: Re: 2016 Official Polling Map Thread
Post by: pbrower2a on April 17, 2014, 11:54:42 AM
PPP, Texas:
Paul- 50%
Clinton- 40%
Huckabee- 50%
Clinton- 42%
Bush- 50%
Clinton- 42%
Cruz- 50%
Clinton- 43%
Perry- 49%
Clinton- 44%
Christie- 44%
Clinton- 42%
Hillary would bring Texas closer than any Democrat in the 21st century. Safe R.
http://www.publicpolicypolling.com/main/2014/04/ted-cruz-most-popular-in-texas.html
PPP will have polls for Wisconsin next week. It might show how well two potential favorite sons would do.
Hillary Clinton vs. Jeb Bush
(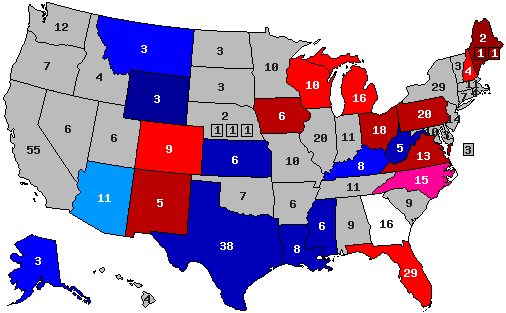 )
)
Hillary Clinton vs. Chris Christie
(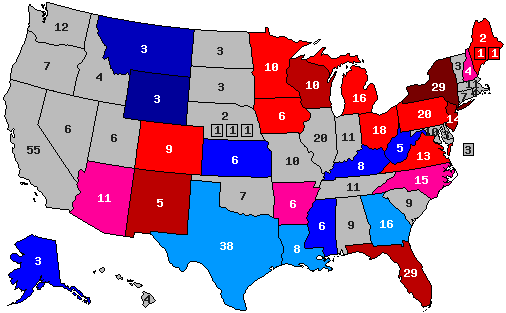 )
)
Hillary Clinton vs. Mike Huckabee
(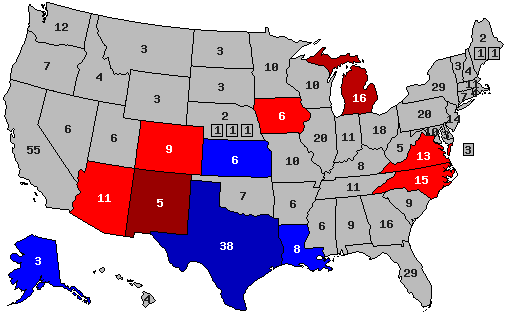 )
)
Hillary Clinton vs. Rand Paul
( )
)
blue, Republican -- red, Democratic
30% -- lead with 40-49% but a margin of 3% or less
40% -- lead with 40-49% but a margin of 4% or more
60% -- lead with 50-54%
70% -- lead with 55-59%
90% -- lead with 60% or more
Paul- 50%
Clinton- 40%
Huckabee- 50%
Clinton- 42%
Bush- 50%
Clinton- 42%
Cruz- 50%
Clinton- 43%
Perry- 49%
Clinton- 44%
Christie- 44%
Clinton- 42%
Hillary would bring Texas closer than any Democrat in the 21st century. Safe R.
http://www.publicpolicypolling.com/main/2014/04/ted-cruz-most-popular-in-texas.html
PPP will have polls for Wisconsin next week. It might show how well two potential favorite sons would do.
Hillary Clinton vs. Jeb Bush
(
Hillary Clinton vs. Chris Christie
(
Hillary Clinton vs. Mike Huckabee
(
Hillary Clinton vs. Rand Paul
(
blue, Republican -- red, Democratic
30% -- lead with 40-49% but a margin of 3% or less
40% -- lead with 40-49% but a margin of 4% or more
60% -- lead with 50-54%
70% -- lead with 55-59%
90% -- lead with 60% or more
Title: Re: 2016 Official Polling Map Thread
Post by: eric82oslo on April 17, 2014, 10:41:08 PM
PPP has released its 4th Texas poll on 2016, Mike Huckabee being included for the very first time in state polling there. Of the 7 GOP candidates who have been tested in Texas, Hillary right now just leads two of them; Rick Perry and Marco Rubio. On average, the 3 strongest GOP contenders in the state seem right now to be Huckabee (+8%), Rand Paul (+7%) and Jeb Bush (+6%). This means that Huckabee replaces Jeb Bush in Texas and that the Republican advantage there increases from +5% to +8%. Which is still, of course, just half as strong a number as Romney managed in 2012. By trumping Bush in the crucial/big state of Texas, Huckabee is now the 3rd best positioned candidate on the Republican side after (still overwhelming favourites) Christie and Bush.
The total number of state polls added to the lists below has thus now reached 110.
So here they are - all the 2016 poll averages for each state so far - 28 states having been polled to date - and how far off they are compared to the actual 2012 outcomes. I'm only including the Republican candidate with the best statewide polling.
Alaska: Hillary vs Jeb Bush: R +7.5%
+6.5% D improvement
(Updated on February 5, 2014)
Arizona: Hillary vs Bush: R +1%
+8% D improvement
(Updated on March 6, 2014)
Arkansas: Hillary vs Chris Christie: D +2%
+22% D improvement
Current Democratic gain
(Updated on August 11)
Colorado: Hillary vs Paul Ryan: R +3.5%
+8.9% R improvement
Current Republican gain
(Updated on March 20, 2014)
Florida: Hillary vs Bush: D +7.3%
+6.4% D improvement
(Updated on January 31, 2014)
Georgia: Hillary vs Christie: R +2%
+6% D improvement
(Updated August 8 )
Iowa: Hillary vs Christie: D +3.0%
+2.8% R improvement
(Updated on March 13, 2014)
Kansas: Hillary vs Bush: R +9%
+13% D improvement
(Updated on February 24, 2014)
Kentucky: Hillary vs Christie/Bush: R +4%
+19% D improvement
(Updated on December 22)
Louisiana: Hillary vs Mike Huckabee: R +5%
+12% D improvement
(Updated on February 18, 2014)
Maine: Hillary vs Christie: D +8%
+7% R improvement
(Updated on November 13)
Michigan: Hillary vs Christie: D +4.8%
+4.7% R improvement
(Updated on April 9, 2014)
Minnesota: Hillary vs Christie: D +6%
+2% R improvement
(Updated on January 22, 2013)
Mississippi: Hillary vs Christie: R +9%
+2.5% D improvement
(Updated on November 19)
Montana: Hillary vs Rand Paul: R +13%
+1% D improvement
(Updated on November 24)
New Hampshire: Hillary vs Christie: D +3.7%
+1.9% R improvement
(Updated on January 30, 2014)
New Jersey: Hillary vs Christie: D +10.5%
+7.3% R improvement
(Updated on March 4, 2014)
New Mexico: Hillary vs Susana Martinez: D +14%
+4% D improvement
(Updated on March 27, 2014)
New York: Hillary vs Christie: D +28%
+0.2% R improvement
(Updated on March 4, 2014)
North Carolina: Hillary vs Christie: D +0.33%
+2.4% D improvement
Current Democratic gain
(Updated on April 10, 2014)
Ohio: Hillary vs Christie: D +5.75%
+2.8% D improvement
(Updated on February 20, 2014)
Pennsylvania: Hillary vs Christie: D +1.75%
+3.6% R improvement
(Updated on February 27, 2014)
South Carolina: Hillary vs Marco Rubio: R+7%
+3.5% D improvement
(Updated on November 2)
Texas: Hillary vs Huckabee: R +8%
+8% D improvement
(Updated on April 18, 2014)
Virginia: Hillary vs Christie: D +3.22%
+0.6% R improvement
(Updated on March 27, 2014)
West Virginia: Hillary vs Bush: R +14%
+13% D improvement
(Updated on October 1)
Wisconsin: Hillary vs Bush: D +4%
+3% R improvement
(Updated on October 29)
Wyoming: Hillary vs Christie: R +28%
+13% D improvement
(Updated on July 23)
Average all 28 states: Hillary vs Best Republican: R +0.3%
+3.6% D improvement (from Obama 2012) [projecting a 7.5% victory for Hillary]
That gives us this map right now:
( )
)
Red = Democratic lead
Blue = Republican lead
Green = Exact tie
Grey = No polling yet
Green = toss up
20% shade = 0.1-1% lead
30% shade = 1.1-3% lead
40% shade = 3.1-6% lead
50% shade = 6.1-9% lead
60% shade = 9.1-12% lead
70% shade = 12.1-15% lead
80% shade = 15.1-18% lead
90% shade = Above 18.1% lead
In the count of electoral votes, this means the current situation looks like this:
Hillary: 215 EVs (for a total of 15 states)
Best/Tailormade Republican: 114 EVs (for a total of 13 states)
Toss-up: None
No polling: 209 EVs [almost half, including California] (for a total of 22 states + D.C.)
Which means that Hillary has captured a rather impressive 65.35% of all EVs awarded thus far, against a more or less disappointing 34.65% EVs for the tailormade Republican. (The remaining 4.55% are North Carolina's toss-up territory.) And only New York, Maine and New Jersey of the solidly Democratic states have been polled so far, against no less than 12 solidly Republican states - the biggest one of them, Texas, included. With California added to Hillary's pie, it'll look even more promising for her. Neither to forget such states as D.C., Vermont, Hawaii & Maryland. It's looking like a landslide right now, even without Colorado being in Hillary's column.
This is how the Trendline Map looks so far:
(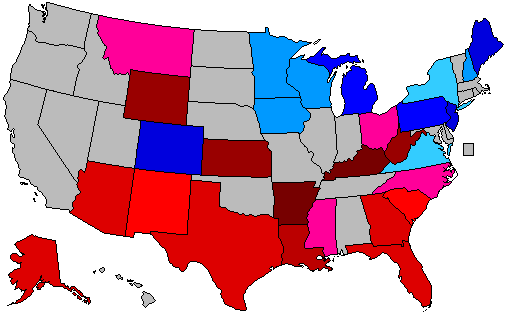 )
)
The states which right now are showing the strongest improvement for the Democratic (Hillary) or the Republican candidate (in 16 out of 28 cases, Christie is that person):
1. Arkansas: D +22%
2. Kentucky: D +19%
3. Kansas: D +13%
4. West Virginia: D +13%
5. Wyoming: D +13%
6. Louisiana: D +12%
7. Colorado: R +8.9%
8. Arizona: D +8%
8. Texas: D +8%
10. New Jersey: R +7.3%
11. Maine: R +7%
12. Alaska: D +6.5%
13. Florida: D +6.4%
14. Georgia: D +6%
15. Michigan: R +4.7%
All of these changes (in the 15 states above) are (more than) statistically significant. It's almost shocking to see how much a switch from Obama to Hillary would mean for the states of Arkansas and Colorado. As of now, Hillary has had more than a 30% better swing in Arkansas than in Colorado, meaning that if current poll averages where to become the actual 2016 outcome, Hillary could actually perform up to 5.5% stronger in Arkansas than Colorado. However, they're not completely compatible as Paul Ryan currently polls best in Colorado, while Christie is ahead in Arkansas.
The whole list of states having been polled till now, going from Democratic stronghold to Republican stronghold:
New York: D +28%
New Mexico: D +14%
New Jersey: D +10.5%
Maine: D +8%
Currently estimated/projected national average: D +7.5%
Florida: D +7.3%
Minnesota: D +6%
Ohio: D +5.75%
Michigan: D +4.8%
Wisconsin: D +4%
New Hampshire: D +3.7%
Virginia: D +3.2%
Iowa: D +3.0%
Arkansas: D +2%
Pennsylvania: D +1.75%
North Carolina: D +0.3%
Arizona: R +1%
Georgia: R +2%
Colorado: R +3.5%
Kentucky: R +4%
Louisiana: R +5%
South Carolina: R +7%
Alaska: R +7.5%
Texas: R +8%
Mississippi: R +9%
Kansas: R +9%
Montana: R +13%
West Virginia: R +14%
Wyoming: R +28%
8 states are currently way too close to call; Virginia, Iowa, Arkansas, Pennsylvania & North Carolina (all leaning towards Hillary), as well as Arizona, Georgia & Colorado (all leaning Republican).
Here are the current stats on Republican candidates:
1. Chris Christie favoured in 16 of 28 states
2. Jeb Bush favoured in 7 states (Florida, Wisconsin (!!), Arizona, Kentucky (!!), Kansas, West Virginia & Alaska)
3. Mike Huckabee in 2 states (Texas (!) & Louisiana (!))
4. Paul Ryan favoured in 1 state (Colorado)
5. Marco Rubio favoured in 1 state (South Carolina)
6. Susana Martinez favoured in 1 state (New Mexico)
7. Rand Paul favoured in 1 state (Montana)
Current update as of April 18.
The total number of state polls added to the lists below has thus now reached 110.
So here they are - all the 2016 poll averages for each state so far - 28 states having been polled to date - and how far off they are compared to the actual 2012 outcomes. I'm only including the Republican candidate with the best statewide polling.
Alaska: Hillary vs Jeb Bush: R +7.5%
+6.5% D improvement
(Updated on February 5, 2014)
Arizona: Hillary vs Bush: R +1%
+8% D improvement
(Updated on March 6, 2014)
Arkansas: Hillary vs Chris Christie: D +2%
+22% D improvement
Current Democratic gain
(Updated on August 11)
Colorado: Hillary vs Paul Ryan: R +3.5%
+8.9% R improvement
Current Republican gain
(Updated on March 20, 2014)
Florida: Hillary vs Bush: D +7.3%
+6.4% D improvement
(Updated on January 31, 2014)
Georgia: Hillary vs Christie: R +2%
+6% D improvement
(Updated August 8 )
Iowa: Hillary vs Christie: D +3.0%
+2.8% R improvement
(Updated on March 13, 2014)
Kansas: Hillary vs Bush: R +9%
+13% D improvement
(Updated on February 24, 2014)
Kentucky: Hillary vs Christie/Bush: R +4%
+19% D improvement
(Updated on December 22)
Louisiana: Hillary vs Mike Huckabee: R +5%
+12% D improvement
(Updated on February 18, 2014)
Maine: Hillary vs Christie: D +8%
+7% R improvement
(Updated on November 13)
Michigan: Hillary vs Christie: D +4.8%
+4.7% R improvement
(Updated on April 9, 2014)
Minnesota: Hillary vs Christie: D +6%
+2% R improvement
(Updated on January 22, 2013)
Mississippi: Hillary vs Christie: R +9%
+2.5% D improvement
(Updated on November 19)
Montana: Hillary vs Rand Paul: R +13%
+1% D improvement
(Updated on November 24)
New Hampshire: Hillary vs Christie: D +3.7%
+1.9% R improvement
(Updated on January 30, 2014)
New Jersey: Hillary vs Christie: D +10.5%
+7.3% R improvement
(Updated on March 4, 2014)
New Mexico: Hillary vs Susana Martinez: D +14%
+4% D improvement
(Updated on March 27, 2014)
New York: Hillary vs Christie: D +28%
+0.2% R improvement
(Updated on March 4, 2014)
North Carolina: Hillary vs Christie: D +0.33%
+2.4% D improvement
Current Democratic gain
(Updated on April 10, 2014)
Ohio: Hillary vs Christie: D +5.75%
+2.8% D improvement
(Updated on February 20, 2014)
Pennsylvania: Hillary vs Christie: D +1.75%
+3.6% R improvement
(Updated on February 27, 2014)
South Carolina: Hillary vs Marco Rubio: R+7%
+3.5% D improvement
(Updated on November 2)
Texas: Hillary vs Huckabee: R +8%
+8% D improvement
(Updated on April 18, 2014)
Virginia: Hillary vs Christie: D +3.22%
+0.6% R improvement
(Updated on March 27, 2014)
West Virginia: Hillary vs Bush: R +14%
+13% D improvement
(Updated on October 1)
Wisconsin: Hillary vs Bush: D +4%
+3% R improvement
(Updated on October 29)
Wyoming: Hillary vs Christie: R +28%
+13% D improvement
(Updated on July 23)
Average all 28 states: Hillary vs Best Republican: R +0.3%
+3.6% D improvement (from Obama 2012) [projecting a 7.5% victory for Hillary]
That gives us this map right now:
(
Red = Democratic lead
Blue = Republican lead
Green = Exact tie
Grey = No polling yet
Green = toss up
20% shade = 0.1-1% lead
30% shade = 1.1-3% lead
40% shade = 3.1-6% lead
50% shade = 6.1-9% lead
60% shade = 9.1-12% lead
70% shade = 12.1-15% lead
80% shade = 15.1-18% lead
90% shade = Above 18.1% lead
In the count of electoral votes, this means the current situation looks like this:
Hillary: 215 EVs (for a total of 15 states)
Best/Tailormade Republican: 114 EVs (for a total of 13 states)
Toss-up: None
No polling: 209 EVs [almost half, including California] (for a total of 22 states + D.C.)
Which means that Hillary has captured a rather impressive 65.35% of all EVs awarded thus far, against a more or less disappointing 34.65% EVs for the tailormade Republican. (The remaining 4.55% are North Carolina's toss-up territory.) And only New York, Maine and New Jersey of the solidly Democratic states have been polled so far, against no less than 12 solidly Republican states - the biggest one of them, Texas, included. With California added to Hillary's pie, it'll look even more promising for her. Neither to forget such states as D.C., Vermont, Hawaii & Maryland. It's looking like a landslide right now, even without Colorado being in Hillary's column.
This is how the Trendline Map looks so far:
(
The states which right now are showing the strongest improvement for the Democratic (Hillary) or the Republican candidate (in 16 out of 28 cases, Christie is that person):
1. Arkansas: D +22%
2. Kentucky: D +19%
3. Kansas: D +13%
4. West Virginia: D +13%
5. Wyoming: D +13%
6. Louisiana: D +12%
7. Colorado: R +8.9%
8. Arizona: D +8%
8. Texas: D +8%
10. New Jersey: R +7.3%
11. Maine: R +7%
12. Alaska: D +6.5%
13. Florida: D +6.4%
14. Georgia: D +6%
15. Michigan: R +4.7%
All of these changes (in the 15 states above) are (more than) statistically significant. It's almost shocking to see how much a switch from Obama to Hillary would mean for the states of Arkansas and Colorado. As of now, Hillary has had more than a 30% better swing in Arkansas than in Colorado, meaning that if current poll averages where to become the actual 2016 outcome, Hillary could actually perform up to 5.5% stronger in Arkansas than Colorado. However, they're not completely compatible as Paul Ryan currently polls best in Colorado, while Christie is ahead in Arkansas.
The whole list of states having been polled till now, going from Democratic stronghold to Republican stronghold:
New York: D +28%
New Mexico: D +14%
New Jersey: D +10.5%
Maine: D +8%
Currently estimated/projected national average: D +7.5%
Florida: D +7.3%
Minnesota: D +6%
Ohio: D +5.75%
Michigan: D +4.8%
Wisconsin: D +4%
New Hampshire: D +3.7%
Virginia: D +3.2%
Iowa: D +3.0%
Arkansas: D +2%
Pennsylvania: D +1.75%
North Carolina: D +0.3%
Arizona: R +1%
Georgia: R +2%
Colorado: R +3.5%
Kentucky: R +4%
Louisiana: R +5%
South Carolina: R +7%
Alaska: R +7.5%
Texas: R +8%
Mississippi: R +9%
Kansas: R +9%
Montana: R +13%
West Virginia: R +14%
Wyoming: R +28%
8 states are currently way too close to call; Virginia, Iowa, Arkansas, Pennsylvania & North Carolina (all leaning towards Hillary), as well as Arizona, Georgia & Colorado (all leaning Republican).
Here are the current stats on Republican candidates:
1. Chris Christie favoured in 16 of 28 states
2. Jeb Bush favoured in 7 states (Florida, Wisconsin (!!), Arizona, Kentucky (!!), Kansas, West Virginia & Alaska)
3. Mike Huckabee in 2 states (Texas (!) & Louisiana (!))
4. Paul Ryan favoured in 1 state (Colorado)
5. Marco Rubio favoured in 1 state (South Carolina)
6. Susana Martinez favoured in 1 state (New Mexico)
7. Rand Paul favoured in 1 state (Montana)
Current update as of April 18.
Title: Re: 2016 Official Polling Map Thread
Post by: pbrower2a on April 18, 2014, 12:07:13 AM
There just aren't that many arguable swing states not now polled.
I would guess that having been Governor of Arkansas matter far more than does having been First Lady of the State, so I would guess that Mike Huckabee would win the state. I see no cause to believe that Paul Ryan will run for President in 2016; he seems more interested in gaining power within the House of Representatives. So Colorado goes to Clinton.
Using green for unpolled states almost certain to go R and using orange for unpolled states almost certain to go D, and I get (pastel green and orange)
(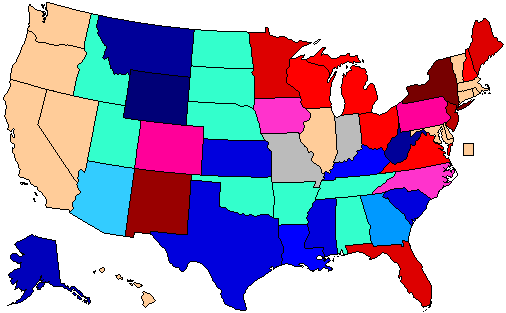 )
)
I have no idea on either Indiana or Missouri, and NE-02 would be in doubt.
It looks like a replay of 2008 except with Indiana and Missouri undecided.
I would guess that having been Governor of Arkansas matter far more than does having been First Lady of the State, so I would guess that Mike Huckabee would win the state. I see no cause to believe that Paul Ryan will run for President in 2016; he seems more interested in gaining power within the House of Representatives. So Colorado goes to Clinton.
Using green for unpolled states almost certain to go R and using orange for unpolled states almost certain to go D, and I get (pastel green and orange)
(
I have no idea on either Indiana or Missouri, and NE-02 would be in doubt.
It looks like a replay of 2008 except with Indiana and Missouri undecided.
Title: Re: 2016 Official Polling Map Thread
Post by: eric82oslo on April 18, 2014, 07:18:50 AM
The new WomanTrend/the polling company's Iowa 2016 poll is the 8 such in the state, yet only the 2nd one to include Mike Huckabee. The previous GOP best man, Christie, remains unchanged at -3%, yet he has to accept a 2nd position in the state now that Huckabee's average has exceeded him. Huckabee has gone from -4% to his current -1.85% in Iowa. All other GOPers except these two are still far behind Hillary in the state.
The total number of state polls added to the lists below has thus now reached 111.
So here they are - all the 2016 poll averages for each state so far - 28 states having been polled to date - and how far off they are compared to the actual 2012 outcomes. I'm only including the Republican candidate with the best statewide polling.
Alaska: Hillary vs Jeb Bush: R +7.5%
+6.5% D improvement
(Updated on February 5, 2014)
Arizona: Hillary vs Bush: R +1%
+8% D improvement
(Updated on March 6, 2014)
Arkansas: Hillary vs Chris Christie: D +2%
+22% D improvement
Current Democratic gain
(Updated on August 11)
Colorado: Hillary vs Paul Ryan: R +3.5%
+8.9% R improvement
Current Republican gain
(Updated on March 20, 2014)
Florida: Hillary vs Bush: D +7.3%
+6.4% D improvement
(Updated on January 31, 2014)
Georgia: Hillary vs Christie: R +2%
+6% D improvement
(Updated August 8 )
Iowa: Hillary vs Mike Huckabee: D +1.85%
+4% R improvement
(Updated on April 18, 2014)
Kansas: Hillary vs Bush: R +9%
+13% D improvement
(Updated on February 24, 2014)
Kentucky: Hillary vs Christie/Bush: R +4%
+19% D improvement
(Updated on December 22)
Louisiana: Hillary vs Huckabee: R +5%
+12% D improvement
(Updated on February 18, 2014)
Maine: Hillary vs Christie: D +8%
+7% R improvement
(Updated on November 13)
Michigan: Hillary vs Christie: D +4.8%
+4.7% R improvement
(Updated on April 9, 2014)
Minnesota: Hillary vs Christie: D +6%
+2% R improvement
(Updated on January 22, 2013)
Mississippi: Hillary vs Christie: R +9%
+2.5% D improvement
(Updated on November 19)
Montana: Hillary vs Rand Paul: R +13%
+1% D improvement
(Updated on November 24)
New Hampshire: Hillary vs Christie: D +3.7%
+1.9% R improvement
(Updated on January 30, 2014)
New Jersey: Hillary vs Christie: D +10.5%
+7.3% R improvement
(Updated on March 4, 2014)
New Mexico: Hillary vs Susana Martinez: D +14%
+4% D improvement
(Updated on March 27, 2014)
New York: Hillary vs Christie: D +28%
+0.2% R improvement
(Updated on March 4, 2014)
North Carolina: Hillary vs Christie: D +0.33%
+2.4% D improvement
Current Democratic gain
(Updated on April 10, 2014)
Ohio: Hillary vs Christie: D +5.75%
+2.8% D improvement
(Updated on February 20, 2014)
Pennsylvania: Hillary vs Christie: D +1.75%
+3.6% R improvement
(Updated on February 27, 2014)
South Carolina: Hillary vs Marco Rubio: R+7%
+3.5% D improvement
(Updated on November 2)
Texas: Hillary vs Huckabee: R +8%
+8% D improvement
(Updated on April 18, 2014)
Virginia: Hillary vs Christie: D +3.22%
+0.6% R improvement
(Updated on March 27, 2014)
West Virginia: Hillary vs Bush: R +14%
+13% D improvement
(Updated on October 1)
Wisconsin: Hillary vs Bush: D +4%
+3% R improvement
(Updated on October 29)
Wyoming: Hillary vs Christie: R +28%
+13% D improvement
(Updated on July 23)
Average all 28 states: Hillary vs Best Republican: R +0.35%
+3.6% D improvement (from Obama 2012) [projecting a 7.5% victory for Hillary]
That gives us this map right now:
()
Red = Democratic lead
Blue = Republican lead
Green = Exact tie
Grey = No polling yet
Green = toss up
20% shade = 0.1-1% lead
30% shade = 1.1-3% lead
40% shade = 3.1-6% lead
50% shade = 6.1-9% lead
60% shade = 9.1-12% lead
70% shade = 12.1-15% lead
80% shade = 15.1-18% lead
90% shade = Above 18.1% lead
In the count of electoral votes, this means the current situation looks like this:
Hillary: 215 EVs (for a total of 15 states)
Best/Tailormade Republican: 114 EVs (for a total of 13 states)
Toss-up: None
No polling: 209 EVs [almost half, including California] (for a total of 22 states + D.C.)
Which means that Hillary has captured a rather impressive 65.35% of all EVs awarded thus far, against a more or less disappointing 34.65% EVs for the tailormade Republican. (The remaining 4.55% are North Carolina's toss-up territory.) And only New York, Maine and New Jersey of the solidly Democratic states have been polled so far, against no less than 12 solidly Republican states - the biggest one of them, Texas, included. With California added to Hillary's pie, it'll look even more promising for her. Neither to forget such states as D.C., Vermont, Hawaii & Maryland. It's looking like a landslide right now, even without Colorado being in Hillary's column.
This is how the Trendline Map looks so far:
( )
)
The states which right now are showing the strongest improvement for the Democratic (Hillary) or the Republican candidate (in 15 out of 28 cases, Christie is that person):
1. Arkansas: D +22%
2. Kentucky: D +19%
3. Kansas: D +13%
4. West Virginia: D +13%
5. Wyoming: D +13%
6. Louisiana: D +12%
7. Colorado: R +8.9%
8. Arizona: D +8%
8. Texas: D +8%
10. New Jersey: R +7.3%
11. Maine: R +7%
12. Alaska: D +6.5%
13. Florida: D +6.4%
14. Georgia: D +6%
15. Michigan: R +4.7%
All of these changes (in the 15 states above) are (more than) statistically significant. It's almost shocking to see how much a switch from Obama to Hillary would mean for the states of Arkansas and Colorado. As of now, Hillary has had more than a 30% better swing in Arkansas than in Colorado, meaning that if current poll averages where to become the actual 2016 outcome, Hillary could actually perform up to 5.5% stronger in Arkansas than Colorado. However, they're not completely compatible as Paul Ryan currently polls best in Colorado, while Christie is ahead in Arkansas.
The whole list of states having been polled till now, going from Democratic stronghold to Republican stronghold:
New York: D +28%
New Mexico: D +14%
New Jersey: D +10.5%
Maine: D +8%
Currently estimated/projected national average: D +7.5%
Florida: D +7.3%
Minnesota: D +6%
Ohio: D +5.75%
Michigan: D +4.8%
Wisconsin: D +4%
New Hampshire: D +3.7%
Virginia: D +3.2%
Arkansas: D +2%
Iowa: D +1.85%
Pennsylvania: D +1.75%
North Carolina: D +0.3%
Arizona: R +1%
Georgia: R +2%
Colorado: R +3.5%
Kentucky: R +4%
Louisiana: R +5%
South Carolina: R +7%
Alaska: R +7.5%
Texas: R +8%
Mississippi: R +9%
Kansas: R +9%
Montana: R +13%
West Virginia: R +14%
Wyoming: R +28%
8 states are currently way too close to call; Virginia, Iowa, Arkansas, Pennsylvania & North Carolina (all leaning towards Hillary), as well as Arizona, Georgia & Colorado (all leaning Republican).
Here are the current stats on Republican candidates:
1. Chris Christie favoured in 15 of 28 states (for 179 EVs)
2. Jeb Bush favoured in 7 states (Florida, Arizona, Wisconsin (!!), Kentucky (!!), Kansas, West Virginia & Alaska - for 72 EVs)
3. Mike Huckabee in 3 states (Texas (!), Louisiana (!) & Iowa (!) - for 52 EVs)
4. Paul Ryan favoured in 1 state (Colorado - for 9 EVs)
4. Marco Rubio favoured in 1 state (South Carolina - for 9 EVs)
6. Susana Martinez favoured in 1 state (New Mexico - for 5 EVs)
7. Rand Paul favoured in 1 state (Montana - for 3 EVs)
Current update as of April 18.
The total number of state polls added to the lists below has thus now reached 111.
So here they are - all the 2016 poll averages for each state so far - 28 states having been polled to date - and how far off they are compared to the actual 2012 outcomes. I'm only including the Republican candidate with the best statewide polling.
Alaska: Hillary vs Jeb Bush: R +7.5%
+6.5% D improvement
(Updated on February 5, 2014)
Arizona: Hillary vs Bush: R +1%
+8% D improvement
(Updated on March 6, 2014)
Arkansas: Hillary vs Chris Christie: D +2%
+22% D improvement
Current Democratic gain
(Updated on August 11)
Colorado: Hillary vs Paul Ryan: R +3.5%
+8.9% R improvement
Current Republican gain
(Updated on March 20, 2014)
Florida: Hillary vs Bush: D +7.3%
+6.4% D improvement
(Updated on January 31, 2014)
Georgia: Hillary vs Christie: R +2%
+6% D improvement
(Updated August 8 )
Iowa: Hillary vs Mike Huckabee: D +1.85%
+4% R improvement
(Updated on April 18, 2014)
Kansas: Hillary vs Bush: R +9%
+13% D improvement
(Updated on February 24, 2014)
Kentucky: Hillary vs Christie/Bush: R +4%
+19% D improvement
(Updated on December 22)
Louisiana: Hillary vs Huckabee: R +5%
+12% D improvement
(Updated on February 18, 2014)
Maine: Hillary vs Christie: D +8%
+7% R improvement
(Updated on November 13)
Michigan: Hillary vs Christie: D +4.8%
+4.7% R improvement
(Updated on April 9, 2014)
Minnesota: Hillary vs Christie: D +6%
+2% R improvement
(Updated on January 22, 2013)
Mississippi: Hillary vs Christie: R +9%
+2.5% D improvement
(Updated on November 19)
Montana: Hillary vs Rand Paul: R +13%
+1% D improvement
(Updated on November 24)
New Hampshire: Hillary vs Christie: D +3.7%
+1.9% R improvement
(Updated on January 30, 2014)
New Jersey: Hillary vs Christie: D +10.5%
+7.3% R improvement
(Updated on March 4, 2014)
New Mexico: Hillary vs Susana Martinez: D +14%
+4% D improvement
(Updated on March 27, 2014)
New York: Hillary vs Christie: D +28%
+0.2% R improvement
(Updated on March 4, 2014)
North Carolina: Hillary vs Christie: D +0.33%
+2.4% D improvement
Current Democratic gain
(Updated on April 10, 2014)
Ohio: Hillary vs Christie: D +5.75%
+2.8% D improvement
(Updated on February 20, 2014)
Pennsylvania: Hillary vs Christie: D +1.75%
+3.6% R improvement
(Updated on February 27, 2014)
South Carolina: Hillary vs Marco Rubio: R+7%
+3.5% D improvement
(Updated on November 2)
Texas: Hillary vs Huckabee: R +8%
+8% D improvement
(Updated on April 18, 2014)
Virginia: Hillary vs Christie: D +3.22%
+0.6% R improvement
(Updated on March 27, 2014)
West Virginia: Hillary vs Bush: R +14%
+13% D improvement
(Updated on October 1)
Wisconsin: Hillary vs Bush: D +4%
+3% R improvement
(Updated on October 29)
Wyoming: Hillary vs Christie: R +28%
+13% D improvement
(Updated on July 23)
Average all 28 states: Hillary vs Best Republican: R +0.35%
+3.6% D improvement (from Obama 2012) [projecting a 7.5% victory for Hillary]
That gives us this map right now:
(
Red = Democratic lead
Blue = Republican lead
Green = Exact tie
Grey = No polling yet
Green = toss up
20% shade = 0.1-1% lead
30% shade = 1.1-3% lead
40% shade = 3.1-6% lead
50% shade = 6.1-9% lead
60% shade = 9.1-12% lead
70% shade = 12.1-15% lead
80% shade = 15.1-18% lead
90% shade = Above 18.1% lead
In the count of electoral votes, this means the current situation looks like this:
Hillary: 215 EVs (for a total of 15 states)
Best/Tailormade Republican: 114 EVs (for a total of 13 states)
Toss-up: None
No polling: 209 EVs [almost half, including California] (for a total of 22 states + D.C.)
Which means that Hillary has captured a rather impressive 65.35% of all EVs awarded thus far, against a more or less disappointing 34.65% EVs for the tailormade Republican. (The remaining 4.55% are North Carolina's toss-up territory.) And only New York, Maine and New Jersey of the solidly Democratic states have been polled so far, against no less than 12 solidly Republican states - the biggest one of them, Texas, included. With California added to Hillary's pie, it'll look even more promising for her. Neither to forget such states as D.C., Vermont, Hawaii & Maryland. It's looking like a landslide right now, even without Colorado being in Hillary's column.
This is how the Trendline Map looks so far:
(
The states which right now are showing the strongest improvement for the Democratic (Hillary) or the Republican candidate (in 15 out of 28 cases, Christie is that person):
1. Arkansas: D +22%
2. Kentucky: D +19%
3. Kansas: D +13%
4. West Virginia: D +13%
5. Wyoming: D +13%
6. Louisiana: D +12%
7. Colorado: R +8.9%
8. Arizona: D +8%
8. Texas: D +8%
10. New Jersey: R +7.3%
11. Maine: R +7%
12. Alaska: D +6.5%
13. Florida: D +6.4%
14. Georgia: D +6%
15. Michigan: R +4.7%
All of these changes (in the 15 states above) are (more than) statistically significant. It's almost shocking to see how much a switch from Obama to Hillary would mean for the states of Arkansas and Colorado. As of now, Hillary has had more than a 30% better swing in Arkansas than in Colorado, meaning that if current poll averages where to become the actual 2016 outcome, Hillary could actually perform up to 5.5% stronger in Arkansas than Colorado. However, they're not completely compatible as Paul Ryan currently polls best in Colorado, while Christie is ahead in Arkansas.
The whole list of states having been polled till now, going from Democratic stronghold to Republican stronghold:
New York: D +28%
New Mexico: D +14%
New Jersey: D +10.5%
Maine: D +8%
Currently estimated/projected national average: D +7.5%
Florida: D +7.3%
Minnesota: D +6%
Ohio: D +5.75%
Michigan: D +4.8%
Wisconsin: D +4%
New Hampshire: D +3.7%
Virginia: D +3.2%
Arkansas: D +2%
Iowa: D +1.85%
Pennsylvania: D +1.75%
North Carolina: D +0.3%
Arizona: R +1%
Georgia: R +2%
Colorado: R +3.5%
Kentucky: R +4%
Louisiana: R +5%
South Carolina: R +7%
Alaska: R +7.5%
Texas: R +8%
Mississippi: R +9%
Kansas: R +9%
Montana: R +13%
West Virginia: R +14%
Wyoming: R +28%
8 states are currently way too close to call; Virginia, Iowa, Arkansas, Pennsylvania & North Carolina (all leaning towards Hillary), as well as Arizona, Georgia & Colorado (all leaning Republican).
Here are the current stats on Republican candidates:
1. Chris Christie favoured in 15 of 28 states (for 179 EVs)
2. Jeb Bush favoured in 7 states (Florida, Arizona, Wisconsin (!!), Kentucky (!!), Kansas, West Virginia & Alaska - for 72 EVs)
3. Mike Huckabee in 3 states (Texas (!), Louisiana (!) & Iowa (!) - for 52 EVs)
4. Paul Ryan favoured in 1 state (Colorado - for 9 EVs)
4. Marco Rubio favoured in 1 state (South Carolina - for 9 EVs)
6. Susana Martinez favoured in 1 state (New Mexico - for 5 EVs)
7. Rand Paul favoured in 1 state (Montana - for 3 EVs)
Current update as of April 18.
Title: Re: 2016 Official Polling Map Thread
Post by: pbrower2a on April 18, 2014, 09:19:13 AM
The Washington Free Beacon is a very right-wing journal. So beware.
Here is an interesting piece of polling. I had a desire to see how Scott Walker, Governor of neighboring Wisconsin (a state demographically similar to Iowa) would do in Iowa:
45.9% HILLARY CLINTON
40.4% SCOTT WALKER
He'd have his work cut out. As shown in 2000, a Republican nominee can win without Iowa, but the state is close enough to the national average that Iowa has to be within the margin of error.
PPP will probably ask how Hillary Clinton does against Walker in Wisconsin.
Title: Re: 2016 Official Polling Map Thread
Post by: IceSpear on April 18, 2014, 11:33:51 AM
If the poll had asked about the presidential match ups before their push polling, I'd have no qualms with including it. But considering it came after questions such as this:
..it should probably be disregarded.
Quote
16.Do you agree or disagree that Braleys statement about Grassley shows that he has a
higher regard for lawyers in Texas than farmers in Iowa?
higher regard for lawyers in Texas than farmers in Iowa?
Quote
Bruce Braley attempted to strengthen his farmer credentials by posting a picture of a
farm to his Facebook page. However, the picture actually showed an apple farm in England, and so the campaign removed the photo. Does this make you more likely or less likely to vote Bruce Braley for U.S. Senate?
farm to his Facebook page. However, the picture actually showed an apple farm in England, and so the campaign removed the photo. Does this make you more likely or less likely to vote Bruce Braley for U.S. Senate?
Quote
Bruce Braley has apologized for his remarks. Do you think he apologized because he is
truly sorry, or because he is truly worried that this hurts his chances to win the U.S.
Senate election?
truly sorry, or because he is truly worried that this hurts his chances to win the U.S.
Senate election?
..it should probably be disregarded.
Title: Re: 2016 Official Polling Map Thread
Post by: eric82oslo on April 18, 2014, 11:59:31 AM
Bruce Braley doesn't have much to do with Hillary though. People aren't that stupid. Besides, this is the most ridiculous so-called "scandal" I've ever come across. There's nothing even slightly scandalous with his statements. It's a storm in a glass of water and not even that.
Title: Re: 2016 Official Polling Map Thread
Post by: IceSpear on April 18, 2014, 12:00:30 PM
Bruce Braley doesn't have much to do with Hillary though. People aren't that stupid. Besides, this is the most ridiculous so-called "scandal" I've ever come across. There's nothing even slightly scandalous with his statements. It's a storm in a glass of water and not even that.
It's just more likely to inspire negative feelings about Democrats overall. That's why reputable polling firms always include approvals/favorability/match ups before asking any additional questions.
Title: Re: 2016 Official Polling Map Thread
Post by: pbrower2a on April 24, 2014, 09:02:19 AM
Quinnipiac, Colorado:
Also relevant:
That is far out of touch with the 2012 election in Colorado. Lower approval than in Louisiana?
http://www.quinnipiac.edu/news-and-events/quinnipiac-university-poll/colorado/release-detail?ReleaseID=2034
Possible caveats:
1. Quinnipiac may undercount the large Hispanic part of the Colorado electorate. I have seen that before.
2. Colorado has a very loud libertarian current in political discourse (much like California) but that has usually proved ineffective at election time since 2006.
But at those two, I am arguing the dynamics of the election before it happens.
Quinnipiac is good elsewhere and polls Colorado in good faith, so I can't dispute it.
Hillary Clinton vs. Jeb Bush
()
Hillary Clinton vs. Chris Christie
( )
)
Hillary Clinton vs. Mike Huckabee
(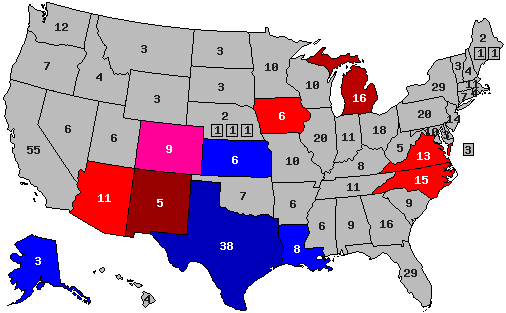 )
)
Hillary Clinton vs. Rand Paul
( )
)
blue, Republican -- red, Democratic
30% -- lead with 40-49% but a margin of 3% or less
40% -- lead with 40-49% but a margin of 4% or more
60% -- lead with 50-54%
70% -- lead with 55-59%
90% -- lead with 60% or more
Quote
U.S. Sen. Rand Paul of Kentucky is the strongest candidate in Colorado in the 2016 presidential race, topping former Secretary of State Hillary Clinton 48 - 43 percent. There is a huge gender gap as men back the Republican Paul 55 - 35 percent while women go with the Democrat Clinton 50 - 40 percent. Independent voters back Paul 48 - 37 percent.
In other possible matchups:
Clinton ties New Jersey Gov. Christopher Christie 42 - 42 percent;
Clinton leads former Florida Gov. Jeb Bush 45 - 40 percent;
Clinton gets 45 percent to former Arkansas Gov. Mike Huckabee's 44 percent.
In other possible matchups:
Clinton ties New Jersey Gov. Christopher Christie 42 - 42 percent;
Clinton leads former Florida Gov. Jeb Bush 45 - 40 percent;
Clinton gets 45 percent to former Arkansas Gov. Mike Huckabee's 44 percent.
Also relevant:
Quote
Colorado voters disapprove 59 - 38 percent of the job President Barack Obama is doing.
That is far out of touch with the 2012 election in Colorado. Lower approval than in Louisiana?
http://www.quinnipiac.edu/news-and-events/quinnipiac-university-poll/colorado/release-detail?ReleaseID=2034
Possible caveats:
1. Quinnipiac may undercount the large Hispanic part of the Colorado electorate. I have seen that before.
2. Colorado has a very loud libertarian current in political discourse (much like California) but that has usually proved ineffective at election time since 2006.
But at those two, I am arguing the dynamics of the election before it happens.
Quinnipiac is good elsewhere and polls Colorado in good faith, so I can't dispute it.
Hillary Clinton vs. Jeb Bush
(
Hillary Clinton vs. Chris Christie
(
Hillary Clinton vs. Mike Huckabee
(
Hillary Clinton vs. Rand Paul
(
blue, Republican -- red, Democratic
30% -- lead with 40-49% but a margin of 3% or less
40% -- lead with 40-49% but a margin of 4% or more
60% -- lead with 50-54%
70% -- lead with 55-59%
90% -- lead with 60% or more
Title: Re: 2016 Official Polling Map Thread
Post by: pbrower2a on April 24, 2014, 09:36:12 PM
So why is Hillary doing so badly in Colorado with Quinnipiac?
Could it be that Q, which seems to be reasonable enough everywhere else, is badly off on Colorado? Maybe its polls undercount Hispanics? Nobody has that problem with Q in Florida, which it does poll often. It could be something else.
Q has a good model for a midterm election. It has Udall barely leading in a hot Senate race -- but it does have him leading. It also has President Obama with an approval rating in the high 30s, which looks much unlike the 2012 (and 2016) electorate.
But that model depresses the D vote, and using it for 2016 may be questionable. So if you are involved heavily with politics as a narrative, which election are you looking at more closely -- the November election this year or November 2016?
OK -- with a midterm electorate, Hillary Clinton probably loses Colorado.
Title: Re: 2016 Official Polling Map Thread
Post by: pbrower2a on April 24, 2014, 09:43:00 PM
PPP, Wisconsin
Hillary Clinton.................................................. 50%
Paul Ryan ....................................................... 45%
Hillary Clinton.................................................. 51%
Scott Walker ................................................... 44%
Hillary Clinton.................................................. 50%
Rand Paul ....................................................... 39%
Hillary Clinton.................................................. 50%
Jeb Bush......................................................... 39%
Hillary Clinton.................................................. 50%
Mike Huckabee ............................................... 38%
Hillary Clinton.................................................. 49%
Chris Christie .................................................. 36%
Note that the two possible Favorite Sons (Scott Walker and Paul Ryan) fare badly in their home state. So much for the idea that Walker has developed a huge crossover vote in Wisconsin that can inspire Republicans to cast their support to him.
Hillary Clinton vs. Jeb Bush
( )
)
Hillary Clinton vs. Chris Christie
(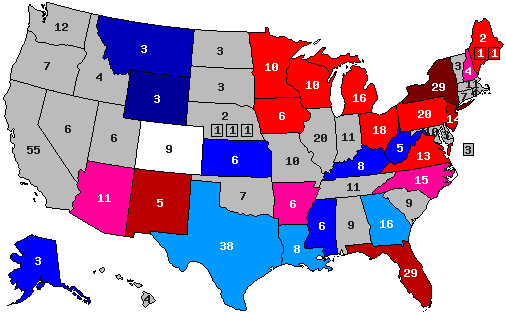 )
)
Hillary Clinton vs. Mike Huckabee
(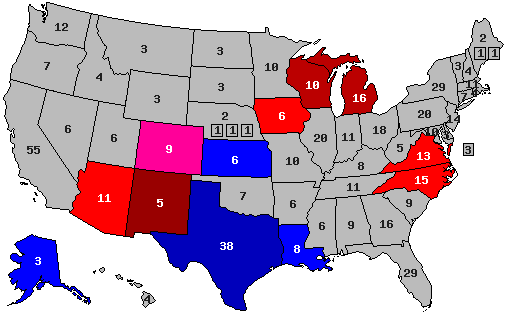 )
)
Hillary Clinton vs. Rand Paul
(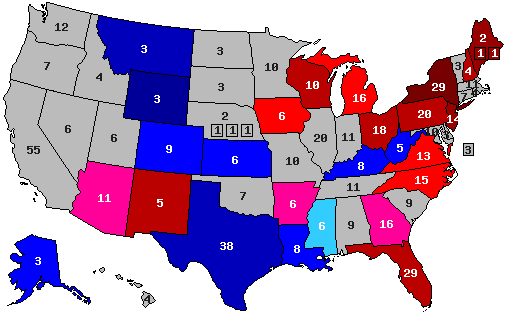 )
)
blue, Republican -- red, Democratic
30% -- lead with 40-49% but a margin of 3% or less
40% -- lead with 40-49% but a margin of 4% or more
60% -- lead with 50-54%
70% -- lead with 55-59%
90% -- lead with 60% or more
Hillary Clinton.................................................. 50%
Paul Ryan ....................................................... 45%
Hillary Clinton.................................................. 51%
Scott Walker ................................................... 44%
Hillary Clinton.................................................. 50%
Rand Paul ....................................................... 39%
Hillary Clinton.................................................. 50%
Jeb Bush......................................................... 39%
Hillary Clinton.................................................. 50%
Mike Huckabee ............................................... 38%
Hillary Clinton.................................................. 49%
Chris Christie .................................................. 36%
Note that the two possible Favorite Sons (Scott Walker and Paul Ryan) fare badly in their home state. So much for the idea that Walker has developed a huge crossover vote in Wisconsin that can inspire Republicans to cast their support to him.
Hillary Clinton vs. Jeb Bush
(
Hillary Clinton vs. Chris Christie
(
Hillary Clinton vs. Mike Huckabee
(
Hillary Clinton vs. Rand Paul
(
blue, Republican -- red, Democratic
30% -- lead with 40-49% but a margin of 3% or less
40% -- lead with 40-49% but a margin of 4% or more
60% -- lead with 50-54%
70% -- lead with 55-59%
90% -- lead with 60% or more
Title: Re: 2016 Official Polling Map Thread
Post by: eric82oslo on April 24, 2014, 09:58:32 PM
Two more polls added to the lot yesterday. The one in Colorado (the 8th of the season) didn't really change all that much, since they didn't include Paul Ryan once more. If they keep excluding him from future Colorado polls, I will eventually remove him from the state altogether. Yet we're still 2 1/2 years away, so I'd say no reason to rush for now. Interestingly though, he's not the only one still ahead of Clinton in the state. Both Christie (+1.6%) & Rand Paul (+1.3%) are still ahead of her on average. The 4 remaining candidates are trailing: Rubio by -1.5%, Cruz by -3.2%, Huckabee by -4% and Jeb Bush worst at -6%.
Then we have the PPP poll of Wisconsin, which is "only" the 5th 2016 poll of the state. The state has deteriorated significantly for Republicans in general and for Jeb Bush in particular, who with this catastophical poll (being 11% down) loses his "lead" in the state to Wisconsinite Paul Ryan (who's coincidentially ahead in Colorado as well). This means that Hillary improves her Wisconsin lead from 4% to 5.1%. Bush is 2nd with -7.5%, followed by Christie at -8.1%, Scott Walker at -9.2% and Rand Paul at -9.9%. Huckabee, Rubio & Cruz are all down by horrific double digits (Cruz worst at -16.5%).
The total number of state polls added to the lists below has thus now reached 113.
So here they are - all the 2016 poll averages for each state so far - 28 states having been polled to date - and how far off they are compared to the actual 2012 outcomes. I'm only including the Republican candidate with the best statewide polling.
Alaska: Hillary vs Jeb Bush: R +7.5%
+6.5% D improvement
(Updated on February 5, 2014)
Arizona: Hillary vs Bush: R +1%
+8% D improvement
(Updated on March 6, 2014)
Arkansas: Hillary vs Chris Christie: D +2%
+22% D improvement
Current Democratic gain
(Updated on August 11)
Colorado: Hillary vs Paul Ryan: R +3.5%
+8.9% R improvement
Current Republican gain
(Updated on April 25, 2014)
Florida: Hillary vs Bush: D +7.3%
+6.4% D improvement
(Updated on January 31, 2014)
Georgia: Hillary vs Christie: R +2%
+6% D improvement
(Updated August 8 )
Iowa: Hillary vs Mike Huckabee: D +1.85%
+4% R improvement
(Updated on April 18, 2014)
Kansas: Hillary vs Bush: R +9%
+13% D improvement
(Updated on February 24, 2014)
Kentucky: Hillary vs Christie/Bush: R +4%
+19% D improvement
(Updated on December 22)
Louisiana: Hillary vs Huckabee: R +5%
+12% D improvement
(Updated on February 18, 2014)
Maine: Hillary vs Christie: D +8%
+7% R improvement
(Updated on November 13)
Michigan: Hillary vs Christie: D +4.8%
+4.7% R improvement
(Updated on April 9, 2014)
Minnesota: Hillary vs Christie: D +6%
+2% R improvement
(Updated on January 22, 2013)
Mississippi: Hillary vs Christie: R +9%
+2.5% D improvement
(Updated on November 19)
Montana: Hillary vs Rand Paul: R +13%
+1% D improvement
(Updated on November 24)
New Hampshire: Hillary vs Christie: D +3.7%
+1.9% R improvement
(Updated on January 30, 2014)
New Jersey: Hillary vs Christie: D +10.5%
+7.3% R improvement
(Updated on March 4, 2014)
New Mexico: Hillary vs Susana Martinez: D +14%
+4% D improvement
(Updated on March 27, 2014)
New York: Hillary vs Christie: D +28%
+0.2% R improvement
(Updated on March 4, 2014)
North Carolina: Hillary vs Christie: D +0.33%
+2.4% D improvement
Current Democratic gain
(Updated on April 10, 2014)
Ohio: Hillary vs Christie: D +5.75%
+2.8% D improvement
(Updated on February 20, 2014)
Pennsylvania: Hillary vs Christie: D +1.75%
+3.6% R improvement
(Updated on February 27, 2014)
South Carolina: Hillary vs Marco Rubio: R+7%
+3.5% D improvement
(Updated on November 2)
Texas: Hillary vs Huckabee: R +8%
+8% D improvement
(Updated on April 18, 2014)
Virginia: Hillary vs Christie: D +3.22%
+0.6% R improvement
(Updated on March 27, 2014)
West Virginia: Hillary vs Bush: R +14%
+13% D improvement
(Updated on October 1)
Wisconsin: Hillary vs Ryan: D +5.1%
+1.8% R improvement
(Updated on April 25, 2014)
Wyoming: Hillary vs Christie: R +28%
+13% D improvement
(Updated on July 23)
Average all 28 states: Hillary vs Best Republican: R +0.3%
+3.7% D improvement (from Obama 2012) [projecting a 7.6% victory for Hillary]
That gives us this map right now:
()
Red = Democratic lead
Blue = Republican lead
Green = Exact tie
Grey = No polling yet
Green = toss up
20% shade = 0.1-1% lead
30% shade = 1.1-3% lead
40% shade = 3.1-6% lead
50% shade = 6.1-9% lead
60% shade = 9.1-12% lead
70% shade = 12.1-15% lead
80% shade = 15.1-18% lead
90% shade = Above 18.1% lead
In the count of electoral votes, this means the current situation looks like this:
Hillary: 215 EVs (for a total of 15 states)
Best/Tailormade Republican: 114 EVs (for a total of 13 states)
Toss-up: None
No polling: 209 EVs [almost half, including California] (for a total of 22 states + D.C.)
Which means that Hillary has captured a rather impressive 65.35% of all EVs awarded thus far, against a disappointing 34.65% EVs for the tailormade Republican.
This is how the Trendline Map looks so far:
()
The states which right now are showing the strongest improvement for the Democratic (Hillary) or the Republican candidate (in 15 out of 28 cases, Christie is that person):
1. Arkansas: D +22%
2. Kentucky: D +19%
3. Kansas: D +13%
4. West Virginia: D +13%
5. Wyoming: D +13%
6. Louisiana: D +12%
7. Colorado: R +8.9%
8. Arizona: D +8%
8. Texas: D +8%
10. New Jersey: R +7.3%
11. Maine: R +7%
12. Alaska: D +6.5%
13. Florida: D +6.4%
14. Georgia: D +6%
15. Michigan: R +4.7%
All of these changes (in the 15 states above) are (more than) statistically significant. It's almost shocking to see how much a switch from Obama to Hillary would mean for the states of Arkansas and Colorado. As of now, Hillary has had more than a 30% better swing in Arkansas than in Colorado, meaning that if current poll averages where to become the actual 2016 outcome, Hillary could actually perform up to 5.5% stronger in Arkansas than Colorado. However, they're not completely compatible as Paul Ryan currently polls best in Colorado, while Christie is ahead in Arkansas.
The whole list of states having been polled till now, going from Democratic stronghold to Republican stronghold:
New York: D +28%
New Mexico: D +14%
New Jersey: D +10.5%
Maine: D +8%
Currently estimated/projected national average: D +7.6%
Florida: D +7.3%
Minnesota: D +6%
Ohio: D +5.75%
Wisconsin: D +5.1%
Michigan: D +4.8%
New Hampshire: D +3.7%
Virginia: D +3.2%
Arkansas: D +2%
Iowa: D +1.85%
Pennsylvania: D +1.75%
North Carolina: D +0.3%
Arizona: R +1%
Georgia: R +2%
Colorado: R +3.5%
Kentucky: R +4%
Louisiana: R +5%
South Carolina: R +7%
Alaska: R +7.5%
Texas: R +8%
Mississippi: R +9%
Kansas: R +9%
Montana: R +13%
West Virginia: R +14%
Wyoming: R +28%
Here are the current stats on Republican candidates:
1. Chris Christie favoured in 15 of 28 states (for 179 EVs)
2. Jeb Bush favoured in 6 states (Florida, Arizona, Kentucky (!!), Kansas, West Virginia & Alaska - for 62 EVs)
3. Mike Huckabee in 3 states (Texas (!), Louisiana (!) & Iowa (!) - for 52 EVs)
4. Paul Ryan favoured in 2 states (Wisconsin & Colorado - for 19 EVs)
5. Marco Rubio favoured in 1 state (South Carolina - for 9 EVs)
6. Susana Martinez favoured in 1 state (New Mexico - for 5 EVs)
7. Rand Paul favoured in 1 state (Montana - for 3 EVs)
Current update as of April 25.
Then we have the PPP poll of Wisconsin, which is "only" the 5th 2016 poll of the state. The state has deteriorated significantly for Republicans in general and for Jeb Bush in particular, who with this catastophical poll (being 11% down) loses his "lead" in the state to Wisconsinite Paul Ryan (who's coincidentially ahead in Colorado as well). This means that Hillary improves her Wisconsin lead from 4% to 5.1%. Bush is 2nd with -7.5%, followed by Christie at -8.1%, Scott Walker at -9.2% and Rand Paul at -9.9%. Huckabee, Rubio & Cruz are all down by horrific double digits (Cruz worst at -16.5%).
The total number of state polls added to the lists below has thus now reached 113.
So here they are - all the 2016 poll averages for each state so far - 28 states having been polled to date - and how far off they are compared to the actual 2012 outcomes. I'm only including the Republican candidate with the best statewide polling.
Alaska: Hillary vs Jeb Bush: R +7.5%
+6.5% D improvement
(Updated on February 5, 2014)
Arizona: Hillary vs Bush: R +1%
+8% D improvement
(Updated on March 6, 2014)
Arkansas: Hillary vs Chris Christie: D +2%
+22% D improvement
Current Democratic gain
(Updated on August 11)
Colorado: Hillary vs Paul Ryan: R +3.5%
+8.9% R improvement
Current Republican gain
(Updated on April 25, 2014)
Florida: Hillary vs Bush: D +7.3%
+6.4% D improvement
(Updated on January 31, 2014)
Georgia: Hillary vs Christie: R +2%
+6% D improvement
(Updated August 8 )
Iowa: Hillary vs Mike Huckabee: D +1.85%
+4% R improvement
(Updated on April 18, 2014)
Kansas: Hillary vs Bush: R +9%
+13% D improvement
(Updated on February 24, 2014)
Kentucky: Hillary vs Christie/Bush: R +4%
+19% D improvement
(Updated on December 22)
Louisiana: Hillary vs Huckabee: R +5%
+12% D improvement
(Updated on February 18, 2014)
Maine: Hillary vs Christie: D +8%
+7% R improvement
(Updated on November 13)
Michigan: Hillary vs Christie: D +4.8%
+4.7% R improvement
(Updated on April 9, 2014)
Minnesota: Hillary vs Christie: D +6%
+2% R improvement
(Updated on January 22, 2013)
Mississippi: Hillary vs Christie: R +9%
+2.5% D improvement
(Updated on November 19)
Montana: Hillary vs Rand Paul: R +13%
+1% D improvement
(Updated on November 24)
New Hampshire: Hillary vs Christie: D +3.7%
+1.9% R improvement
(Updated on January 30, 2014)
New Jersey: Hillary vs Christie: D +10.5%
+7.3% R improvement
(Updated on March 4, 2014)
New Mexico: Hillary vs Susana Martinez: D +14%
+4% D improvement
(Updated on March 27, 2014)
New York: Hillary vs Christie: D +28%
+0.2% R improvement
(Updated on March 4, 2014)
North Carolina: Hillary vs Christie: D +0.33%
+2.4% D improvement
Current Democratic gain
(Updated on April 10, 2014)
Ohio: Hillary vs Christie: D +5.75%
+2.8% D improvement
(Updated on February 20, 2014)
Pennsylvania: Hillary vs Christie: D +1.75%
+3.6% R improvement
(Updated on February 27, 2014)
South Carolina: Hillary vs Marco Rubio: R+7%
+3.5% D improvement
(Updated on November 2)
Texas: Hillary vs Huckabee: R +8%
+8% D improvement
(Updated on April 18, 2014)
Virginia: Hillary vs Christie: D +3.22%
+0.6% R improvement
(Updated on March 27, 2014)
West Virginia: Hillary vs Bush: R +14%
+13% D improvement
(Updated on October 1)
Wisconsin: Hillary vs Ryan: D +5.1%
+1.8% R improvement
(Updated on April 25, 2014)
Wyoming: Hillary vs Christie: R +28%
+13% D improvement
(Updated on July 23)
Average all 28 states: Hillary vs Best Republican: R +0.3%
+3.7% D improvement (from Obama 2012) [projecting a 7.6% victory for Hillary]
That gives us this map right now:
(
Red = Democratic lead
Blue = Republican lead
Green = Exact tie
Grey = No polling yet
Green = toss up
20% shade = 0.1-1% lead
30% shade = 1.1-3% lead
40% shade = 3.1-6% lead
50% shade = 6.1-9% lead
60% shade = 9.1-12% lead
70% shade = 12.1-15% lead
80% shade = 15.1-18% lead
90% shade = Above 18.1% lead
In the count of electoral votes, this means the current situation looks like this:
Hillary: 215 EVs (for a total of 15 states)
Best/Tailormade Republican: 114 EVs (for a total of 13 states)
Toss-up: None
No polling: 209 EVs [almost half, including California] (for a total of 22 states + D.C.)
Which means that Hillary has captured a rather impressive 65.35% of all EVs awarded thus far, against a disappointing 34.65% EVs for the tailormade Republican.
This is how the Trendline Map looks so far:
(
The states which right now are showing the strongest improvement for the Democratic (Hillary) or the Republican candidate (in 15 out of 28 cases, Christie is that person):
1. Arkansas: D +22%
2. Kentucky: D +19%
3. Kansas: D +13%
4. West Virginia: D +13%
5. Wyoming: D +13%
6. Louisiana: D +12%
7. Colorado: R +8.9%
8. Arizona: D +8%
8. Texas: D +8%
10. New Jersey: R +7.3%
11. Maine: R +7%
12. Alaska: D +6.5%
13. Florida: D +6.4%
14. Georgia: D +6%
15. Michigan: R +4.7%
All of these changes (in the 15 states above) are (more than) statistically significant. It's almost shocking to see how much a switch from Obama to Hillary would mean for the states of Arkansas and Colorado. As of now, Hillary has had more than a 30% better swing in Arkansas than in Colorado, meaning that if current poll averages where to become the actual 2016 outcome, Hillary could actually perform up to 5.5% stronger in Arkansas than Colorado. However, they're not completely compatible as Paul Ryan currently polls best in Colorado, while Christie is ahead in Arkansas.
The whole list of states having been polled till now, going from Democratic stronghold to Republican stronghold:
New York: D +28%
New Mexico: D +14%
New Jersey: D +10.5%
Maine: D +8%
Currently estimated/projected national average: D +7.6%
Florida: D +7.3%
Minnesota: D +6%
Ohio: D +5.75%
Wisconsin: D +5.1%
Michigan: D +4.8%
New Hampshire: D +3.7%
Virginia: D +3.2%
Arkansas: D +2%
Iowa: D +1.85%
Pennsylvania: D +1.75%
North Carolina: D +0.3%
Arizona: R +1%
Georgia: R +2%
Colorado: R +3.5%
Kentucky: R +4%
Louisiana: R +5%
South Carolina: R +7%
Alaska: R +7.5%
Texas: R +8%
Mississippi: R +9%
Kansas: R +9%
Montana: R +13%
West Virginia: R +14%
Wyoming: R +28%
Here are the current stats on Republican candidates:
1. Chris Christie favoured in 15 of 28 states (for 179 EVs)
2. Jeb Bush favoured in 6 states (Florida, Arizona, Kentucky (!!), Kansas, West Virginia & Alaska - for 62 EVs)
3. Mike Huckabee in 3 states (Texas (!), Louisiana (!) & Iowa (!) - for 52 EVs)
4. Paul Ryan favoured in 2 states (Wisconsin & Colorado - for 19 EVs)
5. Marco Rubio favoured in 1 state (South Carolina - for 9 EVs)
6. Susana Martinez favoured in 1 state (New Mexico - for 5 EVs)
7. Rand Paul favoured in 1 state (Montana - for 3 EVs)
Current update as of April 25.
Title: Re: 2016 Official Polling Map Thread
Post by: pbrower2a on May 01, 2014, 11:33:28 AM
Quinnipiac, Florida.
49 - 41 percent over Bush;
52 - 40 percent over Rubio;
55 - 37 percent over Paul;
52 - 34 percent over Christie;
56 - 36 percent over Ryan;
57 - 31 percent over Cruz;
53 - 35 percent over Huckabee
Devastating. If Q seemed to unduly exaggerate R chances in Colorado, it may have underestimated them by a similar amount in Florida based on polls released this week.
Republican nominees for President cannot now win without Florida.
Hillary Clinton vs. Jeb Bush
()
Hillary Clinton vs. Chris Christie
()
Hillary Clinton vs. Mike Huckabee
(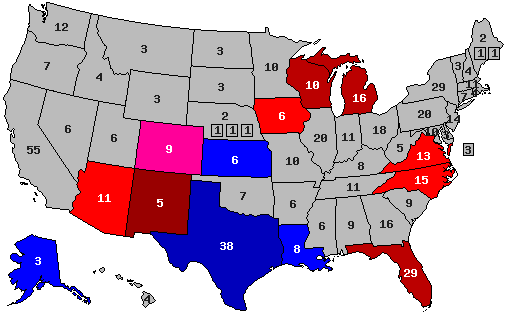 )
)
Hillary Clinton vs. Rand Paul
(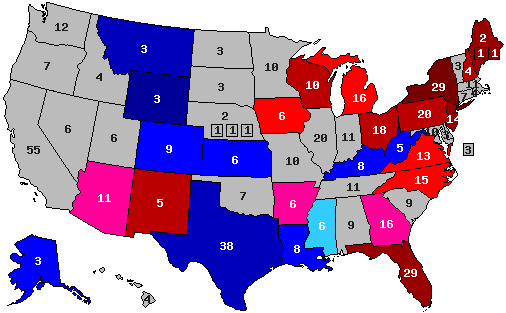 )
)
blue, Republican -- red, Democratic
30% -- lead with 40-49% but a margin of 3% or less
40% -- lead with 40-49% but a margin of 4% or more
60% -- lead with 50-54%
70% -- lead with 55-59%
90% -- lead with 60% or more
49 - 41 percent over Bush;
52 - 40 percent over Rubio;
55 - 37 percent over Paul;
52 - 34 percent over Christie;
56 - 36 percent over Ryan;
57 - 31 percent over Cruz;
53 - 35 percent over Huckabee
Devastating. If Q seemed to unduly exaggerate R chances in Colorado, it may have underestimated them by a similar amount in Florida based on polls released this week.
Republican nominees for President cannot now win without Florida.
Hillary Clinton vs. Jeb Bush
(
Hillary Clinton vs. Chris Christie
(
Hillary Clinton vs. Mike Huckabee
(
Hillary Clinton vs. Rand Paul
(
blue, Republican -- red, Democratic
30% -- lead with 40-49% but a margin of 3% or less
40% -- lead with 40-49% but a margin of 4% or more
60% -- lead with 50-54%
70% -- lead with 55-59%
90% -- lead with 60% or more
Title: Re: 2016 Official Polling Map Thread
Post by: pbrower2a on May 01, 2014, 09:27:30 PM
Quote
PPP's newest Arkansas poll finds that the Clinton brand is still pretty strong in the state. Bill Clinton has a 55/37 favorability rating there, and Hillary Clinton leads all but one of the leading Republicans there in hypothetical 2016 match ups despite the state's recent Republican lurch. Clinton leads Jeb Bush 46/41, Rand Paul 48/42, and Chris Christie 47/38.
The one Republican Clinton trails is Mike Huckabee at 47/44.
The one Republican Clinton trails is Mike Huckabee at 47/44.
- See more at: http://www.publicpolicypolling.com/#sthash.wvtqh5EJ.dpuf
In case anyone was wondering whether the leads in polls that Hillary Clinton had in Arkansas last year were real -- we now have some corroboration. This state could be trouble for Republicans of all kinds in 2016.
Republicans can't win the presidency without Arkansas, either, and they are not going to win the Presidency while winning Arkansas by only 3%. The Favorite Son effect obviously is stronger with an ex-Governor than with an ex-First Lady of the State...
Hillary Clinton vs. Jeb Bush
(
Hillary Clinton vs. Chris Christie
(
Hillary Clinton vs. Mike Huckabee
(
Hillary Clinton vs. Rand Paul
(
blue, Republican -- red, Democratic
30% -- lead with 40-49% but a margin of 3% or less
40% -- lead with 40-49% but a margin of 4% or more
60% -- lead with 50-54%
70% -- lead with 55-59%
90% -- lead with 60% or more
Title: Re: 2016 Official Polling Map Thread
Post by: eric82oslo on May 05, 2014, 08:42:03 AM
Two new polls out last week from Arkansas and Florida. The Florida poll just reaffirms what we've seen in other Florida polls, that Hillary leads all Republicans there with at least 7-8%. The Arkansas poll however changes the narrative in the state, as Mike Huckabee is included there for the fist time. Thus, Arkansas goes from lean Democratic to lean Republican. Overall, Huckabee makes the state tilt 5% more towards the Republican side.
The total number of state polls added to the lists below has thus now reached 115.
So here they are - all the 2016 poll averages for each state so far - 28 states having been polled to date - and how far off they are compared to the actual 2012 outcomes. I'm only including the Republican candidate with the best statewide polling.
Alaska: Hillary vs Jeb Bush: R +7.5%
+6.5% D improvement
(Updated on February 5, 2014)
Arizona: Hillary vs Bush: R +1%
+8% D improvement
(Updated on March 6, 2014)
Arkansas: Hillary vs Mike Huckabee: R +3%
+17% D improvement
(Updated on May 5, 2014)
Colorado: Hillary vs Paul Ryan: R +3.5%
+8.9% R improvement
Current Republican gain
(Updated on April 25, 2014)
Florida: Hillary vs Bush: D +7.4%
+6.5% D improvement
(Updated on May 5, 2014)
Georgia: Hillary vs Christie: R +2%
+6% D improvement
(Updated August 8 )
Iowa: Hillary vs Mike Huckabee: D +1.85%
+4% R improvement
(Updated on April 18, 2014)
Kansas: Hillary vs Bush: R +9%
+13% D improvement
(Updated on February 24, 2014)
Kentucky: Hillary vs Christie/Bush: R +4%
+19% D improvement
(Updated on December 22)
Louisiana: Hillary vs Huckabee: R +5%
+12% D improvement
(Updated on February 18, 2014)
Maine: Hillary vs Christie: D +8%
+7% R improvement
(Updated on November 13)
Michigan: Hillary vs Christie: D +4.8%
+4.7% R improvement
(Updated on April 9, 2014)
Minnesota: Hillary vs Christie: D +6%
+2% R improvement
(Updated on January 22, 2013)
Mississippi: Hillary vs Christie: R +9%
+2.5% D improvement
(Updated on November 19)
Montana: Hillary vs Rand Paul: R +13%
+1% D improvement
(Updated on November 24)
New Hampshire: Hillary vs Christie: D +3.7%
+1.9% R improvement
(Updated on January 30, 2014)
New Jersey: Hillary vs Christie: D +10.5%
+7.3% R improvement
(Updated on March 4, 2014)
New Mexico: Hillary vs Susana Martinez: D +14%
+4% D improvement
(Updated on March 27, 2014)
New York: Hillary vs Christie: D +28%
+0.2% R improvement
(Updated on March 4, 2014)
North Carolina: Hillary vs Christie: D +0.33%
+2.4% D improvement
Current Democratic gain
(Updated on April 10, 2014)
Ohio: Hillary vs Christie: D +5.75%
+2.8% D improvement
(Updated on February 20, 2014)
Pennsylvania: Hillary vs Christie: D +1.75%
+3.6% R improvement
(Updated on February 27, 2014)
South Carolina: Hillary vs Marco Rubio: R+7%
+3.5% D improvement
(Updated on November 2)
Texas: Hillary vs Huckabee: R +8%
+8% D improvement
(Updated on April 18, 2014)
Virginia: Hillary vs Christie: D +3.22%
+0.6% R improvement
(Updated on March 27, 2014)
West Virginia: Hillary vs Bush: R +14%
+13% D improvement
(Updated on October 1)
Wisconsin: Hillary vs Ryan: D +5.1%
+1.8% R improvement
(Updated on April 25, 2014)
Wyoming: Hillary vs Christie: R +28%
+13% D improvement
(Updated on July 23)
Average all 28 states: Hillary vs Best Republican: R +0.5%
+3.4% D improvement (from Obama 2012) [projecting a 7.3% victory for Hillary]
That gives us this map right now:
( )
)
Red = Democratic lead
Blue = Republican lead
Green = Exact tie
Grey = No polling yet
Green = toss up
20% shade = 0.1-1% lead
30% shade = 1.1-3% lead
40% shade = 3.1-6% lead
50% shade = 6.1-9% lead
60% shade = 9.1-12% lead
70% shade = 12.1-15% lead
80% shade = 15.1-18% lead
90% shade = Above 18.1% lead
In the count of electoral votes, this means the current situation looks like this:
Hillary: 209 EVs (for a total of 14 states)
Best/Tailormade Republican: 120 EVs (for a total of 14 states)
Toss-up: None
No polling: 209 EVs [almost half, including California] (for a total of 22 states + D.C.)
Which means that Hillary has captured a rather impressive 63.5% of all EVs awarded thus far, against a disappointing 36.5% EVs for the tailormade Republican.
This is how the Trendline Map looks so far:
(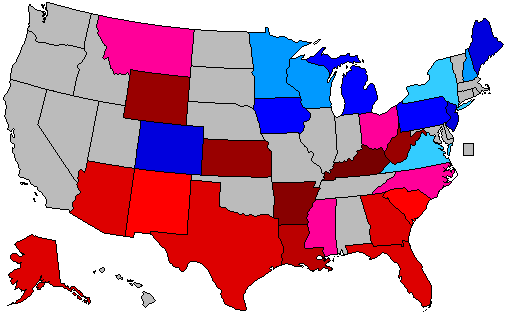 )
)
The states which right now are showing the strongest improvement for the Democratic (Hillary) or the Republican candidate (in 14 out of 28 cases, Christie is that person):
1. Kentucky: D +19%
2. Arkansas: D +17%
3. Kansas: D +13%
4. West Virginia: D +13%
5. Wyoming: D +13%
6. Louisiana: D +12%
7. Colorado: R +8.9%
8. Arizona: D +8%
8. Texas: D +8%
10. New Jersey: R +7.3%
11. Maine: R +7%
12. Florida: D +6.5%
13. Alaska: D +6.5%
14. Georgia: D +6%
15. Michigan: R +4.7%
All of these changes (in the 15 states above) are (more than) statistically significant. It's almost shocking to see how much a switch from Obama to Hillary would mean for the states of Arkansas and Colorado. As of now, Hillary has had more than a 30% better swing in Arkansas than in Colorado, meaning that if current poll averages where to become the actual 2016 outcome, Hillary could actually perform up to 5.5% stronger in Arkansas than Colorado. However, they're not completely compatible as Paul Ryan currently polls best in Colorado, while Christie is ahead in Arkansas.
The whole list of states having been polled till now, going from Democratic stronghold to Republican stronghold:
New York: D +28%
New Mexico: D +14%
New Jersey: D +10.5%
Maine: D +8%
Florida: D +7.4%
Currently estimated/projected national average: D +7.3%
Minnesota: D +6%
Ohio: D +5.75%
Wisconsin: D +5.1%
Michigan: D +4.8%
New Hampshire: D +3.7%
Virginia: D +3.2%
Iowa: D +1.85%
Pennsylvania: D +1.75%
North Carolina: D +0.3%
Arizona: R +1%
Georgia: R +2%
Arkansas: R +3%
Colorado: R +3.5%
Kentucky: R +4%
Louisiana: R +5%
South Carolina: R +7%
Alaska: R +7.5%
Texas: R +8%
Mississippi: R +9%
Kansas: R +9%
Montana: R +13%
West Virginia: R +14%
Wyoming: R +28%
Here are the current stats on Republican candidates:
1. Chris Christie favoured in 14 of 28 states (for 173 EVs)
2. Jeb Bush favoured in 6 states (Florida, Arizona, Kentucky (!!), Kansas, West Virginia & Alaska - for 62 EVs)
3. Mike Huckabee in 4 states (Texas (!), Louisiana (!), Arkansas & Iowa (!) - for 58 EVs)
4. Paul Ryan favoured in 2 states (Wisconsin & Colorado - for 19 EVs)
5. Marco Rubio favoured in 1 state (South Carolina - for 9 EVs)
6. Susana Martinez favoured in 1 state (New Mexico - for 5 EVs)
7. Rand Paul favoured in 1 state (Montana - for 3 EVs)
All in all; North Carolina, Florida, Ohio and New Mexico being amazing news for Hillary (a red state going blue or blue states going even bluer), while Colorado is equally bad news for her (a blue state going red). Interestingly though, four out of those five states are swing/battleground/purple states. Meaning that we're not seeing a further polarization of the electorate in most states - at least not this far.
Current update as of May 5.
The total number of state polls added to the lists below has thus now reached 115.
So here they are - all the 2016 poll averages for each state so far - 28 states having been polled to date - and how far off they are compared to the actual 2012 outcomes. I'm only including the Republican candidate with the best statewide polling.
Alaska: Hillary vs Jeb Bush: R +7.5%
+6.5% D improvement
(Updated on February 5, 2014)
Arizona: Hillary vs Bush: R +1%
+8% D improvement
(Updated on March 6, 2014)
Arkansas: Hillary vs Mike Huckabee: R +3%
+17% D improvement
(Updated on May 5, 2014)
Colorado: Hillary vs Paul Ryan: R +3.5%
+8.9% R improvement
Current Republican gain
(Updated on April 25, 2014)
Florida: Hillary vs Bush: D +7.4%
+6.5% D improvement
(Updated on May 5, 2014)
Georgia: Hillary vs Christie: R +2%
+6% D improvement
(Updated August 8 )
Iowa: Hillary vs Mike Huckabee: D +1.85%
+4% R improvement
(Updated on April 18, 2014)
Kansas: Hillary vs Bush: R +9%
+13% D improvement
(Updated on February 24, 2014)
Kentucky: Hillary vs Christie/Bush: R +4%
+19% D improvement
(Updated on December 22)
Louisiana: Hillary vs Huckabee: R +5%
+12% D improvement
(Updated on February 18, 2014)
Maine: Hillary vs Christie: D +8%
+7% R improvement
(Updated on November 13)
Michigan: Hillary vs Christie: D +4.8%
+4.7% R improvement
(Updated on April 9, 2014)
Minnesota: Hillary vs Christie: D +6%
+2% R improvement
(Updated on January 22, 2013)
Mississippi: Hillary vs Christie: R +9%
+2.5% D improvement
(Updated on November 19)
Montana: Hillary vs Rand Paul: R +13%
+1% D improvement
(Updated on November 24)
New Hampshire: Hillary vs Christie: D +3.7%
+1.9% R improvement
(Updated on January 30, 2014)
New Jersey: Hillary vs Christie: D +10.5%
+7.3% R improvement
(Updated on March 4, 2014)
New Mexico: Hillary vs Susana Martinez: D +14%
+4% D improvement
(Updated on March 27, 2014)
New York: Hillary vs Christie: D +28%
+0.2% R improvement
(Updated on March 4, 2014)
North Carolina: Hillary vs Christie: D +0.33%
+2.4% D improvement
Current Democratic gain
(Updated on April 10, 2014)
Ohio: Hillary vs Christie: D +5.75%
+2.8% D improvement
(Updated on February 20, 2014)
Pennsylvania: Hillary vs Christie: D +1.75%
+3.6% R improvement
(Updated on February 27, 2014)
South Carolina: Hillary vs Marco Rubio: R+7%
+3.5% D improvement
(Updated on November 2)
Texas: Hillary vs Huckabee: R +8%
+8% D improvement
(Updated on April 18, 2014)
Virginia: Hillary vs Christie: D +3.22%
+0.6% R improvement
(Updated on March 27, 2014)
West Virginia: Hillary vs Bush: R +14%
+13% D improvement
(Updated on October 1)
Wisconsin: Hillary vs Ryan: D +5.1%
+1.8% R improvement
(Updated on April 25, 2014)
Wyoming: Hillary vs Christie: R +28%
+13% D improvement
(Updated on July 23)
Average all 28 states: Hillary vs Best Republican: R +0.5%
+3.4% D improvement (from Obama 2012) [projecting a 7.3% victory for Hillary]
That gives us this map right now:
(
Red = Democratic lead
Blue = Republican lead
Green = Exact tie
Grey = No polling yet
Green = toss up
20% shade = 0.1-1% lead
30% shade = 1.1-3% lead
40% shade = 3.1-6% lead
50% shade = 6.1-9% lead
60% shade = 9.1-12% lead
70% shade = 12.1-15% lead
80% shade = 15.1-18% lead
90% shade = Above 18.1% lead
In the count of electoral votes, this means the current situation looks like this:
Hillary: 209 EVs (for a total of 14 states)
Best/Tailormade Republican: 120 EVs (for a total of 14 states)
Toss-up: None
No polling: 209 EVs [almost half, including California] (for a total of 22 states + D.C.)
Which means that Hillary has captured a rather impressive 63.5% of all EVs awarded thus far, against a disappointing 36.5% EVs for the tailormade Republican.
This is how the Trendline Map looks so far:
(
The states which right now are showing the strongest improvement for the Democratic (Hillary) or the Republican candidate (in 14 out of 28 cases, Christie is that person):
1. Kentucky: D +19%
2. Arkansas: D +17%
3. Kansas: D +13%
4. West Virginia: D +13%
5. Wyoming: D +13%
6. Louisiana: D +12%
7. Colorado: R +8.9%
8. Arizona: D +8%
8. Texas: D +8%
10. New Jersey: R +7.3%
11. Maine: R +7%
12. Florida: D +6.5%
13. Alaska: D +6.5%
14. Georgia: D +6%
15. Michigan: R +4.7%
All of these changes (in the 15 states above) are (more than) statistically significant. It's almost shocking to see how much a switch from Obama to Hillary would mean for the states of Arkansas and Colorado. As of now, Hillary has had more than a 30% better swing in Arkansas than in Colorado, meaning that if current poll averages where to become the actual 2016 outcome, Hillary could actually perform up to 5.5% stronger in Arkansas than Colorado. However, they're not completely compatible as Paul Ryan currently polls best in Colorado, while Christie is ahead in Arkansas.
The whole list of states having been polled till now, going from Democratic stronghold to Republican stronghold:
New York: D +28%
New Mexico: D +14%
New Jersey: D +10.5%
Maine: D +8%
Florida: D +7.4%
Currently estimated/projected national average: D +7.3%
Minnesota: D +6%
Ohio: D +5.75%
Wisconsin: D +5.1%
Michigan: D +4.8%
New Hampshire: D +3.7%
Virginia: D +3.2%
Iowa: D +1.85%
Pennsylvania: D +1.75%
North Carolina: D +0.3%
Arizona: R +1%
Georgia: R +2%
Arkansas: R +3%
Colorado: R +3.5%
Kentucky: R +4%
Louisiana: R +5%
South Carolina: R +7%
Alaska: R +7.5%
Texas: R +8%
Mississippi: R +9%
Kansas: R +9%
Montana: R +13%
West Virginia: R +14%
Wyoming: R +28%
Here are the current stats on Republican candidates:
1. Chris Christie favoured in 14 of 28 states (for 173 EVs)
2. Jeb Bush favoured in 6 states (Florida, Arizona, Kentucky (!!), Kansas, West Virginia & Alaska - for 62 EVs)
3. Mike Huckabee in 4 states (Texas (!), Louisiana (!), Arkansas & Iowa (!) - for 58 EVs)
4. Paul Ryan favoured in 2 states (Wisconsin & Colorado - for 19 EVs)
5. Marco Rubio favoured in 1 state (South Carolina - for 9 EVs)
6. Susana Martinez favoured in 1 state (New Mexico - for 5 EVs)
7. Rand Paul favoured in 1 state (Montana - for 3 EVs)
All in all; North Carolina, Florida, Ohio and New Mexico being amazing news for Hillary (a red state going blue or blue states going even bluer), while Colorado is equally bad news for her (a blue state going red). Interestingly though, four out of those five states are swing/battleground/purple states. Meaning that we're not seeing a further polarization of the electorate in most states - at least not this far.
Current update as of May 5.
Title: Re: 2016 Official Polling Map Thread
Post by: eric82oslo on May 11, 2014, 05:58:02 PM
The new Dartmouth/Rockefeller Center poll of New Hampshire is the first ever 2016 poll of that state to include Mike Huckabee in the mix up. And boy does he do well, only trailing Hillary by 2.1%. However, one should be a bit cautious with the numbers, as except for the Jeb Bush match-up, the 3 other match-up numbers all seem a bit inflated for the Republican candidate compared to previous polls of the state. Nevertheless, this means that Huckabee has managed to steal the New Hampshire crown from Christie for now.
The total number of state polls added to the lists below has thus now reached 116.
So here they are - all the 2016 poll averages for each state so far - 28 states having been polled to date - and how far off they are compared to the actual 2012 outcomes. I'm only including the Republican candidate with the best statewide polling.
Alaska: Hillary vs Jeb Bush: R +7.5%
+6.5% D improvement
(Updated on February 5, 2014)
Arizona: Hillary vs Bush: R +1%
+8% D improvement
(Updated on March 6, 2014)
Arkansas: Hillary vs Mike Huckabee: R +3%
+17% D improvement
(Updated on May 5, 2014)
Colorado: Hillary vs Paul Ryan: R +3.5%
+8.9% R improvement
Current Republican gain
(Updated on April 25, 2014)
Florida: Hillary vs Bush: D +7.4%
+6.5% D improvement
(Updated on May 5, 2014)
Georgia: Hillary vs Christie: R +2%
+6% D improvement
(Updated August 8 )
Iowa: Hillary vs Mike Huckabee: D +1.85%
+4% R improvement
(Updated on April 18, 2014)
Kansas: Hillary vs Bush: R +9%
+13% D improvement
(Updated on February 24, 2014)
Kentucky: Hillary vs Christie/Bush: R +4%
+19% D improvement
(Updated on December 22)
Louisiana: Hillary vs Huckabee: R +5%
+12% D improvement
(Updated on February 18, 2014)
Maine: Hillary vs Christie: D +8%
+7% R improvement
(Updated on November 13)
Michigan: Hillary vs Christie: D +4.8%
+4.7% R improvement
(Updated on April 9, 2014)
Minnesota: Hillary vs Christie: D +6%
+2% R improvement
(Updated on January 22, 2013)
Mississippi: Hillary vs Christie: R +9%
+2.5% D improvement
(Updated on November 19)
Montana: Hillary vs Rand Paul: R +13%
+1% D improvement
(Updated on November 24)
New Hampshire: Hillary vs Huckabee: D +2.1%
+3.5% R improvement
(Updated on May 12, 2014)
New Jersey: Hillary vs Christie: D +10.5%
+7.3% R improvement
(Updated on March 4, 2014)
New Mexico: Hillary vs Susana Martinez: D +14%
+4% D improvement
(Updated on March 27, 2014)
New York: Hillary vs Christie: D +28%
+0.2% R improvement
(Updated on March 4, 2014)
North Carolina: Hillary vs Christie: D +0.33%
+2.4% D improvement
Current Democratic gain
(Updated on April 10, 2014)
Ohio: Hillary vs Christie: D +5.75%
+2.8% D improvement
(Updated on February 20, 2014)
Pennsylvania: Hillary vs Christie: D +1.75%
+3.6% R improvement
(Updated on February 27, 2014)
South Carolina: Hillary vs Marco Rubio: R+7%
+3.5% D improvement
(Updated on November 2)
Texas: Hillary vs Huckabee: R +8%
+8% D improvement
(Updated on April 18, 2014)
Virginia: Hillary vs Christie: D +3.22%
+0.6% R improvement
(Updated on March 27, 2014)
West Virginia: Hillary vs Bush: R +14%
+13% D improvement
(Updated on October 1)
Wisconsin: Hillary vs Ryan: D +5.1%
+1.8% R improvement
(Updated on April 25, 2014)
Wyoming: Hillary vs Christie: R +28%
+13% D improvement
(Updated on July 23)
Average all 28 states: Hillary vs Best Republican: R +0.5%
+3.4% D improvement (from Obama 2012) [projecting a 7.2% victory for Hillary]
That gives us this map right now:
( )
)
Red = Democratic lead
Blue = Republican lead
Green = Exact tie
Grey = No polling yet
Green = toss up
20% shade = 0.1-1% lead
30% shade = 1.1-3% lead
40% shade = 3.1-6% lead
50% shade = 6.1-9% lead
60% shade = 9.1-12% lead
70% shade = 12.1-15% lead
80% shade = 15.1-18% lead
90% shade = Above 18.1% lead
In the count of electoral votes, this means the current situation looks like this:
Hillary: 209 EVs (for a total of 14 states)
Best/Tailormade Republican: 120 EVs (for a total of 14 states)
Toss-up: None
No polling: 209 EVs [almost half, including California] (for a total of 22 states + D.C.)
Which means that Hillary has captured a rather impressive 63.5% of all EVs awarded thus far, against a disappointing 36.5% EVs for the tailormade Republican.
This is how the Trendline Map looks so far:
(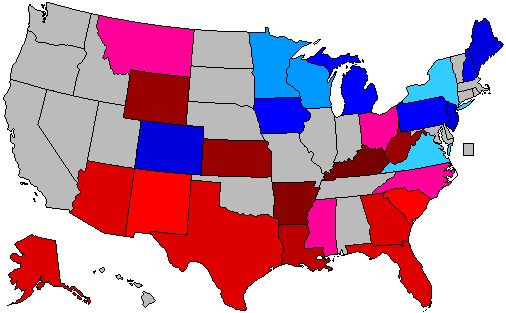 )
)
The states which right now are showing the strongest improvement for the Democratic (Hillary) or the Republican candidate (in 13 out of 28 cases, Christie is that person):
1. Kentucky: D +19%
2. Arkansas: D +17%
3. Kansas: D +13%
4. West Virginia: D +13%
5. Wyoming: D +13%
6. Louisiana: D +12%
7. Colorado: R +8.9%
8. Arizona: D +8%
8. Texas: D +8%
10. New Jersey: R +7.3%
11. Maine: R +7%
12. Florida: D +6.5%
13. Alaska: D +6.5%
14. Georgia: D +6%
15. Michigan: R +4.7%
All of these changes (in the 15 states above) are (more than) statistically significant. It's almost shocking to see how much a switch from Obama to Hillary would mean for the states of Arkansas and Colorado. As of now, Hillary has had more than a 30% better swing in Arkansas than in Colorado, meaning that if current poll averages where to become the actual 2016 outcome, Hillary could actually perform up to 5.5% stronger in Arkansas than Colorado. However, they're not completely compatible as Paul Ryan currently polls best in Colorado, while Christie is ahead in Arkansas.
The whole list of states having been polled till now, going from Democratic stronghold to Republican stronghold:
New York: D +28%
New Mexico: D +14%
New Jersey: D +10.5%
Maine: D +8%
Florida: D +7.4%
Currently estimated/projected national average: D +7.2%
Minnesota: D +6%
Ohio: D +5.75%
Wisconsin: D +5.1%
Michigan: D +4.8%
Virginia: D +3.2%
New Hampshire: D +2.1%
Iowa: D +1.85%
Pennsylvania: D +1.75%
North Carolina: D +0.3%
Arizona: R +1%
Georgia: R +2%
Arkansas: R +3%
Colorado: R +3.5%
Kentucky: R +4%
Louisiana: R +5%
South Carolina: R +7%
Alaska: R +7.5%
Texas: R +8%
Mississippi: R +9%
Kansas: R +9%
Montana: R +13%
West Virginia: R +14%
Wyoming: R +28%
Here are the current stats on Republican candidates:
1. Chris Christie favoured in 13 of 28 states (for 169 EVs)
2. Jeb Bush favoured in 6 states (Florida, Arizona, Kentucky (!!), Kansas, West Virginia & Alaska - for 62 EVs)
3. Mike Huckabee in 5 states (Texas (!), Louisiana (!), Arkansas, Iowa (!) & New Hampshire (!) - for 62 EVs)
4. Paul Ryan favoured in 2 states (Wisconsin & Colorado - for 19 EVs)
5. Marco Rubio favoured in 1 state (South Carolina - for 9 EVs)
6. Susana Martinez favoured in 1 state (New Mexico - for 5 EVs)
7. Rand Paul favoured in 1 state (Montana - for 3 EVs)
All in all; North Carolina, Florida, Ohio and New Mexico being amazing news for Hillary (a red state going blue or blue states going even bluer), while Colorado is equally bad news for her (a blue state going red). Interestingly though, four out of those five states are swing/battleground/purple states. Meaning that we're not seeing a further polarization of the electorate in most states - at least not this far.
Current update as of May 12.
The total number of state polls added to the lists below has thus now reached 116.
So here they are - all the 2016 poll averages for each state so far - 28 states having been polled to date - and how far off they are compared to the actual 2012 outcomes. I'm only including the Republican candidate with the best statewide polling.
Alaska: Hillary vs Jeb Bush: R +7.5%
+6.5% D improvement
(Updated on February 5, 2014)
Arizona: Hillary vs Bush: R +1%
+8% D improvement
(Updated on March 6, 2014)
Arkansas: Hillary vs Mike Huckabee: R +3%
+17% D improvement
(Updated on May 5, 2014)
Colorado: Hillary vs Paul Ryan: R +3.5%
+8.9% R improvement
Current Republican gain
(Updated on April 25, 2014)
Florida: Hillary vs Bush: D +7.4%
+6.5% D improvement
(Updated on May 5, 2014)
Georgia: Hillary vs Christie: R +2%
+6% D improvement
(Updated August 8 )
Iowa: Hillary vs Mike Huckabee: D +1.85%
+4% R improvement
(Updated on April 18, 2014)
Kansas: Hillary vs Bush: R +9%
+13% D improvement
(Updated on February 24, 2014)
Kentucky: Hillary vs Christie/Bush: R +4%
+19% D improvement
(Updated on December 22)
Louisiana: Hillary vs Huckabee: R +5%
+12% D improvement
(Updated on February 18, 2014)
Maine: Hillary vs Christie: D +8%
+7% R improvement
(Updated on November 13)
Michigan: Hillary vs Christie: D +4.8%
+4.7% R improvement
(Updated on April 9, 2014)
Minnesota: Hillary vs Christie: D +6%
+2% R improvement
(Updated on January 22, 2013)
Mississippi: Hillary vs Christie: R +9%
+2.5% D improvement
(Updated on November 19)
Montana: Hillary vs Rand Paul: R +13%
+1% D improvement
(Updated on November 24)
New Hampshire: Hillary vs Huckabee: D +2.1%
+3.5% R improvement
(Updated on May 12, 2014)
New Jersey: Hillary vs Christie: D +10.5%
+7.3% R improvement
(Updated on March 4, 2014)
New Mexico: Hillary vs Susana Martinez: D +14%
+4% D improvement
(Updated on March 27, 2014)
New York: Hillary vs Christie: D +28%
+0.2% R improvement
(Updated on March 4, 2014)
North Carolina: Hillary vs Christie: D +0.33%
+2.4% D improvement
Current Democratic gain
(Updated on April 10, 2014)
Ohio: Hillary vs Christie: D +5.75%
+2.8% D improvement
(Updated on February 20, 2014)
Pennsylvania: Hillary vs Christie: D +1.75%
+3.6% R improvement
(Updated on February 27, 2014)
South Carolina: Hillary vs Marco Rubio: R+7%
+3.5% D improvement
(Updated on November 2)
Texas: Hillary vs Huckabee: R +8%
+8% D improvement
(Updated on April 18, 2014)
Virginia: Hillary vs Christie: D +3.22%
+0.6% R improvement
(Updated on March 27, 2014)
West Virginia: Hillary vs Bush: R +14%
+13% D improvement
(Updated on October 1)
Wisconsin: Hillary vs Ryan: D +5.1%
+1.8% R improvement
(Updated on April 25, 2014)
Wyoming: Hillary vs Christie: R +28%
+13% D improvement
(Updated on July 23)
Average all 28 states: Hillary vs Best Republican: R +0.5%
+3.4% D improvement (from Obama 2012) [projecting a 7.2% victory for Hillary]
That gives us this map right now:
(
Red = Democratic lead
Blue = Republican lead
Green = Exact tie
Grey = No polling yet
Green = toss up
20% shade = 0.1-1% lead
30% shade = 1.1-3% lead
40% shade = 3.1-6% lead
50% shade = 6.1-9% lead
60% shade = 9.1-12% lead
70% shade = 12.1-15% lead
80% shade = 15.1-18% lead
90% shade = Above 18.1% lead
In the count of electoral votes, this means the current situation looks like this:
Hillary: 209 EVs (for a total of 14 states)
Best/Tailormade Republican: 120 EVs (for a total of 14 states)
Toss-up: None
No polling: 209 EVs [almost half, including California] (for a total of 22 states + D.C.)
Which means that Hillary has captured a rather impressive 63.5% of all EVs awarded thus far, against a disappointing 36.5% EVs for the tailormade Republican.
This is how the Trendline Map looks so far:
(
The states which right now are showing the strongest improvement for the Democratic (Hillary) or the Republican candidate (in 13 out of 28 cases, Christie is that person):
1. Kentucky: D +19%
2. Arkansas: D +17%
3. Kansas: D +13%
4. West Virginia: D +13%
5. Wyoming: D +13%
6. Louisiana: D +12%
7. Colorado: R +8.9%
8. Arizona: D +8%
8. Texas: D +8%
10. New Jersey: R +7.3%
11. Maine: R +7%
12. Florida: D +6.5%
13. Alaska: D +6.5%
14. Georgia: D +6%
15. Michigan: R +4.7%
All of these changes (in the 15 states above) are (more than) statistically significant. It's almost shocking to see how much a switch from Obama to Hillary would mean for the states of Arkansas and Colorado. As of now, Hillary has had more than a 30% better swing in Arkansas than in Colorado, meaning that if current poll averages where to become the actual 2016 outcome, Hillary could actually perform up to 5.5% stronger in Arkansas than Colorado. However, they're not completely compatible as Paul Ryan currently polls best in Colorado, while Christie is ahead in Arkansas.
The whole list of states having been polled till now, going from Democratic stronghold to Republican stronghold:
New York: D +28%
New Mexico: D +14%
New Jersey: D +10.5%
Maine: D +8%
Florida: D +7.4%
Currently estimated/projected national average: D +7.2%
Minnesota: D +6%
Ohio: D +5.75%
Wisconsin: D +5.1%
Michigan: D +4.8%
Virginia: D +3.2%
New Hampshire: D +2.1%
Iowa: D +1.85%
Pennsylvania: D +1.75%
North Carolina: D +0.3%
Arizona: R +1%
Georgia: R +2%
Arkansas: R +3%
Colorado: R +3.5%
Kentucky: R +4%
Louisiana: R +5%
South Carolina: R +7%
Alaska: R +7.5%
Texas: R +8%
Mississippi: R +9%
Kansas: R +9%
Montana: R +13%
West Virginia: R +14%
Wyoming: R +28%
Here are the current stats on Republican candidates:
1. Chris Christie favoured in 13 of 28 states (for 169 EVs)
2. Jeb Bush favoured in 6 states (Florida, Arizona, Kentucky (!!), Kansas, West Virginia & Alaska - for 62 EVs)
3. Mike Huckabee in 5 states (Texas (!), Louisiana (!), Arkansas, Iowa (!) & New Hampshire (!) - for 62 EVs)
4. Paul Ryan favoured in 2 states (Wisconsin & Colorado - for 19 EVs)
5. Marco Rubio favoured in 1 state (South Carolina - for 9 EVs)
6. Susana Martinez favoured in 1 state (New Mexico - for 5 EVs)
7. Rand Paul favoured in 1 state (Montana - for 3 EVs)
All in all; North Carolina, Florida, Ohio and New Mexico being amazing news for Hillary (a red state going blue or blue states going even bluer), while Colorado is equally bad news for her (a blue state going red). Interestingly though, four out of those five states are swing/battleground/purple states. Meaning that we're not seeing a further polarization of the electorate in most states - at least not this far.
Current update as of May 12.
Title: Re: 2016 Official Polling Map Thread
Post by: pbrower2a on May 11, 2014, 09:08:11 PM
I'm not using the Dartmouth poll -- too many undecided. Do you remember the polls from the summer of 2008 that showed Barack Obama up 43-41 or so in North and South Dakota? Of course. Obama would top out around 46% in those states.
New Hampshire could easily be a mirror image of such.
New Hampshire could easily be a mirror image of such.
Title: Re: 2016 Official Polling Map Thread
Post by: pbrower2a on May 12, 2014, 09:17:59 AM
There just aren't that many arguable swing states not now polled.
I would guess that having been Governor of Arkansas matter far more than does having been First Lady of the State, so I would guess that Mike Huckabee would win the state. I see no cause to believe that Paul Ryan will run for President in 2016; he seems more interested in gaining power within the House of Representatives. So Colorado goes to Clinton.
Using green for unpolled states almost certain to go R and using orange for unpolled states almost certain to go D, and I get (pastel green and orange)
()
I have no idea on either Indiana or Missouri, and NE-02 would be in doubt.
It looks like a replay of 2008 except with Indiana and Missouri undecided.
I would guess that having been Governor of Arkansas matter far more than does having been First Lady of the State, so I would guess that Mike Huckabee would win the state. I see no cause to believe that Paul Ryan will run for President in 2016; he seems more interested in gaining power within the House of Representatives. So Colorado goes to Clinton.
Using green for unpolled states almost certain to go R and using orange for unpolled states almost certain to go D, and I get (pastel green and orange)
(
I have no idea on either Indiana or Missouri, and NE-02 would be in doubt.
It looks like a replay of 2008 except with Indiana and Missouri undecided.
Even this understates Democratic chances. The potential nominee who wins Arkansas loses Arizona, and vice-versa. A Republican nominee for President can afford to lose neither state.
Arkansas looks like less of a loss than Arizona, but although Arkansas has five fewer electoral votes, Arkansas has plenty of political analogues. If you look at the five states that Bill Clinton won twice and Obama lost by huge margins twice (AR, KY, LA, TN, WV), you notice 38 electoral votes -- as much as Texas. These states are demographically similar to Arkansas.
To some extent that neglects Georgia and Missouri, which could also be GOP disasters.
Title: Re: 2016 Official Polling Map Thread
Post by: eric82oslo on May 13, 2014, 12:32:15 AM
To find out which state would be the most likely tipping point state in 2016 based on all the data gathered so far, I've worked out this list of states going from likely Democratic to likely Republican (assuming that the non-polled states stay the same as in 2012):
1. D.C. - 3 EVs (still not polled)
2. Hawaii - 7 EVs (accumulated) (still not polled)
3. Vermont - 10 EVs (still not polled)
4. New York - 39 EVs
5. Rhode Island - 43 EVs (still not polled)
6. Maryland - 53 EVs (still not polled)
7. Massachusetts - 64 EVs (still not polled)
8. California - 119 EVs (still not polled)
9. Delaware - 122 EVs (still not polled)
10. Connecticut - 129 EVs (still not polled)
11. Illinois - 149 EVs (still not polled)
12. Washington - 161 EVs (still not polled)
13. New Mexico - 166 EVs
14. Oregon - 173 EVs (still not polled)
15. New Jersey - 187 EVs
16. Maine - 191 EVs
17. Florida - 220 EVs
18. Nevada - 226 EVs (still not polled for 2016!)
19. Minnesota - 236 EVs
20. Ohio - 254 EVs
21. Wisconsin - 264 EVs
22. Michigan - 280 EVs - currently the most likely tipping point state
23. Virginia - 293 EVs
24. New Hampshire - 297 EVs
25. Iowa - 303 EVs
26. Pennsylvania - 323 EVs
27. North Carolina - 338 EVs
---current red/blue divide---
28. Arizona - 349 EVs
29. Georgia - 365 EVs
30. Arkansas - 371 EVs
31. Colorado - 380 EVs
32. Kentucky - 388 EVs
33. Louisiana - 396 EVs
34. South Carolina - 405 EVs
35. Alaska - 408 EVs
36. Texas - 446 EVs
37. Mississippi - 452 EVs
38. Kansas - 458 EVs
39. Missouri - 468 EVs (still not polled)
40. Indiana - 479 EVs (still not polled)
41. Montana - 482 EVs
42. West Virginia - 487 EVs
43. South Dakota - 490 EVs (still not polled)
44. North Dakota - 493 EVs (still not polled)
45. Tennessee - 504 EVs (still not polled)
46. Nebraska - 509 EVs (still not polled)
47. Alabama - 518 EVs (still not polled)
48. Wyoming - 521 EVs
49. Idaho - 525 EVs (still not polled)
50. Oklahoma - 532 EVs (still not polled)
51. Utah - 538 EVs (still not polled)
Michigan would be the tipping point state even if it happened to surpass Wisconsin on this list. So Michigan will for sure be a crucial battleground state in 2016, even if it will be far from the only one. Other big states +/- 3-5% off Michigan's current average of Hillary +4.8% should be considered crucial as well, including Florida, Ohio, Virginia, Pennsylvania, Wisconsin and Minnesota.
If the current poll numbers are about right, it could mean that the Democratic advantage of 2012 could reverse into a Republican advantage in the Electoral College in 2016, which could turn out to be about a -2.4% disadvantage for Hillary. Compare that to Obama's Electoral College advantage in 2012, which was about +1.5%. The reason for this is obvious; most battleground states - with the clear exceptions of Florida, Ohio and North Carolina - have either not moved much at all, or have moved in a Republican direction for now. That's a big contrast to most Republican states, which have on average moved a lot towards Hillary.
Title: Re: 2016 Official Polling Map Thread
Post by: pbrower2a on May 14, 2014, 12:24:30 PM
Quote
North Carolina Survey Results (PPP)
Q5
If the candidates for President next time were
Democrat Hillary Clinton and Republican Jeb
Bush, who would you vote for?
45% Hillary Clinton
42% Jeb Bush
13% Not sure
Q6
If the candidates for President next time were
Democrat Hillary Clinton and Republican Chris
Christie, who would you vote for?
44% Hillary Clinton
40% Chris Christie
16% Not sure
Q7
If the candidates for President next time were
Democrat Hillary Clinton and Republican Mike
Huckabee, who would you vote for?
47% Hillary Clinton
43% Mike Huckabee
10% Not sure
Q8 If the candidates for President next time were
Democrat Hillary Clinton and Republican Rand
Paul, who would you vote for?
45% Hillary Clinton
44% Rand Paul
11% Not sure
http://www.publicpolicypolling.com/pdf/2014/PPP_Release_NC_514.pdf
Mostly within the margin of error, and all likely wins for Hillary Clinton. That said, any Republican nominee for President would be in trouble if he were winning North Carolina by less than the margin of error.
Hillary Clinton vs. Jeb Bush
(
Hillary Clinton vs. Chris Christie
(
Hillary Clinton vs. Mike Huckabee
(
Hillary Clinton vs. Rand Paul
(
blue, Republican -- red, Democratic
30% -- lead with 40-49% but a margin of 3% or less
40% -- lead with 40-49% but a margin of 4% or more
60% -- lead with 50-54%
70% -- lead with 55-59%
90% -- lead with 60% or more
[/quote]
Title: Re: 2016 Official Polling Map Thread
Post by: pbrower2a on May 14, 2014, 02:05:41 PM
PPP, Alaska:
http://www.publicpolicypolling.com/main/2014/05/alaska-miscellany.html#more
Alaska could be close in 2016.
Hillary Clinton vs. Jeb Bush
( )
)
Hillary Clinton vs. Chris Christie
( )
)
Hillary Clinton vs. Mike Huckabee
(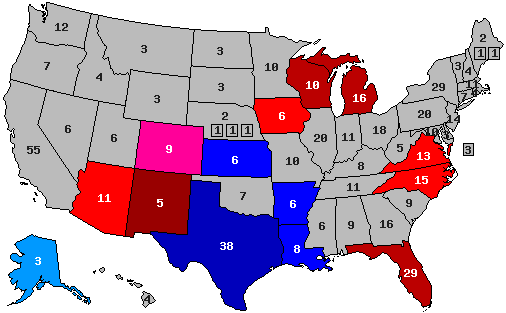 )
)
Hillary Clinton vs. Rand Paul
(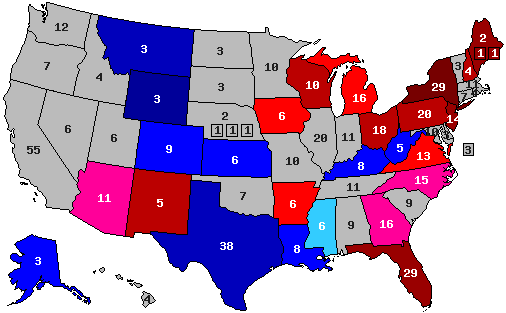 )
)
blue, Republican -- red, Democratic
30% -- lead with 40-49% but a margin of 3% or less
40% -- lead with 40-49% but a margin of 4% or more
60% -- lead with 50-54%
70% -- lead with 55-59%
90% -- lead with 60% or more
Quote
Alaskans don't have much to say for a potential Sarah Palin Presidential bid in 2016. Only 19% think she should seek the White House, compared to 74% who think she should sit it out. Even among Republicans just 24% want her to run while 70% believe she should take a pass. Palin is actually so weak that she would trail Hillary Clinton 44/41 in a hypothetical contest, even as the rest of the Republican field would lead Clinton. Mike Huckabee has a 43/42 advantage over her, Chris Christie is up 44/41, Rand Paul is up 46/40, and Jeb Bush is up 47/41.
http://www.publicpolicypolling.com/main/2014/05/alaska-miscellany.html#more
Alaska could be close in 2016.
Hillary Clinton vs. Jeb Bush
(
Hillary Clinton vs. Chris Christie
(
Hillary Clinton vs. Mike Huckabee
(
Hillary Clinton vs. Rand Paul
(
blue, Republican -- red, Democratic
30% -- lead with 40-49% but a margin of 3% or less
40% -- lead with 40-49% but a margin of 4% or more
60% -- lead with 50-54%
70% -- lead with 55-59%
90% -- lead with 60% or more
Title: Re: 2016 Official Polling Map Thread
Post by: eric82oslo on May 14, 2014, 04:02:10 PM
PPP has released two more 2016 smatch-up polls today. The Alaska poll marks the 4th PPP poll of the state, while the North Carolina poll is the 8th 2016 poll in that state, all executed by PPP as well. Jeb Bush' lead in Alaska decreases slightly from +7.5% to +7%, with Rand Paul just behind him at +6%. Hillary's lead over Chris Christie in North Carolina inches slightly up from +0.3% to her current +0.9%. Bush does second best in the state among GOPers, only trailing her by 2.3%. The rest of the field (Huckabee, Rand Paul, Cruz & Rubio) trails her by more than 5%.
The total number of state polls included in the lists below has thus now reached 118.
So here they are - all the 2016 poll averages for each state so far - 28 states having been polled to date - and how far off they are compared to the actual 2012 outcomes. I'm only including the Republican candidate with the best statewide polling.
Alaska: Hillary vs Jeb Bush: R +7%
+7% D improvement
(Updated on May 14, 2014)
Arizona: Hillary vs Bush: R +1%
+8% D improvement
(Updated on March 6, 2014)
Arkansas: Hillary vs Mike Huckabee: R +3%
+17% D improvement
(Updated on May 5, 2014)
Colorado: Hillary vs Paul Ryan: R +3.5%
+8.9% R improvement
Current Republican gain
(Updated on April 25, 2014)
Florida: Hillary vs Bush: D +7.4%
+6.5% D improvement
(Updated on May 5, 2014)
Georgia: Hillary vs Christie: R +2%
+6% D improvement
(Updated August 8 )
Iowa: Hillary vs Mike Huckabee: D +1.85%
+4% R improvement
(Updated on April 18, 2014)
Kansas: Hillary vs Bush: R +9%
+13% D improvement
(Updated on February 24, 2014)
Kentucky: Hillary vs Christie/Bush: R +4%
+19% D improvement
(Updated on December 22)
Louisiana: Hillary vs Huckabee: R +5%
+12% D improvement
(Updated on February 18, 2014)
Maine: Hillary vs Christie: D +8%
+7% R improvement
(Updated on November 13)
Michigan: Hillary vs Christie: D +4.8%
+4.7% R improvement
(Updated on April 9, 2014)
Minnesota: Hillary vs Christie: D +6%
+2% R improvement
(Updated on January 22, 2013)
Mississippi: Hillary vs Christie: R +9%
+2.5% D improvement
(Updated on November 19)
Montana: Hillary vs Rand Paul: R +13%
+1% D improvement
(Updated on November 24)
New Hampshire: Hillary vs Huckabee: D +2.1%
+3.5% R improvement
(Updated on May 12, 2014)
New Jersey: Hillary vs Christie: D +10.5%
+7.3% R improvement
(Updated on March 4, 2014)
New Mexico: Hillary vs Susana Martinez: D +14%
+4% D improvement
(Updated on March 27, 2014)
New York: Hillary vs Christie: D +28%
+0.2% R improvement
(Updated on March 4, 2014)
North Carolina: Hillary vs Christie: D +0.9%
+2.9% D improvement
Current Democratic gain
(Updated on May 14, 2014)
Ohio: Hillary vs Christie: D +5.75%
+2.8% D improvement
(Updated on February 20, 2014)
Pennsylvania: Hillary vs Christie: D +1.75%
+3.6% R improvement
(Updated on February 27, 2014)
South Carolina: Hillary vs Marco Rubio: R+7%
+3.5% D improvement
(Updated on November 2)
Texas: Hillary vs Huckabee: R +8%
+8% D improvement
(Updated on April 18, 2014)
Virginia: Hillary vs Christie: D +3.22%
+0.6% R improvement
(Updated on March 27, 2014)
West Virginia: Hillary vs Bush: R +14%
+13% D improvement
(Updated on October 1)
Wisconsin: Hillary vs Ryan: D +5.1%
+1.8% R improvement
(Updated on April 25, 2014)
Wyoming: Hillary vs Christie: R +28%
+13% D improvement
(Updated on July 23)
Average all 28 states: Hillary vs Best Republican: R +0.5%
+3.4% D improvement (from Obama 2012) [projecting a 7.3% victory for Hillary]
That gives us this map right now:
( )
)
Red = Democratic lead
Blue = Republican lead
Green = Exact tie
Grey = No polling yet
Green = toss up
20% shade = 0.1-1% lead
30% shade = 1.1-3% lead
40% shade = 3.1-6% lead
50% shade = 6.1-9% lead
60% shade = 9.1-12% lead
70% shade = 12.1-15% lead
80% shade = 15.1-18% lead
90% shade = Above 18.1% lead
In the count of electoral votes, this means the current situation looks like this:
Hillary: 209 EVs (for a total of 14 states)
Best/Tailormade Republican: 120 EVs (for a total of 14 states)
Toss-up: None
No polling: 209 EVs [almost half, including California] (for a total of 22 states + D.C.)
Which means that Hillary has captured a rather impressive 63.5% of all EVs awarded thus far, against a disappointing 36.5% EVs for the tailormade Republican.
This is how the Trendline Map looks so far:
()
The states which right now are showing the strongest improvement for the Democratic (Hillary) or the Republican candidate (in 13 out of 28 cases, Christie is that person):
1. Kentucky: D +19%
2. Arkansas: D +17%
3. Kansas: D +13%
4. West Virginia: D +13%
5. Wyoming: D +13%
6. Louisiana: D +12%
7. Colorado: R +8.9%
8. Arizona: D +8%
8. Texas: D +8%
10. New Jersey: R +7.3%
11. Maine: R +7%
12. Alaska: D +7%
13. Florida: D +6.5%
14. Georgia: D +6%
15. Michigan: R +4.7%
All of these changes (in the 15 states above) are (more than) statistically significant. It's almost shocking to see how much a switch from Obama to Hillary would mean for the states of Arkansas and Colorado. As of now, Hillary has had more than a 30% better swing in Arkansas than in Colorado, meaning that if current poll averages where to become the actual 2016 outcome, Hillary could actually perform up to 5.5% stronger in Arkansas than Colorado. However, they're not completely compatible as Paul Ryan currently polls best in Colorado, while Christie is ahead in Arkansas.
The whole list of states having been polled till now, going from Democratic stronghold to Republican stronghold:
New York: D +28%
New Mexico: D +14%
New Jersey: D +10.5%
Maine: D +8%
Florida: D +7.4%
Currently estimated/projected national average: D +7.3%
Minnesota: D +6%
Ohio: D +5.75%
Wisconsin: D +5.1%
Michigan: D +4.8%
Virginia: D +3.2%
New Hampshire: D +2.1%
Iowa: D +1.85%
Pennsylvania: D +1.75%
North Carolina: D +0.9%
Arizona: R +1%
Georgia: R +2%
Arkansas: R +3%
Colorado: R +3.5%
Kentucky: R +4%
Louisiana: R +5%
Alaska: R +7%
South Carolina: R +7%
Texas: R +8%
Mississippi: R +9%
Kansas: R +9%
Montana: R +13%
West Virginia: R +14%
Wyoming: R +28%
Here are the current stats on Republican candidates:
1. Chris Christie favoured in 13 of 28 states (for 169 EVs)
2. Jeb Bush favoured in 6 states (Florida, Arizona, Kentucky (!!), Kansas, West Virginia & Alaska - for 62 EVs)
3. Mike Huckabee in 5 states (Texas (!), Louisiana (!), Arkansas, Iowa (!) & New Hampshire (!) - for 62 EVs)
4. Paul Ryan favoured in 2 states (Wisconsin & Colorado - for 19 EVs)
5. Marco Rubio favoured in 1 state (South Carolina - for 9 EVs)
6. Susana Martinez favoured in 1 state (New Mexico - for 5 EVs)
7. Rand Paul favoured in 1 state (Montana - for 3 EVs)
All in all; North Carolina, Florida, Ohio and New Mexico being amazing news for Hillary (a red state going blue or blue states going even bluer), while Colorado is equally bad news for her (a blue state going red). Interestingly though, four out of those five states are swing/battleground/purple states. Meaning that we're not seeing a further polarization of the electorate in most states - at least not this far.
Current update as of May 14.
The total number of state polls included in the lists below has thus now reached 118.
So here they are - all the 2016 poll averages for each state so far - 28 states having been polled to date - and how far off they are compared to the actual 2012 outcomes. I'm only including the Republican candidate with the best statewide polling.
Alaska: Hillary vs Jeb Bush: R +7%
+7% D improvement
(Updated on May 14, 2014)
Arizona: Hillary vs Bush: R +1%
+8% D improvement
(Updated on March 6, 2014)
Arkansas: Hillary vs Mike Huckabee: R +3%
+17% D improvement
(Updated on May 5, 2014)
Colorado: Hillary vs Paul Ryan: R +3.5%
+8.9% R improvement
Current Republican gain
(Updated on April 25, 2014)
Florida: Hillary vs Bush: D +7.4%
+6.5% D improvement
(Updated on May 5, 2014)
Georgia: Hillary vs Christie: R +2%
+6% D improvement
(Updated August 8 )
Iowa: Hillary vs Mike Huckabee: D +1.85%
+4% R improvement
(Updated on April 18, 2014)
Kansas: Hillary vs Bush: R +9%
+13% D improvement
(Updated on February 24, 2014)
Kentucky: Hillary vs Christie/Bush: R +4%
+19% D improvement
(Updated on December 22)
Louisiana: Hillary vs Huckabee: R +5%
+12% D improvement
(Updated on February 18, 2014)
Maine: Hillary vs Christie: D +8%
+7% R improvement
(Updated on November 13)
Michigan: Hillary vs Christie: D +4.8%
+4.7% R improvement
(Updated on April 9, 2014)
Minnesota: Hillary vs Christie: D +6%
+2% R improvement
(Updated on January 22, 2013)
Mississippi: Hillary vs Christie: R +9%
+2.5% D improvement
(Updated on November 19)
Montana: Hillary vs Rand Paul: R +13%
+1% D improvement
(Updated on November 24)
New Hampshire: Hillary vs Huckabee: D +2.1%
+3.5% R improvement
(Updated on May 12, 2014)
New Jersey: Hillary vs Christie: D +10.5%
+7.3% R improvement
(Updated on March 4, 2014)
New Mexico: Hillary vs Susana Martinez: D +14%
+4% D improvement
(Updated on March 27, 2014)
New York: Hillary vs Christie: D +28%
+0.2% R improvement
(Updated on March 4, 2014)
North Carolina: Hillary vs Christie: D +0.9%
+2.9% D improvement
Current Democratic gain
(Updated on May 14, 2014)
Ohio: Hillary vs Christie: D +5.75%
+2.8% D improvement
(Updated on February 20, 2014)
Pennsylvania: Hillary vs Christie: D +1.75%
+3.6% R improvement
(Updated on February 27, 2014)
South Carolina: Hillary vs Marco Rubio: R+7%
+3.5% D improvement
(Updated on November 2)
Texas: Hillary vs Huckabee: R +8%
+8% D improvement
(Updated on April 18, 2014)
Virginia: Hillary vs Christie: D +3.22%
+0.6% R improvement
(Updated on March 27, 2014)
West Virginia: Hillary vs Bush: R +14%
+13% D improvement
(Updated on October 1)
Wisconsin: Hillary vs Ryan: D +5.1%
+1.8% R improvement
(Updated on April 25, 2014)
Wyoming: Hillary vs Christie: R +28%
+13% D improvement
(Updated on July 23)
Average all 28 states: Hillary vs Best Republican: R +0.5%
+3.4% D improvement (from Obama 2012) [projecting a 7.3% victory for Hillary]
That gives us this map right now:
(
Red = Democratic lead
Blue = Republican lead
Green = Exact tie
Grey = No polling yet
Green = toss up
20% shade = 0.1-1% lead
30% shade = 1.1-3% lead
40% shade = 3.1-6% lead
50% shade = 6.1-9% lead
60% shade = 9.1-12% lead
70% shade = 12.1-15% lead
80% shade = 15.1-18% lead
90% shade = Above 18.1% lead
In the count of electoral votes, this means the current situation looks like this:
Hillary: 209 EVs (for a total of 14 states)
Best/Tailormade Republican: 120 EVs (for a total of 14 states)
Toss-up: None
No polling: 209 EVs [almost half, including California] (for a total of 22 states + D.C.)
Which means that Hillary has captured a rather impressive 63.5% of all EVs awarded thus far, against a disappointing 36.5% EVs for the tailormade Republican.
This is how the Trendline Map looks so far:
(
The states which right now are showing the strongest improvement for the Democratic (Hillary) or the Republican candidate (in 13 out of 28 cases, Christie is that person):
1. Kentucky: D +19%
2. Arkansas: D +17%
3. Kansas: D +13%
4. West Virginia: D +13%
5. Wyoming: D +13%
6. Louisiana: D +12%
7. Colorado: R +8.9%
8. Arizona: D +8%
8. Texas: D +8%
10. New Jersey: R +7.3%
11. Maine: R +7%
12. Alaska: D +7%
13. Florida: D +6.5%
14. Georgia: D +6%
15. Michigan: R +4.7%
All of these changes (in the 15 states above) are (more than) statistically significant. It's almost shocking to see how much a switch from Obama to Hillary would mean for the states of Arkansas and Colorado. As of now, Hillary has had more than a 30% better swing in Arkansas than in Colorado, meaning that if current poll averages where to become the actual 2016 outcome, Hillary could actually perform up to 5.5% stronger in Arkansas than Colorado. However, they're not completely compatible as Paul Ryan currently polls best in Colorado, while Christie is ahead in Arkansas.
The whole list of states having been polled till now, going from Democratic stronghold to Republican stronghold:
New York: D +28%
New Mexico: D +14%
New Jersey: D +10.5%
Maine: D +8%
Florida: D +7.4%
Currently estimated/projected national average: D +7.3%
Minnesota: D +6%
Ohio: D +5.75%
Wisconsin: D +5.1%
Michigan: D +4.8%
Virginia: D +3.2%
New Hampshire: D +2.1%
Iowa: D +1.85%
Pennsylvania: D +1.75%
North Carolina: D +0.9%
Arizona: R +1%
Georgia: R +2%
Arkansas: R +3%
Colorado: R +3.5%
Kentucky: R +4%
Louisiana: R +5%
Alaska: R +7%
South Carolina: R +7%
Texas: R +8%
Mississippi: R +9%
Kansas: R +9%
Montana: R +13%
West Virginia: R +14%
Wyoming: R +28%
Here are the current stats on Republican candidates:
1. Chris Christie favoured in 13 of 28 states (for 169 EVs)
2. Jeb Bush favoured in 6 states (Florida, Arizona, Kentucky (!!), Kansas, West Virginia & Alaska - for 62 EVs)
3. Mike Huckabee in 5 states (Texas (!), Louisiana (!), Arkansas, Iowa (!) & New Hampshire (!) - for 62 EVs)
4. Paul Ryan favoured in 2 states (Wisconsin & Colorado - for 19 EVs)
5. Marco Rubio favoured in 1 state (South Carolina - for 9 EVs)
6. Susana Martinez favoured in 1 state (New Mexico - for 5 EVs)
7. Rand Paul favoured in 1 state (Montana - for 3 EVs)
All in all; North Carolina, Florida, Ohio and New Mexico being amazing news for Hillary (a red state going blue or blue states going even bluer), while Colorado is equally bad news for her (a blue state going red). Interestingly though, four out of those five states are swing/battleground/purple states. Meaning that we're not seeing a further polarization of the electorate in most states - at least not this far.
Current update as of May 14.
Title: Re: 2016 Official Polling Map Thread
Post by: eric82oslo on May 15, 2014, 08:14:17 AM
Today we've gotten the 5th 2016 poll of Ohio, including the 4th from Quinnipiac alone. According to the poll, Hillary is leading all 8 GOP opponents there with margins ranging between 5% and 14%. Christie is still the leader of the GOP pack, but with his deteriorating numbers, he slumps further down the road, now trailing Hillary by 6.2%, compared to his previous -5.75%. Second best Republican is Huckabee (polled in Ohio for the 1st time) who's trailing by 8%. Rand Paul, Ryan & Rubio all trail by 10% and their favourite son John Kasich by 11.5%, while Bush & Cruz do particularily badly, trailing by 12.75% & 15.3% respectively.
On May 18, I've added the latest Kentucky poll from Survey USA as well. It didn't change much, as Rand Paul was the only one matched, and he's still just 1.25% ahead of Hillary. Which means that Jeb Bush is still the leader of the GOP pack in the state, leading Hillary with 4%. Christie is also leading her by 4%, however his floor is lower than Jeb Bush's (44% against 46%). Which means that the favourite son Paul is just the 3rd most popular GOPer in the state of the 4 tried & tested (Marco Rubio does the worst).
The total number of state polls included in the lists below has thus now reached 120.
So here they are - all the 2016 poll averages for each state so far - 28 states having been polled to date - and how far off they are compared to the actual 2012 outcomes. I'm only including the Republican candidate with the best statewide polling.
Alaska: Hillary vs Jeb Bush: R +7%
+7% D improvement
(Updated on May 14, 2014)
Arizona: Hillary vs Bush: R +1%
+8% D improvement
(Updated on March 6, 2014)
Arkansas: Hillary vs Mike Huckabee: R +3%
+17% D improvement
(Updated on May 5, 2014)
Colorado: Hillary vs Paul Ryan: R +3.5%
+8.9% R improvement
Current Republican gain
(Updated on April 25, 2014)
Florida: Hillary vs Bush: D +7.4%
+6.5% D improvement
(Updated on May 5, 2014)
Georgia: Hillary vs Christie: R +2%
+6% D improvement
(Updated August 8 )
Iowa: Hillary vs Mike Huckabee: D +1.85%
+4% R improvement
(Updated on April 18, 2014)
Kansas: Hillary vs Bush: R +9%
+13% D improvement
(Updated on February 24, 2014)
Kentucky: Hillary vs Christie/Bush: R +4%
+19% D improvement
(Updated on May 18, 2014)
Louisiana: Hillary vs Huckabee: R +5%
+12% D improvement
(Updated on February 18, 2014)
Maine: Hillary vs Christie: D +8%
+7% R improvement
(Updated on November 13)
Michigan: Hillary vs Christie: D +4.8%
+4.7% R improvement
(Updated on April 9, 2014)
Minnesota: Hillary vs Christie: D +6%
+2% R improvement
(Updated on January 22, 2013)
Mississippi: Hillary vs Christie: R +9%
+2.5% D improvement
(Updated on November 19)
Montana: Hillary vs Rand Paul: R +13%
+1% D improvement
(Updated on November 24)
New Hampshire: Hillary vs Huckabee: D +2.1%
+3.5% R improvement
(Updated on May 12, 2014)
New Jersey: Hillary vs Christie: D +10.5%
+7.3% R improvement
(Updated on March 4, 2014)
New Mexico: Hillary vs Susana Martinez: D +14%
+4% D improvement
(Updated on March 27, 2014)
New York: Hillary vs Christie: D +28%
+0.2% R improvement
(Updated on March 4, 2014)
North Carolina: Hillary vs Christie: D +0.9%
+2.9% D improvement
Current Democratic gain
(Updated on May 14, 2014)
Ohio: Hillary vs Christie: D +6.2%
+3.2% D improvement
(Updated on May 15, 2014)
Pennsylvania: Hillary vs Christie: D +1.75%
+3.6% R improvement
(Updated on February 27, 2014)
South Carolina: Hillary vs Marco Rubio: R+7%
+3.5% D improvement
(Updated on November 2)
Texas: Hillary vs Huckabee: R +8%
+8% D improvement
(Updated on April 18, 2014)
Virginia: Hillary vs Christie: D +3.22%
+0.6% R improvement
(Updated on March 27, 2014)
West Virginia: Hillary vs Bush: R +14%
+13% D improvement
(Updated on October 1)
Wisconsin: Hillary vs Ryan: D +5.1%
+1.8% R improvement
(Updated on April 25, 2014)
Wyoming: Hillary vs Christie: R +28%
+13% D improvement
(Updated on July 23)
Average all 28 states: Hillary vs Best Republican: R +0.5%
+3.4% D improvement (from Obama 2012) [projecting a 7.3% victory for Hillary]
That gives us this map right now:
(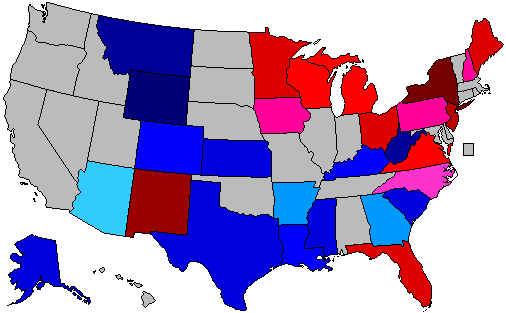 )
)
Red = Democratic lead
Blue = Republican lead
Green = Exact tie
Grey = No polling yet
Green = toss up
20% shade = 0.1-1% lead
30% shade = 1.1-3% lead
40% shade = 3.1-6% lead
50% shade = 6.1-9% lead
60% shade = 9.1-12% lead
70% shade = 12.1-15% lead
80% shade = 15.1-18% lead
90% shade = Above 18.1% lead
In the count of electoral votes, this means the current situation looks like this:
Hillary: 209 EVs (for a total of 14 states)
Best/Tailormade Republican: 120 EVs (for a total of 14 states)
Toss-up: None
No polling: 209 EVs [almost half, including California] (for a total of 22 states + D.C.)
Which means that Hillary has captured a rather impressive 63.5% of all EVs awarded thus far, against a disappointing 36.5% EVs for the tailormade Republican.
This is how the Trendline Map looks so far:
(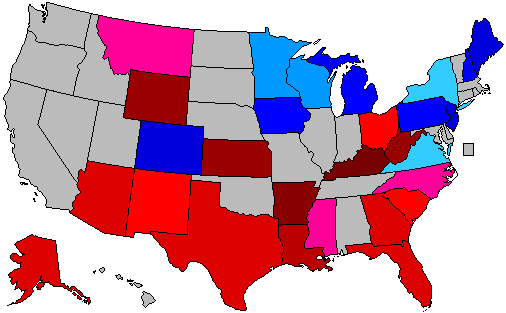 )
)
The states which right now are showing the strongest improvement for the Democratic (Hillary) or the Republican candidate (in 13 out of 28 cases, Christie is that person):
1. Kentucky: D +19%
2. Arkansas: D +17%
3. Kansas: D +13%
4. West Virginia: D +13%
5. Wyoming: D +13%
6. Louisiana: D +12%
7. Colorado: R +8.9%
8. Arizona: D +8%
8. Texas: D +8%
10. New Jersey: R +7.3%
11. Maine: R +7%
12. Alaska: D +7%
13. Florida: D +6.5%
14. Georgia: D +6%
15. Michigan: R +4.7%
All of these changes (in the 15 states above) are (more than) statistically significant.
The whole list of states having been polled till now, going from Democratic stronghold to Republican stronghold:
New York: D +28%
New Mexico: D +14%
New Jersey: D +10.5%
Maine: D +8%
Florida: D +7.4%
Currently estimated/projected national average: D +7.3%
Ohio: D +6.2%
Minnesota: D +6%
Wisconsin: D +5.1%
Michigan: D +4.8%
Virginia: D +3.2%
New Hampshire: D +2.1%
Iowa: D +1.85%
Pennsylvania: D +1.75%
North Carolina: D +0.9%
Arizona: R +1%
Georgia: R +2%
Arkansas: R +3%
Colorado: R +3.5%
Kentucky: R +4%
Louisiana: R +5%
Alaska: R +7%
South Carolina: R +7%
Texas: R +8%
Mississippi: R +9%
Kansas: R +9%
Montana: R +13%
West Virginia: R +14%
Wyoming: R +28%
Here are the current stats on Republican candidates:
1. Chris Christie favoured in 13 of 28 states (for 169 EVs)
2. Jeb Bush favoured in 6 states (Florida, Arizona, Kentucky (!!), Kansas, West Virginia & Alaska - for 62 EVs)
3. Mike Huckabee in 5 states (Texas (!), Louisiana (!), Arkansas, Iowa (!) & New Hampshire (!) - for 62 EVs)
4. Paul Ryan favoured in 2 states (Wisconsin & Colorado - for 19 EVs)
5. Marco Rubio favoured in 1 state (South Carolina - for 9 EVs)
6. Susana Martinez favoured in 1 state (New Mexico - for 5 EVs)
7. Rand Paul favoured in 1 state (Montana - for 3 EVs)
All in all; North Carolina, Florida, Ohio and New Mexico being amazing news for Hillary (a red state going blue or blue states going even bluer), while Colorado is equally bad news for her (a blue state going red). Interestingly though, four out of those five states are swing/battleground/purple states. Meaning that we're not seeing a further polarization of the electorate in most states - at least not this far.
Current update as of May 18.
On May 18, I've added the latest Kentucky poll from Survey USA as well. It didn't change much, as Rand Paul was the only one matched, and he's still just 1.25% ahead of Hillary. Which means that Jeb Bush is still the leader of the GOP pack in the state, leading Hillary with 4%. Christie is also leading her by 4%, however his floor is lower than Jeb Bush's (44% against 46%). Which means that the favourite son Paul is just the 3rd most popular GOPer in the state of the 4 tried & tested (Marco Rubio does the worst).
The total number of state polls included in the lists below has thus now reached 120.
So here they are - all the 2016 poll averages for each state so far - 28 states having been polled to date - and how far off they are compared to the actual 2012 outcomes. I'm only including the Republican candidate with the best statewide polling.
Alaska: Hillary vs Jeb Bush: R +7%
+7% D improvement
(Updated on May 14, 2014)
Arizona: Hillary vs Bush: R +1%
+8% D improvement
(Updated on March 6, 2014)
Arkansas: Hillary vs Mike Huckabee: R +3%
+17% D improvement
(Updated on May 5, 2014)
Colorado: Hillary vs Paul Ryan: R +3.5%
+8.9% R improvement
Current Republican gain
(Updated on April 25, 2014)
Florida: Hillary vs Bush: D +7.4%
+6.5% D improvement
(Updated on May 5, 2014)
Georgia: Hillary vs Christie: R +2%
+6% D improvement
(Updated August 8 )
Iowa: Hillary vs Mike Huckabee: D +1.85%
+4% R improvement
(Updated on April 18, 2014)
Kansas: Hillary vs Bush: R +9%
+13% D improvement
(Updated on February 24, 2014)
Kentucky: Hillary vs Christie/Bush: R +4%
+19% D improvement
(Updated on May 18, 2014)
Louisiana: Hillary vs Huckabee: R +5%
+12% D improvement
(Updated on February 18, 2014)
Maine: Hillary vs Christie: D +8%
+7% R improvement
(Updated on November 13)
Michigan: Hillary vs Christie: D +4.8%
+4.7% R improvement
(Updated on April 9, 2014)
Minnesota: Hillary vs Christie: D +6%
+2% R improvement
(Updated on January 22, 2013)
Mississippi: Hillary vs Christie: R +9%
+2.5% D improvement
(Updated on November 19)
Montana: Hillary vs Rand Paul: R +13%
+1% D improvement
(Updated on November 24)
New Hampshire: Hillary vs Huckabee: D +2.1%
+3.5% R improvement
(Updated on May 12, 2014)
New Jersey: Hillary vs Christie: D +10.5%
+7.3% R improvement
(Updated on March 4, 2014)
New Mexico: Hillary vs Susana Martinez: D +14%
+4% D improvement
(Updated on March 27, 2014)
New York: Hillary vs Christie: D +28%
+0.2% R improvement
(Updated on March 4, 2014)
North Carolina: Hillary vs Christie: D +0.9%
+2.9% D improvement
Current Democratic gain
(Updated on May 14, 2014)
Ohio: Hillary vs Christie: D +6.2%
+3.2% D improvement
(Updated on May 15, 2014)
Pennsylvania: Hillary vs Christie: D +1.75%
+3.6% R improvement
(Updated on February 27, 2014)
South Carolina: Hillary vs Marco Rubio: R+7%
+3.5% D improvement
(Updated on November 2)
Texas: Hillary vs Huckabee: R +8%
+8% D improvement
(Updated on April 18, 2014)
Virginia: Hillary vs Christie: D +3.22%
+0.6% R improvement
(Updated on March 27, 2014)
West Virginia: Hillary vs Bush: R +14%
+13% D improvement
(Updated on October 1)
Wisconsin: Hillary vs Ryan: D +5.1%
+1.8% R improvement
(Updated on April 25, 2014)
Wyoming: Hillary vs Christie: R +28%
+13% D improvement
(Updated on July 23)
Average all 28 states: Hillary vs Best Republican: R +0.5%
+3.4% D improvement (from Obama 2012) [projecting a 7.3% victory for Hillary]
That gives us this map right now:
(
Red = Democratic lead
Blue = Republican lead
Green = Exact tie
Grey = No polling yet
Green = toss up
20% shade = 0.1-1% lead
30% shade = 1.1-3% lead
40% shade = 3.1-6% lead
50% shade = 6.1-9% lead
60% shade = 9.1-12% lead
70% shade = 12.1-15% lead
80% shade = 15.1-18% lead
90% shade = Above 18.1% lead
In the count of electoral votes, this means the current situation looks like this:
Hillary: 209 EVs (for a total of 14 states)
Best/Tailormade Republican: 120 EVs (for a total of 14 states)
Toss-up: None
No polling: 209 EVs [almost half, including California] (for a total of 22 states + D.C.)
Which means that Hillary has captured a rather impressive 63.5% of all EVs awarded thus far, against a disappointing 36.5% EVs for the tailormade Republican.
This is how the Trendline Map looks so far:
(
The states which right now are showing the strongest improvement for the Democratic (Hillary) or the Republican candidate (in 13 out of 28 cases, Christie is that person):
1. Kentucky: D +19%
2. Arkansas: D +17%
3. Kansas: D +13%
4. West Virginia: D +13%
5. Wyoming: D +13%
6. Louisiana: D +12%
7. Colorado: R +8.9%
8. Arizona: D +8%
8. Texas: D +8%
10. New Jersey: R +7.3%
11. Maine: R +7%
12. Alaska: D +7%
13. Florida: D +6.5%
14. Georgia: D +6%
15. Michigan: R +4.7%
All of these changes (in the 15 states above) are (more than) statistically significant.
The whole list of states having been polled till now, going from Democratic stronghold to Republican stronghold:
New York: D +28%
New Mexico: D +14%
New Jersey: D +10.5%
Maine: D +8%
Florida: D +7.4%
Currently estimated/projected national average: D +7.3%
Ohio: D +6.2%
Minnesota: D +6%
Wisconsin: D +5.1%
Michigan: D +4.8%
Virginia: D +3.2%
New Hampshire: D +2.1%
Iowa: D +1.85%
Pennsylvania: D +1.75%
North Carolina: D +0.9%
Arizona: R +1%
Georgia: R +2%
Arkansas: R +3%
Colorado: R +3.5%
Kentucky: R +4%
Louisiana: R +5%
Alaska: R +7%
South Carolina: R +7%
Texas: R +8%
Mississippi: R +9%
Kansas: R +9%
Montana: R +13%
West Virginia: R +14%
Wyoming: R +28%
Here are the current stats on Republican candidates:
1. Chris Christie favoured in 13 of 28 states (for 169 EVs)
2. Jeb Bush favoured in 6 states (Florida, Arizona, Kentucky (!!), Kansas, West Virginia & Alaska - for 62 EVs)
3. Mike Huckabee in 5 states (Texas (!), Louisiana (!), Arkansas, Iowa (!) & New Hampshire (!) - for 62 EVs)
4. Paul Ryan favoured in 2 states (Wisconsin & Colorado - for 19 EVs)
5. Marco Rubio favoured in 1 state (South Carolina - for 9 EVs)
6. Susana Martinez favoured in 1 state (New Mexico - for 5 EVs)
7. Rand Paul favoured in 1 state (Montana - for 3 EVs)
All in all; North Carolina, Florida, Ohio and New Mexico being amazing news for Hillary (a red state going blue or blue states going even bluer), while Colorado is equally bad news for her (a blue state going red). Interestingly though, four out of those five states are swing/battleground/purple states. Meaning that we're not seeing a further polarization of the electorate in most states - at least not this far.
Current update as of May 18.
Title: Re: 2016 Official Polling Map Thread
Post by: pbrower2a on May 15, 2014, 03:13:49 PM
Lots of matchups in a swing state. Republicans have their work cut out for them if they are to deliver the key 18 electoral votes of Ohio.
47 - 42 percent over Ohio Gov. John Kasich (+5)
48 - 41 percent over U.S. Rep. Paul Ryan of Wisconsin (+7)
47 - 40 percent over U.S. Sen. Marco Rubio of Florida (+7)
49 - 41 percent over U.S. Sen. Rand Paul of Kentucky (+8)
46 - 38 percent over N.J. Gov. Christopher Christie (+8)
49 - 41 percent over former Arkansas Gov. Mike Huckabee (+8)
48 - 39 percent over former Florida Gov. Jeb Bush (+9)
51 - 37 percent over U.S. Sen. Ted Cruz of Texas (+14)
From May 7 - 12, Quinnipiac University surveyed 1,174 registered voters with a margin of error of +/- 2.9 percentage points. Live interviewers call land lines and cell phones.
http://www.quinnipiac.edu/news-and-events/quinnipiac-university-poll/ohio/release-detail?ReleaseID=2042
Hillary Clinton vs. Jeb Bush
(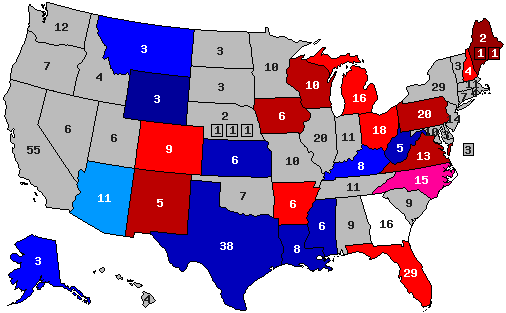 )
)
Hillary Clinton vs. Chris Christie
()
Hillary Clinton vs. Mike Huckabee
(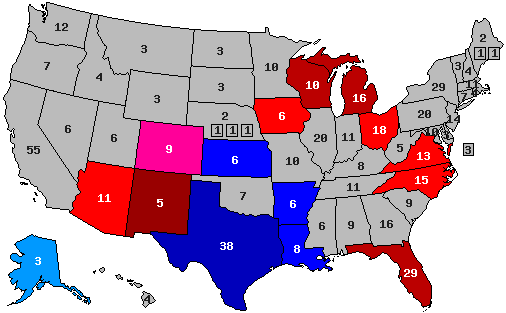 )
)
Hillary Clinton vs. Rand Paul
(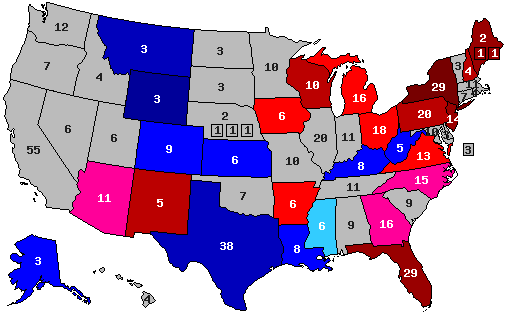 )
)
blue, Republican -- red, Democratic
30% -- lead with 40-49% but a margin of 3% or less
40% -- lead with 40-49% but a margin of 4% or more
60% -- lead with 50-54%
70% -- lead with 55-59%
90% -- lead with 60% or more
47 - 42 percent over Ohio Gov. John Kasich (+5)
48 - 41 percent over U.S. Rep. Paul Ryan of Wisconsin (+7)
47 - 40 percent over U.S. Sen. Marco Rubio of Florida (+7)
49 - 41 percent over U.S. Sen. Rand Paul of Kentucky (+8)
46 - 38 percent over N.J. Gov. Christopher Christie (+8)
49 - 41 percent over former Arkansas Gov. Mike Huckabee (+8)
48 - 39 percent over former Florida Gov. Jeb Bush (+9)
51 - 37 percent over U.S. Sen. Ted Cruz of Texas (+14)
From May 7 - 12, Quinnipiac University surveyed 1,174 registered voters with a margin of error of +/- 2.9 percentage points. Live interviewers call land lines and cell phones.
http://www.quinnipiac.edu/news-and-events/quinnipiac-university-poll/ohio/release-detail?ReleaseID=2042
Hillary Clinton vs. Jeb Bush
(
Hillary Clinton vs. Chris Christie
(
Hillary Clinton vs. Mike Huckabee
(
Hillary Clinton vs. Rand Paul
(
blue, Republican -- red, Democratic
30% -- lead with 40-49% but a margin of 3% or less
40% -- lead with 40-49% but a margin of 4% or more
60% -- lead with 50-54%
70% -- lead with 55-59%
90% -- lead with 60% or more
Title: Re: 2016 Official Polling Map Thread
Post by: pbrower2a on May 17, 2014, 08:20:55 PM
SurveyUSA, for several KY media:
Paul 48, Clinton 44
http://media.graytvinc.com/documents/Day2_MAYPOLL_.pdf
Really, awful for Rand Paul when one considers that he would be a Favorite Son in Kentucky. No other matchups shown.
Hillary Clinton vs. Chris Christie
()
Hillary Clinton vs. Mike Huckabee
()
Hillary Clinton vs. Rand Paul
()
blue, Republican -- red, Democratic
30% -- lead with 40-49% but a margin of 3% or less
40% -- lead with 40-49% but a margin of 4% or more
60% -- lead with 50-54%
70% -- lead with 55-59%
90% -- lead with 60% or more
Paul 48, Clinton 44
http://media.graytvinc.com/documents/Day2_MAYPOLL_.pdf
Really, awful for Rand Paul when one considers that he would be a Favorite Son in Kentucky. No other matchups shown.
Hillary Clinton vs. Chris Christie
(
Hillary Clinton vs. Mike Huckabee
(
Hillary Clinton vs. Rand Paul
(
blue, Republican -- red, Democratic
30% -- lead with 40-49% but a margin of 3% or less
40% -- lead with 40-49% but a margin of 4% or more
60% -- lead with 50-54%
70% -- lead with 55-59%
90% -- lead with 60% or more
Title: Re: 2016 Official Polling Map Thread
Post by: eric82oslo on May 21, 2014, 04:08:26 PM
PPP will poll Oregon next. Soon we'll have our 29th state of the season. :)
Title: Re: 2016 Official Polling Map Thread
Post by: eric82oslo on May 22, 2014, 04:02:11 PM
PPP has published a new Iowa poll today. This is PPP's 4th 2016 poll of the state and the 10th regardless of pollster. It's good news for Hillary, as she leads all opponents with between 4% and 7%. Though one can ask if it's really that great to lead Ted Cruz by only 7%. The fact remains though that Hillary is still spectacularily more popular in Florida and Ohio than she is in the first caucus state of the nation.
With this poll, Hillary increases her lead over prime challenger Huckabee (who is also the runaway favourite in Iowa's GOP primary) from +1.85% to her current +2.6% lead. The 2nd strongest GOPer in Iowa is Christie, trailing her by an average of 3.3%. 3rd is Jindal at -4.7%, while Rand Paul trails by 5%. Shared 5th are Walker and Paul Ryan, both trailing by 6.3%. Bush is -7.1% behind, Rubio -7.3%, Cruz -9.2% and finally Mike Pence is last with -11.8%.
The total number of state polls included in the lists below has thus now reached 121.
So here they are - all the 2016 poll averages for each state so far - 28 states having been polled to date - and how far off they are compared to the actual 2012 outcomes. I'm only including the Republican candidate with the best statewide polling.
Alaska: Hillary vs Jeb Bush: R +7%
+7% D improvement
(Updated on May 14, 2014)
Arizona: Hillary vs Bush: R +1%
+8% D improvement
(Updated on March 6, 2014)
Arkansas: Hillary vs Mike Huckabee: R +3%
+17% D improvement
(Updated on May 5, 2014)
Colorado: Hillary vs Paul Ryan: R +3.5%
+8.9% R improvement
Current Republican gain
(Updated on April 25, 2014)
Florida: Hillary vs Bush: D +7.4%
+6.5% D improvement
(Updated on May 5, 2014)
Georgia: Hillary vs Christie: R +2%
+6% D improvement
(Updated August 8 )
Iowa: Hillary vs Mike Huckabee: D +2.6%
+3.2% R improvement
(Updated on May 22, 2014)
Kansas: Hillary vs Bush: R +9%
+13% D improvement
(Updated on February 24, 2014)
Kentucky: Hillary vs Christie/Bush: R +4%
+19% D improvement
(Updated on May 18, 2014)
Louisiana: Hillary vs Huckabee: R +5%
+12% D improvement
(Updated on February 18, 2014)
Maine: Hillary vs Christie: D +8%
+7% R improvement
(Updated on November 13)
Michigan: Hillary vs Christie: D +4.8%
+4.7% R improvement
(Updated on April 9, 2014)
Minnesota: Hillary vs Christie: D +6%
+2% R improvement
(Updated on January 22, 2013)
Mississippi: Hillary vs Christie: R +9%
+2.5% D improvement
(Updated on November 19)
Montana: Hillary vs Rand Paul: R +13%
+1% D improvement
(Updated on November 24)
New Hampshire: Hillary vs Huckabee: D +2.1%
+3.5% R improvement
(Updated on May 12, 2014)
New Jersey: Hillary vs Christie: D +10.5%
+7.3% R improvement
(Updated on March 4, 2014)
New Mexico: Hillary vs Susana Martinez: D +14%
+4% D improvement
(Updated on March 27, 2014)
New York: Hillary vs Christie: D +28%
+0.2% R improvement
(Updated on March 4, 2014)
North Carolina: Hillary vs Christie: D +0.9%
+2.9% D improvement
Current Democratic gain
(Updated on May 14, 2014)
Ohio: Hillary vs Christie: D +6.2%
+3.2% D improvement
(Updated on May 15, 2014)
Pennsylvania: Hillary vs Christie: D +1.75%
+3.6% R improvement
(Updated on February 27, 2014)
South Carolina: Hillary vs Marco Rubio: R+7%
+3.5% D improvement
(Updated on November 2)
Texas: Hillary vs Huckabee: R +8%
+8% D improvement
(Updated on April 18, 2014)
Virginia: Hillary vs Christie: D +3.22%
+0.6% R improvement
(Updated on March 27, 2014)
West Virginia: Hillary vs Bush: R +14%
+13% D improvement
(Updated on October 1)
Wisconsin: Hillary vs Ryan: D +5.1%
+1.8% R improvement
(Updated on April 25, 2014)
Wyoming: Hillary vs Christie: R +28%
+13% D improvement
(Updated on July 23)
Average all 28 states: Hillary vs Best Republican: R +0.5%
+3.5% D improvement (from Obama 2012) [projecting a 7.3% victory for Hillary]
That gives us this map right now:
()
Red = Democratic lead
Blue = Republican lead
Green = Exact tie
Grey = No polling yet
Green = toss up
20% shade = 0.1-1% lead
30% shade = 1.1-3% lead
40% shade = 3.1-6% lead
50% shade = 6.1-9% lead
60% shade = 9.1-12% lead
70% shade = 12.1-15% lead
80% shade = 15.1-18% lead
90% shade = Above 18.1% lead
In the count of electoral votes, this means the current situation looks like this:
Hillary: 209 EVs (for a total of 14 states)
Best/Tailormade Republican: 120 EVs (for a total of 14 states)
Toss-up: None
No polling: 209 EVs [almost half, including California] (for a total of 22 states + D.C.)
Which means that Hillary has captured a rather impressive 63.5% of all EVs awarded thus far, against a disappointing 36.5% EVs for the tailormade Republican.
This is how the Trendline Map looks so far:
()
The states which right now are showing the strongest improvement for the Democratic (Hillary) or the Republican candidate (in 13 out of 28 cases, Christie is that person):
1. Kentucky: D +19%
2. Arkansas: D +17%
3. Kansas: D +13%
4. West Virginia: D +13%
5. Wyoming: D +13%
6. Louisiana: D +12%
7. Colorado: R +8.9%
8. Arizona: D +8%
8. Texas: D +8%
10. New Jersey: R +7.3%
11. Maine: R +7%
12. Alaska: D +7%
13. Florida: D +6.5%
14. Georgia: D +6%
15. Michigan: R +4.7%
All of these changes (in the 15 states above) are (more than) statistically significant.
The whole list of states having been polled till now, going from Democratic stronghold to Republican stronghold:
New York: D +28%
New Mexico: D +14%
New Jersey: D +10.5%
Maine: D +8%
Florida: D +7.4%
Currently estimated/projected national average: D +7.3%
Ohio: D +6.2%
Minnesota: D +6%
Wisconsin: D +5.1%
Michigan: D +4.8%
Virginia: D +3.2%
Iowa: D +2.6%
New Hampshire: D +2.1%
Pennsylvania: D +1.75%
North Carolina: D +0.9%
Arizona: R +1%
Georgia: R +2%
Arkansas: R +3%
Colorado: R +3.5%
Kentucky: R +4%
Louisiana: R +5%
Alaska: R +7%
South Carolina: R +7%
Texas: R +8%
Mississippi: R +9%
Kansas: R +9%
Montana: R +13%
West Virginia: R +14%
Wyoming: R +28%
Here are the current stats on Republican candidates:
1. Chris Christie favoured in 13 of 28 states (for 169 EVs)
2. Jeb Bush favoured in 6 states (Florida, Arizona, Kentucky (!!), Kansas, West Virginia & Alaska - for 62 EVs)
2. Mike Huckabee in 5 states (Texas (!), Louisiana (!), Arkansas, Iowa (!) & New Hampshire (!) - for 62 EVs)
4. Paul Ryan favoured in 2 states (Wisconsin & Colorado - for 19 EVs)
5. Marco Rubio favoured in 1 state (South Carolina - for 9 EVs)
6. Susana Martinez favoured in 1 state (New Mexico - for 5 EVs)
7. Rand Paul favoured in 1 state (Montana - for 3 EVs)
All in all; North Carolina, Florida, Ohio and New Mexico being amazing news for Hillary (a red state going blue or blue states going even bluer), while Colorado is equally bad news for her (a blue state going red). Interestingly though, four out of those five states are swing/battleground/purple states. Meaning that we're not seeing a further polarization of the electorate in most states - at least not this far.
Current update as of May 22.
With this poll, Hillary increases her lead over prime challenger Huckabee (who is also the runaway favourite in Iowa's GOP primary) from +1.85% to her current +2.6% lead. The 2nd strongest GOPer in Iowa is Christie, trailing her by an average of 3.3%. 3rd is Jindal at -4.7%, while Rand Paul trails by 5%. Shared 5th are Walker and Paul Ryan, both trailing by 6.3%. Bush is -7.1% behind, Rubio -7.3%, Cruz -9.2% and finally Mike Pence is last with -11.8%.
The total number of state polls included in the lists below has thus now reached 121.
So here they are - all the 2016 poll averages for each state so far - 28 states having been polled to date - and how far off they are compared to the actual 2012 outcomes. I'm only including the Republican candidate with the best statewide polling.
Alaska: Hillary vs Jeb Bush: R +7%
+7% D improvement
(Updated on May 14, 2014)
Arizona: Hillary vs Bush: R +1%
+8% D improvement
(Updated on March 6, 2014)
Arkansas: Hillary vs Mike Huckabee: R +3%
+17% D improvement
(Updated on May 5, 2014)
Colorado: Hillary vs Paul Ryan: R +3.5%
+8.9% R improvement
Current Republican gain
(Updated on April 25, 2014)
Florida: Hillary vs Bush: D +7.4%
+6.5% D improvement
(Updated on May 5, 2014)
Georgia: Hillary vs Christie: R +2%
+6% D improvement
(Updated August 8 )
Iowa: Hillary vs Mike Huckabee: D +2.6%
+3.2% R improvement
(Updated on May 22, 2014)
Kansas: Hillary vs Bush: R +9%
+13% D improvement
(Updated on February 24, 2014)
Kentucky: Hillary vs Christie/Bush: R +4%
+19% D improvement
(Updated on May 18, 2014)
Louisiana: Hillary vs Huckabee: R +5%
+12% D improvement
(Updated on February 18, 2014)
Maine: Hillary vs Christie: D +8%
+7% R improvement
(Updated on November 13)
Michigan: Hillary vs Christie: D +4.8%
+4.7% R improvement
(Updated on April 9, 2014)
Minnesota: Hillary vs Christie: D +6%
+2% R improvement
(Updated on January 22, 2013)
Mississippi: Hillary vs Christie: R +9%
+2.5% D improvement
(Updated on November 19)
Montana: Hillary vs Rand Paul: R +13%
+1% D improvement
(Updated on November 24)
New Hampshire: Hillary vs Huckabee: D +2.1%
+3.5% R improvement
(Updated on May 12, 2014)
New Jersey: Hillary vs Christie: D +10.5%
+7.3% R improvement
(Updated on March 4, 2014)
New Mexico: Hillary vs Susana Martinez: D +14%
+4% D improvement
(Updated on March 27, 2014)
New York: Hillary vs Christie: D +28%
+0.2% R improvement
(Updated on March 4, 2014)
North Carolina: Hillary vs Christie: D +0.9%
+2.9% D improvement
Current Democratic gain
(Updated on May 14, 2014)
Ohio: Hillary vs Christie: D +6.2%
+3.2% D improvement
(Updated on May 15, 2014)
Pennsylvania: Hillary vs Christie: D +1.75%
+3.6% R improvement
(Updated on February 27, 2014)
South Carolina: Hillary vs Marco Rubio: R+7%
+3.5% D improvement
(Updated on November 2)
Texas: Hillary vs Huckabee: R +8%
+8% D improvement
(Updated on April 18, 2014)
Virginia: Hillary vs Christie: D +3.22%
+0.6% R improvement
(Updated on March 27, 2014)
West Virginia: Hillary vs Bush: R +14%
+13% D improvement
(Updated on October 1)
Wisconsin: Hillary vs Ryan: D +5.1%
+1.8% R improvement
(Updated on April 25, 2014)
Wyoming: Hillary vs Christie: R +28%
+13% D improvement
(Updated on July 23)
Average all 28 states: Hillary vs Best Republican: R +0.5%
+3.5% D improvement (from Obama 2012) [projecting a 7.3% victory for Hillary]
That gives us this map right now:
(
Red = Democratic lead
Blue = Republican lead
Green = Exact tie
Grey = No polling yet
Green = toss up
20% shade = 0.1-1% lead
30% shade = 1.1-3% lead
40% shade = 3.1-6% lead
50% shade = 6.1-9% lead
60% shade = 9.1-12% lead
70% shade = 12.1-15% lead
80% shade = 15.1-18% lead
90% shade = Above 18.1% lead
In the count of electoral votes, this means the current situation looks like this:
Hillary: 209 EVs (for a total of 14 states)
Best/Tailormade Republican: 120 EVs (for a total of 14 states)
Toss-up: None
No polling: 209 EVs [almost half, including California] (for a total of 22 states + D.C.)
Which means that Hillary has captured a rather impressive 63.5% of all EVs awarded thus far, against a disappointing 36.5% EVs for the tailormade Republican.
This is how the Trendline Map looks so far:
(
The states which right now are showing the strongest improvement for the Democratic (Hillary) or the Republican candidate (in 13 out of 28 cases, Christie is that person):
1. Kentucky: D +19%
2. Arkansas: D +17%
3. Kansas: D +13%
4. West Virginia: D +13%
5. Wyoming: D +13%
6. Louisiana: D +12%
7. Colorado: R +8.9%
8. Arizona: D +8%
8. Texas: D +8%
10. New Jersey: R +7.3%
11. Maine: R +7%
12. Alaska: D +7%
13. Florida: D +6.5%
14. Georgia: D +6%
15. Michigan: R +4.7%
All of these changes (in the 15 states above) are (more than) statistically significant.
The whole list of states having been polled till now, going from Democratic stronghold to Republican stronghold:
New York: D +28%
New Mexico: D +14%
New Jersey: D +10.5%
Maine: D +8%
Florida: D +7.4%
Currently estimated/projected national average: D +7.3%
Ohio: D +6.2%
Minnesota: D +6%
Wisconsin: D +5.1%
Michigan: D +4.8%
Virginia: D +3.2%
Iowa: D +2.6%
New Hampshire: D +2.1%
Pennsylvania: D +1.75%
North Carolina: D +0.9%
Arizona: R +1%
Georgia: R +2%
Arkansas: R +3%
Colorado: R +3.5%
Kentucky: R +4%
Louisiana: R +5%
Alaska: R +7%
South Carolina: R +7%
Texas: R +8%
Mississippi: R +9%
Kansas: R +9%
Montana: R +13%
West Virginia: R +14%
Wyoming: R +28%
Here are the current stats on Republican candidates:
1. Chris Christie favoured in 13 of 28 states (for 169 EVs)
2. Jeb Bush favoured in 6 states (Florida, Arizona, Kentucky (!!), Kansas, West Virginia & Alaska - for 62 EVs)
2. Mike Huckabee in 5 states (Texas (!), Louisiana (!), Arkansas, Iowa (!) & New Hampshire (!) - for 62 EVs)
4. Paul Ryan favoured in 2 states (Wisconsin & Colorado - for 19 EVs)
5. Marco Rubio favoured in 1 state (South Carolina - for 9 EVs)
6. Susana Martinez favoured in 1 state (New Mexico - for 5 EVs)
7. Rand Paul favoured in 1 state (Montana - for 3 EVs)
All in all; North Carolina, Florida, Ohio and New Mexico being amazing news for Hillary (a red state going blue or blue states going even bluer), while Colorado is equally bad news for her (a blue state going red). Interestingly though, four out of those five states are swing/battleground/purple states. Meaning that we're not seeing a further polarization of the electorate in most states - at least not this far.
Current update as of May 22.
Title: Re: 2016 Official Polling Map Thread
Post by: pbrower2a on May 22, 2014, 05:01:07 PM
Clinton 46%, Paul 42% (Clinton +4%)
Clinton 46%, Huckabee 42% (Clinton +4%)
Clinton 44%, Bush 39% (Clinton +5%)
Clinton 45%, Christie 39% (Clinton +6%)
Clinton 47%, Cruz 40% (Clinton +7%)
Tightening, but at or above the margin of error.
Hillary Clinton vs. Jeb Bush
( )
)
Hillary Clinton vs. Chris Christie
()
Hillary Clinton vs. Mike Huckabee
()
Hillary Clinton vs. Rand Paul
()
blue, Republican -- red, Democratic
30% -- lead with 40-49% but a margin of 3% or less
40% -- lead with 40-49% but a margin of 4% or more
60% -- lead with 50-54%
70% -- lead with 55-59%
90% -- lead with 60% or more
Clinton 46%, Huckabee 42% (Clinton +4%)
Clinton 44%, Bush 39% (Clinton +5%)
Clinton 45%, Christie 39% (Clinton +6%)
Clinton 47%, Cruz 40% (Clinton +7%)
Tightening, but at or above the margin of error.
Hillary Clinton vs. Jeb Bush
(
Hillary Clinton vs. Chris Christie
(
Hillary Clinton vs. Mike Huckabee
(
Hillary Clinton vs. Rand Paul
(
blue, Republican -- red, Democratic
30% -- lead with 40-49% but a margin of 3% or less
40% -- lead with 40-49% but a margin of 4% or more
60% -- lead with 50-54%
70% -- lead with 55-59%
90% -- lead with 60% or more
Title: Re: 2016 Official Polling Map Thread
Post by: pbrower2a on May 30, 2014, 02:57:01 PM
Oregon, and our first view of the West Coast (aside from Alaska, which seems to vote more like Texas than about anything else) for the 2016 Presidential election in this thread:
http://www.publicpolicypolling.com/main/2014/05/oregon-miscellany.html
Clinton: 51%, Huckabee 39% (Clinton +12%)
Clinton: 51%, Paul 39% (Clinton +12%)
Clinton: 51%, Bush 36% (Clinton +15%)
Clinton: 52%, Cruz 37% (Clinton +15%)
Clinton: 51%, Christie: 34% (Clinton +17%)
Oregon is definitely not a swing state if Hillary Clinton is the nominee. PPP does Pennsylvania next week. Apparently, Quinnipiac didn't poll over the weekend.
Hillary Clinton vs. Jeb Bush
(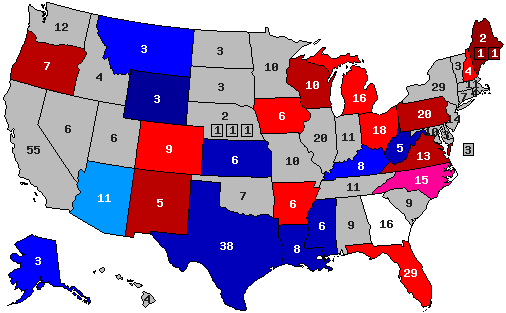 )
)
Hillary Clinton vs. Chris Christie
( )
)
Hillary Clinton vs. Mike Huckabee
(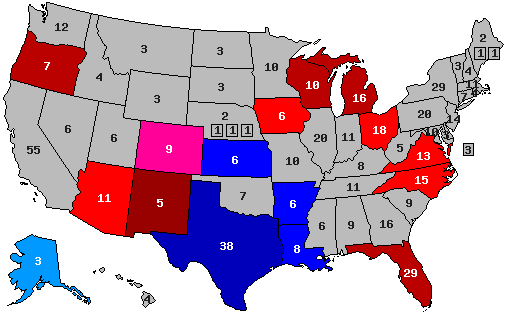 )
)
Hillary Clinton vs. Rand Paul
(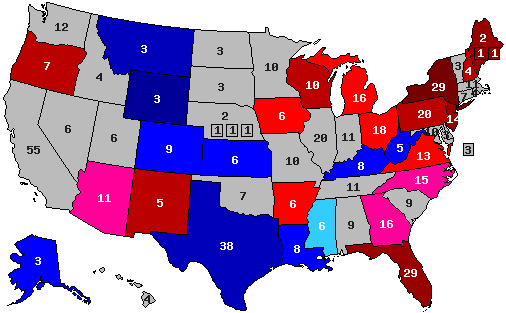 )
)
blue, Republican -- red, Democratic
30% -- lead with 40-49% but a margin of 3% or less
40% -- lead with 40-49% but a margin of 4% or more
60% -- lead with 50-54%
70% -- lead with 55-59%
90% -- lead with 60% or more
http://www.publicpolicypolling.com/main/2014/05/oregon-miscellany.html
Clinton: 51%, Huckabee 39% (Clinton +12%)
Clinton: 51%, Paul 39% (Clinton +12%)
Clinton: 51%, Bush 36% (Clinton +15%)
Clinton: 52%, Cruz 37% (Clinton +15%)
Clinton: 51%, Christie: 34% (Clinton +17%)
Oregon is definitely not a swing state if Hillary Clinton is the nominee. PPP does Pennsylvania next week. Apparently, Quinnipiac didn't poll over the weekend.
Hillary Clinton vs. Jeb Bush
(
Hillary Clinton vs. Chris Christie
(
Hillary Clinton vs. Mike Huckabee
(
Hillary Clinton vs. Rand Paul
(
blue, Republican -- red, Democratic
30% -- lead with 40-49% but a margin of 3% or less
40% -- lead with 40-49% but a margin of 4% or more
60% -- lead with 50-54%
70% -- lead with 55-59%
90% -- lead with 60% or more
Title: Re: 2016 Official Polling Map Thread
Post by: eric82oslo on May 30, 2014, 03:41:50 PM
With PPP's poll just released, we have our first numbers out from Oregon - which has thus become the 29th state added to our 2016 map. It is, perhaps somewhat surprisingly, Rand Paul and Mike Huckabee who are doing the best against Hillary in Oregon, though still trailing her by 12% each. Oregon's 7 electoral votes seem to be going Democratic once more. And what's more: Hillary, at this point in time, is leading her strongest opponents by the exact same margin as Obama beat Romney with in the state.
The total number of state polls included in the lists below has thus now reached 122.
So here they are - all the 2016 poll averages for each state so far - 29 states having been polled to date - and how far off they are compared to the actual 2012 outcomes. I'm only including the Republican candidate with the best statewide polling.
Alaska: Hillary vs Jeb Bush: R +7%
+7% D improvement
(Updated on May 14, 2014)
Arizona: Hillary vs Bush: R +1%
+8% D improvement
(Updated on March 6, 2014)
Arkansas: Hillary vs Mike Huckabee: R +3%
+17% D improvement
(Updated on May 5, 2014)
Colorado: Hillary vs Paul Ryan: R +3.5%
+8.9% R improvement
Current Republican gain
(Updated on April 25, 2014)
Florida: Hillary vs Bush: D +7.4%
+6.5% D improvement
(Updated on May 5, 2014)
Georgia: Hillary vs Christie: R +2%
+6% D improvement
(Updated August 8 )
Iowa: Hillary vs Mike Huckabee: D +2.6%
+3.2% R improvement
(Updated on May 22, 2014)
Kansas: Hillary vs Bush: R +9%
+13% D improvement
(Updated on February 24, 2014)
Kentucky: Hillary vs Christie/Bush: R +4%
+19% D improvement
(Updated on May 18, 2014)
Louisiana: Hillary vs Huckabee: R +5%
+12% D improvement
(Updated on February 18, 2014)
Maine: Hillary vs Christie: D +8%
+7% R improvement
(Updated on November 13)
Michigan: Hillary vs Christie: D +4.8%
+4.7% R improvement
(Updated on April 9, 2014)
Minnesota: Hillary vs Christie: D +6%
+2% R improvement
(Updated on January 22, 2013)
Mississippi: Hillary vs Christie: R +9%
+2.5% D improvement
(Updated on November 19)
Montana: Hillary vs Rand Paul: R +13%
+1% D improvement
(Updated on November 24)
New Hampshire: Hillary vs Huckabee: D +2.1%
+3.5% R improvement
(Updated on May 12, 2014)
New Jersey: Hillary vs Christie: D +10.5%
+7.3% R improvement
(Updated on March 4, 2014)
New Mexico: Hillary vs Susana Martinez: D +14%
+4% D improvement
(Updated on March 27, 2014)
New York: Hillary vs Christie: D +28%
+0.2% R improvement
(Updated on March 4, 2014)
North Carolina: Hillary vs Christie: D +0.9%
+2.9% D improvement
Current Democratic gain
(Updated on May 14, 2014)
Ohio: Hillary vs Christie: D +6.2%
+3.2% D improvement
(Updated on May 15, 2014)
NEW! Oregon: Hillary vs Rand Paul/Huckabee: D +12%
Unchanged from 2012
(Updated on May 30, 2014)
Pennsylvania: Hillary vs Christie: D +1.75%
+3.6% R improvement
(Updated on February 27, 2014)
South Carolina: Hillary vs Marco Rubio: R+7%
+3.5% D improvement
(Updated on November 2)
Texas: Hillary vs Huckabee: R +8%
+8% D improvement
(Updated on April 18, 2014)
Virginia: Hillary vs Christie: D +3.22%
+0.6% R improvement
(Updated on March 27, 2014)
West Virginia: Hillary vs Bush: R +14%
+13% D improvement
(Updated on October 1)
Wisconsin: Hillary vs Ryan: D +5.1%
+1.8% R improvement
(Updated on April 25, 2014)
Wyoming: Hillary vs Christie: R +28%
+13% D improvement
(Updated on July 23)
Average all 29 states: Hillary vs Best Republican: R +0.04% (basically toss up)
+3.34% D improvement (from Obama 2012) [projecting a 7.2% victory for Hillary]
That gives us this map right now:
(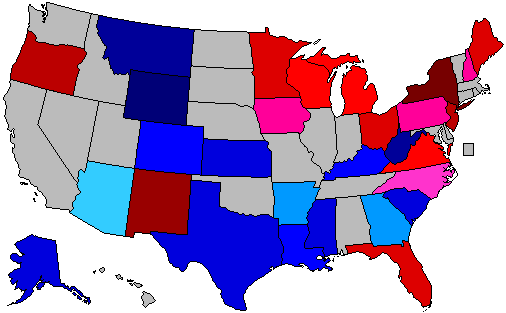 )
)
Red = Democratic lead or trend
Blue = Republican lead or trend
Green = Exact tie or no trend, unchanged from 2012
Grey = No polling yet
Green = toss up
20% shade = 0.1-1% lead
30% shade = 1.1-3% lead
40% shade = 3.1-6% lead
50% shade = 6.1-9% lead
60% shade = 9.1-12% lead
70% shade = 12.1-15% lead
80% shade = 15.1-18% lead
90% shade = Above 18.1% lead
In the count of electoral votes, this means the current situation looks like this:
Hillary: 216 EVs (for a total of 15 states)
Best/Tailormade Republican: 120 EVs (for a total of 14 states)
Toss-up: None
No polling: 202 EVs (for a total of 21 states + D.C.)
Which means that Hillary has captured a rather impressive 64.3% of all EVs awarded thus far, against a disappointing 35.7% EVs for the tailormade Republican. Even as the biggest price by far, California, hasn't been added yet.
This is how the Trendline Map looks so far:
(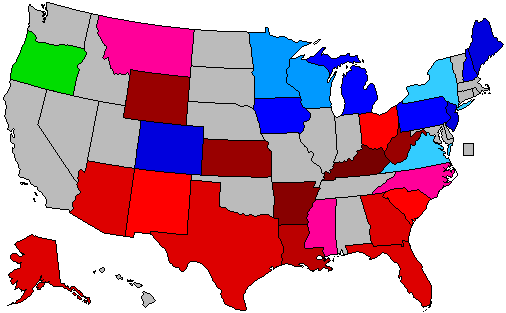 )
)
The states which right now are showing the strongest improvement for the Democratic (Hillary) or the Republican candidate (in 13 out of 29 cases, Christie is that person):
1. Kentucky: D +19%
2. Arkansas: D +17%
3. Kansas: D +13%
4. West Virginia: D +13%
5. Wyoming: D +13%
6. Louisiana: D +12%
7. Colorado: R +8.9%
8. Arizona: D +8%
8. Texas: D +8%
10. New Jersey: R +7.3%
11. Maine: R +7%
12. Alaska: D +7%
13. Florida: D +6.5%
14. Georgia: D +6%
15. Michigan: R +4.7%
All of these changes (in the 15 states above) are (more than) statistically significant.
The whole list of states having been polled till now, going from Democratic stronghold to Republican stronghold:
New York: D +28%
New Mexico: D +14%
Oregon: D +12%
New Jersey: D +10.5%
Maine: D +8%
Florida: D +7.4%
Currently estimated/projected national average: D +7.2%
Ohio: D +6.2%
Minnesota: D +6%
Wisconsin: D +5.1%
Michigan: D +4.8%
Virginia: D +3.2%
Iowa: D +2.6%
New Hampshire: D +2.1%
Pennsylvania: D +1.75%
North Carolina: D +0.9%
Arizona: R +1%
Georgia: R +2%
Arkansas: R +3%
Colorado: R +3.5%
Kentucky: R +4%
Louisiana: R +5%
Alaska: R +7%
South Carolina: R +7%
Texas: R +8%
Mississippi: R +9%
Kansas: R +9%
Montana: R +13%
West Virginia: R +14%
Wyoming: R +28%
Here are the current stats on the best-tailored Republican candidates in all states polled so far:
1. Chris Christie favoured in 13 of 29 states (for 169 EVs)
2. Mike Huckabee in 6 states (Texas (!), Louisiana (!), Oregon (shared), Arkansas, Iowa (!) & New Hampshire (!) - for 69 EVs)
3. Jeb Bush favoured in 6 states (Florida, Arizona, Kentucky (!!) (shared), Kansas, West Virginia & Alaska - for 62 EVs)
4. Paul Ryan favoured in 2 states (Wisconsin & Colorado - for 19 EVs)
5. Rand Paul favoured in 2 states (Oregon (shared) & Montana - for 10 EVs)
6. Marco Rubio favoured in 1 state (South Carolina - for 9 EVs)
7. Susana Martinez favoured in 1 state (New Mexico - for 5 EVs)
All in all; North Carolina, Florida, Ohio and New Mexico being amazing news for Hillary (a red state going blue or blue states going even bluer), while Colorado is equally bad news for her (a blue state going red). Interestingly though, four out of those five states are swing/battleground/purple states. Meaning that we're not seeing a further polarization of the electorate in most states - at least not this far.
Current update as of May 30.
The total number of state polls included in the lists below has thus now reached 122.
So here they are - all the 2016 poll averages for each state so far - 29 states having been polled to date - and how far off they are compared to the actual 2012 outcomes. I'm only including the Republican candidate with the best statewide polling.
Alaska: Hillary vs Jeb Bush: R +7%
+7% D improvement
(Updated on May 14, 2014)
Arizona: Hillary vs Bush: R +1%
+8% D improvement
(Updated on March 6, 2014)
Arkansas: Hillary vs Mike Huckabee: R +3%
+17% D improvement
(Updated on May 5, 2014)
Colorado: Hillary vs Paul Ryan: R +3.5%
+8.9% R improvement
Current Republican gain
(Updated on April 25, 2014)
Florida: Hillary vs Bush: D +7.4%
+6.5% D improvement
(Updated on May 5, 2014)
Georgia: Hillary vs Christie: R +2%
+6% D improvement
(Updated August 8 )
Iowa: Hillary vs Mike Huckabee: D +2.6%
+3.2% R improvement
(Updated on May 22, 2014)
Kansas: Hillary vs Bush: R +9%
+13% D improvement
(Updated on February 24, 2014)
Kentucky: Hillary vs Christie/Bush: R +4%
+19% D improvement
(Updated on May 18, 2014)
Louisiana: Hillary vs Huckabee: R +5%
+12% D improvement
(Updated on February 18, 2014)
Maine: Hillary vs Christie: D +8%
+7% R improvement
(Updated on November 13)
Michigan: Hillary vs Christie: D +4.8%
+4.7% R improvement
(Updated on April 9, 2014)
Minnesota: Hillary vs Christie: D +6%
+2% R improvement
(Updated on January 22, 2013)
Mississippi: Hillary vs Christie: R +9%
+2.5% D improvement
(Updated on November 19)
Montana: Hillary vs Rand Paul: R +13%
+1% D improvement
(Updated on November 24)
New Hampshire: Hillary vs Huckabee: D +2.1%
+3.5% R improvement
(Updated on May 12, 2014)
New Jersey: Hillary vs Christie: D +10.5%
+7.3% R improvement
(Updated on March 4, 2014)
New Mexico: Hillary vs Susana Martinez: D +14%
+4% D improvement
(Updated on March 27, 2014)
New York: Hillary vs Christie: D +28%
+0.2% R improvement
(Updated on March 4, 2014)
North Carolina: Hillary vs Christie: D +0.9%
+2.9% D improvement
Current Democratic gain
(Updated on May 14, 2014)
Ohio: Hillary vs Christie: D +6.2%
+3.2% D improvement
(Updated on May 15, 2014)
NEW! Oregon: Hillary vs Rand Paul/Huckabee: D +12%
Unchanged from 2012
(Updated on May 30, 2014)
Pennsylvania: Hillary vs Christie: D +1.75%
+3.6% R improvement
(Updated on February 27, 2014)
South Carolina: Hillary vs Marco Rubio: R+7%
+3.5% D improvement
(Updated on November 2)
Texas: Hillary vs Huckabee: R +8%
+8% D improvement
(Updated on April 18, 2014)
Virginia: Hillary vs Christie: D +3.22%
+0.6% R improvement
(Updated on March 27, 2014)
West Virginia: Hillary vs Bush: R +14%
+13% D improvement
(Updated on October 1)
Wisconsin: Hillary vs Ryan: D +5.1%
+1.8% R improvement
(Updated on April 25, 2014)
Wyoming: Hillary vs Christie: R +28%
+13% D improvement
(Updated on July 23)
Average all 29 states: Hillary vs Best Republican: R +0.04% (basically toss up)
+3.34% D improvement (from Obama 2012) [projecting a 7.2% victory for Hillary]
That gives us this map right now:
(
Red = Democratic lead or trend
Blue = Republican lead or trend
Green = Exact tie or no trend, unchanged from 2012
Grey = No polling yet
Green = toss up
20% shade = 0.1-1% lead
30% shade = 1.1-3% lead
40% shade = 3.1-6% lead
50% shade = 6.1-9% lead
60% shade = 9.1-12% lead
70% shade = 12.1-15% lead
80% shade = 15.1-18% lead
90% shade = Above 18.1% lead
In the count of electoral votes, this means the current situation looks like this:
Hillary: 216 EVs (for a total of 15 states)
Best/Tailormade Republican: 120 EVs (for a total of 14 states)
Toss-up: None
No polling: 202 EVs (for a total of 21 states + D.C.)
Which means that Hillary has captured a rather impressive 64.3% of all EVs awarded thus far, against a disappointing 35.7% EVs for the tailormade Republican. Even as the biggest price by far, California, hasn't been added yet.
This is how the Trendline Map looks so far:
(
The states which right now are showing the strongest improvement for the Democratic (Hillary) or the Republican candidate (in 13 out of 29 cases, Christie is that person):
1. Kentucky: D +19%
2. Arkansas: D +17%
3. Kansas: D +13%
4. West Virginia: D +13%
5. Wyoming: D +13%
6. Louisiana: D +12%
7. Colorado: R +8.9%
8. Arizona: D +8%
8. Texas: D +8%
10. New Jersey: R +7.3%
11. Maine: R +7%
12. Alaska: D +7%
13. Florida: D +6.5%
14. Georgia: D +6%
15. Michigan: R +4.7%
All of these changes (in the 15 states above) are (more than) statistically significant.
The whole list of states having been polled till now, going from Democratic stronghold to Republican stronghold:
New York: D +28%
New Mexico: D +14%
Oregon: D +12%
New Jersey: D +10.5%
Maine: D +8%
Florida: D +7.4%
Currently estimated/projected national average: D +7.2%
Ohio: D +6.2%
Minnesota: D +6%
Wisconsin: D +5.1%
Michigan: D +4.8%
Virginia: D +3.2%
Iowa: D +2.6%
New Hampshire: D +2.1%
Pennsylvania: D +1.75%
North Carolina: D +0.9%
Arizona: R +1%
Georgia: R +2%
Arkansas: R +3%
Colorado: R +3.5%
Kentucky: R +4%
Louisiana: R +5%
Alaska: R +7%
South Carolina: R +7%
Texas: R +8%
Mississippi: R +9%
Kansas: R +9%
Montana: R +13%
West Virginia: R +14%
Wyoming: R +28%
Here are the current stats on the best-tailored Republican candidates in all states polled so far:
1. Chris Christie favoured in 13 of 29 states (for 169 EVs)
2. Mike Huckabee in 6 states (Texas (!), Louisiana (!), Oregon (shared), Arkansas, Iowa (!) & New Hampshire (!) - for 69 EVs)
3. Jeb Bush favoured in 6 states (Florida, Arizona, Kentucky (!!) (shared), Kansas, West Virginia & Alaska - for 62 EVs)
4. Paul Ryan favoured in 2 states (Wisconsin & Colorado - for 19 EVs)
5. Rand Paul favoured in 2 states (Oregon (shared) & Montana - for 10 EVs)
6. Marco Rubio favoured in 1 state (South Carolina - for 9 EVs)
7. Susana Martinez favoured in 1 state (New Mexico - for 5 EVs)
All in all; North Carolina, Florida, Ohio and New Mexico being amazing news for Hillary (a red state going blue or blue states going even bluer), while Colorado is equally bad news for her (a blue state going red). Interestingly though, four out of those five states are swing/battleground/purple states. Meaning that we're not seeing a further polarization of the electorate in most states - at least not this far.
Current update as of May 30.
Title: Re: 2016 Official Polling Map Thread
Post by: pbrower2a on June 05, 2014, 06:20:15 AM
Quinnipiac, Pennsylvania:
Secretary Clinton tops Governor-next-door Christie 45 - 41 percent, the independent Quinnipiac (KWIN-uh-pe-ack) University poll finds. She leads 51 - 37 percent among women, while men go to Christie 45 - 38 percent.
51 - 37 percent over U.S. Sen. Rand Paul of Kentucky. Women back Clinton 56 - 30 percent while men are divided 45 - 45 percent;
51 - 36 percent over former Arkansas Gov. Mike Huckabee. Clinton leads 56 - 32 percent among women and 46 - 41 percent among men;
51 - 35 percent over former Florida Gov. Jeb Bush, including 57 - 31 percent among women and 45 - 39 percent among men;
50 - 38 percent over U.S. Rep. Paul Ryan of Wisconsin. Women go Democratic 55 - 31 percent, while men are divided, with 44 percent for Clinton and 45 percent for Ryan.
http://www.quinnipiac.edu/news-and-events/quinnipiac-university-poll/pennsylvania/release-detail?ReleaseID=2048
PPP will release its results for Pennsylvania today. I doubt that there will be much of a difference.
Hillary Clinton vs. Jeb Bush
()
Hillary Clinton vs. Chris Christie
()
Hillary Clinton vs. Mike Huckabee
( )
)
Hillary Clinton vs. Rand Paul
()
blue, Republican -- red, Democratic
30% -- lead with 40-49% but a margin of 3% or less
40% -- lead with 40-49% but a margin of 4% or more
60% -- lead with 50-54%
70% -- lead with 55-59%
90% -- lead with 60% or more
Secretary Clinton tops Governor-next-door Christie 45 - 41 percent, the independent Quinnipiac (KWIN-uh-pe-ack) University poll finds. She leads 51 - 37 percent among women, while men go to Christie 45 - 38 percent.
51 - 37 percent over U.S. Sen. Rand Paul of Kentucky. Women back Clinton 56 - 30 percent while men are divided 45 - 45 percent;
51 - 36 percent over former Arkansas Gov. Mike Huckabee. Clinton leads 56 - 32 percent among women and 46 - 41 percent among men;
51 - 35 percent over former Florida Gov. Jeb Bush, including 57 - 31 percent among women and 45 - 39 percent among men;
50 - 38 percent over U.S. Rep. Paul Ryan of Wisconsin. Women go Democratic 55 - 31 percent, while men are divided, with 44 percent for Clinton and 45 percent for Ryan.
http://www.quinnipiac.edu/news-and-events/quinnipiac-university-poll/pennsylvania/release-detail?ReleaseID=2048
PPP will release its results for Pennsylvania today. I doubt that there will be much of a difference.
Hillary Clinton vs. Jeb Bush
(
Hillary Clinton vs. Chris Christie
(
Hillary Clinton vs. Mike Huckabee
(
Hillary Clinton vs. Rand Paul
(
blue, Republican -- red, Democratic
30% -- lead with 40-49% but a margin of 3% or less
40% -- lead with 40-49% but a margin of 4% or more
60% -- lead with 50-54%
70% -- lead with 55-59%
90% -- lead with 60% or more
Title: Re: 2016 Official Polling Map Thread
Post by: pbrower2a on June 05, 2014, 01:53:04 PM
PPP shows much the same as Quinnipiac for Pennsylvania, except that PPP doesn't have Christie as close to Hillary Clinton:
http://www.publicpolicypolling.com/main/2014/06/pennsylvania-miscellany.html#more
When two pollsters get such similar results for the same state in the same week one has a good calibration. Obviously we have no need for a new map, as averaging changes nothing.
Quote
Hillary Clinton has double digit leads over all of her potential Republican opponents for the general election. It's 49/39 over Chris Christie, 51/40 over Rick Santorum, 51/37 over Jeb Bush, 52/38 over Rand Paul, 52/37 over Mike Huckabee, and 53/34 over Ted Cruz. Those leads are all considerably bigger than what Barack Obama won the state by in 2012.
http://www.publicpolicypolling.com/main/2014/06/pennsylvania-miscellany.html#more
When two pollsters get such similar results for the same state in the same week one has a good calibration. Obviously we have no need for a new map, as averaging changes nothing.
Title: Re: 2016 Official Polling Map Thread
Post by: eric82oslo on June 05, 2014, 02:40:21 PM
Two new polls out today - by PPP and Quinnipiac - and both from Pennsylvania. There have now been 8 match up polls conducted in Pennsylvania for 2016. Christie is still far and away the best liked Republican in the state, probably due to his presence as Governor in the neighbouring state. However, Christie has lost even more of his previous edge, and with today's two new polls added to the mix, now trails Hillary by -3.5% in the state, twice the previous margin of -1.75%. With this, Pennsylvania passes both New Hampshire, Iowa and Virginia on the Likely Democratic scale of 2016.
The total number of state polls included in the lists below has thus now reached 124.
So here they are - all the 2016 poll averages for each state so far - 29 states having been polled to date - and how far off they are compared to the actual 2012 outcomes. I'm only including the Republican candidate with the best statewide polling.
Alaska: Hillary vs Jeb Bush: R +7%
+7% D improvement
(Updated on May 14, 2014)
Arizona: Hillary vs Bush: R +1%
+8% D improvement
(Updated on March 6, 2014)
Arkansas: Hillary vs Mike Huckabee: R +3%
+17% D improvement
(Updated on May 5, 2014)
Colorado: Hillary vs Paul Ryan: R +3.5%
+8.9% R improvement
Current Republican gain
(Updated on April 25, 2014)
Florida: Hillary vs Bush: D +7.4%
+6.5% D improvement
(Updated on May 5, 2014)
Georgia: Hillary vs Christie: R +2%
+6% D improvement
(Updated August 8 )
Iowa: Hillary vs Mike Huckabee: D +2.6%
+3.2% R improvement
(Updated on May 22, 2014)
Kansas: Hillary vs Bush: R +9%
+13% D improvement
(Updated on February 24, 2014)
Kentucky: Hillary vs Christie/Bush: R +4%
+19% D improvement
(Updated on May 18, 2014)
Louisiana: Hillary vs Huckabee: R +5%
+12% D improvement
(Updated on February 18, 2014)
Maine: Hillary vs Christie: D +8%
+7% R improvement
(Updated on November 13)
Michigan: Hillary vs Christie: D +4.8%
+4.7% R improvement
(Updated on April 9, 2014)
Minnesota: Hillary vs Christie: D +6%
+2% R improvement
(Updated on January 22, 2013)
Mississippi: Hillary vs Christie: R +9%
+2.5% D improvement
(Updated on November 19)
Montana: Hillary vs Rand Paul: R +13%
+1% D improvement
(Updated on November 24)
New Hampshire: Hillary vs Huckabee: D +2.1%
+3.5% R improvement
(Updated on May 12, 2014)
New Jersey: Hillary vs Christie: D +10.5%
+7.3% R improvement
(Updated on March 4, 2014)
New Mexico: Hillary vs Susana Martinez: D +14%
+4% D improvement
(Updated on March 27, 2014)
New York: Hillary vs Christie: D +28%
+0.2% R improvement
(Updated on March 4, 2014)
North Carolina: Hillary vs Christie: D +0.9%
+2.9% D improvement
Current Democratic gain
(Updated on May 14, 2014)
Ohio: Hillary vs Christie: D +6.2%
+3.2% D improvement
(Updated on May 15, 2014)
Oregon: Hillary vs Rand Paul/Huckabee: D +12%
Unchanged from 2012
(Updated on May 30, 2014)
Pennsylvania: Hillary vs Christie: D +3.5%
+1.9% R improvement
(Updated on June 5, 2014)
South Carolina: Hillary vs Marco Rubio: R +7%
+3.5% D improvement
(Updated on November 2)
Texas: Hillary vs Huckabee: R +8%
+8% D improvement
(Updated on April 18, 2014)
Virginia: Hillary vs Christie: D +3.22%
+0.6% R improvement
(Updated on March 27, 2014)
West Virginia: Hillary vs Bush: R +14%
+13% D improvement
(Updated on October 1)
Wisconsin: Hillary vs Ryan: D +5.1%
+1.8% R improvement
(Updated on April 25, 2014)
Wyoming: Hillary vs Christie: R +28%
+13% D improvement
(Updated on July 23)
Average all 29 states: Hillary vs Best Republican: D +0.03% (basically toss up)
+3.4% D improvement (from Obama 2012) [projecting a 7.3% victory for Hillary]
That gives us this map right now:
(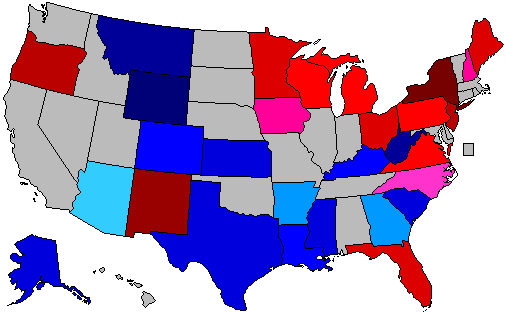 )
)
Red = Democratic lead or trend
Blue = Republican lead or trend
Green = Exact tie or no trend, unchanged from 2012
Grey = No polling yet
Green = toss up
20% shade = 0.1-1% lead
30% shade = 1.1-3% lead
40% shade = 3.1-6% lead
50% shade = 6.1-9% lead
60% shade = 9.1-12% lead
70% shade = 12.1-15% lead
80% shade = 15.1-18% lead
90% shade = Above 18.1% lead
In the count of electoral votes, this means the current situation looks like this:
Hillary: 216 EVs (for a total of 15 states)
Best/Tailormade Republican: 120 EVs (for a total of 14 states)
Toss-up: None
No polling: 202 EVs (for a total of 21 states + D.C.)
Which means that Hillary has captured a rather impressive 64.3% of all EVs awarded thus far, against a disappointing 35.7% EVs for the tailormade Republican. Even as the biggest price by far, California, hasn't been added yet.
This is how the Trendline Map looks so far:
(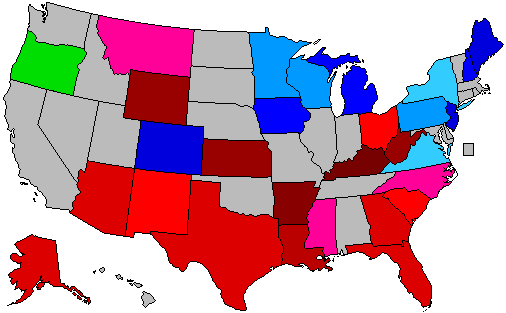 )
)
The states which right now are showing the strongest improvement for the Democratic (Hillary) or the Republican candidate (in 13 out of 29 cases, Christie is that person):
1. Kentucky: D +19%
2. Arkansas: D +17%
3. Kansas: D +13%
4. West Virginia: D +13%
5. Wyoming: D +13%
6. Louisiana: D +12%
7. Colorado: R +8.9%
8. Arizona: D +8%
9. Texas: D +8%
10. New Jersey: R +7.3%
11. Maine: R +7%
12. Alaska: D +7%
13. Florida: D +6.5%
14. Georgia: D +6%
15. Michigan: R +4.7%
All of these changes (in the 15 states above) are (more than) statistically significant.
The whole list of states having been polled till now, going from Democratic stronghold to Republican stronghold:
New York: D +28%
New Mexico: D +14%
Oregon: D +12%
New Jersey: D +10.5%
Maine: D +8%
Florida: D +7.4%
Currently estimated/projected national average: D +7.3%
Ohio: D +6.2%
Minnesota: D +6%
Wisconsin: D +5.1%
Michigan: D +4.8%
Pennsylvania: D +3.5%
Virginia: D +3.2%
Iowa: D +2.6%
New Hampshire: D +2.1%
North Carolina: D +0.9%
Arizona: R +1%
Georgia: R +2%
Arkansas: R +3%
Colorado: R +3.5%
Kentucky: R +4%
Louisiana: R +5%
Alaska: R +7%
South Carolina: R +7%
Texas: R +8%
Mississippi: R +9%
Kansas: R +9%
Montana: R +13%
West Virginia: R +14%
Wyoming: R +28%
Here are the current stats on the best-tailored Republican candidates in all states polled so far:
1. Chris Christie favoured in 13 of 29 states (for 169 EVs)
2. Mike Huckabee in 6 states (Texas (!), Louisiana (!), Oregon (shared), Arkansas, Iowa (!) & New Hampshire (!) - for 69 EVs)
3. Jeb Bush favoured in 6 states (Florida, Arizona, Kentucky (!!) (shared), Kansas, West Virginia & Alaska - for 62 EVs)
4. Paul Ryan favoured in 2 states (Wisconsin & Colorado - for 19 EVs)
5. Rand Paul favoured in 2 states (Oregon (shared) & Montana - for 10 EVs)
6. Marco Rubio favoured in 1 state (South Carolina - for 9 EVs)
7. Susana Martinez favoured in 1 state (New Mexico - for 5 EVs)
All in all; North Carolina, Florida, Ohio and New Mexico being amazing news for Hillary (a red state going blue or blue states going even bluer), while Colorado is equally bad news for her (a blue state going red). Interestingly though, four out of those five states are swing/battleground/purple states. Meaning that we're not seeing a further polarization of the electorate in most states - at least not this far.
Current update as of June 5.
The total number of state polls included in the lists below has thus now reached 124.
So here they are - all the 2016 poll averages for each state so far - 29 states having been polled to date - and how far off they are compared to the actual 2012 outcomes. I'm only including the Republican candidate with the best statewide polling.
Alaska: Hillary vs Jeb Bush: R +7%
+7% D improvement
(Updated on May 14, 2014)
Arizona: Hillary vs Bush: R +1%
+8% D improvement
(Updated on March 6, 2014)
Arkansas: Hillary vs Mike Huckabee: R +3%
+17% D improvement
(Updated on May 5, 2014)
Colorado: Hillary vs Paul Ryan: R +3.5%
+8.9% R improvement
Current Republican gain
(Updated on April 25, 2014)
Florida: Hillary vs Bush: D +7.4%
+6.5% D improvement
(Updated on May 5, 2014)
Georgia: Hillary vs Christie: R +2%
+6% D improvement
(Updated August 8 )
Iowa: Hillary vs Mike Huckabee: D +2.6%
+3.2% R improvement
(Updated on May 22, 2014)
Kansas: Hillary vs Bush: R +9%
+13% D improvement
(Updated on February 24, 2014)
Kentucky: Hillary vs Christie/Bush: R +4%
+19% D improvement
(Updated on May 18, 2014)
Louisiana: Hillary vs Huckabee: R +5%
+12% D improvement
(Updated on February 18, 2014)
Maine: Hillary vs Christie: D +8%
+7% R improvement
(Updated on November 13)
Michigan: Hillary vs Christie: D +4.8%
+4.7% R improvement
(Updated on April 9, 2014)
Minnesota: Hillary vs Christie: D +6%
+2% R improvement
(Updated on January 22, 2013)
Mississippi: Hillary vs Christie: R +9%
+2.5% D improvement
(Updated on November 19)
Montana: Hillary vs Rand Paul: R +13%
+1% D improvement
(Updated on November 24)
New Hampshire: Hillary vs Huckabee: D +2.1%
+3.5% R improvement
(Updated on May 12, 2014)
New Jersey: Hillary vs Christie: D +10.5%
+7.3% R improvement
(Updated on March 4, 2014)
New Mexico: Hillary vs Susana Martinez: D +14%
+4% D improvement
(Updated on March 27, 2014)
New York: Hillary vs Christie: D +28%
+0.2% R improvement
(Updated on March 4, 2014)
North Carolina: Hillary vs Christie: D +0.9%
+2.9% D improvement
Current Democratic gain
(Updated on May 14, 2014)
Ohio: Hillary vs Christie: D +6.2%
+3.2% D improvement
(Updated on May 15, 2014)
Oregon: Hillary vs Rand Paul/Huckabee: D +12%
Unchanged from 2012
(Updated on May 30, 2014)
Pennsylvania: Hillary vs Christie: D +3.5%
+1.9% R improvement
(Updated on June 5, 2014)
South Carolina: Hillary vs Marco Rubio: R +7%
+3.5% D improvement
(Updated on November 2)
Texas: Hillary vs Huckabee: R +8%
+8% D improvement
(Updated on April 18, 2014)
Virginia: Hillary vs Christie: D +3.22%
+0.6% R improvement
(Updated on March 27, 2014)
West Virginia: Hillary vs Bush: R +14%
+13% D improvement
(Updated on October 1)
Wisconsin: Hillary vs Ryan: D +5.1%
+1.8% R improvement
(Updated on April 25, 2014)
Wyoming: Hillary vs Christie: R +28%
+13% D improvement
(Updated on July 23)
Average all 29 states: Hillary vs Best Republican: D +0.03% (basically toss up)
+3.4% D improvement (from Obama 2012) [projecting a 7.3% victory for Hillary]
That gives us this map right now:
(
Red = Democratic lead or trend
Blue = Republican lead or trend
Green = Exact tie or no trend, unchanged from 2012
Grey = No polling yet
Green = toss up
20% shade = 0.1-1% lead
30% shade = 1.1-3% lead
40% shade = 3.1-6% lead
50% shade = 6.1-9% lead
60% shade = 9.1-12% lead
70% shade = 12.1-15% lead
80% shade = 15.1-18% lead
90% shade = Above 18.1% lead
In the count of electoral votes, this means the current situation looks like this:
Hillary: 216 EVs (for a total of 15 states)
Best/Tailormade Republican: 120 EVs (for a total of 14 states)
Toss-up: None
No polling: 202 EVs (for a total of 21 states + D.C.)
Which means that Hillary has captured a rather impressive 64.3% of all EVs awarded thus far, against a disappointing 35.7% EVs for the tailormade Republican. Even as the biggest price by far, California, hasn't been added yet.
This is how the Trendline Map looks so far:
(
The states which right now are showing the strongest improvement for the Democratic (Hillary) or the Republican candidate (in 13 out of 29 cases, Christie is that person):
1. Kentucky: D +19%
2. Arkansas: D +17%
3. Kansas: D +13%
4. West Virginia: D +13%
5. Wyoming: D +13%
6. Louisiana: D +12%
7. Colorado: R +8.9%
8. Arizona: D +8%
9. Texas: D +8%
10. New Jersey: R +7.3%
11. Maine: R +7%
12. Alaska: D +7%
13. Florida: D +6.5%
14. Georgia: D +6%
15. Michigan: R +4.7%
All of these changes (in the 15 states above) are (more than) statistically significant.
The whole list of states having been polled till now, going from Democratic stronghold to Republican stronghold:
New York: D +28%
New Mexico: D +14%
Oregon: D +12%
New Jersey: D +10.5%
Maine: D +8%
Florida: D +7.4%
Currently estimated/projected national average: D +7.3%
Ohio: D +6.2%
Minnesota: D +6%
Wisconsin: D +5.1%
Michigan: D +4.8%
Pennsylvania: D +3.5%
Virginia: D +3.2%
Iowa: D +2.6%
New Hampshire: D +2.1%
North Carolina: D +0.9%
Arizona: R +1%
Georgia: R +2%
Arkansas: R +3%
Colorado: R +3.5%
Kentucky: R +4%
Louisiana: R +5%
Alaska: R +7%
South Carolina: R +7%
Texas: R +8%
Mississippi: R +9%
Kansas: R +9%
Montana: R +13%
West Virginia: R +14%
Wyoming: R +28%
Here are the current stats on the best-tailored Republican candidates in all states polled so far:
1. Chris Christie favoured in 13 of 29 states (for 169 EVs)
2. Mike Huckabee in 6 states (Texas (!), Louisiana (!), Oregon (shared), Arkansas, Iowa (!) & New Hampshire (!) - for 69 EVs)
3. Jeb Bush favoured in 6 states (Florida, Arizona, Kentucky (!!) (shared), Kansas, West Virginia & Alaska - for 62 EVs)
4. Paul Ryan favoured in 2 states (Wisconsin & Colorado - for 19 EVs)
5. Rand Paul favoured in 2 states (Oregon (shared) & Montana - for 10 EVs)
6. Marco Rubio favoured in 1 state (South Carolina - for 9 EVs)
7. Susana Martinez favoured in 1 state (New Mexico - for 5 EVs)
All in all; North Carolina, Florida, Ohio and New Mexico being amazing news for Hillary (a red state going blue or blue states going even bluer), while Colorado is equally bad news for her (a blue state going red). Interestingly though, four out of those five states are swing/battleground/purple states. Meaning that we're not seeing a further polarization of the electorate in most states - at least not this far.
Current update as of June 5.
Title: Re: 2016 Official Polling Map Thread
Post by: pbrower2a on June 07, 2014, 04:37:35 PM
PPP will give us some Florida polls this week. At this stage, now that we finally have one West Coast state polled for anyone and finally have one poll involving Huckabee north of the Potomac, we can draw some conclusions:
1. Hillary Clinton has largely maintained the margins by which Barack Obama won states in 2012 (if not 2008 -- and I would have to see an unlikely poll for Indiana to say "2008") while having smaller losses in those states that Barack Obama lost.
2. Hillary Clinton seems to evoke Clinton nostalgia in Arkansas. Whether that will stick is something I refuse to predict this early. She can win without Arkansas, but she can't lose with it. I'd like to see a poll for Tennessee, a state demographically similar to Arkansas, before I suggest putting it in the Clinton column.
3. Jeb Bush seems to win nothing that Barack Obama won in 2012. He doesn't even win the state in which he was Governor (Florida). He puts Arizona and Georgia at risk of becoming R losses with the possibility of a 400-EV landslide.
4. Chris Christie seems to do better than Obama did in Pennsylvania, but not well enough to win it. He makes Colorado very close (which could reflect that the questions about Presidential polling in Colorado involve an electorate for a midterm election). He gets edged out in Arizona which (a) is inconsistent with a tie in Colorado) and (b) would be more than compensation for Colorado. Hillary Clinton probably gets 360 or so electoral votes against him.
5. Paul actually wins Colorado based on 'likely voters in a midterm election'. The state has a loud libertarian segment in the electorate which shines now. But the "likely electorate of 2014" is decidedly smaller than that of a Presidential election. But he loses Arizona, which has 3 more electoral votes. If Arizona is close in a Presidential election (the state has voted once for a Democratic nominee for President since 1948) then a Republican nominee is in deep trouble.
6. Huckabee has no support outside of the Deep and Mountain South and in states that just simply never vote for a Democratic nominee. I was chary of saying so until I saw polls for Oregon and Pennsylvania. If he loses by 15% in Pennsylvania (nearly the tipping-point state in 2012), then he projects to lose by about 12% nationwide. That would be good for a landslide characteristic of Eisenhower in the 1950s with Hillary Clinton winning roughly 56% of the popular vote and about 84% of the electoral vote.
Title: Re: 2016 Official Polling Map Thread
Post by: eric82oslo on June 09, 2014, 02:59:51 PM
With today's poll of Iowa, the first caucus state of the nation has already been polled 11 times this season. For the first time in a while, it is now back to Christie, who's the guy stacking up the best against Hillary. Christie is currently trailing her by -3.78% on average. Huckabee however, in his 4th Iowa poll, falls from -2.6% to -4.5%. Third best GOP candidate is Bobby Jindal at -4.7%, though he has only been polled once in Iowa, followed by Rand Paul at -6% and Scott Walker at -6.25%.
The total number of state polls included in the lists below has thus now reached 125.
So here they are - all the 2016 poll averages for each state so far - 29 states having been polled to date - and how far off they are compared to the actual 2012 outcomes. I'm only including the Republican candidate with the best statewide polling.
Alaska: Hillary vs Jeb Bush: R +7%
+7% D improvement
(Updated on May 14, 2014)
Arizona: Hillary vs Bush: R +1%
+8% D improvement
(Updated on March 6, 2014)
Arkansas: Hillary vs Mike Huckabee: R +3%
+17% D improvement
(Updated on May 5, 2014)
Colorado: Hillary vs Paul Ryan: R +3.5%
+8.9% R improvement
Current Republican gain
(Updated on April 25, 2014)
Florida: Hillary vs Bush: D +7.4%
+6.5% D improvement
(Updated on May 5, 2014)
Georgia: Hillary vs Christie: R +2%
+6% D improvement
(Updated August 8 )
Iowa: Hillary vs Christie: D +3.8%
+2% R improvement
(Updated on June 9, 2014)
Kansas: Hillary vs Bush: R +9%
+13% D improvement
(Updated on February 24, 2014)
Kentucky: Hillary vs Christie/Bush: R +4%
+19% D improvement
(Updated on May 18, 2014)
Louisiana: Hillary vs Huckabee: R +5%
+12% D improvement
(Updated on February 18, 2014)
Maine: Hillary vs Christie: D +8%
+7% R improvement
(Updated on November 13)
Michigan: Hillary vs Christie: D +4.8%
+4.7% R improvement
(Updated on April 9, 2014)
Minnesota: Hillary vs Christie: D +6%
+2% R improvement
(Updated on January 22, 2013)
Mississippi: Hillary vs Christie: R +9%
+2.5% D improvement
(Updated on November 19)
Montana: Hillary vs Rand Paul: R +13%
+1% D improvement
(Updated on November 24)
New Hampshire: Hillary vs Huckabee: D +2.1%
+3.5% R improvement
(Updated on May 12, 2014)
New Jersey: Hillary vs Christie: D +10.5%
+7.3% R improvement
(Updated on March 4, 2014)
New Mexico: Hillary vs Susana Martinez: D +14%
+4% D improvement
(Updated on March 27, 2014)
New York: Hillary vs Christie: D +28%
+0.2% R improvement
(Updated on March 4, 2014)
North Carolina: Hillary vs Christie: D +0.9%
+2.9% D improvement
Current Democratic gain
(Updated on May 14, 2014)
Ohio: Hillary vs Christie: D +6.2%
+3.2% D improvement
(Updated on May 15, 2014)
Oregon: Hillary vs Rand Paul/Huckabee: D +12%
Unchanged from 2012
(Updated on May 30, 2014)
Pennsylvania: Hillary vs Christie: D +3.5%
+1.9% R improvement
(Updated on June 5, 2014)
South Carolina: Hillary vs Marco Rubio: R +7%
+3.5% D improvement
(Updated on November 2)
Texas: Hillary vs Huckabee: R +8%
+8% D improvement
(Updated on April 18, 2014)
Virginia: Hillary vs Christie: D +3.22%
+0.6% R improvement
(Updated on March 27, 2014)
West Virginia: Hillary vs Bush: R +14%
+13% D improvement
(Updated on October 1)
Wisconsin: Hillary vs Ryan: D +5.1%
+1.8% R improvement
(Updated on April 25, 2014)
Wyoming: Hillary vs Christie: R +28%
+13% D improvement
(Updated on July 23)
Average all 29 states: Hillary vs Best Republican: D +0.07% (basically toss up)
+3.4% D improvement (from Obama 2012) [projecting a 7.3% victory for Hillary]
That gives us this map right now:
(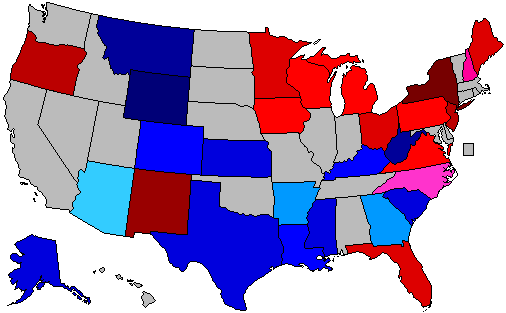 )
)
Red = Democratic lead or trend
Blue = Republican lead or trend
Green = Exact tie or no trend, unchanged from 2012
Grey = No polling yet
Green = toss up
20% shade = 0.1-1% lead
30% shade = 1.1-3% lead
40% shade = 3.1-6% lead
50% shade = 6.1-9% lead
60% shade = 9.1-12% lead
70% shade = 12.1-15% lead
80% shade = 15.1-18% lead
90% shade = Above 18.1% lead
In the count of electoral votes, this means the current situation looks like this:
Hillary: 216 EVs (for a total of 15 states)
Best/Tailormade Republican: 120 EVs (for a total of 14 states)
Toss-up: None
No polling: 202 EVs (for a total of 21 states + D.C.)
Which means that Hillary has captured a rather impressive 64.3% of all EVs awarded thus far, against a disappointing 35.7% EVs for the tailormade Republican. Even as the biggest price by far, California, hasn't been added yet.
This is how the Trendline Map looks so far:
(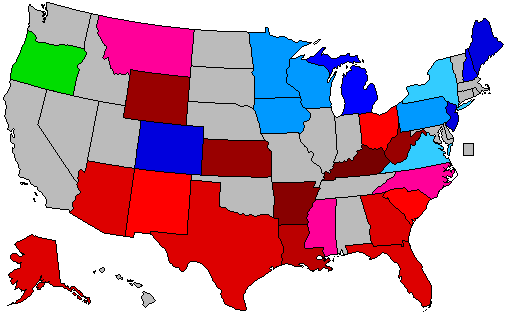 )
)
The states which right now are showing the strongest improvement for the Democratic (Hillary) or the Republican candidate (in 14 out of 29 cases, Christie is that person):
1. Kentucky: D +19%
2. Arkansas: D +17%
3. Kansas: D +13%
4. West Virginia: D +13%
5. Wyoming: D +13%
6. Louisiana: D +12%
7. Colorado: R +8.9%
8. Arizona: D +8%
9. Texas: D +8%
10. New Jersey: R +7.3%
11. Maine: R +7%
12. Alaska: D +7%
13. Florida: D +6.5%
14. Georgia: D +6%
15. Michigan: R +4.7%
All of these changes (in the 15 states above) are (more than) statistically significant.
The whole list of states having been polled till now, going from Democratic stronghold to Republican stronghold:
New York: D +28%
New Mexico: D +14%
Oregon: D +12%
New Jersey: D +10.5%
Maine: D +8%
Florida: D +7.4%
Currently estimated/projected national average: D +7.3%
Ohio: D +6.2%
Minnesota: D +6%
Wisconsin: D +5.1%
Michigan: D +4.8%
Iowa: D +3.8%
Pennsylvania: D +3.5%
Virginia: D +3.2%
New Hampshire: D +2.1%
North Carolina: D +0.9%
Arizona: R +1%
Georgia: R +2%
Arkansas: R +3%
Colorado: R +3.5%
Kentucky: R +4%
Louisiana: R +5%
Alaska: R +7%
South Carolina: R +7%
Texas: R +8%
Mississippi: R +9%
Kansas: R +9%
Montana: R +13%
West Virginia: R +14%
Wyoming: R +28%
Here are the current stats on the best-tailored Republican candidates in all states polled so far:
1. Chris Christie favoured in 14 of 29 states (for 175 EVs)
2. Mike Huckabee in 5 states (Texas (!), Louisiana (!), Oregon (shared), Arkansas & New Hampshire (!) - for 63 EVs)
3. Jeb Bush favoured in 6 states (Florida, Arizona, Kentucky (!!) (shared), Kansas, West Virginia & Alaska - for 62 EVs)
4. Paul Ryan favoured in 2 states (Wisconsin & Colorado - for 19 EVs)
5. Rand Paul favoured in 2 states (Oregon (shared) & Montana - for 10 EVs)
6. Marco Rubio favoured in 1 state (South Carolina - for 9 EVs)
7. Susana Martinez favoured in 1 state (New Mexico - for 5 EVs)
All in all; North Carolina, Florida, Ohio and New Mexico being amazing news for Hillary (a red state going blue or blue states going even bluer), while Colorado is equally bad news for her (a blue state going red). Interestingly though, four out of those five states are swing/battleground/purple states. Meaning that we're not seeing a further polarization of the electorate in most states - at least not this far.
Current update as of June 9.
The total number of state polls included in the lists below has thus now reached 125.
So here they are - all the 2016 poll averages for each state so far - 29 states having been polled to date - and how far off they are compared to the actual 2012 outcomes. I'm only including the Republican candidate with the best statewide polling.
Alaska: Hillary vs Jeb Bush: R +7%
+7% D improvement
(Updated on May 14, 2014)
Arizona: Hillary vs Bush: R +1%
+8% D improvement
(Updated on March 6, 2014)
Arkansas: Hillary vs Mike Huckabee: R +3%
+17% D improvement
(Updated on May 5, 2014)
Colorado: Hillary vs Paul Ryan: R +3.5%
+8.9% R improvement
Current Republican gain
(Updated on April 25, 2014)
Florida: Hillary vs Bush: D +7.4%
+6.5% D improvement
(Updated on May 5, 2014)
Georgia: Hillary vs Christie: R +2%
+6% D improvement
(Updated August 8 )
Iowa: Hillary vs Christie: D +3.8%
+2% R improvement
(Updated on June 9, 2014)
Kansas: Hillary vs Bush: R +9%
+13% D improvement
(Updated on February 24, 2014)
Kentucky: Hillary vs Christie/Bush: R +4%
+19% D improvement
(Updated on May 18, 2014)
Louisiana: Hillary vs Huckabee: R +5%
+12% D improvement
(Updated on February 18, 2014)
Maine: Hillary vs Christie: D +8%
+7% R improvement
(Updated on November 13)
Michigan: Hillary vs Christie: D +4.8%
+4.7% R improvement
(Updated on April 9, 2014)
Minnesota: Hillary vs Christie: D +6%
+2% R improvement
(Updated on January 22, 2013)
Mississippi: Hillary vs Christie: R +9%
+2.5% D improvement
(Updated on November 19)
Montana: Hillary vs Rand Paul: R +13%
+1% D improvement
(Updated on November 24)
New Hampshire: Hillary vs Huckabee: D +2.1%
+3.5% R improvement
(Updated on May 12, 2014)
New Jersey: Hillary vs Christie: D +10.5%
+7.3% R improvement
(Updated on March 4, 2014)
New Mexico: Hillary vs Susana Martinez: D +14%
+4% D improvement
(Updated on March 27, 2014)
New York: Hillary vs Christie: D +28%
+0.2% R improvement
(Updated on March 4, 2014)
North Carolina: Hillary vs Christie: D +0.9%
+2.9% D improvement
Current Democratic gain
(Updated on May 14, 2014)
Ohio: Hillary vs Christie: D +6.2%
+3.2% D improvement
(Updated on May 15, 2014)
Oregon: Hillary vs Rand Paul/Huckabee: D +12%
Unchanged from 2012
(Updated on May 30, 2014)
Pennsylvania: Hillary vs Christie: D +3.5%
+1.9% R improvement
(Updated on June 5, 2014)
South Carolina: Hillary vs Marco Rubio: R +7%
+3.5% D improvement
(Updated on November 2)
Texas: Hillary vs Huckabee: R +8%
+8% D improvement
(Updated on April 18, 2014)
Virginia: Hillary vs Christie: D +3.22%
+0.6% R improvement
(Updated on March 27, 2014)
West Virginia: Hillary vs Bush: R +14%
+13% D improvement
(Updated on October 1)
Wisconsin: Hillary vs Ryan: D +5.1%
+1.8% R improvement
(Updated on April 25, 2014)
Wyoming: Hillary vs Christie: R +28%
+13% D improvement
(Updated on July 23)
Average all 29 states: Hillary vs Best Republican: D +0.07% (basically toss up)
+3.4% D improvement (from Obama 2012) [projecting a 7.3% victory for Hillary]
That gives us this map right now:
(
Red = Democratic lead or trend
Blue = Republican lead or trend
Green = Exact tie or no trend, unchanged from 2012
Grey = No polling yet
Green = toss up
20% shade = 0.1-1% lead
30% shade = 1.1-3% lead
40% shade = 3.1-6% lead
50% shade = 6.1-9% lead
60% shade = 9.1-12% lead
70% shade = 12.1-15% lead
80% shade = 15.1-18% lead
90% shade = Above 18.1% lead
In the count of electoral votes, this means the current situation looks like this:
Hillary: 216 EVs (for a total of 15 states)
Best/Tailormade Republican: 120 EVs (for a total of 14 states)
Toss-up: None
No polling: 202 EVs (for a total of 21 states + D.C.)
Which means that Hillary has captured a rather impressive 64.3% of all EVs awarded thus far, against a disappointing 35.7% EVs for the tailormade Republican. Even as the biggest price by far, California, hasn't been added yet.
This is how the Trendline Map looks so far:
(
The states which right now are showing the strongest improvement for the Democratic (Hillary) or the Republican candidate (in 14 out of 29 cases, Christie is that person):
1. Kentucky: D +19%
2. Arkansas: D +17%
3. Kansas: D +13%
4. West Virginia: D +13%
5. Wyoming: D +13%
6. Louisiana: D +12%
7. Colorado: R +8.9%
8. Arizona: D +8%
9. Texas: D +8%
10. New Jersey: R +7.3%
11. Maine: R +7%
12. Alaska: D +7%
13. Florida: D +6.5%
14. Georgia: D +6%
15. Michigan: R +4.7%
All of these changes (in the 15 states above) are (more than) statistically significant.
The whole list of states having been polled till now, going from Democratic stronghold to Republican stronghold:
New York: D +28%
New Mexico: D +14%
Oregon: D +12%
New Jersey: D +10.5%
Maine: D +8%
Florida: D +7.4%
Currently estimated/projected national average: D +7.3%
Ohio: D +6.2%
Minnesota: D +6%
Wisconsin: D +5.1%
Michigan: D +4.8%
Iowa: D +3.8%
Pennsylvania: D +3.5%
Virginia: D +3.2%
New Hampshire: D +2.1%
North Carolina: D +0.9%
Arizona: R +1%
Georgia: R +2%
Arkansas: R +3%
Colorado: R +3.5%
Kentucky: R +4%
Louisiana: R +5%
Alaska: R +7%
South Carolina: R +7%
Texas: R +8%
Mississippi: R +9%
Kansas: R +9%
Montana: R +13%
West Virginia: R +14%
Wyoming: R +28%
Here are the current stats on the best-tailored Republican candidates in all states polled so far:
1. Chris Christie favoured in 14 of 29 states (for 175 EVs)
2. Mike Huckabee in 5 states (Texas (!), Louisiana (!), Oregon (shared), Arkansas & New Hampshire (!) - for 63 EVs)
3. Jeb Bush favoured in 6 states (Florida, Arizona, Kentucky (!!) (shared), Kansas, West Virginia & Alaska - for 62 EVs)
4. Paul Ryan favoured in 2 states (Wisconsin & Colorado - for 19 EVs)
5. Rand Paul favoured in 2 states (Oregon (shared) & Montana - for 10 EVs)
6. Marco Rubio favoured in 1 state (South Carolina - for 9 EVs)
7. Susana Martinez favoured in 1 state (New Mexico - for 5 EVs)
All in all; North Carolina, Florida, Ohio and New Mexico being amazing news for Hillary (a red state going blue or blue states going even bluer), while Colorado is equally bad news for her (a blue state going red). Interestingly though, four out of those five states are swing/battleground/purple states. Meaning that we're not seeing a further polarization of the electorate in most states - at least not this far.
Current update as of June 9.
Title: Re: 2016 Official Polling Map Thread
Post by: pbrower2a on June 09, 2014, 04:56:06 PM
Loras College, Iowa.
Clinton 48, Christie 39
Clinton 52, Paul 38
Clinton 49, Bush 38
Clinton 50, Ryan 39
Clinton 50, Huckabee 40
http://www.loras.edu/LorasCollege/files/34/34449663-47f1-438b-8d3d-69507e9f94f6.pdf
GOP disaster. Barack Obama won Iowa by 9% in 2008, and just look at the national results that year. A Republican nominee wins nationwide if he wins Iowa and can still win without it (the state is about D+3), but without Iowa being close a Republican loses nationwide.
Ohio is roughly the opposite.
Hillary Clinton vs. Jeb Bush
()
Hillary Clinton vs. Chris Christie
()
Hillary Clinton vs. Mike Huckabee
(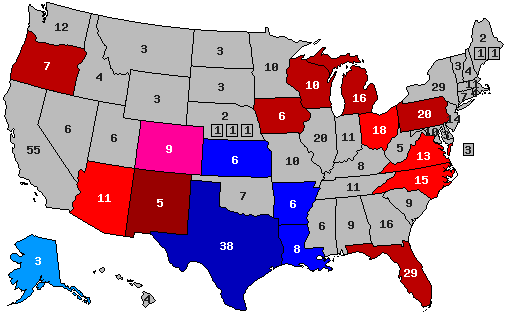 )
)
Hillary Clinton vs. Rand Paul
(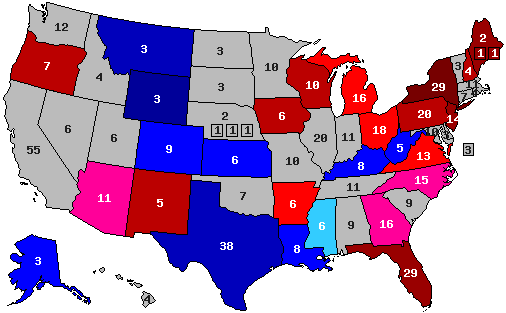 )
)
blue, Republican -- red, Democratic
30% -- lead with 40-49% but a margin of 3% or less
40% -- lead with 40-49% but a margin of 4% or more
60% -- lead with 50-54%
70% -- lead with 55-59%
90% -- lead with 60% or more
Clinton 48, Christie 39
Clinton 52, Paul 38
Clinton 49, Bush 38
Clinton 50, Ryan 39
Clinton 50, Huckabee 40
http://www.loras.edu/LorasCollege/files/34/34449663-47f1-438b-8d3d-69507e9f94f6.pdf
GOP disaster. Barack Obama won Iowa by 9% in 2008, and just look at the national results that year. A Republican nominee wins nationwide if he wins Iowa and can still win without it (the state is about D+3), but without Iowa being close a Republican loses nationwide.
Ohio is roughly the opposite.
Hillary Clinton vs. Jeb Bush
(
Hillary Clinton vs. Chris Christie
(
Hillary Clinton vs. Mike Huckabee
(
Hillary Clinton vs. Rand Paul
(
blue, Republican -- red, Democratic
30% -- lead with 40-49% but a margin of 3% or less
40% -- lead with 40-49% but a margin of 4% or more
60% -- lead with 50-54%
70% -- lead with 55-59%
90% -- lead with 60% or more
Title: Re: 2016 Official Polling Map Thread
Post by: eric82oslo on June 10, 2014, 06:22:19 PM
PPP are about to poll Minnesota and North Carolina. :)
Title: Re: 2016 Official Polling Map Thread
Post by: eric82oslo on June 11, 2014, 07:59:40 AM
With Survey USA's poll of Florida released today, the number of Florida polls has reached 9, of which 8 have included a Bush-Clinton match up. It's not exactly great news for Jeb, however he improves ever so slightly, from being down -7.4% to now trailing by -7.25%. No other Republican was tested by the polling firm unfortunately. The two most surprising cross tab numbers: Cuban Floridians actually supporting Hillary rather than Jeb, and Asian Floridians being undecided at 50/50.
UPDATE: One day later and PPP has released its own Florida match-up numbers. Republican candidates did surprisingly well in this latest poll, in particular Jeb Bush, who only trailed Hillary by a single point. The other candidates trailing with between 4-11%. That means that Hillary's lead over Bush has been further decreased to "only" 6.6%.
The total number of state polls included in the lists below has thus now reached 127.
So here they are - all the 2016 poll averages for each state so far - 29 states having been polled to date - and how far off they are compared to the actual 2012 outcomes. I'm only including the Republican candidate with the best statewide polling.
Alaska: Hillary vs Jeb Bush: R +7%
+7% D improvement
(Updated on May 14, 2014)
Arizona: Hillary vs Bush: R +1%
+8% D improvement
(Updated on March 6, 2014)
Arkansas: Hillary vs Mike Huckabee: R +3%
+17% D improvement
(Updated on May 5, 2014)
Colorado: Hillary vs Paul Ryan: R +3.5%
+8.9% R improvement
Current Republican gain
(Updated on April 25, 2014)
Florida: Hillary vs Bush: D +6.6%
+5.7% D improvement
(Updated on June 12, 2014)
Georgia: Hillary vs Christie: R +2%
+6% D improvement
(Updated August 8 )
Iowa: Hillary vs Christie: D +3.8%
+2% R improvement
(Updated on June 9, 2014)
Kansas: Hillary vs Bush: R +9%
+13% D improvement
(Updated on February 24, 2014)
Kentucky: Hillary vs Christie/Bush: R +4%
+19% D improvement
(Updated on May 18, 2014)
Louisiana: Hillary vs Huckabee: R +5%
+12% D improvement
(Updated on February 18, 2014)
Maine: Hillary vs Christie: D +8%
+7% R improvement
(Updated on November 13)
Michigan: Hillary vs Christie: D +4.8%
+4.7% R improvement
(Updated on April 9, 2014)
Minnesota: Hillary vs Christie: D +6%
+2% R improvement
(Updated on January 22, 2013)
Mississippi: Hillary vs Christie: R +9%
+2.5% D improvement
(Updated on November 19)
Montana: Hillary vs Rand Paul: R +13%
+1% D improvement
(Updated on November 24)
New Hampshire: Hillary vs Huckabee: D +2.1%
+3.5% R improvement
(Updated on May 12, 2014)
New Jersey: Hillary vs Christie: D +10.5%
+7.3% R improvement
(Updated on March 4, 2014)
New Mexico: Hillary vs Susana Martinez: D +14%
+4% D improvement
(Updated on March 27, 2014)
New York: Hillary vs Christie: D +28%
+0.2% R improvement
(Updated on March 4, 2014)
North Carolina: Hillary vs Christie: D +0.9%
+2.9% D improvement
Current Democratic gain
(Updated on May 14, 2014)
Ohio: Hillary vs Christie: D +6.2%
+3.2% D improvement
(Updated on May 15, 2014)
Oregon: Hillary vs Rand Paul/Huckabee: D +12%
Unchanged from 2012
(Updated on May 30, 2014)
Pennsylvania: Hillary vs Christie: D +3.5%
+1.9% R improvement
(Updated on June 5, 2014)
South Carolina: Hillary vs Marco Rubio: R +7%
+3.5% D improvement
(Updated on November 2)
Texas: Hillary vs Huckabee: R +8%
+8% D improvement
(Updated on April 18, 2014)
Virginia: Hillary vs Christie: D +3.22%
+0.6% R improvement
(Updated on March 27, 2014)
West Virginia: Hillary vs Bush: R +14%
+13% D improvement
(Updated on October 1)
Wisconsin: Hillary vs Ryan: D +5.1%
+1.8% R improvement
(Updated on April 25, 2014)
Wyoming: Hillary vs Christie: R +28%
+13% D improvement
(Updated on July 23)
Average all 29 states: Hillary vs Best Republican: D +0.03% (basically toss up)
+3.4% D improvement (from Obama 2012) [projecting a 7.3% victory for Hillary]
That gives us this map right now:
()
Red = Democratic lead or trend
Blue = Republican lead or trend
Green = Exact tie or no trend, unchanged from 2012
Grey = No polling yet
Green = toss up
20% shade = 0.1-1% lead
30% shade = 1.1-3% lead
40% shade = 3.1-6% lead
50% shade = 6.1-9% lead
60% shade = 9.1-12% lead
70% shade = 12.1-15% lead
80% shade = 15.1-18% lead
90% shade = Above 18.1% lead
In the count of electoral votes, this means the current situation looks like this:
Hillary: 216 EVs (for a total of 15 states)
Best/Tailormade Republican: 120 EVs (for a total of 14 states)
Toss-up: None
No polling: 202 EVs (for a total of 21 states + D.C.)
Which means that Hillary has captured a rather impressive 64.3% of all EVs awarded thus far, against a disappointing 35.7% EVs for the tailormade Republican. Even as the biggest price by far, California, hasn't been added yet.
This is how the Trendline Map looks so far:
(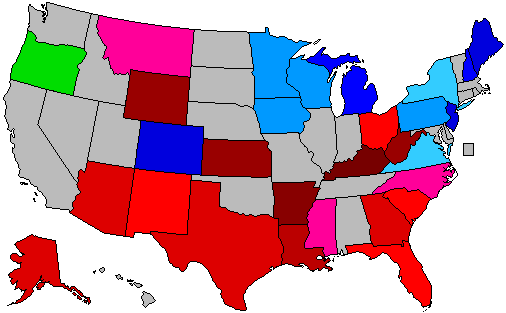 )
)
The states which right now are showing the strongest improvement for the Democratic (Hillary) or the Republican candidate (in 14 out of 29 cases, Christie is that person):
1. Kentucky: D +19%
2. Arkansas: D +17%
3. Kansas: D +13%
4. West Virginia: D +13%
5. Wyoming: D +13%
6. Louisiana: D +12%
7. Colorado: R +8.9%
8. Arizona: D +8%
9. Texas: D +8%
10. New Jersey: R +7.3%
11. Maine: R +7%
12. Alaska: D +7%
13. Georgia: D +6%
14. Florida: D +5.7%
15. Michigan: R +4.7%
All of these changes (in the 15 states above) are (more than) statistically significant.
The whole list of states having been polled till now, going from Democratic stronghold to Republican stronghold:
New York: D +28%
New Mexico: D +14%
Oregon: D +12%
New Jersey: D +10.5%
Maine: D +8%
Currently estimated/projected national average: D +7.3%
Florida: D +6.6%
Ohio: D +6.2%
Minnesota: D +6%
Wisconsin: D +5.1%
Michigan: D +4.8%
Iowa: D +3.8%
Pennsylvania: D +3.5%
Virginia: D +3.2%
New Hampshire: D +2.1%
North Carolina: D +0.9%
Arizona: R +1%
Georgia: R +2%
Arkansas: R +3%
Colorado: R +3.5%
Kentucky: R +4%
Louisiana: R +5%
Alaska: R +7%
South Carolina: R +7%
Texas: R +8%
Mississippi: R +9%
Kansas: R +9%
Montana: R +13%
West Virginia: R +14%
Wyoming: R +28%
Here are the current stats on the best-tailored Republican candidates in all states polled so far:
1. Chris Christie favoured in 14 of 29 states (for 175 EVs)
2. Mike Huckabee in 5 states (Texas (!), Louisiana (!), Oregon (shared), Arkansas & New Hampshire (!) - for 63 EVs)
3. Jeb Bush favoured in 6 states (Florida, Arizona, Kentucky (!!) (shared), Kansas, West Virginia & Alaska - for 62 EVs)
4. Paul Ryan favoured in 2 states (Wisconsin & Colorado - for 19 EVs)
5. Rand Paul favoured in 2 states (Oregon (shared) & Montana - for 10 EVs)
6. Marco Rubio favoured in 1 state (South Carolina - for 9 EVs)
7. Susana Martinez favoured in 1 state (New Mexico - for 5 EVs)
All in all; North Carolina, Florida, Ohio and New Mexico being amazing news for Hillary (a red state going blue or blue states going even bluer), while Colorado is equally bad news for her (a blue state going red). Interestingly though, four out of those five states are swing/battleground/purple states. Meaning that we're not seeing a further polarization of the electorate in most states - at least not this far.
Current update as of June 12.
UPDATE: One day later and PPP has released its own Florida match-up numbers. Republican candidates did surprisingly well in this latest poll, in particular Jeb Bush, who only trailed Hillary by a single point. The other candidates trailing with between 4-11%. That means that Hillary's lead over Bush has been further decreased to "only" 6.6%.
The total number of state polls included in the lists below has thus now reached 127.
So here they are - all the 2016 poll averages for each state so far - 29 states having been polled to date - and how far off they are compared to the actual 2012 outcomes. I'm only including the Republican candidate with the best statewide polling.
Alaska: Hillary vs Jeb Bush: R +7%
+7% D improvement
(Updated on May 14, 2014)
Arizona: Hillary vs Bush: R +1%
+8% D improvement
(Updated on March 6, 2014)
Arkansas: Hillary vs Mike Huckabee: R +3%
+17% D improvement
(Updated on May 5, 2014)
Colorado: Hillary vs Paul Ryan: R +3.5%
+8.9% R improvement
Current Republican gain
(Updated on April 25, 2014)
Florida: Hillary vs Bush: D +6.6%
+5.7% D improvement
(Updated on June 12, 2014)
Georgia: Hillary vs Christie: R +2%
+6% D improvement
(Updated August 8 )
Iowa: Hillary vs Christie: D +3.8%
+2% R improvement
(Updated on June 9, 2014)
Kansas: Hillary vs Bush: R +9%
+13% D improvement
(Updated on February 24, 2014)
Kentucky: Hillary vs Christie/Bush: R +4%
+19% D improvement
(Updated on May 18, 2014)
Louisiana: Hillary vs Huckabee: R +5%
+12% D improvement
(Updated on February 18, 2014)
Maine: Hillary vs Christie: D +8%
+7% R improvement
(Updated on November 13)
Michigan: Hillary vs Christie: D +4.8%
+4.7% R improvement
(Updated on April 9, 2014)
Minnesota: Hillary vs Christie: D +6%
+2% R improvement
(Updated on January 22, 2013)
Mississippi: Hillary vs Christie: R +9%
+2.5% D improvement
(Updated on November 19)
Montana: Hillary vs Rand Paul: R +13%
+1% D improvement
(Updated on November 24)
New Hampshire: Hillary vs Huckabee: D +2.1%
+3.5% R improvement
(Updated on May 12, 2014)
New Jersey: Hillary vs Christie: D +10.5%
+7.3% R improvement
(Updated on March 4, 2014)
New Mexico: Hillary vs Susana Martinez: D +14%
+4% D improvement
(Updated on March 27, 2014)
New York: Hillary vs Christie: D +28%
+0.2% R improvement
(Updated on March 4, 2014)
North Carolina: Hillary vs Christie: D +0.9%
+2.9% D improvement
Current Democratic gain
(Updated on May 14, 2014)
Ohio: Hillary vs Christie: D +6.2%
+3.2% D improvement
(Updated on May 15, 2014)
Oregon: Hillary vs Rand Paul/Huckabee: D +12%
Unchanged from 2012
(Updated on May 30, 2014)
Pennsylvania: Hillary vs Christie: D +3.5%
+1.9% R improvement
(Updated on June 5, 2014)
South Carolina: Hillary vs Marco Rubio: R +7%
+3.5% D improvement
(Updated on November 2)
Texas: Hillary vs Huckabee: R +8%
+8% D improvement
(Updated on April 18, 2014)
Virginia: Hillary vs Christie: D +3.22%
+0.6% R improvement
(Updated on March 27, 2014)
West Virginia: Hillary vs Bush: R +14%
+13% D improvement
(Updated on October 1)
Wisconsin: Hillary vs Ryan: D +5.1%
+1.8% R improvement
(Updated on April 25, 2014)
Wyoming: Hillary vs Christie: R +28%
+13% D improvement
(Updated on July 23)
Average all 29 states: Hillary vs Best Republican: D +0.03% (basically toss up)
+3.4% D improvement (from Obama 2012) [projecting a 7.3% victory for Hillary]
That gives us this map right now:
(
Red = Democratic lead or trend
Blue = Republican lead or trend
Green = Exact tie or no trend, unchanged from 2012
Grey = No polling yet
Green = toss up
20% shade = 0.1-1% lead
30% shade = 1.1-3% lead
40% shade = 3.1-6% lead
50% shade = 6.1-9% lead
60% shade = 9.1-12% lead
70% shade = 12.1-15% lead
80% shade = 15.1-18% lead
90% shade = Above 18.1% lead
In the count of electoral votes, this means the current situation looks like this:
Hillary: 216 EVs (for a total of 15 states)
Best/Tailormade Republican: 120 EVs (for a total of 14 states)
Toss-up: None
No polling: 202 EVs (for a total of 21 states + D.C.)
Which means that Hillary has captured a rather impressive 64.3% of all EVs awarded thus far, against a disappointing 35.7% EVs for the tailormade Republican. Even as the biggest price by far, California, hasn't been added yet.
This is how the Trendline Map looks so far:
(
The states which right now are showing the strongest improvement for the Democratic (Hillary) or the Republican candidate (in 14 out of 29 cases, Christie is that person):
1. Kentucky: D +19%
2. Arkansas: D +17%
3. Kansas: D +13%
4. West Virginia: D +13%
5. Wyoming: D +13%
6. Louisiana: D +12%
7. Colorado: R +8.9%
8. Arizona: D +8%
9. Texas: D +8%
10. New Jersey: R +7.3%
11. Maine: R +7%
12. Alaska: D +7%
13. Georgia: D +6%
14. Florida: D +5.7%
15. Michigan: R +4.7%
All of these changes (in the 15 states above) are (more than) statistically significant.
The whole list of states having been polled till now, going from Democratic stronghold to Republican stronghold:
New York: D +28%
New Mexico: D +14%
Oregon: D +12%
New Jersey: D +10.5%
Maine: D +8%
Currently estimated/projected national average: D +7.3%
Florida: D +6.6%
Ohio: D +6.2%
Minnesota: D +6%
Wisconsin: D +5.1%
Michigan: D +4.8%
Iowa: D +3.8%
Pennsylvania: D +3.5%
Virginia: D +3.2%
New Hampshire: D +2.1%
North Carolina: D +0.9%
Arizona: R +1%
Georgia: R +2%
Arkansas: R +3%
Colorado: R +3.5%
Kentucky: R +4%
Louisiana: R +5%
Alaska: R +7%
South Carolina: R +7%
Texas: R +8%
Mississippi: R +9%
Kansas: R +9%
Montana: R +13%
West Virginia: R +14%
Wyoming: R +28%
Here are the current stats on the best-tailored Republican candidates in all states polled so far:
1. Chris Christie favoured in 14 of 29 states (for 175 EVs)
2. Mike Huckabee in 5 states (Texas (!), Louisiana (!), Oregon (shared), Arkansas & New Hampshire (!) - for 63 EVs)
3. Jeb Bush favoured in 6 states (Florida, Arizona, Kentucky (!!) (shared), Kansas, West Virginia & Alaska - for 62 EVs)
4. Paul Ryan favoured in 2 states (Wisconsin & Colorado - for 19 EVs)
5. Rand Paul favoured in 2 states (Oregon (shared) & Montana - for 10 EVs)
6. Marco Rubio favoured in 1 state (South Carolina - for 9 EVs)
7. Susana Martinez favoured in 1 state (New Mexico - for 5 EVs)
All in all; North Carolina, Florida, Ohio and New Mexico being amazing news for Hillary (a red state going blue or blue states going even bluer), while Colorado is equally bad news for her (a blue state going red). Interestingly though, four out of those five states are swing/battleground/purple states. Meaning that we're not seeing a further polarization of the electorate in most states - at least not this far.
Current update as of June 12.
Title: Re: 2016 Official Polling Map Thread
Post by: pbrower2a on June 12, 2014, 05:05:17 PM
PPP, Florida. Survey USA has Hillary up by 6 against Bush, and averaging that with PPP results gets the same result as the PPP poll. I average polls made in the same week.
Clinton- 46%
Bush- 45%
Clinton- 48%
Rubio- 44%
Clinton- 48%
Paul- 42%
Clinton- 48%
Huckabee- 41%
Clinton- 46%
Christie- 38%
Clinton- 50%
Cruz- 39%
This poll found responders split slightly for Romney in how they voted in 2012. Barack Obama barely won the state. Jeb comes close, but others are behind by at least the margin of error.
Hillary Clinton vs. Jeb Bush
(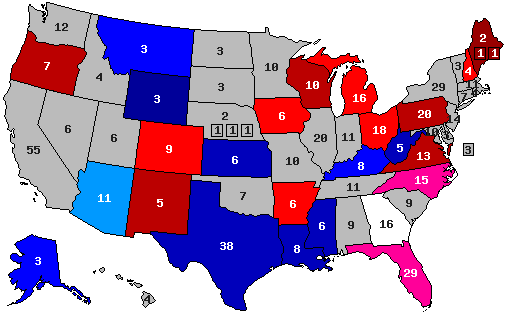 )
)
Hillary Clinton vs. Chris Christie
( )
)
Hillary Clinton vs. Mike Huckabee
(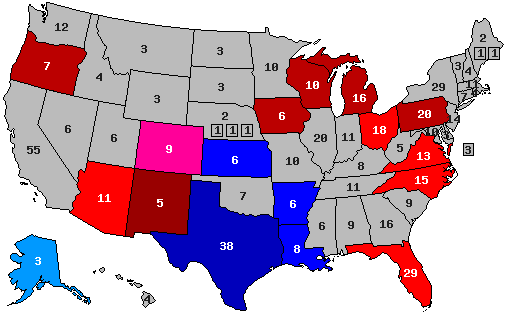 )
)
Hillary Clinton vs. Rand Paul
(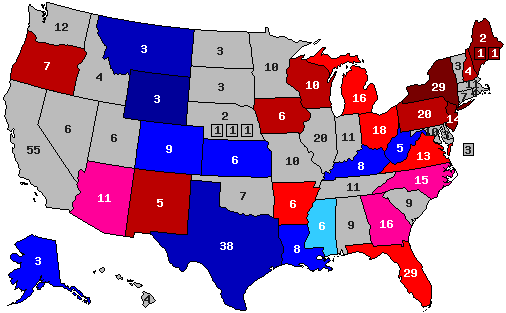 )
)
blue, Republican -- red, Democratic
30% -- lead with 40-49% but a margin of 3% or less
40% -- lead with 40-49% but a margin of 4% or more
60% -- lead with 50-54%
70% -- lead with 55-59%
90% -- lead with 60% or more
Clinton- 46%
Bush- 45%
Clinton- 48%
Rubio- 44%
Clinton- 48%
Paul- 42%
Clinton- 48%
Huckabee- 41%
Clinton- 46%
Christie- 38%
Clinton- 50%
Cruz- 39%
This poll found responders split slightly for Romney in how they voted in 2012. Barack Obama barely won the state. Jeb comes close, but others are behind by at least the margin of error.
Hillary Clinton vs. Jeb Bush
(
Hillary Clinton vs. Chris Christie
(
Hillary Clinton vs. Mike Huckabee
(
Hillary Clinton vs. Rand Paul
(
blue, Republican -- red, Democratic
30% -- lead with 40-49% but a margin of 3% or less
40% -- lead with 40-49% but a margin of 4% or more
60% -- lead with 50-54%
70% -- lead with 55-59%
90% -- lead with 60% or more
Title: Re: 2016 Official Polling Map Thread
Post by: eric82oslo on June 16, 2014, 08:06:40 AM
The third Florida poll in less than a week has just been released by St. Leo University. Which means that the number of Florida polls has reached 11, out of which 10 include a Jeb-Hillary match up. And it's dramatic news for Hillary, as this is the very first Florida poll where she actually trails Jeb! Within just one week, her average lead in Florida has shrunk from an impressive +7.4% to now only leading by +5.7%. Could her unimpressive book tour rollout have something to due with it? Or is it simply independent voters rallying around Jeb due to his many moderate stances?
The total number of state polls included in the lists below has thus now reached 128.
So here they are - all the 2016 poll averages for each state so far - 29 states having been polled to date - and how far off they are compared to the actual 2012 outcomes. I'm only including the Republican candidate with the best statewide polling.
Alaska: Hillary vs Jeb Bush: R +7%
+7% D improvement
(Updated on May 14, 2014)
Arizona: Hillary vs Bush: R +1%
+8% D improvement
(Updated on March 6, 2014)
Arkansas: Hillary vs Mike Huckabee: R +3%
+17% D improvement
(Updated on May 5, 2014)
Colorado: Hillary vs Paul Ryan: R +3.5%
+8.9% R improvement
Current Republican gain
(Updated on April 25, 2014)
Florida: Hillary vs Bush: D +5.7%
+4.8% D improvement
(Updated on June 16, 2014)
Georgia: Hillary vs Christie: R +2%
+6% D improvement
(Updated August 8 )
Iowa: Hillary vs Christie: D +3.8%
+2% R improvement
(Updated on June 9, 2014)
Kansas: Hillary vs Bush: R +9%
+13% D improvement
(Updated on February 24, 2014)
Kentucky: Hillary vs Christie/Bush: R +4%
+19% D improvement
(Updated on May 18, 2014)
Louisiana: Hillary vs Huckabee: R +5%
+12% D improvement
(Updated on February 18, 2014)
Maine: Hillary vs Christie: D +8%
+7% R improvement
(Updated on November 13)
Michigan: Hillary vs Christie: D +4.8%
+4.7% R improvement
(Updated on April 9, 2014)
Minnesota: Hillary vs Christie: D +6%
+2% R improvement
(Updated on January 22, 2013)
Mississippi: Hillary vs Christie: R +9%
+2.5% D improvement
(Updated on November 19)
Montana: Hillary vs Rand Paul: R +13%
+1% D improvement
(Updated on November 24)
New Hampshire: Hillary vs Huckabee: D +2.1%
+3.5% R improvement
(Updated on May 12, 2014)
New Jersey: Hillary vs Christie: D +10.5%
+7.3% R improvement
(Updated on March 4, 2014)
New Mexico: Hillary vs Susana Martinez: D +14%
+4% D improvement
(Updated on March 27, 2014)
New York: Hillary vs Christie: D +28%
+0.2% R improvement
(Updated on March 4, 2014)
North Carolina: Hillary vs Christie: D +0.9%
+2.9% D improvement
Current Democratic gain
(Updated on May 14, 2014)
Ohio: Hillary vs Christie: D +6.2%
+3.2% D improvement
(Updated on May 15, 2014)
Oregon: Hillary vs Rand Paul/Huckabee: D +12%
Unchanged from 2012
(Updated on May 30, 2014)
Pennsylvania: Hillary vs Christie: D +3.5%
+1.9% R improvement
(Updated on June 5, 2014)
South Carolina: Hillary vs Marco Rubio: R +7%
+3.5% D improvement
(Updated on November 2)
Texas: Hillary vs Huckabee: R +8%
+8% D improvement
(Updated on April 18, 2014)
Virginia: Hillary vs Christie: D +3.22%
+0.6% R improvement
(Updated on March 27, 2014)
West Virginia: Hillary vs Bush: R +14%
+13% D improvement
(Updated on October 1)
Wisconsin: Hillary vs Ryan: D +5.1%
+1.8% R improvement
(Updated on April 25, 2014)
Wyoming: Hillary vs Christie: R +28%
+13% D improvement
(Updated on July 23)
Average all 29 states: Hillary vs Best Republican: D/R +0.00% - a true toss up!
+3.4% D improvement (from Obama 2012) [projecting a 7.2% victory for Hillary]
That gives us this map right now:
(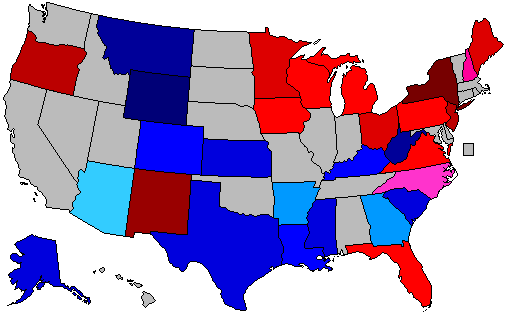 )
)
Red = Democratic lead or trend
Blue = Republican lead or trend
Green = Exact tie or no trend, unchanged from 2012
Grey = No polling yet
Green = toss up
20% shade = 0.1-1% lead
30% shade = 1.1-3% lead
40% shade = 3.1-6% lead
50% shade = 6.1-9% lead
60% shade = 9.1-12% lead
70% shade = 12.1-15% lead
80% shade = 15.1-18% lead
90% shade = Above 18.1% lead
In the count of electoral votes, this means the current situation looks like this:
Hillary: 216 EVs (for a total of 15 states)
Best/Tailormade Republican: 120 EVs (for a total of 14 states)
Toss-up: None
No polling: 202 EVs (for a total of 21 states + D.C.)
Which means that Hillary has captured a rather impressive 64.3% of all EVs awarded thus far, against a disappointing 35.7% EVs for the tailormade Republican. Even as the biggest price by far, California, hasn't been added yet.
This is how the Trendline Map looks so far:
()
The states which right now are showing the strongest improvement for the Democratic (Hillary) or the Republican candidate (in 14 out of 29 cases, Christie is that person):
1. Kentucky: D +19%
2. Arkansas: D +17%
3. Kansas: D +13%
4. West Virginia: D +13%
5. Wyoming: D +13%
6. Louisiana: D +12%
7. Colorado: R +8.9%
8. Arizona: D +8%
9. Texas: D +8%
10. New Jersey: R +7.3%
11. Maine: R +7%
12. Alaska: D +7%
13. Georgia: D +6%
14. Florida: D +4.8%
15. Michigan: R +4.7%
All of these changes (in the 15 states above) are (more than) statistically significant.
The whole list of states having been polled till now, going from Democratic stronghold to Republican stronghold:
New York: D +28%
New Mexico: D +14%
Oregon: D +12%
New Jersey: D +10.5%
Maine: D +8%
Currently estimated/projected national average: D +7.2%
Ohio: D +6.2%
Minnesota: D +6%
Florida: D +5.7%
Wisconsin: D +5.1%
Michigan: D +4.8%
Iowa: D +3.8%
Pennsylvania: D +3.5%
Virginia: D +3.2%
New Hampshire: D +2.1%
North Carolina: D +0.9%
Arizona: R +1%
Georgia: R +2%
Arkansas: R +3%
Colorado: R +3.5%
Kentucky: R +4%
Louisiana: R +5%
Alaska: R +7%
South Carolina: R +7%
Texas: R +8%
Mississippi: R +9%
Kansas: R +9%
Montana: R +13%
West Virginia: R +14%
Wyoming: R +28%
Here are the current stats on the best-tailored Republican candidates in all states polled so far:
1. Chris Christie favoured in 14 of 29 states (for 175 EVs)
2. Mike Huckabee in 5 states (Texas (!), Louisiana (!), Oregon (shared), Arkansas & New Hampshire (!) - for 63 EVs)
3. Jeb Bush favoured in 6 states (Florida, Arizona, Kentucky (!!) (shared), Kansas, West Virginia & Alaska - for 62 EVs)
4. Paul Ryan favoured in 2 states (Wisconsin & Colorado - for 19 EVs)
5. Rand Paul favoured in 2 states (Oregon (shared) & Montana - for 10 EVs)
6. Marco Rubio favoured in 1 state (South Carolina - for 9 EVs)
7. Susana Martinez favoured in 1 state (New Mexico - for 5 EVs)
All in all; North Carolina, Florida, Ohio and New Mexico being amazing news for Hillary (a red state going blue or blue states going even bluer), while Colorado is equally bad news for her (a blue state going red). Interestingly though, four out of those five states are swing/battleground/purple states. Meaning that we're not seeing a further polarization of the electorate in most states - at least not this far.
Current update as of June 16.
The total number of state polls included in the lists below has thus now reached 128.
So here they are - all the 2016 poll averages for each state so far - 29 states having been polled to date - and how far off they are compared to the actual 2012 outcomes. I'm only including the Republican candidate with the best statewide polling.
Alaska: Hillary vs Jeb Bush: R +7%
+7% D improvement
(Updated on May 14, 2014)
Arizona: Hillary vs Bush: R +1%
+8% D improvement
(Updated on March 6, 2014)
Arkansas: Hillary vs Mike Huckabee: R +3%
+17% D improvement
(Updated on May 5, 2014)
Colorado: Hillary vs Paul Ryan: R +3.5%
+8.9% R improvement
Current Republican gain
(Updated on April 25, 2014)
Florida: Hillary vs Bush: D +5.7%
+4.8% D improvement
(Updated on June 16, 2014)
Georgia: Hillary vs Christie: R +2%
+6% D improvement
(Updated August 8 )
Iowa: Hillary vs Christie: D +3.8%
+2% R improvement
(Updated on June 9, 2014)
Kansas: Hillary vs Bush: R +9%
+13% D improvement
(Updated on February 24, 2014)
Kentucky: Hillary vs Christie/Bush: R +4%
+19% D improvement
(Updated on May 18, 2014)
Louisiana: Hillary vs Huckabee: R +5%
+12% D improvement
(Updated on February 18, 2014)
Maine: Hillary vs Christie: D +8%
+7% R improvement
(Updated on November 13)
Michigan: Hillary vs Christie: D +4.8%
+4.7% R improvement
(Updated on April 9, 2014)
Minnesota: Hillary vs Christie: D +6%
+2% R improvement
(Updated on January 22, 2013)
Mississippi: Hillary vs Christie: R +9%
+2.5% D improvement
(Updated on November 19)
Montana: Hillary vs Rand Paul: R +13%
+1% D improvement
(Updated on November 24)
New Hampshire: Hillary vs Huckabee: D +2.1%
+3.5% R improvement
(Updated on May 12, 2014)
New Jersey: Hillary vs Christie: D +10.5%
+7.3% R improvement
(Updated on March 4, 2014)
New Mexico: Hillary vs Susana Martinez: D +14%
+4% D improvement
(Updated on March 27, 2014)
New York: Hillary vs Christie: D +28%
+0.2% R improvement
(Updated on March 4, 2014)
North Carolina: Hillary vs Christie: D +0.9%
+2.9% D improvement
Current Democratic gain
(Updated on May 14, 2014)
Ohio: Hillary vs Christie: D +6.2%
+3.2% D improvement
(Updated on May 15, 2014)
Oregon: Hillary vs Rand Paul/Huckabee: D +12%
Unchanged from 2012
(Updated on May 30, 2014)
Pennsylvania: Hillary vs Christie: D +3.5%
+1.9% R improvement
(Updated on June 5, 2014)
South Carolina: Hillary vs Marco Rubio: R +7%
+3.5% D improvement
(Updated on November 2)
Texas: Hillary vs Huckabee: R +8%
+8% D improvement
(Updated on April 18, 2014)
Virginia: Hillary vs Christie: D +3.22%
+0.6% R improvement
(Updated on March 27, 2014)
West Virginia: Hillary vs Bush: R +14%
+13% D improvement
(Updated on October 1)
Wisconsin: Hillary vs Ryan: D +5.1%
+1.8% R improvement
(Updated on April 25, 2014)
Wyoming: Hillary vs Christie: R +28%
+13% D improvement
(Updated on July 23)
Average all 29 states: Hillary vs Best Republican: D/R +0.00% - a true toss up!
+3.4% D improvement (from Obama 2012) [projecting a 7.2% victory for Hillary]
That gives us this map right now:
(
Red = Democratic lead or trend
Blue = Republican lead or trend
Green = Exact tie or no trend, unchanged from 2012
Grey = No polling yet
Green = toss up
20% shade = 0.1-1% lead
30% shade = 1.1-3% lead
40% shade = 3.1-6% lead
50% shade = 6.1-9% lead
60% shade = 9.1-12% lead
70% shade = 12.1-15% lead
80% shade = 15.1-18% lead
90% shade = Above 18.1% lead
In the count of electoral votes, this means the current situation looks like this:
Hillary: 216 EVs (for a total of 15 states)
Best/Tailormade Republican: 120 EVs (for a total of 14 states)
Toss-up: None
No polling: 202 EVs (for a total of 21 states + D.C.)
Which means that Hillary has captured a rather impressive 64.3% of all EVs awarded thus far, against a disappointing 35.7% EVs for the tailormade Republican. Even as the biggest price by far, California, hasn't been added yet.
This is how the Trendline Map looks so far:
(
The states which right now are showing the strongest improvement for the Democratic (Hillary) or the Republican candidate (in 14 out of 29 cases, Christie is that person):
1. Kentucky: D +19%
2. Arkansas: D +17%
3. Kansas: D +13%
4. West Virginia: D +13%
5. Wyoming: D +13%
6. Louisiana: D +12%
7. Colorado: R +8.9%
8. Arizona: D +8%
9. Texas: D +8%
10. New Jersey: R +7.3%
11. Maine: R +7%
12. Alaska: D +7%
13. Georgia: D +6%
14. Florida: D +4.8%
15. Michigan: R +4.7%
All of these changes (in the 15 states above) are (more than) statistically significant.
The whole list of states having been polled till now, going from Democratic stronghold to Republican stronghold:
New York: D +28%
New Mexico: D +14%
Oregon: D +12%
New Jersey: D +10.5%
Maine: D +8%
Currently estimated/projected national average: D +7.2%
Ohio: D +6.2%
Minnesota: D +6%
Florida: D +5.7%
Wisconsin: D +5.1%
Michigan: D +4.8%
Iowa: D +3.8%
Pennsylvania: D +3.5%
Virginia: D +3.2%
New Hampshire: D +2.1%
North Carolina: D +0.9%
Arizona: R +1%
Georgia: R +2%
Arkansas: R +3%
Colorado: R +3.5%
Kentucky: R +4%
Louisiana: R +5%
Alaska: R +7%
South Carolina: R +7%
Texas: R +8%
Mississippi: R +9%
Kansas: R +9%
Montana: R +13%
West Virginia: R +14%
Wyoming: R +28%
Here are the current stats on the best-tailored Republican candidates in all states polled so far:
1. Chris Christie favoured in 14 of 29 states (for 175 EVs)
2. Mike Huckabee in 5 states (Texas (!), Louisiana (!), Oregon (shared), Arkansas & New Hampshire (!) - for 63 EVs)
3. Jeb Bush favoured in 6 states (Florida, Arizona, Kentucky (!!) (shared), Kansas, West Virginia & Alaska - for 62 EVs)
4. Paul Ryan favoured in 2 states (Wisconsin & Colorado - for 19 EVs)
5. Rand Paul favoured in 2 states (Oregon (shared) & Montana - for 10 EVs)
6. Marco Rubio favoured in 1 state (South Carolina - for 9 EVs)
7. Susana Martinez favoured in 1 state (New Mexico - for 5 EVs)
All in all; North Carolina, Florida, Ohio and New Mexico being amazing news for Hillary (a red state going blue or blue states going even bluer), while Colorado is equally bad news for her (a blue state going red). Interestingly though, four out of those five states are swing/battleground/purple states. Meaning that we're not seeing a further polarization of the electorate in most states - at least not this far.
Current update as of June 16.
Title: Re: 2016 Official Polling Map Thread
Post by: pbrower2a on June 16, 2014, 10:00:46 AM
St. Leo University, Florida
In trial heats:
Jeb Bush would defeat Hillary Clinton, 46-44 percent (2 points)
Clinton defeats former New Jersey Governor Chris Christie, 47-40 percent (7 points)
Clinton defeats U.S. Senator Marco Rubio of Florida, 49-41 percent (8 points)
Clinton defeats U.S. Representative Paul Ryan of Wisconsin, 50-40 percent(10 points)
Clinton defeats U.S. Senator Rand Paul of Kentucky, 50-38 percent (12 points)
Clinton defeats U.S. Senator Ted Cruz of Texas, 52-36 percent (16 points)
http://polls.saintleo.edu/florida-presidential-primary-preview-hillary-clinton-jeb-bush-florida-favorites
Averaging three polls in one week involving Hillary Clinton vs. Jeb Bush (SurveyUSA, PPP, and St. Leo University) I find that Hillary still leads by a bare but shaky margin. Others do nothing to change the observations by other pollsters.
Hillary Clinton vs. Jeb Bush
()
Hillary Clinton vs. Chris Christie
()
Hillary Clinton vs. Mike Huckabee
()
Hillary Clinton vs. Rand Paul
()
blue, Republican -- red, Democratic
30% -- lead with 40-49% but a margin of 3% or less
40% -- lead with 40-49% but a margin of 4% or more
60% -- lead with 50-54%
70% -- lead with 55-59%
90% -- lead with 60% or more
In trial heats:
Jeb Bush would defeat Hillary Clinton, 46-44 percent (2 points)
Clinton defeats former New Jersey Governor Chris Christie, 47-40 percent (7 points)
Clinton defeats U.S. Senator Marco Rubio of Florida, 49-41 percent (8 points)
Clinton defeats U.S. Representative Paul Ryan of Wisconsin, 50-40 percent(10 points)
Clinton defeats U.S. Senator Rand Paul of Kentucky, 50-38 percent (12 points)
Clinton defeats U.S. Senator Ted Cruz of Texas, 52-36 percent (16 points)
http://polls.saintleo.edu/florida-presidential-primary-preview-hillary-clinton-jeb-bush-florida-favorites
Averaging three polls in one week involving Hillary Clinton vs. Jeb Bush (SurveyUSA, PPP, and St. Leo University) I find that Hillary still leads by a bare but shaky margin. Others do nothing to change the observations by other pollsters.
Hillary Clinton vs. Jeb Bush
(
Hillary Clinton vs. Chris Christie
(
Hillary Clinton vs. Mike Huckabee
(
Hillary Clinton vs. Rand Paul
(
blue, Republican -- red, Democratic
30% -- lead with 40-49% but a margin of 3% or less
40% -- lead with 40-49% but a margin of 4% or more
60% -- lead with 50-54%
70% -- lead with 55-59%
90% -- lead with 60% or more
Title: Re: 2016 Official Polling Map Thread
Post by: pbrower2a on June 18, 2014, 01:52:05 PM
Minnesota.
http://www.publicpolicypolling.com/main/2014/06/-minnesota-miscellany.html
Hillary Clinton vs. Jeb Bush
(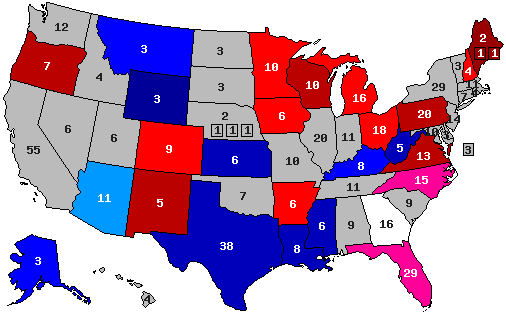 )
)
Hillary Clinton vs. Chris Christie
()
Hillary Clinton vs. Mike Huckabee
(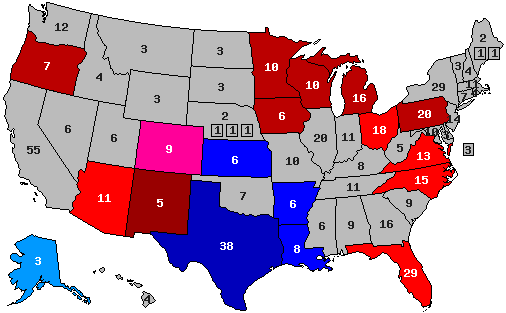 )
)
Hillary Clinton vs. Rand Paul
( )
)
blue, Republican -- red, Democratic
30% -- lead with 40-49% but a margin of 3% or less
40% -- lead with 40-49% but a margin of 4% or more
60% -- lead with 50-54%
70% -- lead with 55-59%
90% -- lead with 60% or more
Quote
PPP's newest Minnesota poll finds that if Hillary Clinton runs for President in 2016 the state is likely to remain safely blue. She leads all of the top potential Republican candidates by double digits there- it's 47/37 over Chris Christie, 49/39 over Jeb Bush, 50/40 over Mike Huckabee, 49/38 over Rand Paul, and 51/35 over Ted Cruz.
http://www.publicpolicypolling.com/main/2014/06/-minnesota-miscellany.html
Hillary Clinton vs. Jeb Bush
(
Hillary Clinton vs. Chris Christie
(
Hillary Clinton vs. Mike Huckabee
(
Hillary Clinton vs. Rand Paul
(
blue, Republican -- red, Democratic
30% -- lead with 40-49% but a margin of 3% or less
40% -- lead with 40-49% but a margin of 4% or more
60% -- lead with 50-54%
70% -- lead with 55-59%
90% -- lead with 60% or more
Title: Re: 2016 Official Polling Map Thread
Post by: eric82oslo on June 18, 2014, 04:06:36 PM
PPP has polled Minnesota for only the 2nd time this season. Last time, already 1 1/2 years ago, they only tested Christie and Rubio. This time they've included 6 more GOP candidates; Pawlenty, Bush, Huckabee, Rand Paul, Cruz & Bachmann. Tim Pawlenty does by far the best by only trailing Hillary with 6%. Christie is down to 2nd best GOPer in Minnesota, now trailing by an average of 8%. 3rd best are Bush & Huckabee, both trailing by 10%. Rand Paul is 11% behind her, Rubio 13%, Cruz 16% and Bachmann 17%. All in all, Minnesota does not change at all, as Hillary is still winning the state by +6%.
The total number of state polls included in the lists below has thus now reached 129.
So here they are - all the 2016 poll averages for each state so far - 29 states having been polled to date - and how far off they are compared to the actual 2012 outcomes. I'm only including the Republican candidate with the best statewide polling.
Alaska: Hillary vs Jeb Bush: R +7%
+7% D improvement
(Updated on May 14, 2014)
Arizona: Hillary vs Bush: R +1%
+8% D improvement
(Updated on March 6, 2014)
Arkansas: Hillary vs Mike Huckabee: R +3%
+17% D improvement
(Updated on May 5, 2014)
Colorado: Hillary vs Paul Ryan: R +3.5%
+8.9% R improvement
Current Republican gain
(Updated on April 25, 2014)
Florida: Hillary vs Bush: D +5.7%
+4.8% D improvement
(Updated on June 16, 2014)
Georgia: Hillary vs Christie: R +2%
+6% D improvement
(Updated August 8 )
Iowa: Hillary vs Christie: D +3.8%
+2% R improvement
(Updated on June 9, 2014)
Kansas: Hillary vs Bush: R +9%
+13% D improvement
(Updated on February 24, 2014)
Kentucky: Hillary vs Christie/Bush: R +4%
+19% D improvement
(Updated on May 18, 2014)
Louisiana: Hillary vs Huckabee: R +5%
+12% D improvement
(Updated on February 18, 2014)
Maine: Hillary vs Christie: D +8%
+7% R improvement
(Updated on November 13)
Michigan: Hillary vs Christie: D +4.8%
+4.7% R improvement
(Updated on April 9, 2014)
Minnesota: Hillary vs Tim Pawlenty: D +6%
+2% R improvement
(Updated on June 18, 2014)
Mississippi: Hillary vs Christie: R +9%
+2.5% D improvement
(Updated on November 19)
Montana: Hillary vs Rand Paul: R +13%
+1% D improvement
(Updated on November 24)
New Hampshire: Hillary vs Huckabee: D +2.1%
+3.5% R improvement
(Updated on May 12, 2014)
New Jersey: Hillary vs Christie: D +10.5%
+7.3% R improvement
(Updated on March 4, 2014)
New Mexico: Hillary vs Susana Martinez: D +14%
+4% D improvement
(Updated on March 27, 2014)
New York: Hillary vs Christie: D +28%
+0.2% R improvement
(Updated on March 4, 2014)
North Carolina: Hillary vs Christie: D +0.9%
+2.9% D improvement
Current Democratic gain
(Updated on May 14, 2014)
Ohio: Hillary vs Christie: D +6.2%
+3.2% D improvement
(Updated on May 15, 2014)
Oregon: Hillary vs Rand Paul/Huckabee: D +12%
Unchanged from 2012
(Updated on May 30, 2014)
Pennsylvania: Hillary vs Christie: D +3.5%
+1.9% R improvement
(Updated on June 5, 2014)
South Carolina: Hillary vs Marco Rubio: R +7%
+3.5% D improvement
(Updated on November 2)
Texas: Hillary vs Huckabee: R +8%
+8% D improvement
(Updated on April 18, 2014)
Virginia: Hillary vs Christie: D +3.22%
+0.6% R improvement
(Updated on March 27, 2014)
West Virginia: Hillary vs Bush: R +14%
+13% D improvement
(Updated on October 1)
Wisconsin: Hillary vs Ryan: D +5.1%
+1.8% R improvement
(Updated on April 25, 2014)
Wyoming: Hillary vs Christie: R +28%
+13% D improvement
(Updated on July 23)
Average all 29 states: Hillary vs Best Republican: D/R +0.00% - a true toss up!
+3.4% D improvement (from Obama 2012) [projecting a 7.2% victory for Hillary]
That gives us this map right now:
()
Red = Democratic lead or trend
Blue = Republican lead or trend
Green = Exact tie or no trend, unchanged from 2012
Grey = No polling yet
Green = toss up
20% shade = 0.1-1% lead
30% shade = 1.1-3% lead
40% shade = 3.1-6% lead
50% shade = 6.1-9% lead
60% shade = 9.1-12% lead
70% shade = 12.1-15% lead
80% shade = 15.1-18% lead
90% shade = Above 18.1% lead
In the count of electoral votes, this means the current situation looks like this:
Hillary: 216 EVs (for a total of 15 states)
Best/Tailormade Republican: 120 EVs (for a total of 14 states)
Toss-up: None
No polling: 202 EVs (for a total of 21 states + D.C.)
Which means that Hillary has captured a rather impressive 64.3% of all EVs awarded thus far, against a disappointing 35.7% EVs for the tailormade Republican. Even as the biggest price by far, California, hasn't been added yet.
This is how the Trendline Map looks so far:
()
The states which right now are showing the strongest improvement for the Democratic (Hillary) or the Republican candidate (in 13 out of 29 cases, Christie is that person):
1. Kentucky: D +19%
2. Arkansas: D +17%
3. Kansas: D +13%
4. West Virginia: D +13%
5. Wyoming: D +13%
6. Louisiana: D +12%
7. Colorado: R +8.9%
8. Arizona: D +8%
9. Texas: D +8%
10. New Jersey: R +7.3%
11. Maine: R +7%
12. Alaska: D +7%
13. Georgia: D +6%
14. Florida: D +4.8%
15. Michigan: R +4.7%
All of these changes (in the 15 states above) are (more than) statistically significant.
The whole list of states having been polled till now, going from Democratic stronghold to Republican stronghold:
New York: D +28%
New Mexico: D +14%
Oregon: D +12%
New Jersey: D +10.5%
Maine: D +8%
Currently estimated/projected national average: D +7.2%
Ohio: D +6.2%
Minnesota: D +6%
Florida: D +5.7%
Wisconsin: D +5.1%
Michigan: D +4.8%
Iowa: D +3.8%
Pennsylvania: D +3.5%
Virginia: D +3.2%
New Hampshire: D +2.1%
North Carolina: D +0.9%
Arizona: R +1%
Georgia: R +2%
Arkansas: R +3%
Colorado: R +3.5%
Kentucky: R +4%
Louisiana: R +5%
Alaska: R +7%
South Carolina: R +7%
Texas: R +8%
Mississippi: R +9%
Kansas: R +9%
Montana: R +13%
West Virginia: R +14%
Wyoming: R +28%
Here are the current stats on the best-tailored Republican candidates in all states polled so far:
1. Chris Christie favoured in 13 of 29 states (for 165 EVs)
2. Mike Huckabee in 5 states (Texas (!), Louisiana (!), Oregon (shared), Arkansas & New Hampshire (!) - for 63 EVs)
3. Jeb Bush favoured in 6 states (Florida, Arizona, Kentucky (!!) (shared), Kansas, West Virginia & Alaska - for 62 EVs)
4. Paul Ryan favoured in 2 states (Wisconsin & Colorado - for 19 EVs)
5. Rand Paul favoured in 2 states (Oregon (shared) & Montana - for 10 EVs)
6. Tim Pawlenty favoured in 1 state (Minnesota - for 10 EVs)
7. Marco Rubio favoured in 1 state (South Carolina - for 9 EVs)
8. Susana Martinez favoured in 1 state (New Mexico - for 5 EVs)
All in all; North Carolina, Florida, Ohio and New Mexico being amazing news for Hillary (a red state going blue or blue states going even bluer), while Colorado is equally bad news for her (a blue state going red). Interestingly though, four out of those five states are swing/battleground/purple states. Meaning that we're not seeing a further polarization of the electorate in most states - at least not this far.
Current update as of June 18.
The total number of state polls included in the lists below has thus now reached 129.
So here they are - all the 2016 poll averages for each state so far - 29 states having been polled to date - and how far off they are compared to the actual 2012 outcomes. I'm only including the Republican candidate with the best statewide polling.
Alaska: Hillary vs Jeb Bush: R +7%
+7% D improvement
(Updated on May 14, 2014)
Arizona: Hillary vs Bush: R +1%
+8% D improvement
(Updated on March 6, 2014)
Arkansas: Hillary vs Mike Huckabee: R +3%
+17% D improvement
(Updated on May 5, 2014)
Colorado: Hillary vs Paul Ryan: R +3.5%
+8.9% R improvement
Current Republican gain
(Updated on April 25, 2014)
Florida: Hillary vs Bush: D +5.7%
+4.8% D improvement
(Updated on June 16, 2014)
Georgia: Hillary vs Christie: R +2%
+6% D improvement
(Updated August 8 )
Iowa: Hillary vs Christie: D +3.8%
+2% R improvement
(Updated on June 9, 2014)
Kansas: Hillary vs Bush: R +9%
+13% D improvement
(Updated on February 24, 2014)
Kentucky: Hillary vs Christie/Bush: R +4%
+19% D improvement
(Updated on May 18, 2014)
Louisiana: Hillary vs Huckabee: R +5%
+12% D improvement
(Updated on February 18, 2014)
Maine: Hillary vs Christie: D +8%
+7% R improvement
(Updated on November 13)
Michigan: Hillary vs Christie: D +4.8%
+4.7% R improvement
(Updated on April 9, 2014)
Minnesota: Hillary vs Tim Pawlenty: D +6%
+2% R improvement
(Updated on June 18, 2014)
Mississippi: Hillary vs Christie: R +9%
+2.5% D improvement
(Updated on November 19)
Montana: Hillary vs Rand Paul: R +13%
+1% D improvement
(Updated on November 24)
New Hampshire: Hillary vs Huckabee: D +2.1%
+3.5% R improvement
(Updated on May 12, 2014)
New Jersey: Hillary vs Christie: D +10.5%
+7.3% R improvement
(Updated on March 4, 2014)
New Mexico: Hillary vs Susana Martinez: D +14%
+4% D improvement
(Updated on March 27, 2014)
New York: Hillary vs Christie: D +28%
+0.2% R improvement
(Updated on March 4, 2014)
North Carolina: Hillary vs Christie: D +0.9%
+2.9% D improvement
Current Democratic gain
(Updated on May 14, 2014)
Ohio: Hillary vs Christie: D +6.2%
+3.2% D improvement
(Updated on May 15, 2014)
Oregon: Hillary vs Rand Paul/Huckabee: D +12%
Unchanged from 2012
(Updated on May 30, 2014)
Pennsylvania: Hillary vs Christie: D +3.5%
+1.9% R improvement
(Updated on June 5, 2014)
South Carolina: Hillary vs Marco Rubio: R +7%
+3.5% D improvement
(Updated on November 2)
Texas: Hillary vs Huckabee: R +8%
+8% D improvement
(Updated on April 18, 2014)
Virginia: Hillary vs Christie: D +3.22%
+0.6% R improvement
(Updated on March 27, 2014)
West Virginia: Hillary vs Bush: R +14%
+13% D improvement
(Updated on October 1)
Wisconsin: Hillary vs Ryan: D +5.1%
+1.8% R improvement
(Updated on April 25, 2014)
Wyoming: Hillary vs Christie: R +28%
+13% D improvement
(Updated on July 23)
Average all 29 states: Hillary vs Best Republican: D/R +0.00% - a true toss up!
+3.4% D improvement (from Obama 2012) [projecting a 7.2% victory for Hillary]
That gives us this map right now:
(
Red = Democratic lead or trend
Blue = Republican lead or trend
Green = Exact tie or no trend, unchanged from 2012
Grey = No polling yet
Green = toss up
20% shade = 0.1-1% lead
30% shade = 1.1-3% lead
40% shade = 3.1-6% lead
50% shade = 6.1-9% lead
60% shade = 9.1-12% lead
70% shade = 12.1-15% lead
80% shade = 15.1-18% lead
90% shade = Above 18.1% lead
In the count of electoral votes, this means the current situation looks like this:
Hillary: 216 EVs (for a total of 15 states)
Best/Tailormade Republican: 120 EVs (for a total of 14 states)
Toss-up: None
No polling: 202 EVs (for a total of 21 states + D.C.)
Which means that Hillary has captured a rather impressive 64.3% of all EVs awarded thus far, against a disappointing 35.7% EVs for the tailormade Republican. Even as the biggest price by far, California, hasn't been added yet.
This is how the Trendline Map looks so far:
(
The states which right now are showing the strongest improvement for the Democratic (Hillary) or the Republican candidate (in 13 out of 29 cases, Christie is that person):
1. Kentucky: D +19%
2. Arkansas: D +17%
3. Kansas: D +13%
4. West Virginia: D +13%
5. Wyoming: D +13%
6. Louisiana: D +12%
7. Colorado: R +8.9%
8. Arizona: D +8%
9. Texas: D +8%
10. New Jersey: R +7.3%
11. Maine: R +7%
12. Alaska: D +7%
13. Georgia: D +6%
14. Florida: D +4.8%
15. Michigan: R +4.7%
All of these changes (in the 15 states above) are (more than) statistically significant.
The whole list of states having been polled till now, going from Democratic stronghold to Republican stronghold:
New York: D +28%
New Mexico: D +14%
Oregon: D +12%
New Jersey: D +10.5%
Maine: D +8%
Currently estimated/projected national average: D +7.2%
Ohio: D +6.2%
Minnesota: D +6%
Florida: D +5.7%
Wisconsin: D +5.1%
Michigan: D +4.8%
Iowa: D +3.8%
Pennsylvania: D +3.5%
Virginia: D +3.2%
New Hampshire: D +2.1%
North Carolina: D +0.9%
Arizona: R +1%
Georgia: R +2%
Arkansas: R +3%
Colorado: R +3.5%
Kentucky: R +4%
Louisiana: R +5%
Alaska: R +7%
South Carolina: R +7%
Texas: R +8%
Mississippi: R +9%
Kansas: R +9%
Montana: R +13%
West Virginia: R +14%
Wyoming: R +28%
Here are the current stats on the best-tailored Republican candidates in all states polled so far:
1. Chris Christie favoured in 13 of 29 states (for 165 EVs)
2. Mike Huckabee in 5 states (Texas (!), Louisiana (!), Oregon (shared), Arkansas & New Hampshire (!) - for 63 EVs)
3. Jeb Bush favoured in 6 states (Florida, Arizona, Kentucky (!!) (shared), Kansas, West Virginia & Alaska - for 62 EVs)
4. Paul Ryan favoured in 2 states (Wisconsin & Colorado - for 19 EVs)
5. Rand Paul favoured in 2 states (Oregon (shared) & Montana - for 10 EVs)
6. Tim Pawlenty favoured in 1 state (Minnesota - for 10 EVs)
7. Marco Rubio favoured in 1 state (South Carolina - for 9 EVs)
8. Susana Martinez favoured in 1 state (New Mexico - for 5 EVs)
All in all; North Carolina, Florida, Ohio and New Mexico being amazing news for Hillary (a red state going blue or blue states going even bluer), while Colorado is equally bad news for her (a blue state going red). Interestingly though, four out of those five states are swing/battleground/purple states. Meaning that we're not seeing a further polarization of the electorate in most states - at least not this far.
Current update as of June 18.
Title: Re: 2016 Official Polling Map Thread
Post by: pbrower2a on June 18, 2014, 06:20:18 PM
Ignoring those that I have dropped because either (1) nobody asks about them anymore or (2) polling of them is rare I find:
1. Very few "not-so-sure" states or electoral votes are polled. That is now limited to four states (IN, MO, NV, TN) that have been close in any Presidential election beginning in 2000. NE-02 belongs in that category. Colorado and Nevada may not seem much alike to you (you would know whether you were in Colorado or Nevada, and you would never confuse Denver and Las Vegas) but they seem to vote much alike.
2. The only state that Obama has ever won that surprises anyone is Colorado. This may be because Colorado is extensively polled based on "likely voters" models appropriate for a midterm, as there will be a Senatorial and a Gubernatorial election there in November. The electorate typical of a midterm is more R than a Presidential election, and the Presidential matchups in 2014 are thus designed for a midterm. Some matchups show Hillary Clinton doing badly in Colorado in contrast to some other States.
But that is only one state.
3. We have, if nothing near all states, something unlikely to yield giant surprises to the benefit of any Republican. Colorado is the biggest. Nobody sees any of the states that have gone by 5% or more to President Obama twice except Colorado as possible pickups. To accommodate the loss of Virginia the Republicans basically need something like Wisconsin and New Hampshire; to accommodate the loss of Ohio, the Republicans need something like Michigan or Pennsylvania. Such seems not to be happening.
4. We are completely missing polls for binary matchups in some states with large electoral vote totals (CA, IL, WA), but nobody can expect surprises. We have no polls for either Bush or Huckabee in New York State. But all in all we have a good skeleton. At this point I would be tempted to concede that IN, MO, and TN would vote for any Republican nominee until I see evidence otherwise. On the other side, I can't imagine any Republican nominee winning Maryland, Massachusetts, or Washington, either.
Giving the most favorable argument for maximal results for any possible Republican nominee:
5. We have polls involving Jeb Bush in 26 states. Even if one concedes him all states in which he is tied or behind by an amount within the margin of error, he seems to lose Arkansas to Hillary Clinton and otherwise everything that Obama won twice except Florida. He would lose the Electoral college at least 309-229, and it gets worse if he actually loses one of those states within the margin of error or anything else, let alone one of the unpolled states with ten or so electoral votes that went R in 2012 (IN, MO, TN). If Arkansas ans Georgia are at risk with Bush as the nominee, then so are Missouri and Tennessee.
6. With Christie we have 28 states polled. Hillary Clinton projects to get Obama 2012 results except for having Colorado being decided by a hair -- but picking up Arkansas and North Carolina by margins beyond the margin of error (344 EV) with a good chance of picking up Arizona (and if she gets Arizona she also picks up Colorado) The best-case scenario from the R standpoint for a Christie-Clinton matchup is 344-194. In view of the weak showings that Christie has in Alaska, Georgia, Louisiana, and Texas, such a matchup has a potential to become a blowout landslide with Hillary Clinton getting 400 or more electoral votes.
7. With only 18 states polled involving Huckabee, I see him with no strength outside of the Mountain South and the Deep South. He would almost certainly win almost every state that Republicans have not lost since 2000, which means basically the Deep South, the Mountain South, and likely farm-and-ranch country, and Texas. The good news for Republicans is that unlike the other three he unambiguously wins Arkansas and along with it all of the other Clinton-but-not-Obama states. The bad news is that he unambiguously loses Arizona and North Carolina. I'm not sure that he wins Georgia, Indiana, or Missouri, either.
There are huge blanks in the map involving him, but those are largely in the northeastern quadrant of the US. It is safe to assume that, in view of his prospect of losing Pennsylvania by 10% or so and being out of reasonable contention in Virginia, that he will win nothing to the north and east of of the Potomac. The best result for him as a Republican nominee in electoral votes would be Hillary Clinton winning 360-178 or so, which is what one gets when one trades Obama's anomalous wins of Indiana and NE-02 in 2008 for Arizona.
Huckabee is a Southern right-wing populist, which is the antithesis of most of the northeastern quadrant of the US and the West Coast. No way do I see him losing Texas, but I can easily imagine him losing Georgia, Indiana, Missouri, and NE-02 in 2016y, which would give Hillary Clinton 400 or so electoral votes. I also see him as an unusually poor R choice to hold onto the Dakotas or Montana.
8. As with Christie, we have 28 states polled involving Rand Paul. Paul projects to lose everything that Romney lost and apparently pick up Colorado. But he loses Arkansas, which would be a good trade for Colorado -- if he weren't also losing Florida, Ohio, and Virginia as well. But with him he could easily lose Arizona, Georgia, and North Carolina. The most positive view that I can now project for Rand Paul is Hillary Clinton 329 - Rand Paul 209.
I see Colorado very shaky for him. He probably fares well in polling in Colorado because of his father's reputation as a libertarian. Colorado has a loud libertarian streak in its Republican Party. That said, I see Rand Paul much more authoritarian than his father, and that could wreck his chance of picking up Colorado or Nevada. Think about it: the late Governor George Romney is admired in Michigan, but his son got destroyed there in the 2012 election.
10. These results are consistent with national polls that show Hillary Clinton way ahead. They would be very different if Joe Biden is the Democratic nominee, and I have nothing to say about any other potential Democratic nominee.
Hillary Clinton is much less regionally-polarizing than Barack Obama. The President in the 20th century who got the percentage if the popular vote to Obama in 2008 was FDR in 1944, when he got 432 electoral votes (and Alaska, Hawaii, and DC, which between them hold ten electoral votes, weren't voting). Obama got only 365 electoral votes, and seven of those came from DC and Hawaii. With an even shift of 0.53% of the popular vote to match FDR in 1944, Obama would have picked off only Missouri and gotten a comparatively-modest 276 electoral votes.
11. The Republicans have chances if (1) Hillary Clinton is not the nominee or (2) she melts down during the campaign (health, scandal?).
Title: Re: 2016 Official Polling Map Thread
Post by: Never on June 18, 2014, 09:24:04 PM
^ Very strong analysis.
Am I correct in assuming that the reason we don't have maps of Joe Biden versus the likeliest GOP candidates is due to the scarcity of polls including Biden? Whenever there are enough polls with Biden to justify making maps with him on this thread, I would be grateful to see them.
Am I correct in assuming that the reason we don't have maps of Joe Biden versus the likeliest GOP candidates is due to the scarcity of polls including Biden? Whenever there are enough polls with Biden to justify making maps with him on this thread, I would be grateful to see them.
Title: Re: 2016 Official Polling Map Thread
Post by: pbrower2a on June 19, 2014, 03:10:39 AM
Am I correct in assuming that the reason we don't have maps of Joe Biden versus the likeliest GOP candidates is due to the scarcity of polls including Biden? Whenever there are enough polls with Biden to justify making maps with him on this thread, I would be grateful to see them.
You are. The only ways in which Joe Biden becomes President is if President Obama dies, resigns, or is impeached and convicted. Such sporadic polls as I have seen show him unelectable.
I have had Ted Cruz, Paul Ryan, and Mario Rubio, and I dropped them once I saw that people quit taking them seriously. I was all set to have polls involving Scott Walker because he seemed a likely hero of the Right as a right-wing Governor of a liberal state, saw a couple polls, and saw nothing else.
In theory the Republicans could still get some nominee out of the smoke-filled room as a compromise between factions. Problems?
1. Smoking is down -- way down -- from when decisions really were made in obscure, smoke-filled rooms
2. We have never seen such happen in decades, and
3. Nominees so selected have done badly in general elections
4. The Republican Party does not want a 'moral victory' in an electoral loss.
Title: Re: 2016 Official Polling Map Thread
Post by: eric82oslo on June 19, 2014, 11:12:32 AM
In North Carolina, PPP has just realeased its 9th poll this season, the 8th poll to also include a Christie-Hillary match-up. Christie is still the strongest GOPer in the Tarheel State - despite a 4% loss in this latest match-up - now trailing the Pantsuit Aficionado by -1.25%, up from -0.9%. Not far behind though we find Jeb Bush, trailing Hillary by -2.1% in the state. Huackabee trails her by -4.8%, Rand Paul by -5.1%, Ted Cruz stands at -6% and Marco Rubio at -7%. Hillary is right now improving on Obama's 2012 numbers in the state by an impressive 3.3%!
The total number of state polls included in the lists below has thus now reached 130.
So here they are - all the 2016 poll averages for each state so far - 29 states having been polled to date - and how far off they are compared to the actual 2012 outcomes. I'm only including the Republican candidate with the best statewide polling.
Alaska: Hillary vs Jeb Bush: R +7%
+7% D improvement
(Updated on May 14, 2014)
Arizona: Hillary vs Bush: R +1%
+8% D improvement
(Updated on March 6, 2014)
Arkansas: Hillary vs Mike Huckabee: R +3%
+17% D improvement
(Updated on May 5, 2014)
Colorado: Hillary vs Paul Ryan: R +3.5%
+8.9% R improvement
Current Republican gain
(Updated on April 25, 2014)
Florida: Hillary vs Bush: D +5.7%
+4.8% D improvement
(Updated on June 16, 2014)
Georgia: Hillary vs Christie: R +2%
+6% D improvement
(Updated August 8, 2013)
Iowa: Hillary vs Christie: D +3.8%
+2% R improvement
(Updated on June 9, 2014)
Kansas: Hillary vs Bush: R +9%
+13% D improvement
(Updated on February 24, 2014)
Kentucky: Hillary vs Christie/Bush: R +4%
+19% D improvement
(Updated on May 18, 2014)
Louisiana: Hillary vs Huckabee: R +5%
+12% D improvement
(Updated on February 18, 2014)
Maine: Hillary vs Christie: D +8%
+7% R improvement
(Updated on November 13, 2013)
Michigan: Hillary vs Christie: D +4.8%
+4.7% R improvement
(Updated on April 9, 2014)
Minnesota: Hillary vs Tim Pawlenty: D +6%
+2% R improvement
(Updated on June 18, 2014)
Mississippi: Hillary vs Christie: R +9%
+2.5% D improvement
(Updated on November 19, 2013)
Montana: Hillary vs Rand Paul: R +13%
+1% D improvement
(Updated on November 24, 2013)
New Hampshire: Hillary vs Huckabee: D +2.1%
+3.5% R improvement
(Updated on May 12, 2014)
New Jersey: Hillary vs Christie: D +10.5%
+7.3% R improvement
(Updated on March 4, 2014)
New Mexico: Hillary vs Susana Martinez: D +14%
+4% D improvement
(Updated on March 27, 2014)
New York: Hillary vs Christie: D +28%
+0.2% R improvement
(Updated on March 4, 2014)
North Carolina: Hillary vs Christie: D +1.25%
+3.3% D improvement
Current Democratic gain
(Updated on June 19, 2014)
Ohio: Hillary vs Christie: D +6.2%
+3.2% D improvement
(Updated on May 15, 2014)
Oregon: Hillary vs Rand Paul/Huckabee: D +12%
Unchanged from 2012
(Updated on May 30, 2014)
Pennsylvania: Hillary vs Christie: D +3.5%
+1.9% R improvement
(Updated on June 5, 2014)
South Carolina: Hillary vs Marco Rubio: R +7%
+3.5% D improvement
(Updated on November 2, 2013)
Texas: Hillary vs Huckabee: R +8%
+8% D improvement
(Updated on April 18, 2014)
Virginia: Hillary vs Christie: D +3.22%
+0.6% R improvement
(Updated on March 27, 2014)
West Virginia: Hillary vs Bush: R +14%
+13% D improvement
(Updated on October 1, 2013)
Wisconsin: Hillary vs Ryan: D +5.1%
+1.8% R improvement
(Updated on April 25, 2014)
Wyoming: Hillary vs Christie: R +28%
+13% D improvement
(Updated on July 23, 2013)
Average all 29 states: Hillary vs Best Republican: D +0.01%
+3.4% D improvement (from Obama 2012) [projecting a 7.2% victory for Hillary]
That gives us this map right now:
(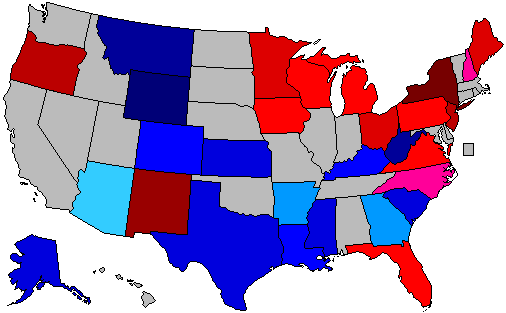 )
)
Red = Democratic lead or trend
Blue = Republican lead or trend
Green = Exact tie or no trend, unchanged from 2012
Grey = No polling yet
Green = toss up
20% shade = 0.1-1% lead
30% shade = 1.1-3% lead
40% shade = 3.1-6% lead
50% shade = 6.1-9% lead
60% shade = 9.1-12% lead
70% shade = 12.1-15% lead
80% shade = 15.1-18% lead
90% shade = Above 18.1% lead
In the count of electoral votes, this means the current situation looks like this:
Hillary: 216 EVs (for a total of 15 states)
Best/Tailormade Republican: 120 EVs (for a total of 14 states)
Toss-up: None
No polling: 202 EVs (for a total of 21 states + D.C.)
Which means that Hillary has captured a rather impressive 64.3% of all EVs awarded thus far, against a disappointing 35.7% EVs for the tailormade Republican. Even as the biggest price by far, California, hasn't been added yet.
This is how the Trendline Map looks so far:
(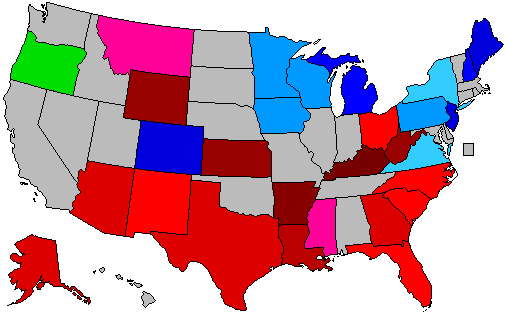 )
)
The states which right now are showing the strongest improvement for the Democratic (Hillary) or the Republican candidate (in 13 out of 29 cases, Christie is that person):
1. Kentucky: D +19%
2. Arkansas: D +17%
3. Kansas: D +13%
4. West Virginia: D +13%
5. Wyoming: D +13%
6. Louisiana: D +12%
7. Colorado: R +8.9%
8. Arizona: D +8%
9. Texas: D +8%
10. New Jersey: R +7.3%
11. Maine: R +7%
12. Alaska: D +7%
13. Georgia: D +6%
14. Florida: D +4.8%
15. Michigan: R +4.7%
All of these changes (in the 15 states above) are (more than) statistically significant.
The whole list of states having been polled till now, going from Democratic stronghold to Republican stronghold:
New York: D +28%
New Mexico: D +14%
Oregon: D +12%
New Jersey: D +10.5%
Maine: D +8%
Currently estimated/projected national average: D +7.2%
Ohio: D +6.2%
Minnesota: D +6%
Florida: D +5.7%
Wisconsin: D +5.1%
Michigan: D +4.8%
Iowa: D +3.8%
Pennsylvania: D +3.5%
Virginia: D +3.2%
New Hampshire: D +2.1%
North Carolina: D +1.25%
Arizona: R +1%
Georgia: R +2%
Arkansas: R +3%
Colorado: R +3.5%
Kentucky: R +4%
Louisiana: R +5%
Alaska: R +7%
South Carolina: R +7%
Texas: R +8%
Mississippi: R +9%
Kansas: R +9%
Montana: R +13%
West Virginia: R +14%
Wyoming: R +28%
Here are the current stats on the best-tailored Republican candidates in all states polled so far:
1. Chris Christie favoured in 13 of 29 states (for 165 EVs)
2. Mike Huckabee in 5 states (Texas (!), Louisiana (!), Oregon (shared), Arkansas & New Hampshire (!) - for 63 EVs)
3. Jeb Bush favoured in 6 states (Florida, Arizona, Kentucky (!!) (shared), Kansas, West Virginia & Alaska - for 62 EVs)
4. Paul Ryan favoured in 2 states (Wisconsin & Colorado - for 19 EVs)
5. Rand Paul favoured in 2 states (Oregon (shared) & Montana - for 10 EVs)
6. Tim Pawlenty favoured in 1 state (Minnesota - for 10 EVs)
7. Marco Rubio favoured in 1 state (South Carolina - for 9 EVs)
8. Susana Martinez favoured in 1 state (New Mexico - for 5 EVs)
All in all; North Carolina, Florida, Ohio and New Mexico being amazing news for Hillary (a red state going blue or blue states going even bluer), while Colorado is equally bad news for her (a blue state going red). Interestingly though, four out of those five states are swing/battleground/purple states. Meaning that we're not seeing a further polarization of the electorate in most states - at least not this far.
Current update as of June 19.
The total number of state polls included in the lists below has thus now reached 130.
So here they are - all the 2016 poll averages for each state so far - 29 states having been polled to date - and how far off they are compared to the actual 2012 outcomes. I'm only including the Republican candidate with the best statewide polling.
Alaska: Hillary vs Jeb Bush: R +7%
+7% D improvement
(Updated on May 14, 2014)
Arizona: Hillary vs Bush: R +1%
+8% D improvement
(Updated on March 6, 2014)
Arkansas: Hillary vs Mike Huckabee: R +3%
+17% D improvement
(Updated on May 5, 2014)
Colorado: Hillary vs Paul Ryan: R +3.5%
+8.9% R improvement
Current Republican gain
(Updated on April 25, 2014)
Florida: Hillary vs Bush: D +5.7%
+4.8% D improvement
(Updated on June 16, 2014)
Georgia: Hillary vs Christie: R +2%
+6% D improvement
(Updated August 8, 2013)
Iowa: Hillary vs Christie: D +3.8%
+2% R improvement
(Updated on June 9, 2014)
Kansas: Hillary vs Bush: R +9%
+13% D improvement
(Updated on February 24, 2014)
Kentucky: Hillary vs Christie/Bush: R +4%
+19% D improvement
(Updated on May 18, 2014)
Louisiana: Hillary vs Huckabee: R +5%
+12% D improvement
(Updated on February 18, 2014)
Maine: Hillary vs Christie: D +8%
+7% R improvement
(Updated on November 13, 2013)
Michigan: Hillary vs Christie: D +4.8%
+4.7% R improvement
(Updated on April 9, 2014)
Minnesota: Hillary vs Tim Pawlenty: D +6%
+2% R improvement
(Updated on June 18, 2014)
Mississippi: Hillary vs Christie: R +9%
+2.5% D improvement
(Updated on November 19, 2013)
Montana: Hillary vs Rand Paul: R +13%
+1% D improvement
(Updated on November 24, 2013)
New Hampshire: Hillary vs Huckabee: D +2.1%
+3.5% R improvement
(Updated on May 12, 2014)
New Jersey: Hillary vs Christie: D +10.5%
+7.3% R improvement
(Updated on March 4, 2014)
New Mexico: Hillary vs Susana Martinez: D +14%
+4% D improvement
(Updated on March 27, 2014)
New York: Hillary vs Christie: D +28%
+0.2% R improvement
(Updated on March 4, 2014)
North Carolina: Hillary vs Christie: D +1.25%
+3.3% D improvement
Current Democratic gain
(Updated on June 19, 2014)
Ohio: Hillary vs Christie: D +6.2%
+3.2% D improvement
(Updated on May 15, 2014)
Oregon: Hillary vs Rand Paul/Huckabee: D +12%
Unchanged from 2012
(Updated on May 30, 2014)
Pennsylvania: Hillary vs Christie: D +3.5%
+1.9% R improvement
(Updated on June 5, 2014)
South Carolina: Hillary vs Marco Rubio: R +7%
+3.5% D improvement
(Updated on November 2, 2013)
Texas: Hillary vs Huckabee: R +8%
+8% D improvement
(Updated on April 18, 2014)
Virginia: Hillary vs Christie: D +3.22%
+0.6% R improvement
(Updated on March 27, 2014)
West Virginia: Hillary vs Bush: R +14%
+13% D improvement
(Updated on October 1, 2013)
Wisconsin: Hillary vs Ryan: D +5.1%
+1.8% R improvement
(Updated on April 25, 2014)
Wyoming: Hillary vs Christie: R +28%
+13% D improvement
(Updated on July 23, 2013)
Average all 29 states: Hillary vs Best Republican: D +0.01%
+3.4% D improvement (from Obama 2012) [projecting a 7.2% victory for Hillary]
That gives us this map right now:
(
Red = Democratic lead or trend
Blue = Republican lead or trend
Green = Exact tie or no trend, unchanged from 2012
Grey = No polling yet
Green = toss up
20% shade = 0.1-1% lead
30% shade = 1.1-3% lead
40% shade = 3.1-6% lead
50% shade = 6.1-9% lead
60% shade = 9.1-12% lead
70% shade = 12.1-15% lead
80% shade = 15.1-18% lead
90% shade = Above 18.1% lead
In the count of electoral votes, this means the current situation looks like this:
Hillary: 216 EVs (for a total of 15 states)
Best/Tailormade Republican: 120 EVs (for a total of 14 states)
Toss-up: None
No polling: 202 EVs (for a total of 21 states + D.C.)
Which means that Hillary has captured a rather impressive 64.3% of all EVs awarded thus far, against a disappointing 35.7% EVs for the tailormade Republican. Even as the biggest price by far, California, hasn't been added yet.
This is how the Trendline Map looks so far:
(
The states which right now are showing the strongest improvement for the Democratic (Hillary) or the Republican candidate (in 13 out of 29 cases, Christie is that person):
1. Kentucky: D +19%
2. Arkansas: D +17%
3. Kansas: D +13%
4. West Virginia: D +13%
5. Wyoming: D +13%
6. Louisiana: D +12%
7. Colorado: R +8.9%
8. Arizona: D +8%
9. Texas: D +8%
10. New Jersey: R +7.3%
11. Maine: R +7%
12. Alaska: D +7%
13. Georgia: D +6%
14. Florida: D +4.8%
15. Michigan: R +4.7%
All of these changes (in the 15 states above) are (more than) statistically significant.
The whole list of states having been polled till now, going from Democratic stronghold to Republican stronghold:
New York: D +28%
New Mexico: D +14%
Oregon: D +12%
New Jersey: D +10.5%
Maine: D +8%
Currently estimated/projected national average: D +7.2%
Ohio: D +6.2%
Minnesota: D +6%
Florida: D +5.7%
Wisconsin: D +5.1%
Michigan: D +4.8%
Iowa: D +3.8%
Pennsylvania: D +3.5%
Virginia: D +3.2%
New Hampshire: D +2.1%
North Carolina: D +1.25%
Arizona: R +1%
Georgia: R +2%
Arkansas: R +3%
Colorado: R +3.5%
Kentucky: R +4%
Louisiana: R +5%
Alaska: R +7%
South Carolina: R +7%
Texas: R +8%
Mississippi: R +9%
Kansas: R +9%
Montana: R +13%
West Virginia: R +14%
Wyoming: R +28%
Here are the current stats on the best-tailored Republican candidates in all states polled so far:
1. Chris Christie favoured in 13 of 29 states (for 165 EVs)
2. Mike Huckabee in 5 states (Texas (!), Louisiana (!), Oregon (shared), Arkansas & New Hampshire (!) - for 63 EVs)
3. Jeb Bush favoured in 6 states (Florida, Arizona, Kentucky (!!) (shared), Kansas, West Virginia & Alaska - for 62 EVs)
4. Paul Ryan favoured in 2 states (Wisconsin & Colorado - for 19 EVs)
5. Rand Paul favoured in 2 states (Oregon (shared) & Montana - for 10 EVs)
6. Tim Pawlenty favoured in 1 state (Minnesota - for 10 EVs)
7. Marco Rubio favoured in 1 state (South Carolina - for 9 EVs)
8. Susana Martinez favoured in 1 state (New Mexico - for 5 EVs)
All in all; North Carolina, Florida, Ohio and New Mexico being amazing news for Hillary (a red state going blue or blue states going even bluer), while Colorado is equally bad news for her (a blue state going red). Interestingly though, four out of those five states are swing/battleground/purple states. Meaning that we're not seeing a further polarization of the electorate in most states - at least not this far.
Current update as of June 19.
Title: Re: 2016 Official Polling Map Thread
Post by: pbrower2a on June 19, 2014, 01:18:17 PM
North Carolina, PPP:
Clinton- 45%
Bush- 44%
Clinton- 46%
Huckabee- 43%
Clinton- 46%
Paul- 43%
Clinton- 45%
Christie- 41%
http://www.publicpolicypolling.com/main/2014/06/north-carolina-miscellany.html#more
Hillary Clinton vs. Jeb Bush
()
Hillary Clinton vs. Chris Christie
( )
)
Hillary Clinton vs. Mike Huckabee
(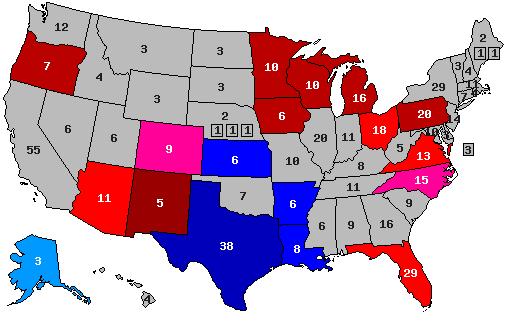 )
)
Hillary Clinton vs. Rand Paul
( )
)
blue, Republican -- red, Democratic
30% -- lead with 40-49% but a margin of 3% or less
40% -- lead with 40-49% but a margin of 4% or more
60% -- lead with 50-54%
70% -- lead with 55-59%
90% -- lead with 60% or more
Clinton- 45%
Bush- 44%
Clinton- 46%
Huckabee- 43%
Clinton- 46%
Paul- 43%
Clinton- 45%
Christie- 41%
http://www.publicpolicypolling.com/main/2014/06/north-carolina-miscellany.html#more
Hillary Clinton vs. Jeb Bush
(
Hillary Clinton vs. Chris Christie
(
Hillary Clinton vs. Mike Huckabee
(
Hillary Clinton vs. Rand Paul
(
blue, Republican -- red, Democratic
30% -- lead with 40-49% but a margin of 3% or less
40% -- lead with 40-49% but a margin of 4% or more
60% -- lead with 50-54%
70% -- lead with 55-59%
90% -- lead with 60% or more
Title: Re: 2016 Official Polling Map Thread
Post by: pbrower2a on June 23, 2014, 06:55:56 AM
Iowa, Quinnipiac.
http://www.quinnipiac.edu/news-and-events/quinnipiac-university-poll/iowa/release-detail?ReleaseID=2055
Hillary Clinton is slipping a little in Iowa, at least from its last poll of Iowa. She would likely win the state more by an Obama 2012 level than by the landslide margins projected earlier.
I do not extrapolate unless some event causes one to question the overall competence or credibility of a political figure.
Hillary Clinton vs. Jeb Bush
()
Hillary Clinton vs. Chris Christie
()
Hillary Clinton vs. Mike Huckabee
( )
)
Hillary Clinton vs. Rand Paul
(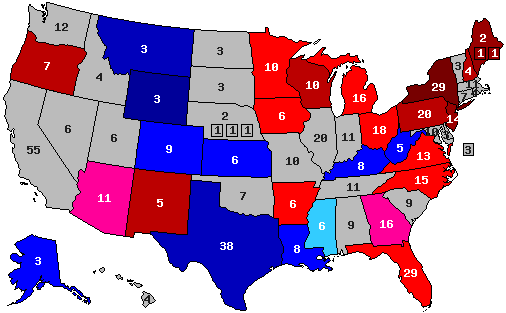 )
)
blue, Republican -- red, Democratic
30% -- lead with 40-49% but a margin of 3% or less
40% -- lead with 40-49% but a margin of 4% or more
60% -- lead with 50-54%
70% -- lead with 55-59%
90% -- lead with 60% or more
Quote
New Jersey Gov. Christopher Christie is inching his way back into the 2016 presidential race in Iowa and now trails former Secretary of State Hillary Clinton 44 - 36 percent, according to a Quinnipiac University poll released today.
This compares to a 48 - 35 percent Clinton lead in a March 13 survey by the independent Quinnipiac (KWIN-uh-pe-ack) University.
Secretary Clinton tops other possible Republican 2016 contenders:
46 - 40 percent over U.S. Sen. Rand Paul of Kentucky;
46 - 39 percent over former Arkansas Gov. Mike Huckabee;
49 - 36 percent over former Florida Gov. Jeb Bush;
47 - 41 percent over U.S. Rep. Paul Ryan of Wisconsin.
http://www.quinnipiac.edu/news-and-events/quinnipiac-university-poll/iowa/release-detail?ReleaseID=2055
Hillary Clinton is slipping a little in Iowa, at least from its last poll of Iowa. She would likely win the state more by an Obama 2012 level than by the landslide margins projected earlier.
I do not extrapolate unless some event causes one to question the overall competence or credibility of a political figure.
Hillary Clinton vs. Jeb Bush
(
Hillary Clinton vs. Chris Christie
(
Hillary Clinton vs. Mike Huckabee
(
Hillary Clinton vs. Rand Paul
(
blue, Republican -- red, Democratic
30% -- lead with 40-49% but a margin of 3% or less
40% -- lead with 40-49% but a margin of 4% or more
60% -- lead with 50-54%
70% -- lead with 55-59%
90% -- lead with 60% or more
Title: Re: 2016 Official Polling Map Thread
Post by: eric82oslo on June 23, 2014, 11:04:05 AM
Quinnipiac has just polled 5 GOPers against Hillary in Iowa, resulting in the 12th 2016 poll of Iowa. In total, 10 GOP candidates have been tested in Iowa. However, two of them, Bobby Jindal and Mike Pence, have just been tried out once. With this new poll, Christie's best man position in the state, against his main rival Huckabee, increases further. Christie is now trailing Hillary in Iowa by an average of -4.2%, up from -3.8% previously. Also Jindal and Huckabee are still trailing her by less than 5%. Here's the breakdown of average Iowa match-ups by GOP candidate:
Christie: -4.2%
Jindal: -4.7% (1 poll only)
Huckabee: -4.92%
Ryan: -6.03%
Walker: -6.25%
Rand Paul: -6.33%
Rubio: -7.3%
Bush: -8.09%
Cruz: -9.23%
Mike Pence: -11.8% (1 poll only)
Also, a SurveyUSA poll of Florida testing Rubio against Hillary doesn't change anything. Jeb is still the stronger GOP candidate in the state.
Finally, I've updated the New Jersey numbers to once again include the exit poll match up, which I had lost for a while. Meaning that Hillary's lead over Christie in New Jersey slips back from +10.5% to +9.6%.
The total number of state polls included in the lists below has thus now reached 132.
So here they are - all the 2016 poll averages for each state so far - 29 states having been polled to date - and how far off they are compared to the actual 2012 outcomes. I'm only including the Republican candidate with the best statewide polling.
Alaska: Hillary vs Jeb Bush: R +7%
+7% D improvement
(Updated on May 14, 2014)
Arizona: Hillary vs Bush: R +1%
+8% D improvement
(Updated on March 6, 2014)
Arkansas: Hillary vs Mike Huckabee: R +3%
+17% D improvement
(Updated on May 5, 2014)
Colorado: Hillary vs Paul Ryan: R +3.5%
+8.9% R improvement
Current Republican gain
(Updated on April 25, 2014)
Florida: Hillary vs Bush: D +5.7%
+4.8% D improvement
(Updated on June 25, 2014)
Georgia: Hillary vs Christie: R +2%
+6% D improvement
(Updated August 8, 2013)
Iowa: Hillary vs Christie: D +4.2%
+1.6% R improvement
(Updated on June 23, 2014)
Kansas: Hillary vs Bush: R +9%
+13% D improvement
(Updated on February 24, 2014)
Kentucky: Hillary vs Christie/Bush: R +4%
+19% D improvement
(Updated on May 18, 2014)
Louisiana: Hillary vs Huckabee: R +5%
+12% D improvement
(Updated on February 18, 2014)
Maine: Hillary vs Christie: D +8%
+7% R improvement
(Updated on November 13, 2013)
Michigan: Hillary vs Christie: D +4.8%
+4.7% R improvement
(Updated on April 9, 2014)
Minnesota: Hillary vs Tim Pawlenty: D +6%
+2% R improvement
(Updated on June 18, 2014)
Mississippi: Hillary vs Christie: R +9%
+2.5% D improvement
(Updated on November 19, 2013)
Montana: Hillary vs Rand Paul: R +13%
+1% D improvement
(Updated on November 24, 2013)
New Hampshire: Hillary vs Huckabee: D +2.1%
+3.5% R improvement
(Updated on May 12, 2014)
New Jersey: Hillary vs Christie: D +9.6%
+8.2% R improvement
(Updated on March 4, 2014; includes governor exit poll)
New Mexico: Hillary vs Susana Martinez: D +14%
+4% D improvement
(Updated on March 27, 2014)
New York: Hillary vs Christie: D +28%
+0.2% R improvement
(Updated on March 4, 2014)
North Carolina: Hillary vs Christie: D +1.25%
+3.3% D improvement
Current Democratic gain
(Updated on June 19, 2014)
Ohio: Hillary vs Christie: D +6.2%
+3.2% D improvement
(Updated on May 15, 2014)
Oregon: Hillary vs Rand Paul/Huckabee: D +12%
Unchanged from 2012
(Updated on May 30, 2014)
Pennsylvania: Hillary vs Christie: D +3.5%
+1.9% R improvement
(Updated on June 5, 2014)
South Carolina: Hillary vs Marco Rubio: R +7%
+3.5% D improvement
(Updated on November 2, 2013)
Texas: Hillary vs Huckabee: R +8%
+8% D improvement
(Updated on April 18, 2014)
Virginia: Hillary vs Christie: D +3.22%
+0.6% R improvement
(Updated on March 27, 2014)
West Virginia: Hillary vs Bush: R +14%
+13% D improvement
(Updated on October 1, 2013)
Wisconsin: Hillary vs Ryan: D +5.1%
+1.8% R improvement
(Updated on April 25, 2014)
Wyoming: Hillary vs Christie: R +28%
+13% D improvement
(Updated on July 23, 2013)
Average all 29 states: Hillary vs Best Republican: D +0.01%
+3.4% D improvement (from Obama 2012) [projecting a 7.2% victory for Hillary]
That gives us this map right now:
()
Red = Democratic lead or trend
Blue = Republican lead or trend
Green = Exact tie or no trend, unchanged from 2012
Grey = No polling yet
Green = toss up
20% shade = 0.1-1% lead
30% shade = 1.1-3% lead
40% shade = 3.1-6% lead
50% shade = 6.1-9% lead
60% shade = 9.1-12% lead
70% shade = 12.1-15% lead
80% shade = 15.1-18% lead
90% shade = Above 18.1% lead
In the count of electoral votes, this means the current situation looks like this:
Hillary: 216 EVs (for a total of 15 states)
Best/Tailormade Republican: 120 EVs (for a total of 14 states)
Toss-up: None
No polling: 202 EVs (for a total of 21 states + D.C.)
Which means that Hillary has captured a rather impressive 64.3% of all EVs awarded thus far, against a disappointing 35.7% EVs for the tailormade Republican. Even as the biggest price by far, California, hasn't been added yet.
This is how the Trendline Map looks so far:
()
The states which right now are showing the strongest improvement for the Democratic (Hillary) or the Republican candidate (in 13 out of 29 cases, Christie is that person):
1. Kentucky: D +19%
2. Arkansas: D +17%
3. Kansas: D +13%
4. West Virginia: D +13%
5. Wyoming: D +13%
6. Louisiana: D +12%
7. Colorado: R +8.9%
8. New Jersey: R +8.2%
9. Arizona: D +8%
10. Texas: D +8%
11. Maine: R +7%
12. Alaska: D +7%
13. Georgia: D +6%
14. Florida: D +4.8%
15. Michigan: R +4.7%
All of these changes (in the 15 states above) are (more than) statistically significant.
The whole list of states having been polled till now, going from Democratic stronghold to Republican stronghold:
New York: D +28%
New Mexico: D +14%
Oregon: D +12%
New Jersey: D +9.6%
Maine: D +8%
Currently estimated/projected national average: D +7.2%
Ohio: D +6.2%
Minnesota: D +6%
Florida: D +5.7%
Wisconsin: D +5.1%
Michigan: D +4.8%
Iowa: D +4.2%
Pennsylvania: D +3.5%
Virginia: D +3.2%
New Hampshire: D +2.1%
North Carolina: D +1.25%
Arizona: R +1%
Georgia: R +2%
Arkansas: R +3%
Colorado: R +3.5%
Kentucky: R +4%
Louisiana: R +5%
Alaska: R +7%
South Carolina: R +7%
Texas: R +8%
Mississippi: R +9%
Kansas: R +9%
Montana: R +13%
West Virginia: R +14%
Wyoming: R +28%
Here are the current stats on the best-tailored Republican candidates in all states polled so far:
1. Chris Christie favoured in 13 of 29 states (for 165 EVs)
2. Mike Huckabee in 5 states (Texas (!), Louisiana (!), Oregon (shared), Arkansas & New Hampshire (!) - for 63 EVs)
3. Jeb Bush favoured in 6 states (Florida, Arizona, Kentucky (!!) (shared), Kansas, West Virginia & Alaska - for 62 EVs)
4. Paul Ryan favoured in 2 states (Wisconsin & Colorado - for 19 EVs)
5. Rand Paul favoured in 2 states (Oregon (shared) & Montana - for 10 EVs)
6. Tim Pawlenty favoured in 1 state (Minnesota - for 10 EVs)
7. Marco Rubio favoured in 1 state (South Carolina - for 9 EVs)
8. Susana Martinez favoured in 1 state (New Mexico - for 5 EVs)
Current update as of June 25.
Christie: -4.2%
Jindal: -4.7% (1 poll only)
Huckabee: -4.92%
Ryan: -6.03%
Walker: -6.25%
Rand Paul: -6.33%
Rubio: -7.3%
Bush: -8.09%
Cruz: -9.23%
Mike Pence: -11.8% (1 poll only)
Also, a SurveyUSA poll of Florida testing Rubio against Hillary doesn't change anything. Jeb is still the stronger GOP candidate in the state.
Finally, I've updated the New Jersey numbers to once again include the exit poll match up, which I had lost for a while. Meaning that Hillary's lead over Christie in New Jersey slips back from +10.5% to +9.6%.
The total number of state polls included in the lists below has thus now reached 132.
So here they are - all the 2016 poll averages for each state so far - 29 states having been polled to date - and how far off they are compared to the actual 2012 outcomes. I'm only including the Republican candidate with the best statewide polling.
Alaska: Hillary vs Jeb Bush: R +7%
+7% D improvement
(Updated on May 14, 2014)
Arizona: Hillary vs Bush: R +1%
+8% D improvement
(Updated on March 6, 2014)
Arkansas: Hillary vs Mike Huckabee: R +3%
+17% D improvement
(Updated on May 5, 2014)
Colorado: Hillary vs Paul Ryan: R +3.5%
+8.9% R improvement
Current Republican gain
(Updated on April 25, 2014)
Florida: Hillary vs Bush: D +5.7%
+4.8% D improvement
(Updated on June 25, 2014)
Georgia: Hillary vs Christie: R +2%
+6% D improvement
(Updated August 8, 2013)
Iowa: Hillary vs Christie: D +4.2%
+1.6% R improvement
(Updated on June 23, 2014)
Kansas: Hillary vs Bush: R +9%
+13% D improvement
(Updated on February 24, 2014)
Kentucky: Hillary vs Christie/Bush: R +4%
+19% D improvement
(Updated on May 18, 2014)
Louisiana: Hillary vs Huckabee: R +5%
+12% D improvement
(Updated on February 18, 2014)
Maine: Hillary vs Christie: D +8%
+7% R improvement
(Updated on November 13, 2013)
Michigan: Hillary vs Christie: D +4.8%
+4.7% R improvement
(Updated on April 9, 2014)
Minnesota: Hillary vs Tim Pawlenty: D +6%
+2% R improvement
(Updated on June 18, 2014)
Mississippi: Hillary vs Christie: R +9%
+2.5% D improvement
(Updated on November 19, 2013)
Montana: Hillary vs Rand Paul: R +13%
+1% D improvement
(Updated on November 24, 2013)
New Hampshire: Hillary vs Huckabee: D +2.1%
+3.5% R improvement
(Updated on May 12, 2014)
New Jersey: Hillary vs Christie: D +9.6%
+8.2% R improvement
(Updated on March 4, 2014; includes governor exit poll)
New Mexico: Hillary vs Susana Martinez: D +14%
+4% D improvement
(Updated on March 27, 2014)
New York: Hillary vs Christie: D +28%
+0.2% R improvement
(Updated on March 4, 2014)
North Carolina: Hillary vs Christie: D +1.25%
+3.3% D improvement
Current Democratic gain
(Updated on June 19, 2014)
Ohio: Hillary vs Christie: D +6.2%
+3.2% D improvement
(Updated on May 15, 2014)
Oregon: Hillary vs Rand Paul/Huckabee: D +12%
Unchanged from 2012
(Updated on May 30, 2014)
Pennsylvania: Hillary vs Christie: D +3.5%
+1.9% R improvement
(Updated on June 5, 2014)
South Carolina: Hillary vs Marco Rubio: R +7%
+3.5% D improvement
(Updated on November 2, 2013)
Texas: Hillary vs Huckabee: R +8%
+8% D improvement
(Updated on April 18, 2014)
Virginia: Hillary vs Christie: D +3.22%
+0.6% R improvement
(Updated on March 27, 2014)
West Virginia: Hillary vs Bush: R +14%
+13% D improvement
(Updated on October 1, 2013)
Wisconsin: Hillary vs Ryan: D +5.1%
+1.8% R improvement
(Updated on April 25, 2014)
Wyoming: Hillary vs Christie: R +28%
+13% D improvement
(Updated on July 23, 2013)
Average all 29 states: Hillary vs Best Republican: D +0.01%
+3.4% D improvement (from Obama 2012) [projecting a 7.2% victory for Hillary]
That gives us this map right now:
(
Red = Democratic lead or trend
Blue = Republican lead or trend
Green = Exact tie or no trend, unchanged from 2012
Grey = No polling yet
Green = toss up
20% shade = 0.1-1% lead
30% shade = 1.1-3% lead
40% shade = 3.1-6% lead
50% shade = 6.1-9% lead
60% shade = 9.1-12% lead
70% shade = 12.1-15% lead
80% shade = 15.1-18% lead
90% shade = Above 18.1% lead
In the count of electoral votes, this means the current situation looks like this:
Hillary: 216 EVs (for a total of 15 states)
Best/Tailormade Republican: 120 EVs (for a total of 14 states)
Toss-up: None
No polling: 202 EVs (for a total of 21 states + D.C.)
Which means that Hillary has captured a rather impressive 64.3% of all EVs awarded thus far, against a disappointing 35.7% EVs for the tailormade Republican. Even as the biggest price by far, California, hasn't been added yet.
This is how the Trendline Map looks so far:
(
The states which right now are showing the strongest improvement for the Democratic (Hillary) or the Republican candidate (in 13 out of 29 cases, Christie is that person):
1. Kentucky: D +19%
2. Arkansas: D +17%
3. Kansas: D +13%
4. West Virginia: D +13%
5. Wyoming: D +13%
6. Louisiana: D +12%
7. Colorado: R +8.9%
8. New Jersey: R +8.2%
9. Arizona: D +8%
10. Texas: D +8%
11. Maine: R +7%
12. Alaska: D +7%
13. Georgia: D +6%
14. Florida: D +4.8%
15. Michigan: R +4.7%
All of these changes (in the 15 states above) are (more than) statistically significant.
The whole list of states having been polled till now, going from Democratic stronghold to Republican stronghold:
New York: D +28%
New Mexico: D +14%
Oregon: D +12%
New Jersey: D +9.6%
Maine: D +8%
Currently estimated/projected national average: D +7.2%
Ohio: D +6.2%
Minnesota: D +6%
Florida: D +5.7%
Wisconsin: D +5.1%
Michigan: D +4.8%
Iowa: D +4.2%
Pennsylvania: D +3.5%
Virginia: D +3.2%
New Hampshire: D +2.1%
North Carolina: D +1.25%
Arizona: R +1%
Georgia: R +2%
Arkansas: R +3%
Colorado: R +3.5%
Kentucky: R +4%
Louisiana: R +5%
Alaska: R +7%
South Carolina: R +7%
Texas: R +8%
Mississippi: R +9%
Kansas: R +9%
Montana: R +13%
West Virginia: R +14%
Wyoming: R +28%
Here are the current stats on the best-tailored Republican candidates in all states polled so far:
1. Chris Christie favoured in 13 of 29 states (for 165 EVs)
2. Mike Huckabee in 5 states (Texas (!), Louisiana (!), Oregon (shared), Arkansas & New Hampshire (!) - for 63 EVs)
3. Jeb Bush favoured in 6 states (Florida, Arizona, Kentucky (!!) (shared), Kansas, West Virginia & Alaska - for 62 EVs)
4. Paul Ryan favoured in 2 states (Wisconsin & Colorado - for 19 EVs)
5. Rand Paul favoured in 2 states (Oregon (shared) & Montana - for 10 EVs)
6. Tim Pawlenty favoured in 1 state (Minnesota - for 10 EVs)
7. Marco Rubio favoured in 1 state (South Carolina - for 9 EVs)
8. Susana Martinez favoured in 1 state (New Mexico - for 5 EVs)
Current update as of June 25.
Title: Re: 2016 Official Polling Map Thread
Post by: eric82oslo on June 24, 2014, 10:45:43 AM
Who's ahead and in how many states?
1. Hillary is leading in 15 states (Florida, New York, Pennsylvania, Ohio, Michigan, North Carolina, New Jersey, Virginia, Wisconsin, Minnesota, Oregon, Iowa, New Mexico, New Hampshire & Maine)
for a total of 216 EVs
2. Huckabee is leading in 3 states (Texas, Louisiana & Arkansas) for a total of 52 EVs
3. Jeb Bush is leading in 5 states (Arizona, Kentucky, Kansas, West Virginia & Alaska)
for a total of 33 EVs
4. Christie is leading in 4 states (Georgia, Kentucky, Mississippi & Wyoming) for a total of 33 EVs
5. Ryan is leading in 1 state (Colorado) for a total of 9 EVs
6. Rubio is leading in 1 state (South Carolina) for a total of 9 EVs
7. Rand Paul is leading in 1 state (Montana) for a total of 3 EVs
Title: Re: 2016 Official Polling Map Thread
Post by: pbrower2a on June 25, 2014, 02:06:04 PM
Maybe Field will slip in a poll of California. No big surprises would be likely -- but the state has 55 electoral votes.
Title: Re: 2016 Official Polling Map Thread
Post by: eric82oslo on June 25, 2014, 06:25:32 PM
PPP is going to poll Michigan and Louisiana this weekend. :D
Will Huckabee still be "far" ahead of Hillary in Louisiana?
And will Christie's decent numbers start to slip a bit in Michigan?
Will Huckabee still be "far" ahead of Hillary in Louisiana?
And will Christie's decent numbers start to slip a bit in Michigan?
Title: Re: 2016 Official Polling Map Thread
Post by: eric82oslo on June 25, 2014, 08:27:54 PM
2014 Senate election states where we still haven't had a single poll (waiting patiently for these states finally to be polled for 2016):
*Alabama
*Delaware
*Hawaii
*Idaho
*Illinois
*Massachusetts
*Nebraska
*Oklahoma
*Rhode Island
*South Dakota
*Tennessee
States where we've already had polls, yet there are no Senate elections this year (now this is neat, thanks pollsters!):
*Arizona
*Florida
*New York
*Ohio
*Pennsylvania
*Wisconsin
States where we still don't have any polls and where there are no Senate elections this year (and where we'll probably get no 2016 polls until November/December the earliest):
*California
*Connecticut
*Indiana
*Maryland
*Missouri
*Nevada
*North Dakota
*Utah
*Vermont
*Washington
That's it. :)
The remaining 23 states have all already been both 2016-polled (at least once; some up to 12 times) and will have at least one Senate race to be decided this year as well.
Title: Re: 2016 Official Polling Map Thread
Post by: pbrower2a on July 02, 2014, 12:09:50 PM
PPP poll of Michigan:
http://www.publicpolicypolling.com/main/2014/07/michigan-miscellany.html
Clinton 47%
Bush 37%
Clinton 48%
Christie 35%
Clinton 50%
Cruz 34%
Clinton 48%
Huckabee 36%
Clinton 47%
Paul 37%
Hillary Clinton vs. Jeb Bush
()
Hillary Clinton vs. Chris Christie
()
Hillary Clinton vs. Mike Huckabee
( )
)
Hillary Clinton vs. Rand Paul
()
blue, Republican -- red, Democratic
30% -- lead with 40-49% but a margin of 3% or less
40% -- lead with 40-49% but a margin of 4% or more
60% -- lead with 50-54%
70% -- lead with 55-59%
90% -- lead with 60% or more
http://www.publicpolicypolling.com/main/2014/07/michigan-miscellany.html
Clinton 47%
Bush 37%
Clinton 48%
Christie 35%
Clinton 50%
Cruz 34%
Clinton 48%
Huckabee 36%
Clinton 47%
Paul 37%
Hillary Clinton vs. Jeb Bush
(
Hillary Clinton vs. Chris Christie
(
Hillary Clinton vs. Mike Huckabee
(
Hillary Clinton vs. Rand Paul
(
blue, Republican -- red, Democratic
30% -- lead with 40-49% but a margin of 3% or less
40% -- lead with 40-49% but a margin of 4% or more
60% -- lead with 50-54%
70% -- lead with 55-59%
90% -- lead with 60% or more
Title: Re: 2016 Official Polling Map Thread
Post by: eric82oslo on July 02, 2014, 02:08:39 PM
Try updating Michigan again for Huckabee, pbrower. :P
I doubt Hillary leads in pink fashion against her Arkansas arch rival. :P
I doubt Hillary leads in pink fashion against her Arkansas arch rival. :P
Title: Re: 2016 Official Polling Map Thread
Post by: eric82oslo on July 03, 2014, 03:53:45 AM
PPP released its 5th Michigan poll yesterday, which is also the 8th overall match up poll from the state this season, regardless of pollster. Despite a horrific dump in this one particular poll for Christie, he still continues to lead the GOP field in the state. However, Hillary's lead on him has increased by 1.3%, from +4.8% to +6.1%. Not much worse is Paul Ryan, trailing her by "just" 7%. Worst of the pack is Rubio doing, trailing her by an eye-popping 15.5%. Here's how each of the 7 tested GOP candidates are doing against Hillary on average in Michigan:
Chris Christie: -6.1%
Paul Ryan: -7%
Jeb Bush: -9.75%
Rand Paul: -10.6%
Mike Huckabee: -12%
Ted Cruz: -12.3%
Marco Rubio: -15.5%
With this latest update, Michigan should no longer be considered the the most likely 2016 tipping point state.
I've also slightly tweaked the colour intervals for the lead and trend maps, making toss-ups now include all leads up to 0.5%.
The total number of state polls included in the lists below has thus now reached 133.
So here they are - all the 2016 poll averages for each state so far - 29 states having been polled to date - and how far off they are compared to the actual 2012 outcomes. I'm only including the Republican candidate with the best statewide polling.
Alaska: Hillary vs Jeb Bush: R +7%
+7% D improvement
(Updated on May 14, 2014)
Arizona: Hillary vs Bush: R +1%
+8% D improvement
(Updated on March 6, 2014)
Arkansas: Hillary vs Mike Huckabee: R +3%
+17% D improvement
(Updated on May 5, 2014)
Colorado: Hillary vs Paul Ryan: R +3.5%
+8.9% R improvement
Current Republican gain
(Updated on April 25, 2014)
Florida: Hillary vs Bush: D +5.7%
+4.8% D improvement
(Updated on June 25, 2014)
Georgia: Hillary vs Christie: R +2%
+6% D improvement
(Updated August 8, 2013)
Iowa: Hillary vs Christie: D +4.2%
+1.6% R improvement
(Updated on June 23, 2014)
Kansas: Hillary vs Bush: R +9%
+13% D improvement
(Updated on February 24, 2014)
Kentucky: Hillary vs Christie/Bush: R +4%
+19% D improvement
(Updated on May 18, 2014)
Louisiana: Hillary vs Huckabee: R +5%
+12% D improvement
(Updated on February 18, 2014)
Maine: Hillary vs Christie: D +8%
+7% R improvement
(Updated on November 13, 2013)
Michigan: Hillary vs Christie: D +6.1%
+3.4% R improvement
(Updated on June 3, 2014)
Minnesota: Hillary vs Tim Pawlenty: D +6%
+2% R improvement
(Updated on June 18, 2014)
Mississippi: Hillary vs Christie: R +9%
+2.5% D improvement
(Updated on November 19, 2013)
Montana: Hillary vs Rand Paul: R +13%
+1% D improvement
(Updated on November 24, 2013)
New Hampshire: Hillary vs Huckabee: D +2.1%
+3.5% R improvement
(Updated on May 12, 2014)
New Jersey: Hillary vs Christie: D +9.6%
+8.2% R improvement
(Updated on March 4, 2014; includes governor exit poll)
New Mexico: Hillary vs Susana Martinez: D +14%
+4% D improvement
(Updated on March 27, 2014)
New York: Hillary vs Christie: D +28%
+0.2% R improvement
(Updated on March 4, 2014)
North Carolina: Hillary vs Christie: D +1.25%
+3.3% D improvement
Current Democratic gain
(Updated on June 19, 2014)
Ohio: Hillary vs Christie: D +6.2%
+3.2% D improvement
(Updated on May 15, 2014)
Oregon: Hillary vs Rand Paul/Huckabee: D +12%
Unchanged from 2012
(Updated on May 30, 2014)
Pennsylvania: Hillary vs Christie: D +3.5%
+1.9% R improvement
(Updated on June 5, 2014)
South Carolina: Hillary vs Marco Rubio: R +7%
+3.5% D improvement
(Updated on November 2, 2013)
Texas: Hillary vs Huckabee: R +8%
+8% D improvement
(Updated on April 18, 2014)
Virginia: Hillary vs Christie: D +3.2%
+0.6% R improvement
(Updated on March 27, 2014)
West Virginia: Hillary vs Bush: R +14%
+13% D improvement
(Updated on October 1, 2013)
Wisconsin: Hillary vs Ryan: D +5.1%
+1.8% R improvement
(Updated on April 25, 2014)
Wyoming: Hillary vs Christie: R +28%
+13% D improvement
(Updated on July 23, 2013)
Average all 29 states: Hillary vs Best Republican: D +0.05%
+3.4% D improvement (from Obama 2012) [projecting a 7.3% victory for Hillary]
That gives us this map right now:
( )
)
Red = Democratic lead or trend
Blue = Republican lead or trend
Green = Basically tied or hardly any trend, unchanged from 2012
Grey = No polling yet
Green = toss up or less than 0.5% lead
20% shade = 0.6-2% lead
30% shade = 2.1-4% lead
40% shade = 4.1-6% lead
50% shade = 6.1-9% lead
60% shade = 9.1-12% lead
70% shade = 12.1-15% lead
80% shade = 15.1-18% lead
90% shade = Above 18.1% lead
In the count of electoral votes, this means the current situation looks like this:
Hillary: 216 EVs (for a total of 15 states)
Best/Tailormade Republican: 120 EVs (for a total of 14 states)
Toss-up: None
No polling: 202 EVs (for a total of 21 states + D.C.)
Which means that Hillary has captured a rather impressive 64.3% of all EVs awarded thus far, against a disappointing 35.7% EVs for the tailormade Republican. Even as the biggest price by far, California, hasn't been added yet.
This is how the Trendline Map looks so far:
(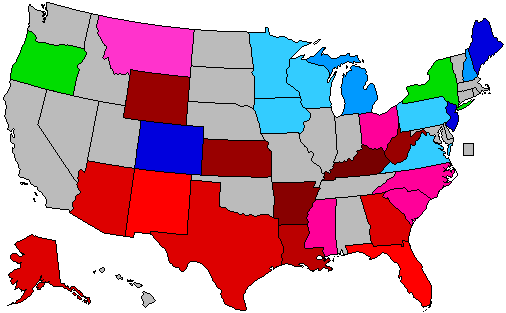 )
)
The states which right now are showing the strongest improvement for the Democratic (Hillary) or the Republican candidate (in 13 out of 29 cases, Christie is that person):
1. Kentucky: D +19%
2. Arkansas: D +17%
3. Kansas: D +13%
4. West Virginia: D +13%
5. Wyoming: D +13%
6. Louisiana: D +12%
7. Colorado: R +8.9%
8. New Jersey: R +8.2%
9. Arizona: D +8%
10. Texas: D +8%
11. Maine: R +7%
12. Alaska: D +7%
13. Georgia: D +6%
14. Florida: D +4.8%
All of these changes (in the 14 states above) are (more than) statistically significant.
The whole list of states having been polled till now, going from Democratic stronghold to Republican stronghold:
New York: D +28%
New Mexico: D +14%
Oregon: D +12%
New Jersey: D +9.6%
Maine: D +8%
Currently estimated/projected national average: D +7.3%
Ohio: D +6.2%
Michigan: D +6.1%
Minnesota: D +6%
Florida: D +5.7%
Wisconsin: D +5.1%
Iowa: D +4.2%
Pennsylvania: D +3.5%
Virginia: D +3.2%
New Hampshire: D +2.1%
North Carolina: D +1.25%
Arizona: R +1%
Georgia: R +2%
Arkansas: R +3%
Colorado: R +3.5%
Kentucky: R +4%
Louisiana: R +5%
Alaska: R +7%
South Carolina: R +7%
Texas: R +8%
Mississippi: R +9%
Kansas: R +9%
Montana: R +13%
West Virginia: R +14%
Wyoming: R +28%
Here are the current stats on the best-tailored Republican candidates in all states polled so far:
1. Chris Christie favoured in 13 of 29 states (for 165 EVs)
2. Mike Huckabee in 5 states (Texas (!), Louisiana (!), Oregon (shared), Arkansas & New Hampshire (!) - for 63 EVs)
3. Jeb Bush favoured in 6 states (Florida, Arizona, Kentucky (!!) (shared), Kansas, West Virginia & Alaska - for 62 EVs)
4. Paul Ryan favoured in 2 states (Wisconsin & Colorado - for 19 EVs)
5. Rand Paul favoured in 2 states (Oregon (shared) & Montana - for 10 EVs)
6. Tim Pawlenty favoured in 1 state (Minnesota - for 10 EVs)
7. Marco Rubio favoured in 1 state (South Carolina - for 9 EVs)
8. Susana Martinez favoured in 1 state (New Mexico - for 5 EVs)
Current update as of July 3.
Chris Christie: -6.1%
Paul Ryan: -7%
Jeb Bush: -9.75%
Rand Paul: -10.6%
Mike Huckabee: -12%
Ted Cruz: -12.3%
Marco Rubio: -15.5%
With this latest update, Michigan should no longer be considered the the most likely 2016 tipping point state.
I've also slightly tweaked the colour intervals for the lead and trend maps, making toss-ups now include all leads up to 0.5%.
The total number of state polls included in the lists below has thus now reached 133.
So here they are - all the 2016 poll averages for each state so far - 29 states having been polled to date - and how far off they are compared to the actual 2012 outcomes. I'm only including the Republican candidate with the best statewide polling.
Alaska: Hillary vs Jeb Bush: R +7%
+7% D improvement
(Updated on May 14, 2014)
Arizona: Hillary vs Bush: R +1%
+8% D improvement
(Updated on March 6, 2014)
Arkansas: Hillary vs Mike Huckabee: R +3%
+17% D improvement
(Updated on May 5, 2014)
Colorado: Hillary vs Paul Ryan: R +3.5%
+8.9% R improvement
Current Republican gain
(Updated on April 25, 2014)
Florida: Hillary vs Bush: D +5.7%
+4.8% D improvement
(Updated on June 25, 2014)
Georgia: Hillary vs Christie: R +2%
+6% D improvement
(Updated August 8, 2013)
Iowa: Hillary vs Christie: D +4.2%
+1.6% R improvement
(Updated on June 23, 2014)
Kansas: Hillary vs Bush: R +9%
+13% D improvement
(Updated on February 24, 2014)
Kentucky: Hillary vs Christie/Bush: R +4%
+19% D improvement
(Updated on May 18, 2014)
Louisiana: Hillary vs Huckabee: R +5%
+12% D improvement
(Updated on February 18, 2014)
Maine: Hillary vs Christie: D +8%
+7% R improvement
(Updated on November 13, 2013)
Michigan: Hillary vs Christie: D +6.1%
+3.4% R improvement
(Updated on June 3, 2014)
Minnesota: Hillary vs Tim Pawlenty: D +6%
+2% R improvement
(Updated on June 18, 2014)
Mississippi: Hillary vs Christie: R +9%
+2.5% D improvement
(Updated on November 19, 2013)
Montana: Hillary vs Rand Paul: R +13%
+1% D improvement
(Updated on November 24, 2013)
New Hampshire: Hillary vs Huckabee: D +2.1%
+3.5% R improvement
(Updated on May 12, 2014)
New Jersey: Hillary vs Christie: D +9.6%
+8.2% R improvement
(Updated on March 4, 2014; includes governor exit poll)
New Mexico: Hillary vs Susana Martinez: D +14%
+4% D improvement
(Updated on March 27, 2014)
New York: Hillary vs Christie: D +28%
+0.2% R improvement
(Updated on March 4, 2014)
North Carolina: Hillary vs Christie: D +1.25%
+3.3% D improvement
Current Democratic gain
(Updated on June 19, 2014)
Ohio: Hillary vs Christie: D +6.2%
+3.2% D improvement
(Updated on May 15, 2014)
Oregon: Hillary vs Rand Paul/Huckabee: D +12%
Unchanged from 2012
(Updated on May 30, 2014)
Pennsylvania: Hillary vs Christie: D +3.5%
+1.9% R improvement
(Updated on June 5, 2014)
South Carolina: Hillary vs Marco Rubio: R +7%
+3.5% D improvement
(Updated on November 2, 2013)
Texas: Hillary vs Huckabee: R +8%
+8% D improvement
(Updated on April 18, 2014)
Virginia: Hillary vs Christie: D +3.2%
+0.6% R improvement
(Updated on March 27, 2014)
West Virginia: Hillary vs Bush: R +14%
+13% D improvement
(Updated on October 1, 2013)
Wisconsin: Hillary vs Ryan: D +5.1%
+1.8% R improvement
(Updated on April 25, 2014)
Wyoming: Hillary vs Christie: R +28%
+13% D improvement
(Updated on July 23, 2013)
Average all 29 states: Hillary vs Best Republican: D +0.05%
+3.4% D improvement (from Obama 2012) [projecting a 7.3% victory for Hillary]
That gives us this map right now:
(
Red = Democratic lead or trend
Blue = Republican lead or trend
Green = Basically tied or hardly any trend, unchanged from 2012
Grey = No polling yet
Green = toss up or less than 0.5% lead
20% shade = 0.6-2% lead
30% shade = 2.1-4% lead
40% shade = 4.1-6% lead
50% shade = 6.1-9% lead
60% shade = 9.1-12% lead
70% shade = 12.1-15% lead
80% shade = 15.1-18% lead
90% shade = Above 18.1% lead
In the count of electoral votes, this means the current situation looks like this:
Hillary: 216 EVs (for a total of 15 states)
Best/Tailormade Republican: 120 EVs (for a total of 14 states)
Toss-up: None
No polling: 202 EVs (for a total of 21 states + D.C.)
Which means that Hillary has captured a rather impressive 64.3% of all EVs awarded thus far, against a disappointing 35.7% EVs for the tailormade Republican. Even as the biggest price by far, California, hasn't been added yet.
This is how the Trendline Map looks so far:
(
The states which right now are showing the strongest improvement for the Democratic (Hillary) or the Republican candidate (in 13 out of 29 cases, Christie is that person):
1. Kentucky: D +19%
2. Arkansas: D +17%
3. Kansas: D +13%
4. West Virginia: D +13%
5. Wyoming: D +13%
6. Louisiana: D +12%
7. Colorado: R +8.9%
8. New Jersey: R +8.2%
9. Arizona: D +8%
10. Texas: D +8%
11. Maine: R +7%
12. Alaska: D +7%
13. Georgia: D +6%
14. Florida: D +4.8%
All of these changes (in the 14 states above) are (more than) statistically significant.
The whole list of states having been polled till now, going from Democratic stronghold to Republican stronghold:
New York: D +28%
New Mexico: D +14%
Oregon: D +12%
New Jersey: D +9.6%
Maine: D +8%
Currently estimated/projected national average: D +7.3%
Ohio: D +6.2%
Michigan: D +6.1%
Minnesota: D +6%
Florida: D +5.7%
Wisconsin: D +5.1%
Iowa: D +4.2%
Pennsylvania: D +3.5%
Virginia: D +3.2%
New Hampshire: D +2.1%
North Carolina: D +1.25%
Arizona: R +1%
Georgia: R +2%
Arkansas: R +3%
Colorado: R +3.5%
Kentucky: R +4%
Louisiana: R +5%
Alaska: R +7%
South Carolina: R +7%
Texas: R +8%
Mississippi: R +9%
Kansas: R +9%
Montana: R +13%
West Virginia: R +14%
Wyoming: R +28%
Here are the current stats on the best-tailored Republican candidates in all states polled so far:
1. Chris Christie favoured in 13 of 29 states (for 165 EVs)
2. Mike Huckabee in 5 states (Texas (!), Louisiana (!), Oregon (shared), Arkansas & New Hampshire (!) - for 63 EVs)
3. Jeb Bush favoured in 6 states (Florida, Arizona, Kentucky (!!) (shared), Kansas, West Virginia & Alaska - for 62 EVs)
4. Paul Ryan favoured in 2 states (Wisconsin & Colorado - for 19 EVs)
5. Rand Paul favoured in 2 states (Oregon (shared) & Montana - for 10 EVs)
6. Tim Pawlenty favoured in 1 state (Minnesota - for 10 EVs)
7. Marco Rubio favoured in 1 state (South Carolina - for 9 EVs)
8. Susana Martinez favoured in 1 state (New Mexico - for 5 EVs)
Current update as of July 3.
Title: Re: 2016 Official Polling Map Thread
Post by: eric82oslo on July 03, 2014, 04:29:37 AM
Updated today, June 3!
To find out which state would be the most likely tipping point state in 2016 based on all the data gathered so far, I've worked out this list of states going from likely Democratic to likely Republican (assuming that the non-polled states stay the same as in 2012):
1. D.C. - 3 EVs (still not polled)
2. Hawaii - 7 EVs (accumulated) (still not polled)
3. Vermont - 10 EVs (still not polled)
4. New York - 39 EVs
5. Rhode Island - 43 EVs (still not polled)
6. Maryland - 53 EVs (still not polled)
7. Massachusetts - 64 EVs (still not polled)
8. California - 119 EVs (still not polled)
9. Delaware - 122 EVs (still not polled)
10. Connecticut - 129 EVs (still not polled)
11. Illinois - 149 EVs (still not polled)
12. Washington - 161 EVs (still not polled)
13. New Mexico - 166 EVs
14. Oregon - 173 EVs
15. New Jersey - 187 EVs
16. Maine - 191 EVs
17. Nevada - 197 EVs (still not polled for 2016!)
18. Ohio - 215 EVs
19. Michigan - 231 EVs
20. Minnesota - 241 EVs
21. Florida - 270 EVs - currently the most likely tipping point state
22. Wisconsin - 280 EVs
23. Iowa - 286 EVs
24. Pennsylvania - 306 EVs
25. Virginia - 319 EVs
26. New Hampshire - 323 EVs
27. North Carolina - 338 EVs
---current red/blue divide---
28. Arizona - 349 EVs
29. Georgia - 365 EVs
30. Arkansas - 371 EVs
31. Colorado - 380 EVs
32. Kentucky - 388 EVs
33. Louisiana - 396 EVs
34. South Carolina - 405 EVs
35. Alaska - 408 EVs
36. Texas - 446 EVs
37. Mississippi - 452 EVs
38. Kansas - 458 EVs
39. Missouri - 468 EVs (still not polled)
40. Indiana - 479 EVs (still not polled)
41. Montana - 482 EVs
42. West Virginia - 487 EVs
43. South Dakota - 490 EVs (still not polled)
44. North Dakota - 493 EVs (still not polled)
45. Tennessee - 504 EVs (still not polled)
46. Nebraska - 509 EVs (still not polled)
47. Alabama - 518 EVs (still not polled)
48. Wyoming - 521 EVs
49. Idaho - 525 EVs (still not polled)
50. Oklahoma - 532 EVs (still not polled)
51. Utah - 538 EVs (still not polled)
So the tipping point state has changed from Michigan to Florida! Surprise surprise. In that case, it would be the first time since the 2000 election (I believe) that Florida would be back to being the single most important state in the election. With its heavy 29 electoral vote gravity, it's not all that hard to believe in such an outcome.
Title: Re: 2016 Official Polling Map Thread
Post by: pbrower2a on July 08, 2014, 10:43:55 AM
Quinnipiac, nationwide (and ugly for Republicans):
In the 2016 presidential race, American voters back Hillary Clinton over leading Republican contenders:
47 - 38 percent over Christie;
49 - 40 percent over Paul;
49 - 40 percent over Huckabee;
48 - 41 percent over former Florida Gov. Jeb Bush;
48 - 41 percent over U.S. Rep. Paul Ryan of Wisconsin.
http://www.quinnipiac.edu/news-and-events/quinnipiac-university-poll/national/release-detail?ReleaseID=2058
Title: Re: 2016 Official Polling Map Thread
Post by: pbrower2a on July 08, 2014, 12:48:51 PM
PPP, Louisiana
Jeb Bush......................................................... 46%
Hillary Clinton.................................................. 45%
Mike Huckabee ............................................... 46%
Hillary Clinton.................................................. 45%
Hillary Clinton.................................................. 46%
Rand Paul ....................................................... 46%
Hillary Clinton.................................................. 46%
Ted Cruz ......................................................... 45%
Hillary Clinton.................................................. 46%
Chris Christie .................................................. 42%
Hillary Clinton.................................................. 48%
Bobby Jindal ................................................... 44%
http://www.publicpolicypolling.com/pdf/2014/PPP_Release_LA_702.pdf
It now looks as if almost all the gains that the Republicans have made with Louisiana voters beginning in 2000 have evaporated. The two leads shown by Republicans are razor-thin and unreliable.
Hillary Clinton seems to have kept just about every voter that Barack Obama picked up for 2012 while not being so polarizing in the South. I am satisfied that there is more to her campaign in 2016 than nostalgia for a better time.
Hillary Clinton vs. Jeb Bush
(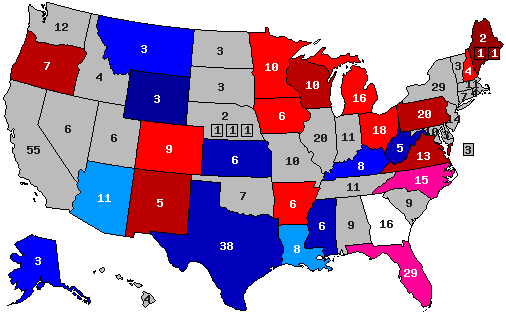 )
)
Hillary Clinton vs. Chris Christie
(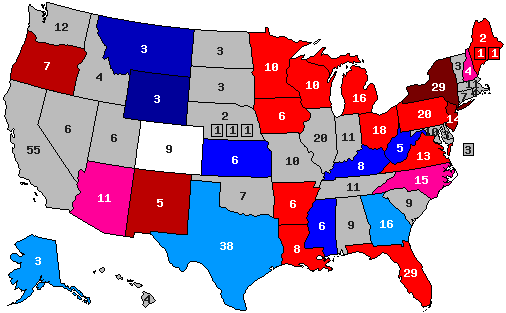 )
)
Hillary Clinton vs. Mike Huckabee
(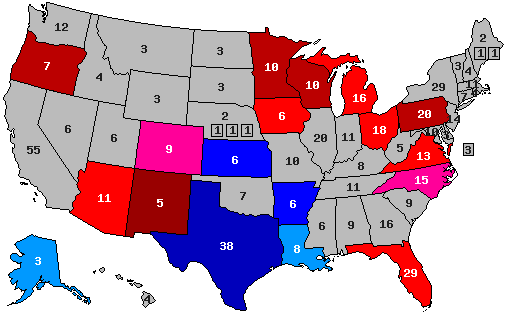 )
)
Hillary Clinton vs. Rand Paul
(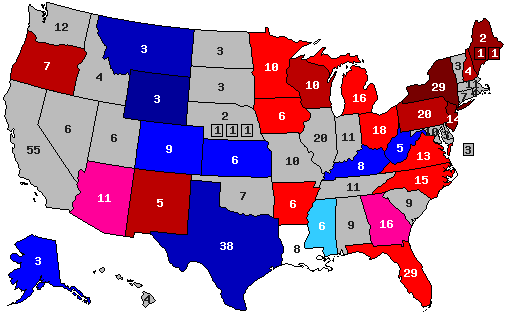 )
)
blue, Republican -- red, Democratic
30% -- lead with 40-49% but a margin of 3% or less
40% -- lead with 40-49% but a margin of 4% or more
60% -- lead with 50-54%
70% -- lead with 55-59%
90% -- lead with 60% or more
Jeb Bush......................................................... 46%
Hillary Clinton.................................................. 45%
Mike Huckabee ............................................... 46%
Hillary Clinton.................................................. 45%
Hillary Clinton.................................................. 46%
Rand Paul ....................................................... 46%
Hillary Clinton.................................................. 46%
Ted Cruz ......................................................... 45%
Hillary Clinton.................................................. 46%
Chris Christie .................................................. 42%
Hillary Clinton.................................................. 48%
Bobby Jindal ................................................... 44%
http://www.publicpolicypolling.com/pdf/2014/PPP_Release_LA_702.pdf
It now looks as if almost all the gains that the Republicans have made with Louisiana voters beginning in 2000 have evaporated. The two leads shown by Republicans are razor-thin and unreliable.
Hillary Clinton seems to have kept just about every voter that Barack Obama picked up for 2012 while not being so polarizing in the South. I am satisfied that there is more to her campaign in 2016 than nostalgia for a better time.
Hillary Clinton vs. Jeb Bush
(
Hillary Clinton vs. Chris Christie
(
Hillary Clinton vs. Mike Huckabee
(
Hillary Clinton vs. Rand Paul
(
blue, Republican -- red, Democratic
30% -- lead with 40-49% but a margin of 3% or less
40% -- lead with 40-49% but a margin of 4% or more
60% -- lead with 50-54%
70% -- lead with 55-59%
90% -- lead with 60% or more
Title: Re: 2016 Official Polling Map Thread
Post by: eric82oslo on July 12, 2014, 11:59:42 AM
Only two more states have been polled during my week-long holiday fortunately, and the Rand Paul-Hillary match up in Florida didn't change anything, as Jeb Bush still trumps Paul in the state with about 5 percentage points.
More interesting is of course the new PPP poll out from Louisiana. It's actually already the 6th 2016 poll from the state. With this poll of 6 potential GOPers, here are the current match up averages in Louisiana:
Mike Huckabee: +3%
Jeb Bush: +2.67%
Rand Paul: +1.67%
Paul Ryan: +1%
Ted Cruz: -1%
Chris Christie: -1.33%
Bobby Jindal: -1.57%
Marco Rubio: -3%
In other words, half of the GOP contenders polled in the state are looking decent on paper, while the other half are looking like misfits for the state's voters. It's a fight between Huckabee & Bush for the GOP leader role in the state. Also, this means that Hillary improves on her previous Louisiana record by a +2% bump in the former French colony, going from -5% to her current -3%. Meaning that Hillary is only experiencing a stronger Democratic swing in two other states; Kentucky & Arkansas, coincidentially southern states as well. Looks like the South is pretty ready for a female commander-in-charge!
The total number of state polls included in the lists below has thus now reached 135.
So here they are - all the 2016 poll averages for each state so far - 29 states having been polled to date - and how far off they are compared to the actual 2012 outcomes. I'm only including the Republican candidate with the best statewide polling.
Alaska: Hillary vs Jeb Bush: R +7%
+7% D improvement
(Updated on May 14, 2014)
Arizona: Hillary vs Bush: R +1%
+8% D improvement
(Updated on March 6, 2014)
Arkansas: Hillary vs Mike Huckabee: R +3%
+17% D improvement
(Updated on May 5, 2014)
Colorado: Hillary vs Paul Ryan: R +3.5%
+8.9% R improvement
Current Republican gain
(Updated on April 25, 2014)
Florida: Hillary vs Bush: D +5.7%
+4.8% D improvement
(Updated on July 12, 2014)
Georgia: Hillary vs Christie: R +2%
+6% D improvement
(Updated August 8, 2013)
Iowa: Hillary vs Christie: D +4.2%
+1.6% R improvement
(Updated on June 23, 2014)
Kansas: Hillary vs Bush: R +9%
+13% D improvement
(Updated on February 24, 2014)
Kentucky: Hillary vs Christie/Bush: R +4%
+19% D improvement
(Updated on May 18, 2014)
Louisiana: Hillary vs Huckabee: R +3%
+14% D improvement
(Updated on July 12, 2014)
Maine: Hillary vs Christie: D +8%
+7% R improvement
(Updated on November 13, 2013)
Michigan: Hillary vs Christie: D +6.1%
+3.4% R improvement
(Updated on June 3, 2014)
Minnesota: Hillary vs Tim Pawlenty: D +6%
+2% R improvement
(Updated on June 18, 2014)
Mississippi: Hillary vs Christie: R +9%
+2.5% D improvement
(Updated on November 19, 2013)
Montana: Hillary vs Rand Paul: R +13%
+1% D improvement
(Updated on November 24, 2013)
New Hampshire: Hillary vs Huckabee: D +2.1%
+3.5% R improvement
(Updated on May 12, 2014)
New Jersey: Hillary vs Christie: D +9.6%
+8.2% R improvement
(Updated on March 4, 2014; includes governor exit poll)
New Mexico: Hillary vs Susana Martinez: D +14%
+4% D improvement
(Updated on March 27, 2014)
New York: Hillary vs Christie: D +28%
+0.2% R improvement
(Updated on March 4, 2014)
North Carolina: Hillary vs Christie: D +1.25%
+3.3% D improvement
Current Democratic gain
(Updated on June 19, 2014)
Ohio: Hillary vs Christie: D +6.2%
+3.2% D improvement
(Updated on May 15, 2014)
Oregon: Hillary vs Rand Paul/Huckabee: D +12%
Unchanged from 2012
(Updated on May 30, 2014)
Pennsylvania: Hillary vs Christie: D +3.5%
+1.9% R improvement
(Updated on June 5, 2014)
South Carolina: Hillary vs Marco Rubio: R +7%
+3.5% D improvement
(Updated on November 2, 2013)
Texas: Hillary vs Huckabee: R +8%
+8% D improvement
(Updated on April 18, 2014)
Virginia: Hillary vs Christie: D +3.2%
+0.6% R improvement
(Updated on March 27, 2014)
West Virginia: Hillary vs Bush: R +14%
+13% D improvement
(Updated on October 1, 2013)
Wisconsin: Hillary vs Ryan: D +5.1%
+1.8% R improvement
(Updated on April 25, 2014)
Wyoming: Hillary vs Christie: R +28%
+13% D improvement
(Updated on July 23, 2013)
Average all 29 states: Hillary vs Best Republican: D +0.12%
+3.5% D improvement (from Obama 2012) [projecting a 7.35% victory for Hillary]
That gives us this map right now:
(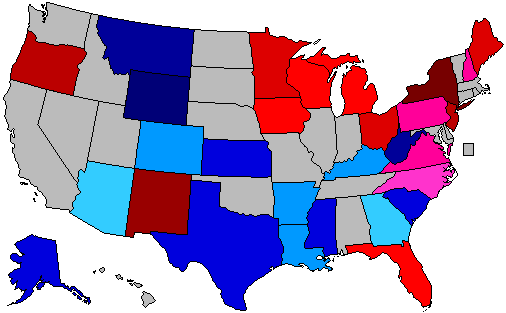 )
)
Red = Democratic lead or trend
Blue = Republican lead or trend
Green = Basically tied or hardly any trend, unchanged from 2012
Grey = No polling yet
Green = toss up or less than 0.5% lead
20% shade = 0.6-2% lead
30% shade = 2.1-4% lead
40% shade = 4.1-6% lead
50% shade = 6.1-9% lead
60% shade = 9.1-12% lead
70% shade = 12.1-15% lead
80% shade = 15.1-18% lead
90% shade = Above 18.1% lead
In the count of electoral votes, this means the current situation looks like this:
Hillary: 216 EVs (for a total of 15 states)
Best/Tailormade Republican: 120 EVs (for a total of 14 states)
Toss-up: None
No polling: 202 EVs (for a total of 21 states + D.C.)
Which means that Hillary has captured a rather impressive 64.3% of all EVs awarded thus far, against a disappointing 35.7% EVs for the tailormade Republican. Even as the biggest price by far, California, hasn't been added yet.
This is how the Trendline Map looks so far:
( )
)
The states which right now are showing the strongest improvement for the Democratic (Hillary) or the Republican candidate (in 13 out of 29 cases, Christie is that person):
1. Kentucky: D +19%
2. Arkansas: D +17%
3. Louisiana: D +14%
4. Kansas: D +13%
5. West Virginia: D +13%
6. Wyoming: D +13%
7. Colorado: R +8.9%
8. New Jersey: R +8.2%
9. Arizona: D +8%
10. Texas: D +8%
11. Maine: R +7%
12. Alaska: D +7%
13. Georgia: D +6%
14. Florida: D +4.8%
All of these changes (in the 14 states above) are (more than) statistically significant.
The whole list of states having been polled till now, going from Democratic stronghold to Republican stronghold:
New York: D +28%
New Mexico: D +14%
Oregon: D +12%
New Jersey: D +9.6%
Maine: D +8%
Currently estimated/projected national average: D +7.35%
Ohio: D +6.2%
Michigan: D +6.1%
Minnesota: D +6%
Florida: D +5.7%
Wisconsin: D +5.1%
Iowa: D +4.2%
Pennsylvania: D +3.5%
Virginia: D +3.2%
New Hampshire: D +2.1%
North Carolina: D +1.25%
Arizona: R +1%
Georgia: R +2%
Arkansas: R +3%
Louisiana: R +3%
Colorado: R +3.5%
Kentucky: R +4%
Alaska: R +7%
South Carolina: R +7%
Texas: R +8%
Mississippi: R +9%
Kansas: R +9%
Montana: R +13%
West Virginia: R +14%
Wyoming: R +28%
Here are the current stats on the best-tailored Republican candidates in all states polled so far:
1. Chris Christie favoured in 13 of 29 states (for 165 EVs)
2. Mike Huckabee in 5 states (Texas (!), Louisiana (!), Oregon (shared), Arkansas & New Hampshire (!) - for 63 EVs)
3. Jeb Bush favoured in 6 states (Florida, Arizona, Kentucky (!!) (shared), Kansas, West Virginia & Alaska - for 62 EVs)
4. Paul Ryan favoured in 2 states (Wisconsin & Colorado - for 19 EVs)
5. Rand Paul favoured in 2 states (Oregon (shared) & Montana - for 10 EVs)
6. Tim Pawlenty favoured in 1 state (Minnesota - for 10 EVs)
7. Marco Rubio favoured in 1 state (South Carolina - for 9 EVs)
8. Susana Martinez favoured in 1 state (New Mexico - for 5 EVs)
Current update as of July 12.
More interesting is of course the new PPP poll out from Louisiana. It's actually already the 6th 2016 poll from the state. With this poll of 6 potential GOPers, here are the current match up averages in Louisiana:
Mike Huckabee: +3%
Jeb Bush: +2.67%
Rand Paul: +1.67%
Paul Ryan: +1%
Ted Cruz: -1%
Chris Christie: -1.33%
Bobby Jindal: -1.57%
Marco Rubio: -3%
In other words, half of the GOP contenders polled in the state are looking decent on paper, while the other half are looking like misfits for the state's voters. It's a fight between Huckabee & Bush for the GOP leader role in the state. Also, this means that Hillary improves on her previous Louisiana record by a +2% bump in the former French colony, going from -5% to her current -3%. Meaning that Hillary is only experiencing a stronger Democratic swing in two other states; Kentucky & Arkansas, coincidentially southern states as well. Looks like the South is pretty ready for a female commander-in-charge!
The total number of state polls included in the lists below has thus now reached 135.
So here they are - all the 2016 poll averages for each state so far - 29 states having been polled to date - and how far off they are compared to the actual 2012 outcomes. I'm only including the Republican candidate with the best statewide polling.
Alaska: Hillary vs Jeb Bush: R +7%
+7% D improvement
(Updated on May 14, 2014)
Arizona: Hillary vs Bush: R +1%
+8% D improvement
(Updated on March 6, 2014)
Arkansas: Hillary vs Mike Huckabee: R +3%
+17% D improvement
(Updated on May 5, 2014)
Colorado: Hillary vs Paul Ryan: R +3.5%
+8.9% R improvement
Current Republican gain
(Updated on April 25, 2014)
Florida: Hillary vs Bush: D +5.7%
+4.8% D improvement
(Updated on July 12, 2014)
Georgia: Hillary vs Christie: R +2%
+6% D improvement
(Updated August 8, 2013)
Iowa: Hillary vs Christie: D +4.2%
+1.6% R improvement
(Updated on June 23, 2014)
Kansas: Hillary vs Bush: R +9%
+13% D improvement
(Updated on February 24, 2014)
Kentucky: Hillary vs Christie/Bush: R +4%
+19% D improvement
(Updated on May 18, 2014)
Louisiana: Hillary vs Huckabee: R +3%
+14% D improvement
(Updated on July 12, 2014)
Maine: Hillary vs Christie: D +8%
+7% R improvement
(Updated on November 13, 2013)
Michigan: Hillary vs Christie: D +6.1%
+3.4% R improvement
(Updated on June 3, 2014)
Minnesota: Hillary vs Tim Pawlenty: D +6%
+2% R improvement
(Updated on June 18, 2014)
Mississippi: Hillary vs Christie: R +9%
+2.5% D improvement
(Updated on November 19, 2013)
Montana: Hillary vs Rand Paul: R +13%
+1% D improvement
(Updated on November 24, 2013)
New Hampshire: Hillary vs Huckabee: D +2.1%
+3.5% R improvement
(Updated on May 12, 2014)
New Jersey: Hillary vs Christie: D +9.6%
+8.2% R improvement
(Updated on March 4, 2014; includes governor exit poll)
New Mexico: Hillary vs Susana Martinez: D +14%
+4% D improvement
(Updated on March 27, 2014)
New York: Hillary vs Christie: D +28%
+0.2% R improvement
(Updated on March 4, 2014)
North Carolina: Hillary vs Christie: D +1.25%
+3.3% D improvement
Current Democratic gain
(Updated on June 19, 2014)
Ohio: Hillary vs Christie: D +6.2%
+3.2% D improvement
(Updated on May 15, 2014)
Oregon: Hillary vs Rand Paul/Huckabee: D +12%
Unchanged from 2012
(Updated on May 30, 2014)
Pennsylvania: Hillary vs Christie: D +3.5%
+1.9% R improvement
(Updated on June 5, 2014)
South Carolina: Hillary vs Marco Rubio: R +7%
+3.5% D improvement
(Updated on November 2, 2013)
Texas: Hillary vs Huckabee: R +8%
+8% D improvement
(Updated on April 18, 2014)
Virginia: Hillary vs Christie: D +3.2%
+0.6% R improvement
(Updated on March 27, 2014)
West Virginia: Hillary vs Bush: R +14%
+13% D improvement
(Updated on October 1, 2013)
Wisconsin: Hillary vs Ryan: D +5.1%
+1.8% R improvement
(Updated on April 25, 2014)
Wyoming: Hillary vs Christie: R +28%
+13% D improvement
(Updated on July 23, 2013)
Average all 29 states: Hillary vs Best Republican: D +0.12%
+3.5% D improvement (from Obama 2012) [projecting a 7.35% victory for Hillary]
That gives us this map right now:
(
Red = Democratic lead or trend
Blue = Republican lead or trend
Green = Basically tied or hardly any trend, unchanged from 2012
Grey = No polling yet
Green = toss up or less than 0.5% lead
20% shade = 0.6-2% lead
30% shade = 2.1-4% lead
40% shade = 4.1-6% lead
50% shade = 6.1-9% lead
60% shade = 9.1-12% lead
70% shade = 12.1-15% lead
80% shade = 15.1-18% lead
90% shade = Above 18.1% lead
In the count of electoral votes, this means the current situation looks like this:
Hillary: 216 EVs (for a total of 15 states)
Best/Tailormade Republican: 120 EVs (for a total of 14 states)
Toss-up: None
No polling: 202 EVs (for a total of 21 states + D.C.)
Which means that Hillary has captured a rather impressive 64.3% of all EVs awarded thus far, against a disappointing 35.7% EVs for the tailormade Republican. Even as the biggest price by far, California, hasn't been added yet.
This is how the Trendline Map looks so far:
(
The states which right now are showing the strongest improvement for the Democratic (Hillary) or the Republican candidate (in 13 out of 29 cases, Christie is that person):
1. Kentucky: D +19%
2. Arkansas: D +17%
3. Louisiana: D +14%
4. Kansas: D +13%
5. West Virginia: D +13%
6. Wyoming: D +13%
7. Colorado: R +8.9%
8. New Jersey: R +8.2%
9. Arizona: D +8%
10. Texas: D +8%
11. Maine: R +7%
12. Alaska: D +7%
13. Georgia: D +6%
14. Florida: D +4.8%
All of these changes (in the 14 states above) are (more than) statistically significant.
The whole list of states having been polled till now, going from Democratic stronghold to Republican stronghold:
New York: D +28%
New Mexico: D +14%
Oregon: D +12%
New Jersey: D +9.6%
Maine: D +8%
Currently estimated/projected national average: D +7.35%
Ohio: D +6.2%
Michigan: D +6.1%
Minnesota: D +6%
Florida: D +5.7%
Wisconsin: D +5.1%
Iowa: D +4.2%
Pennsylvania: D +3.5%
Virginia: D +3.2%
New Hampshire: D +2.1%
North Carolina: D +1.25%
Arizona: R +1%
Georgia: R +2%
Arkansas: R +3%
Louisiana: R +3%
Colorado: R +3.5%
Kentucky: R +4%
Alaska: R +7%
South Carolina: R +7%
Texas: R +8%
Mississippi: R +9%
Kansas: R +9%
Montana: R +13%
West Virginia: R +14%
Wyoming: R +28%
Here are the current stats on the best-tailored Republican candidates in all states polled so far:
1. Chris Christie favoured in 13 of 29 states (for 165 EVs)
2. Mike Huckabee in 5 states (Texas (!), Louisiana (!), Oregon (shared), Arkansas & New Hampshire (!) - for 63 EVs)
3. Jeb Bush favoured in 6 states (Florida, Arizona, Kentucky (!!) (shared), Kansas, West Virginia & Alaska - for 62 EVs)
4. Paul Ryan favoured in 2 states (Wisconsin & Colorado - for 19 EVs)
5. Rand Paul favoured in 2 states (Oregon (shared) & Montana - for 10 EVs)
6. Tim Pawlenty favoured in 1 state (Minnesota - for 10 EVs)
7. Marco Rubio favoured in 1 state (South Carolina - for 9 EVs)
8. Susana Martinez favoured in 1 state (New Mexico - for 5 EVs)
Current update as of July 12.
Title: Re: 2016 Official Polling Map Thread
Post by: pbrower2a on July 12, 2014, 01:50:39 PM
PPP is polling Mississippi this week and Colorado next week. Both should be extremely interesting.
No Democratic nominee for President has won Mississippi since 1976 (Carter); the conditions in which Carter won Mississippi are long past.
The state that would really be interesting is Tennessee.
No Democratic nominee for President has won Mississippi since 1976 (Carter); the conditions in which Carter won Mississippi are long past.
The state that would really be interesting is Tennessee.
Title: Re: 2016 Official Polling Map Thread
Post by: eric82oslo on July 17, 2014, 09:48:47 AM
It's pay day! :D I mean POLL DAY! :P Today, Marist & Quinnipiac have released polling data from three crucial battlegrounds: Colorado, Iowa & New Hampshire. Overall they don't really change the picture very much, as Hillary is still trailing in Colorado. Also, she's basically tied with Rand Paul and Christie in Iowa, which undoubtedly is bad news for her, despite having an immensely strong favorable rating there.
Here are the current averages by state...
Colorado:
(Paul Ryan: R+3.5%)
Rand Paul: R+1.57%
Christie: R+1.13%
Huckabee: D+3.67%
Bush: D+5.5%
Iowa:
Christie: D+3.93%
Rand Paul: D+5.58%
Rubio: D+7.59%
Bush: D+7.68%
Walker: D+8.5%
Cruz: D+9.78%
New Hampshire:
(Huckabee: D+2.1%)
Christie: D+3.65%
Rand Paul: D+6.88%
Bush: D+7.15%
Walker: D+9%
Rubio: D+10.03%
Cruz: D+14.67%
Unfortunately Paul Ryan wasn't polled in Colorado, while they didn't poll Huckabee in New Hampshire. :( Keep in mind that Huckabee's NH average is based on one single poll only.
The total number of state polls included in the lists below has thus now reached 138.
So here they are - all the 2016 poll averages for each state so far - 29 states having been polled to date - and how far off they are compared to the actual 2012 outcomes. I'm only including the Republican candidate with the best statewide polling.
Alaska: Hillary vs Jeb Bush: R +7%
+7% D improvement
(Updated on May 14, 2014)
Arizona: Hillary vs Bush: R +1%
+8% D improvement
(Updated on March 6, 2014)
Arkansas: Hillary vs Mike Huckabee: R +3%
+17% D improvement
(Updated on May 5, 2014)
Colorado: Hillary vs Paul Ryan: R +3.5%
+8.9% R improvement
Current Republican gain
(Updated on July 17, 2014)
Florida: Hillary vs Bush: D +5.7%
+4.8% D improvement
(Updated on July 12, 2014)
Georgia: Hillary vs Christie: R +2%
+6% D improvement
(Updated August 8, 2013)
Iowa: Hillary vs Christie: D +3.9%
+1.9% R improvement
(Updated on July 17, 2014)
Kansas: Hillary vs Bush: R +9%
+13% D improvement
(Updated on February 24, 2014)
Kentucky: Hillary vs Christie/Bush: R +4%
+19% D improvement
(Updated on May 18, 2014)
Louisiana: Hillary vs Huckabee: R +3%
+14% D improvement
(Updated on July 12, 2014)
Maine: Hillary vs Christie: D +8%
+7% R improvement
(Updated on November 13, 2013)
Michigan: Hillary vs Christie: D +6.1%
+3.4% R improvement
(Updated on June 3, 2014)
Minnesota: Hillary vs Tim Pawlenty: D +6%
+2% R improvement
(Updated on June 18, 2014)
Mississippi: Hillary vs Christie: R +9%
+2.5% D improvement
(Updated on November 19, 2013)
Montana: Hillary vs Rand Paul: R +13%
+1% D improvement
(Updated on November 24, 2013)
New Hampshire: Hillary vs Huckabee: D +2.1%
+3.5% R improvement
(Updated on July 17, 2014)
New Jersey: Hillary vs Christie: D +9.6%
+8.2% R improvement
(Updated on March 4, 2014; includes governor exit poll)
New Mexico: Hillary vs Susana Martinez: D +14%
+4% D improvement
(Updated on March 27, 2014)
New York: Hillary vs Christie: D +28%
+0.2% R improvement
(Updated on March 4, 2014)
North Carolina: Hillary vs Christie: D +1.25%
+3.3% D improvement
Current Democratic gain
(Updated on June 19, 2014)
Ohio: Hillary vs Christie: D +6.2%
+3.2% D improvement
(Updated on May 15, 2014)
Oregon: Hillary vs Rand Paul/Huckabee: D +12%
Unchanged from 2012
(Updated on May 30, 2014)
Pennsylvania: Hillary vs Christie: D +3.5%
+1.9% R improvement
(Updated on June 5, 2014)
South Carolina: Hillary vs Marco Rubio: R +7%
+3.5% D improvement
(Updated on November 2, 2013)
Texas: Hillary vs Huckabee: R +8%
+8% D improvement
(Updated on April 18, 2014)
Virginia: Hillary vs Christie: D +3.2%
+0.6% R improvement
(Updated on March 27, 2014)
West Virginia: Hillary vs Bush: R +14%
+13% D improvement
(Updated on October 1, 2013)
Wisconsin: Hillary vs Ryan: D +5.1%
+1.8% R improvement
(Updated on April 25, 2014)
Wyoming: Hillary vs Christie: R +28%
+13% D improvement
(Updated on July 23, 2013)
Average all 29 states: Hillary vs Best Republican: D +0.1%
+3.5% D improvement (from Obama 2012) [projecting a 7.3% victory for Hillary]
That gives us this map right now:
( )
)
Red = Democratic lead or trend
Blue = Republican lead or trend
Green = Basically tied or hardly any trend, unchanged from 2012
Grey = No polling yet
Green = toss up or less than 0.5% lead
20% shade = 0.6-2% lead
30% shade = 2.1-4% lead
40% shade = 4.1-6% lead
50% shade = 6.1-9% lead
60% shade = 9.1-12% lead
70% shade = 12.1-15% lead
80% shade = 15.1-18% lead
90% shade = Above 18.1% lead
In the count of electoral votes, this means the current situation looks like this:
Hillary: 216 EVs (for a total of 15 states)
Best/Tailormade Republican: 120 EVs (for a total of 14 states)
Toss-up: None
No polling: 202 EVs (for a total of 21 states + D.C.)
Which means that Hillary has captured a rather impressive 64.3% of all EVs awarded thus far, against a disappointing 35.7% EVs for the tailormade Republican. Even as the biggest price by far, California, hasn't been added yet.
This is how the Trendline Map looks so far:
()
The states which right now are showing the strongest improvement for the Democratic (Hillary) or the Republican candidate (in 13 out of 29 cases, Christie is that person):
1. Kentucky: D +19%
2. Arkansas: D +17%
3. Louisiana: D +14%
4. Kansas: D +13%
5. West Virginia: D +13%
6. Wyoming: D +13%
7. Colorado: R +8.9%
8. New Jersey: R +8.2%
9. Arizona: D +8%
10. Texas: D +8%
11. Maine: R +7%
12. Alaska: D +7%
13. Georgia: D +6%
14. Florida: D +4.8%
All of these changes (in the 14 states above) are (more than) statistically significant.
The whole list of states having been polled till now, going from Democratic stronghold to Republican stronghold:
New York: D +28%
New Mexico: D +14%
Oregon: D +12%
New Jersey: D +9.6%
Maine: D +8%
Currently estimated/projected national average: D +7.3%
Ohio: D +6.2%
Michigan: D +6.1%
Minnesota: D +6%
Florida: D +5.7%
Wisconsin: D +5.1%
Iowa: D +3.9%
Pennsylvania: D +3.5%
Virginia: D +3.2%
New Hampshire: D +2.1%
North Carolina: D +1.25%
Arizona: R +1%
Georgia: R +2%
Arkansas: R +3%
Louisiana: R +3%
Colorado: R +3.5%
Kentucky: R +4%
Alaska: R +7%
South Carolina: R +7%
Texas: R +8%
Mississippi: R +9%
Kansas: R +9%
Montana: R +13%
West Virginia: R +14%
Wyoming: R +28%
Here are the current stats on the best-tailored Republican candidates in all states polled so far:
1. Chris Christie favoured in 13 of 29 states (for 165 EVs)
2. Mike Huckabee in 5 states (Texas (!), Louisiana (!), Oregon (shared), Arkansas & New Hampshire (!) - for 63 EVs)
3. Jeb Bush favoured in 6 states (Florida, Arizona, Kentucky (!!) (shared), Kansas, West Virginia & Alaska - for 62 EVs)
4. Paul Ryan favoured in 2 states (Wisconsin & Colorado - for 19 EVs)
5. Rand Paul favoured in 2 states (Oregon (shared) & Montana - for 10 EVs)
6. Tim Pawlenty favoured in 1 state (Minnesota - for 10 EVs)
7. Marco Rubio favoured in 1 state (South Carolina - for 9 EVs)
8. Susana Martinez favoured in 1 state (New Mexico - for 5 EVs)
Current update as of July 17.
Here are the current averages by state...
Colorado:
(Paul Ryan: R+3.5%)
Rand Paul: R+1.57%
Christie: R+1.13%
Huckabee: D+3.67%
Bush: D+5.5%
Iowa:
Christie: D+3.93%
Rand Paul: D+5.58%
Rubio: D+7.59%
Bush: D+7.68%
Walker: D+8.5%
Cruz: D+9.78%
New Hampshire:
(Huckabee: D+2.1%)
Christie: D+3.65%
Rand Paul: D+6.88%
Bush: D+7.15%
Walker: D+9%
Rubio: D+10.03%
Cruz: D+14.67%
Unfortunately Paul Ryan wasn't polled in Colorado, while they didn't poll Huckabee in New Hampshire. :( Keep in mind that Huckabee's NH average is based on one single poll only.
The total number of state polls included in the lists below has thus now reached 138.
So here they are - all the 2016 poll averages for each state so far - 29 states having been polled to date - and how far off they are compared to the actual 2012 outcomes. I'm only including the Republican candidate with the best statewide polling.
Alaska: Hillary vs Jeb Bush: R +7%
+7% D improvement
(Updated on May 14, 2014)
Arizona: Hillary vs Bush: R +1%
+8% D improvement
(Updated on March 6, 2014)
Arkansas: Hillary vs Mike Huckabee: R +3%
+17% D improvement
(Updated on May 5, 2014)
Colorado: Hillary vs Paul Ryan: R +3.5%
+8.9% R improvement
Current Republican gain
(Updated on July 17, 2014)
Florida: Hillary vs Bush: D +5.7%
+4.8% D improvement
(Updated on July 12, 2014)
Georgia: Hillary vs Christie: R +2%
+6% D improvement
(Updated August 8, 2013)
Iowa: Hillary vs Christie: D +3.9%
+1.9% R improvement
(Updated on July 17, 2014)
Kansas: Hillary vs Bush: R +9%
+13% D improvement
(Updated on February 24, 2014)
Kentucky: Hillary vs Christie/Bush: R +4%
+19% D improvement
(Updated on May 18, 2014)
Louisiana: Hillary vs Huckabee: R +3%
+14% D improvement
(Updated on July 12, 2014)
Maine: Hillary vs Christie: D +8%
+7% R improvement
(Updated on November 13, 2013)
Michigan: Hillary vs Christie: D +6.1%
+3.4% R improvement
(Updated on June 3, 2014)
Minnesota: Hillary vs Tim Pawlenty: D +6%
+2% R improvement
(Updated on June 18, 2014)
Mississippi: Hillary vs Christie: R +9%
+2.5% D improvement
(Updated on November 19, 2013)
Montana: Hillary vs Rand Paul: R +13%
+1% D improvement
(Updated on November 24, 2013)
New Hampshire: Hillary vs Huckabee: D +2.1%
+3.5% R improvement
(Updated on July 17, 2014)
New Jersey: Hillary vs Christie: D +9.6%
+8.2% R improvement
(Updated on March 4, 2014; includes governor exit poll)
New Mexico: Hillary vs Susana Martinez: D +14%
+4% D improvement
(Updated on March 27, 2014)
New York: Hillary vs Christie: D +28%
+0.2% R improvement
(Updated on March 4, 2014)
North Carolina: Hillary vs Christie: D +1.25%
+3.3% D improvement
Current Democratic gain
(Updated on June 19, 2014)
Ohio: Hillary vs Christie: D +6.2%
+3.2% D improvement
(Updated on May 15, 2014)
Oregon: Hillary vs Rand Paul/Huckabee: D +12%
Unchanged from 2012
(Updated on May 30, 2014)
Pennsylvania: Hillary vs Christie: D +3.5%
+1.9% R improvement
(Updated on June 5, 2014)
South Carolina: Hillary vs Marco Rubio: R +7%
+3.5% D improvement
(Updated on November 2, 2013)
Texas: Hillary vs Huckabee: R +8%
+8% D improvement
(Updated on April 18, 2014)
Virginia: Hillary vs Christie: D +3.2%
+0.6% R improvement
(Updated on March 27, 2014)
West Virginia: Hillary vs Bush: R +14%
+13% D improvement
(Updated on October 1, 2013)
Wisconsin: Hillary vs Ryan: D +5.1%
+1.8% R improvement
(Updated on April 25, 2014)
Wyoming: Hillary vs Christie: R +28%
+13% D improvement
(Updated on July 23, 2013)
Average all 29 states: Hillary vs Best Republican: D +0.1%
+3.5% D improvement (from Obama 2012) [projecting a 7.3% victory for Hillary]
That gives us this map right now:
(
Red = Democratic lead or trend
Blue = Republican lead or trend
Green = Basically tied or hardly any trend, unchanged from 2012
Grey = No polling yet
Green = toss up or less than 0.5% lead
20% shade = 0.6-2% lead
30% shade = 2.1-4% lead
40% shade = 4.1-6% lead
50% shade = 6.1-9% lead
60% shade = 9.1-12% lead
70% shade = 12.1-15% lead
80% shade = 15.1-18% lead
90% shade = Above 18.1% lead
In the count of electoral votes, this means the current situation looks like this:
Hillary: 216 EVs (for a total of 15 states)
Best/Tailormade Republican: 120 EVs (for a total of 14 states)
Toss-up: None
No polling: 202 EVs (for a total of 21 states + D.C.)
Which means that Hillary has captured a rather impressive 64.3% of all EVs awarded thus far, against a disappointing 35.7% EVs for the tailormade Republican. Even as the biggest price by far, California, hasn't been added yet.
This is how the Trendline Map looks so far:
(
The states which right now are showing the strongest improvement for the Democratic (Hillary) or the Republican candidate (in 13 out of 29 cases, Christie is that person):
1. Kentucky: D +19%
2. Arkansas: D +17%
3. Louisiana: D +14%
4. Kansas: D +13%
5. West Virginia: D +13%
6. Wyoming: D +13%
7. Colorado: R +8.9%
8. New Jersey: R +8.2%
9. Arizona: D +8%
10. Texas: D +8%
11. Maine: R +7%
12. Alaska: D +7%
13. Georgia: D +6%
14. Florida: D +4.8%
All of these changes (in the 14 states above) are (more than) statistically significant.
The whole list of states having been polled till now, going from Democratic stronghold to Republican stronghold:
New York: D +28%
New Mexico: D +14%
Oregon: D +12%
New Jersey: D +9.6%
Maine: D +8%
Currently estimated/projected national average: D +7.3%
Ohio: D +6.2%
Michigan: D +6.1%
Minnesota: D +6%
Florida: D +5.7%
Wisconsin: D +5.1%
Iowa: D +3.9%
Pennsylvania: D +3.5%
Virginia: D +3.2%
New Hampshire: D +2.1%
North Carolina: D +1.25%
Arizona: R +1%
Georgia: R +2%
Arkansas: R +3%
Louisiana: R +3%
Colorado: R +3.5%
Kentucky: R +4%
Alaska: R +7%
South Carolina: R +7%
Texas: R +8%
Mississippi: R +9%
Kansas: R +9%
Montana: R +13%
West Virginia: R +14%
Wyoming: R +28%
Here are the current stats on the best-tailored Republican candidates in all states polled so far:
1. Chris Christie favoured in 13 of 29 states (for 165 EVs)
2. Mike Huckabee in 5 states (Texas (!), Louisiana (!), Oregon (shared), Arkansas & New Hampshire (!) - for 63 EVs)
3. Jeb Bush favoured in 6 states (Florida, Arizona, Kentucky (!!) (shared), Kansas, West Virginia & Alaska - for 62 EVs)
4. Paul Ryan favoured in 2 states (Wisconsin & Colorado - for 19 EVs)
5. Rand Paul favoured in 2 states (Oregon (shared) & Montana - for 10 EVs)
6. Tim Pawlenty favoured in 1 state (Minnesota - for 10 EVs)
7. Marco Rubio favoured in 1 state (South Carolina - for 9 EVs)
8. Susana Martinez favoured in 1 state (New Mexico - for 5 EVs)
Current update as of July 17.
Title: Re: 2016 Official Polling Map Thread
Post by: pbrower2a on July 17, 2014, 11:31:37 AM
Four states polled, three of them legitimate swing states, and Mississippi gives some interesting results:
Marist, New Hampshire:
Clinton 47% Christie 42%
Clinton 47% Bush 42%
Clinton 46% Paul 43%
Clinton 48% Walker 39%
Clinton 51% Cruz 38%
Clinton 47% Rubio 42%
http://www.nbcnews.com/politics/first-read/poll-democrats-ready-hillary-everyone-else-not-much-n157821
Iowa (Marist)
http://www.nbcnews.com/politics/first-read/poll-democrats-ready-hillary-everyone-else-not-much-n157821
Mississippi (PPP)
http://www.publicpolicypolling.com/pdf/2014/PPP_Release_MS_717.pdf
Colorado, Quinnipiac
http://www.quinnipiac.edu/news-and-events/quinnipiac-university-poll/colorado/release-detail?ReleaseID=2060
Hillary Clinton vs. Jeb Bush
( )
)
Hillary Clinton vs. Chris Christie
(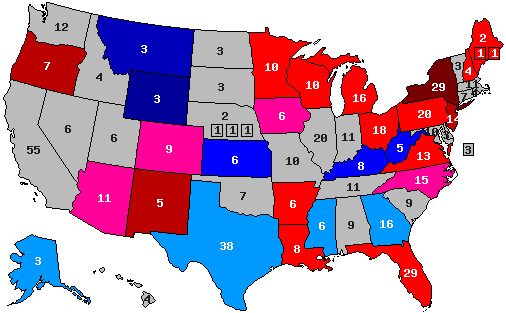 )
)
Hillary Clinton vs. Mike Huckabee
(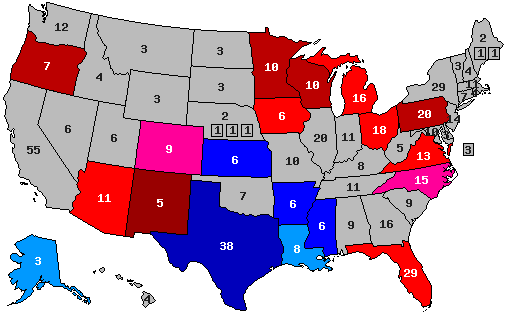 )
)
Hillary Clinton vs. Rand Paul
(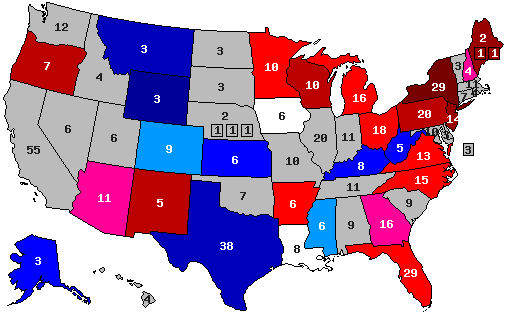 )
)
blue, Republican -- red, Democratic
30% -- lead with 40-49% but a margin of 3% or less
40% -- lead with 40-49% but a margin of 4% or more
60% -- lead with 50-54%
70% -- lead with 55-59%
90% -- lead with 60% or more
Marist, New Hampshire:
Clinton 47% Christie 42%
Clinton 47% Bush 42%
Clinton 46% Paul 43%
Clinton 48% Walker 39%
Clinton 51% Cruz 38%
Clinton 47% Rubio 42%
http://www.nbcnews.com/politics/first-read/poll-democrats-ready-hillary-everyone-else-not-much-n157821
Iowa (Marist)
Quote
In the presidential battleground state of Iowa, Clinton is tied with Sen. Rand Paul, R-Ky. (45 percent to 45 percent), and leads New Jersey Gov. Chris Christie by just 1 point (44 percent to 43 percent).
She holds larger leads against former Florida Gov. Jeb Bush (46 percent to 42 percent), Sen. Marco Rubio, R-Fla., (49 percent to 40 percent), Sen. Ted. Cruz, R-Texas, (49 percent to 37 percent) and Wisconsin Gov. Scott Walker (50 percent to 37 percent).
She holds larger leads against former Florida Gov. Jeb Bush (46 percent to 42 percent), Sen. Marco Rubio, R-Fla., (49 percent to 40 percent), Sen. Ted. Cruz, R-Texas, (49 percent to 37 percent) and Wisconsin Gov. Scott Walker (50 percent to 37 percent).
http://www.nbcnews.com/politics/first-read/poll-democrats-ready-hillary-everyone-else-not-much-n157821
Mississippi (PPP)
Quote
While people never think of Mississippi as a swing state, if Hilary Clinton were to run for President in 2016 that may change. When polled against five potential Republican opponents; Jeb Bush, Chris Christie, Ted Cruz, Mike Huckabee and Rand Paul, Clinton never has less than 42% support and is in fact tied with Cruz 44/44. For the Republicans, Huckabee has the most support in the state, beating Clinton 49/42 in a potential matchup.
That number is both the largest margin a Republican leads by and the largest percentage of support that any of the five candidates received.
That number is both the largest margin a Republican leads by and the largest percentage of support that any of the five candidates received.
http://www.publicpolicypolling.com/pdf/2014/PPP_Release_MS_717.pdf
Colorado, Quinnipiac
Quote
U.S. Sen. Rand Paul is the man to beat in Colorado in an early look at the 2016 presidential race, edging former Secretary of State Hillary Clinton by a thin 46 - 43 percent margin. Clinton gets 42 percent to 40 percent for N.J. Gov. Christopher Christie. She tops former Florida Gov. Jeb Bush 44 - 40 percent and squeaks by former Arkansas Gov. Mike Huckabee 44 - 41 percent.
http://www.quinnipiac.edu/news-and-events/quinnipiac-university-poll/colorado/release-detail?ReleaseID=2060
Hillary Clinton vs. Jeb Bush
(
Hillary Clinton vs. Chris Christie
(
Hillary Clinton vs. Mike Huckabee
(
Hillary Clinton vs. Rand Paul
(
blue, Republican -- red, Democratic
30% -- lead with 40-49% but a margin of 3% or less
40% -- lead with 40-49% but a margin of 4% or more
60% -- lead with 50-54%
70% -- lead with 55-59%
90% -- lead with 60% or more
Title: Re: 2016 Official Polling Map Thread
Post by: pbrower2a on July 17, 2014, 12:09:44 PM
I can make some conclusions:
1. Colorado and Iowa are at best shaky for Hillary Clinton.
2. New Hampshire is probably not a swing state.
3. Mississippi shows that the R stranglehold on Southern politics is weakening.
Mississippi margins in Presidential elections:
2012 12%
2008 13%
2004 19%
2000 17%
1996 5%
1992 9%
1988 21%
1984 24%
1980 1%
1976 2%
It may be hard to believe now, but Carter came close to winning Mississippi despite a nationwide drubbing. Bill Clinton, like Jimmy Carter, was a Southern moderate running against a Yankee.
Mississippi may be reverting to its old norms in partisan identity, or partisanship could be eroding there. I cannot discern which trend is in effect in Mississippi; such cannot be told in two polls.
Missouri and Tennessee would be interesting. With 10 and 11 electoral votes at stake in those states, those two states are not trivialities.
Title: Re: 2016 Official Polling Map Thread
Post by: pbrower2a on July 17, 2014, 12:48:22 PM
Here's my projection of the 2016 election based upon what I see in Hillary Clinton against the main four potential nominees in current polls. I pay no attention to Ted Cruz, Mario Rubio, or Scott Walker, as they lose by ludicrous margins in all but sure-R states.
(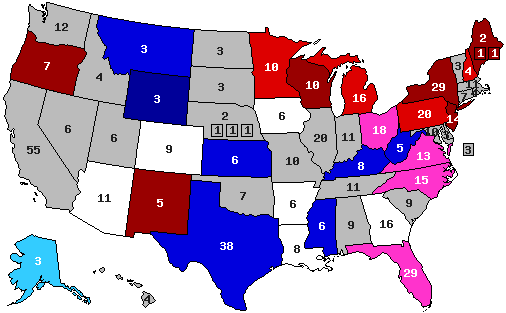 )
)
Legitimate swing states:
white -- mixed results or any tie
pink -- D lead in all 4 current polls, but swing states in 2008 and 2012
pale blue -- R lead in all current polls, all but one of them under 4%
Fringe swing states:
medium red -- D lead by at least 4% (but under 50%) in all but at most one poll but not swing states in 2008 or 2012
medium blue -- R lead by at least 4% (but under 50%) in all but at most one poll but not swing states in 2008 or 2012
Non-swing states
dark red -- D lead with at least 50% in at least two polls
dark blue -- R lead with at least 50% in at least two polls
Gray -- no polling
(
Legitimate swing states:
white -- mixed results or any tie
pink -- D lead in all 4 current polls, but swing states in 2008 and 2012
pale blue -- R lead in all current polls, all but one of them under 4%
Fringe swing states:
medium red -- D lead by at least 4% (but under 50%) in all but at most one poll but not swing states in 2008 or 2012
medium blue -- R lead by at least 4% (but under 50%) in all but at most one poll but not swing states in 2008 or 2012
Non-swing states
dark red -- D lead with at least 50% in at least two polls
dark blue -- R lead with at least 50% in at least two polls
Gray -- no polling
Title: Re: 2016 Official Polling Map Thread
Post by: pbrower2a on July 17, 2014, 01:35:27 PM
Now, based on how states did in 2008 and 2012 and how analogous states do, I fill in the rest:
(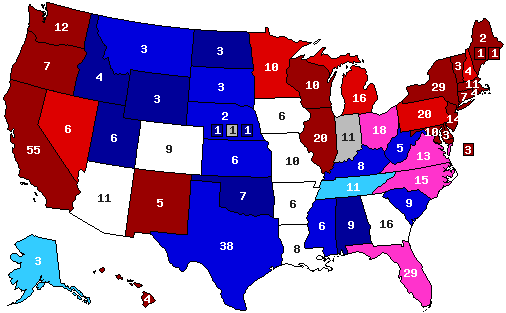 )
)
Legitimate swing states:
white -- mixed results or any tie 66
pink -- D lead in all 4 current polls, but swing states in 2008 and 2012 75
pale blue -- R lead in all current polls, all but one of them under 4% 14
Fringe swing states:
medium red -- D lead by at least 4% (but under 50%) in all but at most one poll but not swing states in 2008 or 2012 56
medium blue -- R lead by at least 4% (but under 50%) in all but at most one poll but not swing states in 2008 or 2012 76
Non-swing states
dark red -- D lead with at least 50% in at least two polls 199
dark blue -- R lead with at least 50% in at least two polls 32
Gray -- I have no idea (no suitable analogues) 12
The controversial ones are Missouri (Georgia now looks like a good analogue for Missouri with KC + STL = ATL; it's about half Iowa and half Arkansas, which both register as ties), Tennessee (which I am placing politically about halfway between Georgia and Mississippi or Georgia and Kentucky). Until I see commanding evidence to the contrary I practically define Florida, North Carolina, Ohio, and Virginia as swing states. I'm giving ND as more solidly R than SD because of the boom in natural gas in North Dakota. Indiana? NE-02? Go figure.
I see America much less polarized now than it was in 2008 or 2012.
(
Legitimate swing states:
white -- mixed results or any tie 66
pink -- D lead in all 4 current polls, but swing states in 2008 and 2012 75
pale blue -- R lead in all current polls, all but one of them under 4% 14
Fringe swing states:
medium red -- D lead by at least 4% (but under 50%) in all but at most one poll but not swing states in 2008 or 2012 56
medium blue -- R lead by at least 4% (but under 50%) in all but at most one poll but not swing states in 2008 or 2012 76
Non-swing states
dark red -- D lead with at least 50% in at least two polls 199
dark blue -- R lead with at least 50% in at least two polls 32
Gray -- I have no idea (no suitable analogues) 12
The controversial ones are Missouri (Georgia now looks like a good analogue for Missouri with KC + STL = ATL; it's about half Iowa and half Arkansas, which both register as ties), Tennessee (which I am placing politically about halfway between Georgia and Mississippi or Georgia and Kentucky). Until I see commanding evidence to the contrary I practically define Florida, North Carolina, Ohio, and Virginia as swing states. I'm giving ND as more solidly R than SD because of the boom in natural gas in North Dakota. Indiana? NE-02? Go figure.
I see America much less polarized now than it was in 2008 or 2012.
Title: Re: 2016 Official Polling Map Thread
Post by: eric82oslo on July 20, 2014, 04:40:44 PM
PPP has polled Mississippi for the 2nd time this season, and that means some great news for Hillary. Sure, she is still predictably lagging behind most GOP contenders, but considerably less than in the previous PPP survey. Huckabee was included for the first time in Mississippi, and with that he's snapped the current GOP lead of the state from Christie. This is the average lead over Hillary each candidate enjoys in the state right now:
Huckabee: R+7%
Jeb Bush: R+6.5%
Christie: R+6%
Rand Paul: R+2%
Cruz: R+1%
Also, a Survey USA poll has now tested Christie against Hillary in Florida, which didn't change anything, as he was still trailing her by 11% in the state, as well as an average trail of 10.7% in the 6 Florida match ups featuring him so far.
The total number of state polls included in the lists below has thus now reached 140.
So here they are - all the 2016 poll averages for each state so far - 29 states having been polled to date - and how far off they are compared to the actual 2012 outcomes. I'm only including the Republican candidate with the best statewide polling.
Alaska: Hillary vs Jeb Bush: R +7%
+7% D improvement
(Updated on May 14, 2014)
Arizona: Hillary vs Bush: R +1%
+8% D improvement
(Updated on March 6, 2014)
Arkansas: Hillary vs Mike Huckabee: R +3%
+21% D improvement
(Updated on May 5, 2014)
Colorado: Hillary vs Paul Ryan: R +3.5%
+8.9% R improvement
Current Republican gain
(Updated on July 17, 2014)
Florida: Hillary vs Bush: D +5.7%
+4.8% D improvement
(Updated on July 23, 2014)
Georgia: Hillary vs Christie: R +2%
+6% D improvement
(Updated August 8, 2013)
Iowa: Hillary vs Christie: D +3.9%
+1.9% R improvement
(Updated on July 17, 2014)
Kansas: Hillary vs Bush: R +9%
+13% D improvement
(Updated on February 24, 2014)
Kentucky: Hillary vs Christie/Bush: R +4%
+19% D improvement
(Updated on May 18, 2014)
Louisiana: Hillary vs Huckabee: R +3%
+14% D improvement
(Updated on July 12, 2014)
Maine: Hillary vs Christie: D +8%
+7% R improvement
(Updated on November 13, 2013)
Michigan: Hillary vs Christie: D +6.1%
+3.4% R improvement
(Updated on June 3, 2014)
Minnesota: Hillary vs Tim Pawlenty: D +6%
+2% R improvement
(Updated on June 18, 2014)
Mississippi: Hillary vs Huckabee: R +7%
+4.5% D improvement
(Updated on July 20, 2014)
Montana: Hillary vs Rand Paul: R +13%
+1% D improvement
(Updated on November 24, 2013)
New Hampshire: Hillary vs Huckabee: D +2.1%
+3.5% R improvement
(Updated on July 17, 2014)
New Jersey: Hillary vs Christie: D +9.6%
+8.2% R improvement
(Updated on March 4, 2014; includes governor exit poll)
New Mexico: Hillary vs Susana Martinez: D +14%
+4% D improvement
(Updated on March 27, 2014)
New York: Hillary vs Christie: D +28%
+0.2% R improvement
(Updated on March 4, 2014)
North Carolina: Hillary vs Christie: D +1.25%
+3.3% D improvement
Current Democratic gain
(Updated on June 19, 2014)
Ohio: Hillary vs Christie: D +6.2%
+3.2% D improvement
(Updated on May 15, 2014)
Oregon: Hillary vs Rand Paul/Huckabee: D +12%
Unchanged from 2012
(Updated on May 30, 2014)
Pennsylvania: Hillary vs Christie: D +3.5%
+1.9% R improvement
(Updated on June 5, 2014)
South Carolina: Hillary vs Marco Rubio: R +7%
+3.5% D improvement
(Updated on November 2, 2013)
Texas: Hillary vs Huckabee: R +8%
+8% D improvement
(Updated on April 18, 2014)
Virginia: Hillary vs Christie: D +3.2%
+0.6% R improvement
(Updated on March 27, 2014)
West Virginia: Hillary vs Bush: R +14%
+13% D improvement
(Updated on October 1, 2013)
Wisconsin: Hillary vs Ryan: D +5.1%
+1.8% R improvement
(Updated on April 25, 2014)
Wyoming: Hillary vs Christie: R +28%
+13% D improvement
(Updated on July 23, 2013)
Average all 29 states: Hillary vs Best Republican: D +0.2%
+3.7% D improvement (from Obama 2012) [projecting a 7.5% victory for Hillary]
That gives us this map right now:
()
Red = Democratic lead or trend
Blue = Republican lead or trend
Green = Basically tied or hardly any trend, unchanged from 2012
Grey = No polling yet
Green = toss up or less than 0.5% lead
20% shade = 0.6-2% lead
30% shade = 2.1-4% lead
40% shade = 4.1-6% lead
50% shade = 6.1-9% lead
60% shade = 9.1-12% lead
70% shade = 12.1-15% lead
80% shade = 15.1-18% lead
90% shade = Above 18.1% lead
In the count of electoral votes, this means the current situation looks like this:
Hillary: 216 EVs (for a total of 15 states)
Best/Tailormade Republican: 120 EVs (for a total of 14 states)
Toss-up: None
No polling: 202 EVs (for a total of 21 states + D.C.)
Which means that Hillary has captured a rather impressive 64.3% of all EVs awarded thus far, against a disappointing 35.7% EVs for the tailormade Republican. Even as the biggest price by far, California, hasn't been added yet.
This is how the Trendline Map looks so far:
( )
)
The states which right now are showing the strongest improvement for the Democratic (Hillary) or the Republican candidate (in 12 out of 29 cases, Christie is that person):
1. Arkansas: D +21%
2. Kentucky: D +19%
3. Louisiana: D +14%
4. Kansas: D +13%
5. West Virginia: D +13%
6. Wyoming: D +13%
7. Colorado: R +8.9%
8. New Jersey: R +8.2%
9. Arizona: D +8%
10. Texas: D +8%
11. Maine: R +7%
12. Alaska: D +7%
13. Georgia: D +6%
14. Florida: D +4.8%
15. Mississippi: D +4.5%
All of these changes (in the 15 states above) are (more than) statistically significant.
The whole list of states having been polled till now, going from Democratic stronghold to Republican stronghold:
New York: D +28%
New Mexico: D +14%
Oregon: D +12%
New Jersey: D +9.6%
Maine: D +8%
Currently estimated/projected national average: D +7.5%
Ohio: D +6.2%
Michigan: D +6.1%
Minnesota: D +6%
Florida: D +5.7%
Wisconsin: D +5.1%
Iowa: D +3.9%
Pennsylvania: D +3.5%
Virginia: D +3.2%
New Hampshire: D +2.1%
North Carolina: D +1.25%
Arizona: R +1%
Georgia: R +2%
Arkansas: R +3%
Louisiana: R +3%
Colorado: R +3.5%
Kentucky: R +4%
Alaska: R +7%
Mississippi: R +7%
South Carolina: R +7%
Texas: R +8%
Kansas: R +9%
Montana: R +13%
West Virginia: R +14%
Wyoming: R +28%
Here are the current stats on the best-tailored Republican candidates in all states polled so far:
1. Chris Christie favoured in 12 of 29 states (for 159 EVs)
2. Mike Huckabee in 6 states (Texas (!), Louisiana (!), Oregon (shared), Arkansas, Mississippi & New Hampshire (!) - for 69 EVs)
3. Jeb Bush favoured in 6 states (Florida, Arizona, Kentucky (!!) (shared), Kansas, West Virginia & Alaska - for 62 EVs)
4. Paul Ryan favoured in 2 states (Wisconsin & Colorado - for 19 EVs)
5. Rand Paul favoured in 2 states (Oregon (shared) & Montana - for 10 EVs)
6. Tim Pawlenty favoured in 1 state (Minnesota - for 10 EVs)
7. Marco Rubio favoured in 1 state (South Carolina - for 9 EVs)
8. Susana Martinez favoured in 1 state (New Mexico - for 5 EVs)
Current update as of July 23.
Huckabee: R+7%
Jeb Bush: R+6.5%
Christie: R+6%
Rand Paul: R+2%
Cruz: R+1%
Also, a Survey USA poll has now tested Christie against Hillary in Florida, which didn't change anything, as he was still trailing her by 11% in the state, as well as an average trail of 10.7% in the 6 Florida match ups featuring him so far.
The total number of state polls included in the lists below has thus now reached 140.
So here they are - all the 2016 poll averages for each state so far - 29 states having been polled to date - and how far off they are compared to the actual 2012 outcomes. I'm only including the Republican candidate with the best statewide polling.
Alaska: Hillary vs Jeb Bush: R +7%
+7% D improvement
(Updated on May 14, 2014)
Arizona: Hillary vs Bush: R +1%
+8% D improvement
(Updated on March 6, 2014)
Arkansas: Hillary vs Mike Huckabee: R +3%
+21% D improvement
(Updated on May 5, 2014)
Colorado: Hillary vs Paul Ryan: R +3.5%
+8.9% R improvement
Current Republican gain
(Updated on July 17, 2014)
Florida: Hillary vs Bush: D +5.7%
+4.8% D improvement
(Updated on July 23, 2014)
Georgia: Hillary vs Christie: R +2%
+6% D improvement
(Updated August 8, 2013)
Iowa: Hillary vs Christie: D +3.9%
+1.9% R improvement
(Updated on July 17, 2014)
Kansas: Hillary vs Bush: R +9%
+13% D improvement
(Updated on February 24, 2014)
Kentucky: Hillary vs Christie/Bush: R +4%
+19% D improvement
(Updated on May 18, 2014)
Louisiana: Hillary vs Huckabee: R +3%
+14% D improvement
(Updated on July 12, 2014)
Maine: Hillary vs Christie: D +8%
+7% R improvement
(Updated on November 13, 2013)
Michigan: Hillary vs Christie: D +6.1%
+3.4% R improvement
(Updated on June 3, 2014)
Minnesota: Hillary vs Tim Pawlenty: D +6%
+2% R improvement
(Updated on June 18, 2014)
Mississippi: Hillary vs Huckabee: R +7%
+4.5% D improvement
(Updated on July 20, 2014)
Montana: Hillary vs Rand Paul: R +13%
+1% D improvement
(Updated on November 24, 2013)
New Hampshire: Hillary vs Huckabee: D +2.1%
+3.5% R improvement
(Updated on July 17, 2014)
New Jersey: Hillary vs Christie: D +9.6%
+8.2% R improvement
(Updated on March 4, 2014; includes governor exit poll)
New Mexico: Hillary vs Susana Martinez: D +14%
+4% D improvement
(Updated on March 27, 2014)
New York: Hillary vs Christie: D +28%
+0.2% R improvement
(Updated on March 4, 2014)
North Carolina: Hillary vs Christie: D +1.25%
+3.3% D improvement
Current Democratic gain
(Updated on June 19, 2014)
Ohio: Hillary vs Christie: D +6.2%
+3.2% D improvement
(Updated on May 15, 2014)
Oregon: Hillary vs Rand Paul/Huckabee: D +12%
Unchanged from 2012
(Updated on May 30, 2014)
Pennsylvania: Hillary vs Christie: D +3.5%
+1.9% R improvement
(Updated on June 5, 2014)
South Carolina: Hillary vs Marco Rubio: R +7%
+3.5% D improvement
(Updated on November 2, 2013)
Texas: Hillary vs Huckabee: R +8%
+8% D improvement
(Updated on April 18, 2014)
Virginia: Hillary vs Christie: D +3.2%
+0.6% R improvement
(Updated on March 27, 2014)
West Virginia: Hillary vs Bush: R +14%
+13% D improvement
(Updated on October 1, 2013)
Wisconsin: Hillary vs Ryan: D +5.1%
+1.8% R improvement
(Updated on April 25, 2014)
Wyoming: Hillary vs Christie: R +28%
+13% D improvement
(Updated on July 23, 2013)
Average all 29 states: Hillary vs Best Republican: D +0.2%
+3.7% D improvement (from Obama 2012) [projecting a 7.5% victory for Hillary]
That gives us this map right now:
(
Red = Democratic lead or trend
Blue = Republican lead or trend
Green = Basically tied or hardly any trend, unchanged from 2012
Grey = No polling yet
Green = toss up or less than 0.5% lead
20% shade = 0.6-2% lead
30% shade = 2.1-4% lead
40% shade = 4.1-6% lead
50% shade = 6.1-9% lead
60% shade = 9.1-12% lead
70% shade = 12.1-15% lead
80% shade = 15.1-18% lead
90% shade = Above 18.1% lead
In the count of electoral votes, this means the current situation looks like this:
Hillary: 216 EVs (for a total of 15 states)
Best/Tailormade Republican: 120 EVs (for a total of 14 states)
Toss-up: None
No polling: 202 EVs (for a total of 21 states + D.C.)
Which means that Hillary has captured a rather impressive 64.3% of all EVs awarded thus far, against a disappointing 35.7% EVs for the tailormade Republican. Even as the biggest price by far, California, hasn't been added yet.
This is how the Trendline Map looks so far:
(
The states which right now are showing the strongest improvement for the Democratic (Hillary) or the Republican candidate (in 12 out of 29 cases, Christie is that person):
1. Arkansas: D +21%
2. Kentucky: D +19%
3. Louisiana: D +14%
4. Kansas: D +13%
5. West Virginia: D +13%
6. Wyoming: D +13%
7. Colorado: R +8.9%
8. New Jersey: R +8.2%
9. Arizona: D +8%
10. Texas: D +8%
11. Maine: R +7%
12. Alaska: D +7%
13. Georgia: D +6%
14. Florida: D +4.8%
15. Mississippi: D +4.5%
All of these changes (in the 15 states above) are (more than) statistically significant.
The whole list of states having been polled till now, going from Democratic stronghold to Republican stronghold:
New York: D +28%
New Mexico: D +14%
Oregon: D +12%
New Jersey: D +9.6%
Maine: D +8%
Currently estimated/projected national average: D +7.5%
Ohio: D +6.2%
Michigan: D +6.1%
Minnesota: D +6%
Florida: D +5.7%
Wisconsin: D +5.1%
Iowa: D +3.9%
Pennsylvania: D +3.5%
Virginia: D +3.2%
New Hampshire: D +2.1%
North Carolina: D +1.25%
Arizona: R +1%
Georgia: R +2%
Arkansas: R +3%
Louisiana: R +3%
Colorado: R +3.5%
Kentucky: R +4%
Alaska: R +7%
Mississippi: R +7%
South Carolina: R +7%
Texas: R +8%
Kansas: R +9%
Montana: R +13%
West Virginia: R +14%
Wyoming: R +28%
Here are the current stats on the best-tailored Republican candidates in all states polled so far:
1. Chris Christie favoured in 12 of 29 states (for 159 EVs)
2. Mike Huckabee in 6 states (Texas (!), Louisiana (!), Oregon (shared), Arkansas, Mississippi & New Hampshire (!) - for 69 EVs)
3. Jeb Bush favoured in 6 states (Florida, Arizona, Kentucky (!!) (shared), Kansas, West Virginia & Alaska - for 62 EVs)
4. Paul Ryan favoured in 2 states (Wisconsin & Colorado - for 19 EVs)
5. Rand Paul favoured in 2 states (Oregon (shared) & Montana - for 10 EVs)
6. Tim Pawlenty favoured in 1 state (Minnesota - for 10 EVs)
7. Marco Rubio favoured in 1 state (South Carolina - for 9 EVs)
8. Susana Martinez favoured in 1 state (New Mexico - for 5 EVs)
Current update as of July 23.
Title: Re: 2016 Official Polling Map Thread
Post by: HagridOfTheDeep on July 20, 2014, 04:49:10 PM
And people try to say Hillary would've been a worse candidate than Obama in '08. Pfft. I know her tenure as Secretary of State has bolstered her credentials and endeared her to the public, but the point is, she is naturally a good fit for some of these traditional R states.
Title: Re: 2016 Official Polling Map Thread
Post by: pbrower2a on July 22, 2014, 07:42:27 PM
Survey USA, Florida
http://www.surveyusa.com/client/PollReport.aspx?g=9879b1f3-f54d-4ae5-ba27-5a1b5207710a
Nothing on Huckabee, but we have plenty of polls involving him.
If Florida is a quick call for the Democrat, then the election is settled.
Hillary Clinton vs. Jeb Bush
(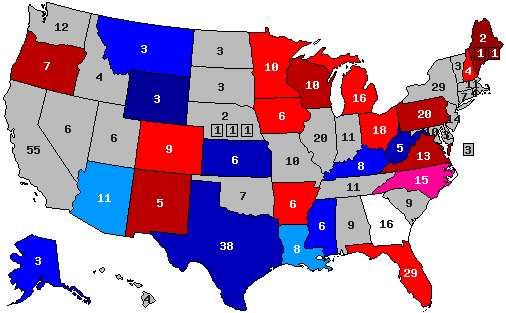 )
)
Hillary Clinton vs. Chris Christie
()
Hillary Clinton vs. Mike Huckabee
()
Hillary Clinton vs. Rand Paul
()
blue, Republican -- red, Democratic
30% -- lead with 40-49% but a margin of 3% or less
40% -- lead with 40-49% but a margin of 4% or more
60% -- lead with 50-54%
70% -- lead with 55-59%
90% -- lead with 60% or more
Quote
* Hillary Clinton 49%.
* Chris Christie 38%.
* Chris Christie 48%.
* Joe Biden 39%.
* Hillary Clinton 46%.
* Rand Paul 42%.
* Rand Paul 47%.
* Joe Biden 39%.
* Hillary Clinton 53%.
* Marco Rubio 39%.
* Marco Rubio 46%.
* Joe Biden 43%.
* Hillary Clinton 47%.
* Jeb Bush 41%.
* Jeb Bush 47%.
* Joe Biden 38%
. * Chris Christie 38%.
* Chris Christie 48%.
* Joe Biden 39%.
* Hillary Clinton 46%.
* Rand Paul 42%.
* Rand Paul 47%.
* Joe Biden 39%.
* Hillary Clinton 53%.
* Marco Rubio 39%.
* Marco Rubio 46%.
* Joe Biden 43%.
* Hillary Clinton 47%.
* Jeb Bush 41%.
* Jeb Bush 47%.
* Joe Biden 38%
http://www.surveyusa.com/client/PollReport.aspx?g=9879b1f3-f54d-4ae5-ba27-5a1b5207710a
Nothing on Huckabee, but we have plenty of polls involving him.
If Florida is a quick call for the Democrat, then the election is settled.
Hillary Clinton vs. Jeb Bush
(
Hillary Clinton vs. Chris Christie
(
Hillary Clinton vs. Mike Huckabee
(
Hillary Clinton vs. Rand Paul
(
blue, Republican -- red, Democratic
30% -- lead with 40-49% but a margin of 3% or less
40% -- lead with 40-49% but a margin of 4% or more
60% -- lead with 50-54%
70% -- lead with 55-59%
90% -- lead with 60% or more
Title: Re: 2016 Official Polling Map Thread
Post by: pbrower2a on July 23, 2014, 01:20:39 PM
Virginia, Roanoake College
Hillary Clinton holds significant and very similar leads over Republicans Chris Christie (44%-34%), Rand Paul (47%-37%), and Paul Ryan (47%-38%).
http://roanoke.edu/News_and_Events/News_Archive/RC_Poll_July_2014_Election_poll.htm
There's a partial poll by Gravis Marketing for right-wing Human Events, showing Jeb Bush up 49-39 on Hillary Clinton. It would change nothing even if I accepted it.
Nothing on Huckabee or Jeb Bush, but we have plenty of polls involving him.
If Virginia is a quick call for the Democrat, then the election is settled.
Hillary Clinton vs. Jeb Bush
()
Hillary Clinton vs. Chris Christie
()
Hillary Clinton vs. Mike Huckabee
()
Hillary Clinton vs. Rand Paul
()
blue, Republican -- red, Democratic
30% -- lead with 40-49% but a margin of 3% or less
40% -- lead with 40-49% but a margin of 4% or more
60% -- lead with 50-54%
70% -- lead with 55-59%
90% -- lead with 60% or more
[/quote]
Hillary Clinton holds significant and very similar leads over Republicans Chris Christie (44%-34%), Rand Paul (47%-37%), and Paul Ryan (47%-38%).
http://roanoke.edu/News_and_Events/News_Archive/RC_Poll_July_2014_Election_poll.htm
There's a partial poll by Gravis Marketing for right-wing Human Events, showing Jeb Bush up 49-39 on Hillary Clinton. It would change nothing even if I accepted it.
Nothing on Huckabee or Jeb Bush, but we have plenty of polls involving him.
If Virginia is a quick call for the Democrat, then the election is settled.
Hillary Clinton vs. Jeb Bush
(
Hillary Clinton vs. Chris Christie
(
Hillary Clinton vs. Mike Huckabee
(
Hillary Clinton vs. Rand Paul
(
blue, Republican -- red, Democratic
30% -- lead with 40-49% but a margin of 3% or less
40% -- lead with 40-49% but a margin of 4% or more
60% -- lead with 50-54%
70% -- lead with 55-59%
90% -- lead with 60% or more
[/quote]
Title: Re: 2016 Official Polling Map Thread
Post by: eric82oslo on July 23, 2014, 01:53:33 PM
We have two new polls out today, one in Virginia and the other in Montana. Both look fairly decent for Hillary, while the Virginia poll is truely splendid news. Now, there's no question that Brian Schweitzer would be a considerably stronger presidential candidate for Montana than Hillary would. I'm unsure if I should switch the two in the Montana data as a result. Perhaps the better solution is to keep tracking Hillary in the state, but simultaneously keeping Schweitzer's numbers between brackets ().
Here are the current match up averages for Hillary in Montana:
Rand Paul: R +13%
Christie: R +11%
Cruz: R +11%
Rubio: R +8%
Bush: R +7%
Paul Ryan: R +7%
Schweitzer's strongest opponent in Montana would also be Rand Paul, whom he is trailing by "only" 8%, which is actually 5 percentage points stronger than Hillary achieves against him! Second strongest is Paul Ryan, which he trails by 4%. Then follows Christie at 3.5% (7.5 percentage points better than for Hillary!) and Cruz at 3% (an astonishing 8 percentage point better than Hillary does!). Despite Schweitzer's strong home state bounce, he is only ahead of one GOPer yet, Jeb Bush and just by a single point. Schweitzer & Rubio are currently tied.
The current match up averages for Hillary in Virginia:
Christie: D +3.64%
Rubio: D +7.6%
Bush: D +8.67%
Bob McDonnell: D +9%
Rand Paul: D +9.4%
Walker: D +11%
Paul Ryan: D +11.25%
Huckabee: D +11.5%
Cruz: D +12.3%
We see an average improvement, from the previous update, for Hillary in Virginia over her strongest opponent Christie of +0.45%. No change is recorded in Montana however.
The entire update, with maps and all, to follow in my next post! I've exceeded the 11 000 characters allowed...
Title: Re: 2016 Official Polling Map Thread
Post by: eric82oslo on July 23, 2014, 02:01:09 PM
So here's the rest of the update, following the two new polls from Gravis Marketing & Roanoke College in Montana & Virginia. Gravis did not poll the GOP frontrunner Rand Paul in Montana, so no change their (unfortunately). Notice how a Christie/Clinton match up would result in virtually no change from Obama/Romney in Virginia! That means that Virginia, just like Oregon and New York, seems "electorally stuck" at the moment, marked as green on the trendline map. However, Christie is not the strongest GOP option in Oregon, like he seems likely to be in Virginia and New York.
Also, I just noticed that I've compared Arkansas' numbers with Obama's 2008 numbers. As Obama did considerably worse in Arkansas in 2012, Hillary's actual improvement in the state is actually 21%, not the 17% which I've been reporting lately. This fact also strenghtens Hillary's projected national lead somewhat, up to her current +7.6%.
The total number of state polls included in the lists below has thus now reached 142.
So here they are - all the 2016 poll averages for each state so far - 29 states having been polled to date - and how far off they are compared to the actual 2012 outcomes. I'm only including the Republican candidate with the best statewide polling.
Alaska: Hillary vs Jeb Bush: R +7%
+7% D improvement
(Updated on May 14, 2014)
Arizona: Hillary vs Bush: R +1%
+8% D improvement
(Updated on March 6, 2014)
Arkansas: Hillary vs Mike Huckabee: R +3%
+21% D improvement
(Updated on May 5, 2014)
Colorado: Hillary vs Paul Ryan: R +3.5%
+8.9% R improvement
Current Republican gain
(Updated on July 17, 2014)
Florida: Hillary vs Bush: D +5.7%
+4.8% D improvement
(Updated on July 23, 2014)
Georgia: Hillary vs Christie: R +2%
+6% D improvement
(Updated August 8, 2013)
Iowa: Hillary vs Christie: D +3.9%
+1.9% R improvement
(Updated on July 17, 2014)
Kansas: Hillary vs Bush: R +9%
+13% D improvement
(Updated on February 24, 2014)
Kentucky: Hillary vs Christie/Bush: R +4%
+19% D improvement
(Updated on May 18, 2014)
Louisiana: Hillary vs Huckabee: R +3%
+14% D improvement
(Updated on July 12, 2014)
Maine: Hillary vs Christie: D +8%
+7% R improvement
(Updated on November 13, 2013)
Michigan: Hillary vs Christie: D +6.1%
+3.4% R improvement
(Updated on June 3, 2014)
Minnesota: Hillary vs Tim Pawlenty: D +6%
+2% R improvement
(Updated on June 18, 2014)
Mississippi: Hillary vs Huckabee: R +7%
+4.5% D improvement
(Updated on July 20, 2014)
Montana: Hillary vs Rand Paul: R +13% (Brian Schweitzer vs Rand Paul: R +8%)
+1% D improvement
(Updated on July 23, 2014)
New Hampshire: Hillary vs Huckabee: D +2.1%
+3.5% R improvement
(Updated on July 17, 2014)
New Jersey: Hillary vs Christie: D +9.6%
+8.2% R improvement
(Updated on March 4, 2014; includes governor exit poll)
New Mexico: Hillary vs Susana Martinez: D +14%
+4% D improvement
(Updated on March 27, 2014)
New York: Hillary vs Christie: D +28%
+0.2% R improvement
(Updated on March 4, 2014)
North Carolina: Hillary vs Christie: D +1.25%
+3.3% D improvement
Current Democratic gain
(Updated on June 19, 2014)
Ohio: Hillary vs Christie: D +6.2%
+3.2% D improvement
(Updated on May 15, 2014)
Oregon: Hillary vs Rand Paul/Huckabee: D +12%
Unchanged from 2012
(Updated on May 30, 2014)
Pennsylvania: Hillary vs Christie: D +3.5%
+1.9% R improvement
(Updated on June 5, 2014)
South Carolina: Hillary vs Marco Rubio: R +7%
+3.5% D improvement
(Updated on November 2, 2013)
Texas: Hillary vs Huckabee: R +8%
+8% D improvement
(Updated on April 18, 2014)
Virginia: Hillary vs Christie: D +3.64%
+0.2% R improvement
(Updated on July 23, 2014)
West Virginia: Hillary vs Bush: R +14%
+13% D improvement
(Updated on October 1, 2013)
Wisconsin: Hillary vs Ryan: D +5.1%
+1.8% R improvement
(Updated on April 25, 2014)
Wyoming: Hillary vs Christie: R +28%
+13% D improvement
(Updated on July 23, 2013)
Average all 29 states: Hillary vs Best Republican: D +0.2%
+3.7% D improvement (from Obama 2012) [projecting a 7.55% victory for Hillary]
That gives us this map right now:
()
Red = Democratic lead or trend
Blue = Republican lead or trend
Green = Basically tied or hardly any trend, unchanged from 2012
Grey = No polling yet
Green = toss up or less than 0.5% lead
20% shade = 0.6-2% lead
30% shade = 2.1-4% lead
40% shade = 4.1-6% lead
50% shade = 6.1-9% lead
60% shade = 9.1-12% lead
70% shade = 12.1-15% lead
80% shade = 15.1-18% lead
90% shade = Above 18.1% lead
In the count of electoral votes, this means the current situation looks like this:
Hillary: 216 EVs (for a total of 15 states)
Best/Tailormade Republican: 120 EVs (for a total of 14 states)
Toss-up: None
No polling: 202 EVs (for a total of 21 states + D.C.)
Which means that Hillary has captured a rather impressive 64.3% of all EVs awarded thus far, against a disappointing 35.7% EVs for the tailormade Republican. Even as the biggest price by far, California, hasn't been added yet.
This is how the Trendline Map looks so far:
( )
)
The states which right now are showing the strongest improvement for the Democratic (Hillary) or the Republican candidate (in 12 out of 29 cases, Christie is that person):
1. Arkansas: D +21%
2. Kentucky: D +19%
3. Louisiana: D +14%
4. Kansas: D +13%
5. West Virginia: D +13%
6. Wyoming: D +13%
7. Colorado: R +8.9%
8. New Jersey: R +8.2%
9. Arizona: D +8%
10. Texas: D +8%
11. Maine: R +7%
12. Alaska: D +7%
13. Georgia: D +6%
14. Florida: D +4.8%
15. Mississippi: D +4.5%
All of these changes (in the 15 states above) are (more than) statistically significant.
The whole list of states having been polled till now, going from Democratic stronghold to Republican stronghold:
New York: D +28%
New Mexico: D +14%
Oregon: D +12%
New Jersey: D +9.6%
Maine: D +8%
Currently estimated/projected national average: D +7.55%
Ohio: D +6.2%
Michigan: D +6.1%
Minnesota: D +6%
Florida: D +5.7%
Wisconsin: D +5.1%
Iowa: D +3.9%
Virginia: D +3.6%
Pennsylvania: D +3.5%
New Hampshire: D +2.1%
North Carolina: D +1.25%
Arizona: R +1%
Georgia: R +2%
Arkansas: R +3%
Louisiana: R +3%
Colorado: R +3.5%
Kentucky: R +4%
Alaska: R +7%
Mississippi: R +7%
South Carolina: R +7%
Texas: R +8%
Kansas: R +9%
Montana: R +13%
West Virginia: R +14%
Wyoming: R +28%
Here are the current stats on the best-tailored Republican candidates in all states polled so far:
1. Chris Christie favoured in 12 of 29 states (for 159 EVs)
2. Mike Huckabee in 6 states (Texas (!), Louisiana (!), Oregon (shared), Arkansas, Mississippi & New Hampshire (!) - for 69 EVs)
3. Jeb Bush favoured in 6 states (Florida, Arizona, Kentucky (!!) (shared), Kansas, West Virginia & Alaska - for 62 EVs)
4. Paul Ryan favoured in 2 states (Wisconsin & Colorado - for 19 EVs)
5. Rand Paul favoured in 2 states (Oregon (shared) & Montana - for 10 EVs)
6. Tim Pawlenty favoured in 1 state (Minnesota - for 10 EVs)
7. Marco Rubio favoured in 1 state (South Carolina - for 9 EVs)
8. Susana Martinez favoured in 1 state (New Mexico - for 5 EVs)
Current update as of July 23.
Also, I just noticed that I've compared Arkansas' numbers with Obama's 2008 numbers. As Obama did considerably worse in Arkansas in 2012, Hillary's actual improvement in the state is actually 21%, not the 17% which I've been reporting lately. This fact also strenghtens Hillary's projected national lead somewhat, up to her current +7.6%.
The total number of state polls included in the lists below has thus now reached 142.
So here they are - all the 2016 poll averages for each state so far - 29 states having been polled to date - and how far off they are compared to the actual 2012 outcomes. I'm only including the Republican candidate with the best statewide polling.
Alaska: Hillary vs Jeb Bush: R +7%
+7% D improvement
(Updated on May 14, 2014)
Arizona: Hillary vs Bush: R +1%
+8% D improvement
(Updated on March 6, 2014)
Arkansas: Hillary vs Mike Huckabee: R +3%
+21% D improvement
(Updated on May 5, 2014)
Colorado: Hillary vs Paul Ryan: R +3.5%
+8.9% R improvement
Current Republican gain
(Updated on July 17, 2014)
Florida: Hillary vs Bush: D +5.7%
+4.8% D improvement
(Updated on July 23, 2014)
Georgia: Hillary vs Christie: R +2%
+6% D improvement
(Updated August 8, 2013)
Iowa: Hillary vs Christie: D +3.9%
+1.9% R improvement
(Updated on July 17, 2014)
Kansas: Hillary vs Bush: R +9%
+13% D improvement
(Updated on February 24, 2014)
Kentucky: Hillary vs Christie/Bush: R +4%
+19% D improvement
(Updated on May 18, 2014)
Louisiana: Hillary vs Huckabee: R +3%
+14% D improvement
(Updated on July 12, 2014)
Maine: Hillary vs Christie: D +8%
+7% R improvement
(Updated on November 13, 2013)
Michigan: Hillary vs Christie: D +6.1%
+3.4% R improvement
(Updated on June 3, 2014)
Minnesota: Hillary vs Tim Pawlenty: D +6%
+2% R improvement
(Updated on June 18, 2014)
Mississippi: Hillary vs Huckabee: R +7%
+4.5% D improvement
(Updated on July 20, 2014)
Montana: Hillary vs Rand Paul: R +13% (Brian Schweitzer vs Rand Paul: R +8%)
+1% D improvement
(Updated on July 23, 2014)
New Hampshire: Hillary vs Huckabee: D +2.1%
+3.5% R improvement
(Updated on July 17, 2014)
New Jersey: Hillary vs Christie: D +9.6%
+8.2% R improvement
(Updated on March 4, 2014; includes governor exit poll)
New Mexico: Hillary vs Susana Martinez: D +14%
+4% D improvement
(Updated on March 27, 2014)
New York: Hillary vs Christie: D +28%
+0.2% R improvement
(Updated on March 4, 2014)
North Carolina: Hillary vs Christie: D +1.25%
+3.3% D improvement
Current Democratic gain
(Updated on June 19, 2014)
Ohio: Hillary vs Christie: D +6.2%
+3.2% D improvement
(Updated on May 15, 2014)
Oregon: Hillary vs Rand Paul/Huckabee: D +12%
Unchanged from 2012
(Updated on May 30, 2014)
Pennsylvania: Hillary vs Christie: D +3.5%
+1.9% R improvement
(Updated on June 5, 2014)
South Carolina: Hillary vs Marco Rubio: R +7%
+3.5% D improvement
(Updated on November 2, 2013)
Texas: Hillary vs Huckabee: R +8%
+8% D improvement
(Updated on April 18, 2014)
Virginia: Hillary vs Christie: D +3.64%
+0.2% R improvement
(Updated on July 23, 2014)
West Virginia: Hillary vs Bush: R +14%
+13% D improvement
(Updated on October 1, 2013)
Wisconsin: Hillary vs Ryan: D +5.1%
+1.8% R improvement
(Updated on April 25, 2014)
Wyoming: Hillary vs Christie: R +28%
+13% D improvement
(Updated on July 23, 2013)
Average all 29 states: Hillary vs Best Republican: D +0.2%
+3.7% D improvement (from Obama 2012) [projecting a 7.55% victory for Hillary]
That gives us this map right now:
(
Red = Democratic lead or trend
Blue = Republican lead or trend
Green = Basically tied or hardly any trend, unchanged from 2012
Grey = No polling yet
Green = toss up or less than 0.5% lead
20% shade = 0.6-2% lead
30% shade = 2.1-4% lead
40% shade = 4.1-6% lead
50% shade = 6.1-9% lead
60% shade = 9.1-12% lead
70% shade = 12.1-15% lead
80% shade = 15.1-18% lead
90% shade = Above 18.1% lead
In the count of electoral votes, this means the current situation looks like this:
Hillary: 216 EVs (for a total of 15 states)
Best/Tailormade Republican: 120 EVs (for a total of 14 states)
Toss-up: None
No polling: 202 EVs (for a total of 21 states + D.C.)
Which means that Hillary has captured a rather impressive 64.3% of all EVs awarded thus far, against a disappointing 35.7% EVs for the tailormade Republican. Even as the biggest price by far, California, hasn't been added yet.
This is how the Trendline Map looks so far:
(
The states which right now are showing the strongest improvement for the Democratic (Hillary) or the Republican candidate (in 12 out of 29 cases, Christie is that person):
1. Arkansas: D +21%
2. Kentucky: D +19%
3. Louisiana: D +14%
4. Kansas: D +13%
5. West Virginia: D +13%
6. Wyoming: D +13%
7. Colorado: R +8.9%
8. New Jersey: R +8.2%
9. Arizona: D +8%
10. Texas: D +8%
11. Maine: R +7%
12. Alaska: D +7%
13. Georgia: D +6%
14. Florida: D +4.8%
15. Mississippi: D +4.5%
All of these changes (in the 15 states above) are (more than) statistically significant.
The whole list of states having been polled till now, going from Democratic stronghold to Republican stronghold:
New York: D +28%
New Mexico: D +14%
Oregon: D +12%
New Jersey: D +9.6%
Maine: D +8%
Currently estimated/projected national average: D +7.55%
Ohio: D +6.2%
Michigan: D +6.1%
Minnesota: D +6%
Florida: D +5.7%
Wisconsin: D +5.1%
Iowa: D +3.9%
Virginia: D +3.6%
Pennsylvania: D +3.5%
New Hampshire: D +2.1%
North Carolina: D +1.25%
Arizona: R +1%
Georgia: R +2%
Arkansas: R +3%
Louisiana: R +3%
Colorado: R +3.5%
Kentucky: R +4%
Alaska: R +7%
Mississippi: R +7%
South Carolina: R +7%
Texas: R +8%
Kansas: R +9%
Montana: R +13%
West Virginia: R +14%
Wyoming: R +28%
Here are the current stats on the best-tailored Republican candidates in all states polled so far:
1. Chris Christie favoured in 12 of 29 states (for 159 EVs)
2. Mike Huckabee in 6 states (Texas (!), Louisiana (!), Oregon (shared), Arkansas, Mississippi & New Hampshire (!) - for 69 EVs)
3. Jeb Bush favoured in 6 states (Florida, Arizona, Kentucky (!!) (shared), Kansas, West Virginia & Alaska - for 62 EVs)
4. Paul Ryan favoured in 2 states (Wisconsin & Colorado - for 19 EVs)
5. Rand Paul favoured in 2 states (Oregon (shared) & Montana - for 10 EVs)
6. Tim Pawlenty favoured in 1 state (Minnesota - for 10 EVs)
7. Marco Rubio favoured in 1 state (South Carolina - for 9 EVs)
8. Susana Martinez favoured in 1 state (New Mexico - for 5 EVs)
Current update as of July 23.
Title: Re: 2016 Official Polling Map Thread
Post by: pbrower2a on July 23, 2014, 10:44:28 PM
Now that the Senate and Gubernatorial races in Georgia are set, we ought to see some polls from Georgia.
Title: Re: 2016 Official Polling Map Thread
Post by: eric82oslo on July 24, 2014, 03:37:59 PM
Quinnipiac has just polled Florida, so that means we now have 15 separate 2016 polls from this state already (6 from Quinnipiac, 4 from Survey USA, 3 from PPP, and 1 each from Gravis Marketing & Saint Leo University). In this latest poll, Hillary leads her 5 GOP opponents, of which two are Floridians, by margins ranging from 7% to 21%, the median being 14%.
Here are Hillary's current average leads in Florida:
Vs Bush: D +5.82% (up +0.1% from last average)
Vs Rubio: D +9.8%
Vs Paul Ryan: D +11.2%
Vs Rand Paul: D +11.6%
Vs Christie: D +12.1%
Vs Huckabee: D +12.5%
Vs Cruz: D +17.8%
In other words, Clinton's average lead of all 15 Florida polls range between a 6% and an 18% margin against the 7 GOP candidates having been tested there. Not much different from her 7% to 21% margins in the latest poll released today. Bush and Rubio have both been tested against her in 11 different polls.
The total number of state polls included in the lists below has thus now reached 143.
So here they are - all the 2016 poll averages for each state so far - 29 states having been polled to date - and how far off they are compared to the actual 2012 outcomes. I'm only including the Republican candidate with the best statewide polling.
Alaska: Hillary vs Jeb Bush: R +7%
+7% D improvement
(Updated on May 14, 2014)
Arizona: Hillary vs Bush: R +1%
+8% D improvement
(Updated on March 6, 2014)
Arkansas: Hillary vs Mike Huckabee: R +3%
+21% D improvement
(Updated on May 5, 2014)
Colorado: Hillary vs Paul Ryan: R +3.5%
+8.9% R improvement
Current Republican gain
(Updated on July 17, 2014)
Florida: Hillary vs Bush: D +5.8%
+4.9% D improvement
(Updated on July 24, 2014)
Georgia: Hillary vs Christie: R +2%
+6% D improvement
(Updated August 8, 2013)
Iowa: Hillary vs Christie: D +3.9%
+1.9% R improvement
(Updated on July 17, 2014)
Kansas: Hillary vs Bush: R +9%
+13% D improvement
(Updated on February 24, 2014)
Kentucky: Hillary vs Christie/Bush: R +4%
+19% D improvement
(Updated on May 18, 2014)
Louisiana: Hillary vs Huckabee: R +3%
+14% D improvement
(Updated on July 12, 2014)
Maine: Hillary vs Christie: D +8%
+7% R improvement
(Updated on November 13, 2013)
Michigan: Hillary vs Christie: D +6.1%
+3.4% R improvement
(Updated on June 3, 2014)
Minnesota: Hillary vs Tim Pawlenty: D +6%
+2% R improvement
(Updated on June 18, 2014)
Mississippi: Hillary vs Huckabee: R +7%
+4.5% D improvement
(Updated on July 20, 2014)
Montana: Hillary vs Rand Paul: R +13% (Brian Schweitzer vs Rand Paul: R +8%)
+1% D improvement
(Updated on July 23, 2014)
New Hampshire: Hillary vs Huckabee: D +2.1%
+3.5% R improvement
(Updated on July 17, 2014)
New Jersey: Hillary vs Christie: D +9.6%
+8.2% R improvement
(Updated on March 4, 2014; includes governor exit poll)
New Mexico: Hillary vs Susana Martinez: D +14%
+4% D improvement
(Updated on March 27, 2014)
New York: Hillary vs Christie: D +28%
+0.2% R improvement
(Updated on March 4, 2014)
North Carolina: Hillary vs Christie: D +1.25%
+3.3% D improvement
Current Democratic gain
(Updated on June 19, 2014)
Ohio: Hillary vs Christie: D +6.2%
+3.2% D improvement
(Updated on May 15, 2014)
Oregon: Hillary vs Rand Paul/Huckabee: D +12%
Unchanged from 2012
(Updated on May 30, 2014)
Pennsylvania: Hillary vs Christie: D +3.5%
+1.9% R improvement
(Updated on June 5, 2014)
South Carolina: Hillary vs Marco Rubio: R +7%
+3.5% D improvement
(Updated on November 2, 2013)
Texas: Hillary vs Huckabee: R +8%
+8% D improvement
(Updated on April 18, 2014)
Virginia: Hillary vs Christie: D +3.64%
+0.2% R improvement
(Updated on July 23, 2014)
West Virginia: Hillary vs Bush: R +14%
+13% D improvement
(Updated on October 1, 2013)
Wisconsin: Hillary vs Ryan: D +5.1%
+1.8% R improvement
(Updated on April 25, 2014)
Wyoming: Hillary vs Christie: R +28%
+13% D improvement
(Updated on July 23, 2013)
Average all 29 states: Hillary vs Best Republican: D +0.2%
+3.7% D improvement (from Obama 2012) [projecting a 7.6% victory for Hillary]
That gives us this map right now:
()
Red = Democratic lead or trend
Blue = Republican lead or trend
Green = Basically tied or hardly any trend, unchanged from 2012
Grey = No polling yet
Green = toss up or less than 0.5% lead
20% shade = 0.6-2% lead
30% shade = 2.1-4% lead
40% shade = 4.1-6% lead
50% shade = 6.1-9% lead
60% shade = 9.1-12% lead
70% shade = 12.1-15% lead
80% shade = 15.1-18% lead
90% shade = Above 18.1% lead
In the count of electoral votes, this means the current situation looks like this:
Hillary: 216 EVs (for a total of 15 states)
Best/Tailormade Republican: 120 EVs (for a total of 14 states)
Toss-up: None
No polling: 202 EVs (for a total of 21 states + D.C.)
Which means that Hillary has captured a rather impressive 64.3% of all EVs awarded thus far, against a disappointing 35.7% EVs for the tailormade Republican. Even as the biggest price by far, California, hasn't been added yet.
This is how the Trendline Map looks so far:
()
The states which right now are showing the strongest improvement for the Democratic (Hillary) or the Republican candidate (in 12 out of 29 cases, Christie is that person):
1. Arkansas: D +21%
2. Kentucky: D +19%
3. Louisiana: D +14%
4. Kansas: D +13%
5. West Virginia: D +13%
6. Wyoming: D +13%
7. Colorado: R +8.9%
8. New Jersey: R +8.2%
9. Arizona: D +8%
10. Texas: D +8%
11. Maine: R +7%
12. Alaska: D +7%
13. Georgia: D +6%
14. Florida: D +4.9%
15. Mississippi: D +4.5%
All of these changes (in the 15 states above) are (more than) statistically significant.
The whole list of states having been polled till now, going from Democratic stronghold to Republican stronghold:
New York: D +28%
New Mexico: D +14%
Oregon: D +12%
New Jersey: D +9.6%
Maine: D +8%
Currently estimated/projected national average: D +7.6%
Ohio: D +6.2%
Michigan: D +6.1%
Minnesota: D +6%
Florida: D +5.8%
Wisconsin: D +5.1%
Iowa: D +3.9%
Virginia: D +3.6%
Pennsylvania: D +3.5%
New Hampshire: D +2.1%
North Carolina: D +1.25%
Arizona: R +1%
Georgia: R +2%
Arkansas: R +3%
Louisiana: R +3%
Colorado: R +3.5%
Kentucky: R +4%
Alaska: R +7%
Mississippi: R +7%
South Carolina: R +7%
Texas: R +8%
Kansas: R +9%
Montana: R +13%
West Virginia: R +14%
Wyoming: R +28%
Here are the current stats on the best-tailored Republican candidates in all states polled so far:
1. Chris Christie favoured in 12 of 29 states (for 159 EVs)
2. Mike Huckabee in 6 states (Texas (!), Louisiana (!), Oregon (shared), Arkansas, Mississippi & New Hampshire (!) - for 69 EVs)
3. Jeb Bush favoured in 6 states (Florida, Arizona, Kentucky (!!) (shared), Kansas, West Virginia & Alaska - for 62 EVs)
4. Paul Ryan favoured in 2 states (Wisconsin & Colorado - for 19 EVs)
5. Rand Paul favoured in 2 states (Oregon (shared) & Montana - for 10 EVs)
6. Tim Pawlenty favoured in 1 state (Minnesota - for 10 EVs)
7. Marco Rubio favoured in 1 state (South Carolina - for 9 EVs)
8. Susana Martinez favoured in 1 state (New Mexico - for 5 EVs)
Current update as of July 24.
Here are Hillary's current average leads in Florida:
Vs Bush: D +5.82% (up +0.1% from last average)
Vs Rubio: D +9.8%
Vs Paul Ryan: D +11.2%
Vs Rand Paul: D +11.6%
Vs Christie: D +12.1%
Vs Huckabee: D +12.5%
Vs Cruz: D +17.8%
In other words, Clinton's average lead of all 15 Florida polls range between a 6% and an 18% margin against the 7 GOP candidates having been tested there. Not much different from her 7% to 21% margins in the latest poll released today. Bush and Rubio have both been tested against her in 11 different polls.
The total number of state polls included in the lists below has thus now reached 143.
So here they are - all the 2016 poll averages for each state so far - 29 states having been polled to date - and how far off they are compared to the actual 2012 outcomes. I'm only including the Republican candidate with the best statewide polling.
Alaska: Hillary vs Jeb Bush: R +7%
+7% D improvement
(Updated on May 14, 2014)
Arizona: Hillary vs Bush: R +1%
+8% D improvement
(Updated on March 6, 2014)
Arkansas: Hillary vs Mike Huckabee: R +3%
+21% D improvement
(Updated on May 5, 2014)
Colorado: Hillary vs Paul Ryan: R +3.5%
+8.9% R improvement
Current Republican gain
(Updated on July 17, 2014)
Florida: Hillary vs Bush: D +5.8%
+4.9% D improvement
(Updated on July 24, 2014)
Georgia: Hillary vs Christie: R +2%
+6% D improvement
(Updated August 8, 2013)
Iowa: Hillary vs Christie: D +3.9%
+1.9% R improvement
(Updated on July 17, 2014)
Kansas: Hillary vs Bush: R +9%
+13% D improvement
(Updated on February 24, 2014)
Kentucky: Hillary vs Christie/Bush: R +4%
+19% D improvement
(Updated on May 18, 2014)
Louisiana: Hillary vs Huckabee: R +3%
+14% D improvement
(Updated on July 12, 2014)
Maine: Hillary vs Christie: D +8%
+7% R improvement
(Updated on November 13, 2013)
Michigan: Hillary vs Christie: D +6.1%
+3.4% R improvement
(Updated on June 3, 2014)
Minnesota: Hillary vs Tim Pawlenty: D +6%
+2% R improvement
(Updated on June 18, 2014)
Mississippi: Hillary vs Huckabee: R +7%
+4.5% D improvement
(Updated on July 20, 2014)
Montana: Hillary vs Rand Paul: R +13% (Brian Schweitzer vs Rand Paul: R +8%)
+1% D improvement
(Updated on July 23, 2014)
New Hampshire: Hillary vs Huckabee: D +2.1%
+3.5% R improvement
(Updated on July 17, 2014)
New Jersey: Hillary vs Christie: D +9.6%
+8.2% R improvement
(Updated on March 4, 2014; includes governor exit poll)
New Mexico: Hillary vs Susana Martinez: D +14%
+4% D improvement
(Updated on March 27, 2014)
New York: Hillary vs Christie: D +28%
+0.2% R improvement
(Updated on March 4, 2014)
North Carolina: Hillary vs Christie: D +1.25%
+3.3% D improvement
Current Democratic gain
(Updated on June 19, 2014)
Ohio: Hillary vs Christie: D +6.2%
+3.2% D improvement
(Updated on May 15, 2014)
Oregon: Hillary vs Rand Paul/Huckabee: D +12%
Unchanged from 2012
(Updated on May 30, 2014)
Pennsylvania: Hillary vs Christie: D +3.5%
+1.9% R improvement
(Updated on June 5, 2014)
South Carolina: Hillary vs Marco Rubio: R +7%
+3.5% D improvement
(Updated on November 2, 2013)
Texas: Hillary vs Huckabee: R +8%
+8% D improvement
(Updated on April 18, 2014)
Virginia: Hillary vs Christie: D +3.64%
+0.2% R improvement
(Updated on July 23, 2014)
West Virginia: Hillary vs Bush: R +14%
+13% D improvement
(Updated on October 1, 2013)
Wisconsin: Hillary vs Ryan: D +5.1%
+1.8% R improvement
(Updated on April 25, 2014)
Wyoming: Hillary vs Christie: R +28%
+13% D improvement
(Updated on July 23, 2013)
Average all 29 states: Hillary vs Best Republican: D +0.2%
+3.7% D improvement (from Obama 2012) [projecting a 7.6% victory for Hillary]
That gives us this map right now:
(
Red = Democratic lead or trend
Blue = Republican lead or trend
Green = Basically tied or hardly any trend, unchanged from 2012
Grey = No polling yet
Green = toss up or less than 0.5% lead
20% shade = 0.6-2% lead
30% shade = 2.1-4% lead
40% shade = 4.1-6% lead
50% shade = 6.1-9% lead
60% shade = 9.1-12% lead
70% shade = 12.1-15% lead
80% shade = 15.1-18% lead
90% shade = Above 18.1% lead
In the count of electoral votes, this means the current situation looks like this:
Hillary: 216 EVs (for a total of 15 states)
Best/Tailormade Republican: 120 EVs (for a total of 14 states)
Toss-up: None
No polling: 202 EVs (for a total of 21 states + D.C.)
Which means that Hillary has captured a rather impressive 64.3% of all EVs awarded thus far, against a disappointing 35.7% EVs for the tailormade Republican. Even as the biggest price by far, California, hasn't been added yet.
This is how the Trendline Map looks so far:
(
The states which right now are showing the strongest improvement for the Democratic (Hillary) or the Republican candidate (in 12 out of 29 cases, Christie is that person):
1. Arkansas: D +21%
2. Kentucky: D +19%
3. Louisiana: D +14%
4. Kansas: D +13%
5. West Virginia: D +13%
6. Wyoming: D +13%
7. Colorado: R +8.9%
8. New Jersey: R +8.2%
9. Arizona: D +8%
10. Texas: D +8%
11. Maine: R +7%
12. Alaska: D +7%
13. Georgia: D +6%
14. Florida: D +4.9%
15. Mississippi: D +4.5%
All of these changes (in the 15 states above) are (more than) statistically significant.
The whole list of states having been polled till now, going from Democratic stronghold to Republican stronghold:
New York: D +28%
New Mexico: D +14%
Oregon: D +12%
New Jersey: D +9.6%
Maine: D +8%
Currently estimated/projected national average: D +7.6%
Ohio: D +6.2%
Michigan: D +6.1%
Minnesota: D +6%
Florida: D +5.8%
Wisconsin: D +5.1%
Iowa: D +3.9%
Virginia: D +3.6%
Pennsylvania: D +3.5%
New Hampshire: D +2.1%
North Carolina: D +1.25%
Arizona: R +1%
Georgia: R +2%
Arkansas: R +3%
Louisiana: R +3%
Colorado: R +3.5%
Kentucky: R +4%
Alaska: R +7%
Mississippi: R +7%
South Carolina: R +7%
Texas: R +8%
Kansas: R +9%
Montana: R +13%
West Virginia: R +14%
Wyoming: R +28%
Here are the current stats on the best-tailored Republican candidates in all states polled so far:
1. Chris Christie favoured in 12 of 29 states (for 159 EVs)
2. Mike Huckabee in 6 states (Texas (!), Louisiana (!), Oregon (shared), Arkansas, Mississippi & New Hampshire (!) - for 69 EVs)
3. Jeb Bush favoured in 6 states (Florida, Arizona, Kentucky (!!) (shared), Kansas, West Virginia & Alaska - for 62 EVs)
4. Paul Ryan favoured in 2 states (Wisconsin & Colorado - for 19 EVs)
5. Rand Paul favoured in 2 states (Oregon (shared) & Montana - for 10 EVs)
6. Tim Pawlenty favoured in 1 state (Minnesota - for 10 EVs)
7. Marco Rubio favoured in 1 state (South Carolina - for 9 EVs)
8. Susana Martinez favoured in 1 state (New Mexico - for 5 EVs)
Current update as of July 24.
Title: Re: 2016 Official Polling Map Thread
Post by: pbrower2a on July 24, 2014, 05:18:12 PM
Florida voters back Clinton over Bush 49 - 42 percent in the 2016 White House race. The Democrat tops other Republicans by wider margins:
53 - 39 percent over Rubio;
53 - 37 percent over Paul;
54 - 33 percent over Christie;
51 - 38 percent over U.S. Rep. Paul Ryan of Wisconsin.
Independent voters back Clinton over Bush by a narrow 45 - 41 percent. Against other Republicans, her lead among independent voters is 16 to 20 percentage points.
http://www.quinnipiac.edu/news-and-events/quinnipiac-university-poll/florida/release-detail?ReleaseID=2063
This is beyond belief. This suggests a complete political collapse by the Republican Party in Florida, which suggests a complete collapse by the Republican Party nationwide. I can at best say that I suspend my acceptance of this poll. Recent polls show Hillary Clinton up 5% or so in Florida.
The 54-33 lead over Christie looks like a misprint; I might believe 54-43. I would need to see corroboration in other states. Recent polls in Florida show Hillary Clinton up by 5% or so over non-joke candidates (Cruz, Santorum, Rubio) in Florida. She's not above 50% in such states as Minnesota, Michigan, or Pennsylvania.
If she is up 10% and near 50% in states generally similar to Florida in voting patterns (Ohio is the only good analogue for Florida) I can accept this. No way is Florida one of the strongest-D states in America. If it were, then Governor Rick Scott would be crashing and burning.
Of course, now that the primary contests for the Republicans are settled in Georgia, we could be seeing some corroboration.
No change-- for now.
()
Hillary Clinton vs. Chris Christie
()
Hillary Clinton vs. Mike Huckabee
()
Hillary Clinton vs. Rand Paul
()
blue, Republican -- red, Democratic
30% -- lead with 40-49% but a margin of 3% or less
40% -- lead with 40-49% but a margin of 4% or more
60% -- lead with 50-54%
70% -- lead with 55-59%
90% -- lead with 60% or more
53 - 39 percent over Rubio;
53 - 37 percent over Paul;
54 - 33 percent over Christie;
51 - 38 percent over U.S. Rep. Paul Ryan of Wisconsin.
Independent voters back Clinton over Bush by a narrow 45 - 41 percent. Against other Republicans, her lead among independent voters is 16 to 20 percentage points.
http://www.quinnipiac.edu/news-and-events/quinnipiac-university-poll/florida/release-detail?ReleaseID=2063
This is beyond belief. This suggests a complete political collapse by the Republican Party in Florida, which suggests a complete collapse by the Republican Party nationwide. I can at best say that I suspend my acceptance of this poll. Recent polls show Hillary Clinton up 5% or so in Florida.
The 54-33 lead over Christie looks like a misprint; I might believe 54-43. I would need to see corroboration in other states. Recent polls in Florida show Hillary Clinton up by 5% or so over non-joke candidates (Cruz, Santorum, Rubio) in Florida. She's not above 50% in such states as Minnesota, Michigan, or Pennsylvania.
If she is up 10% and near 50% in states generally similar to Florida in voting patterns (Ohio is the only good analogue for Florida) I can accept this. No way is Florida one of the strongest-D states in America. If it were, then Governor Rick Scott would be crashing and burning.
Of course, now that the primary contests for the Republicans are settled in Georgia, we could be seeing some corroboration.
No change-- for now.
(
Hillary Clinton vs. Chris Christie
(
Hillary Clinton vs. Mike Huckabee
(
Hillary Clinton vs. Rand Paul
(
blue, Republican -- red, Democratic
30% -- lead with 40-49% but a margin of 3% or less
40% -- lead with 40-49% but a margin of 4% or more
60% -- lead with 50-54%
70% -- lead with 55-59%
90% -- lead with 60% or more
Title: Re: 2016 Official Polling Map Thread
Post by: IceSpear on July 24, 2014, 06:15:28 PM
Quinnipiac is a well regarded and longtime pollster that was closest to the actual result in Florida in 2012. I'm not sure why you'd ignore them just because you think it's an outlier.
Title: Re: 2016 Official Polling Map Thread
Post by: pbrower2a on July 24, 2014, 08:05:24 PM
Quinnipiac is a well regarded and longtime pollster that was closest to the actual result in Florida in 2012. I'm not sure why you'd ignore them just because you think it's an outlier.
It is a severe outlier by Q standards.
I know! Hillary Clinton seems highly likely to win the state, but perhaps by 5% over one of the stronger R candidates. A margin greater than 10% suggests that
(1) Florida has become about as strong a D state as Minnesota, Wisconsin, or Pennsylvania, which makes no sense in view of recent polls -- some available within the last couple of weeks. If Florida were that strongly D, then Governor Rick Scott would be staring into a landslide loss, which he is not doing even in a Q poll of the Governorship.
(2) Hillary Clinton has basically revived the Jimmy Carter coalition and grafted it onto the Obama coalition. For that to make sense I would need to see Clinton winning just about everything in the South. Carter won the state by 5% in 1976 (his fifteenth-best state); Obama won it by less than 3% in 2008. Florida has usually been a tough state for Democratic Presidential nominees to win; it was the second-weakest win for LBJ in 1964. Bill Clinton, the strongest Democratic nominee since LBJ in a Presidential election, barely lost it in 1992 and won it by 6% in 1996. We know about Florida in 2000.
Possible -- but not likely. It's not likely to contradict recent polls.
(3) Something has happened, all of a sudden, to mess up Republican chances for election or re-election nationwide. Has anyone seen anything to create such an effect? Such would show in approval ratings for President Obama, which remain awful. The Malaysian jetliner being shot down is just about neutral news for American politics.
(4) International concerns have begun to trump other concerns, and Hillary Clinton is in an excellent position to become more desirable. Q shows the favorability of Hillary Clinton very stable -- and so are the ratings of favorability for potential R rivals. There is nothing there. The downing of the Malaysian jetliner in dangerous airspace is just about neutral news for American politics.
Barack Obama's approval rating in Florida is in the range in which, were he running for re-election, he would barely win the state again.
Quinnipiac is usually one of my preferred pollsters, in view of its prior achievements, but this time the results seem terribly out of line. We can count on seeing frequent polls about Florida hereon. In fact, I expect to see lots of polls from neighboring Georgia from now until November because of hotly-contested Gubernatorial and Senate races. Show Hillary Clinton up 5% against just about everyone in Georgia, and I will accept this Q poll. Show another pollster concurring with these results and I will accept it.
Pollsters can have bad days -- or bad samples -- any day. That includes Quinnipiac, which rarely has them.
If you want my assessment of the 2016 Presidential election so far -- Hillary Clinton has gone from being marginally qualified to be President in 2008 to being one of the strongest candidates that we have known for a long time. Should she win Florida 55-45 she wins nationwide at least 58-42 with over 400 electoral votes -- 440 if she gets Texas, which would probably be the closest state in that scenario.
Title: Re: 2016 Official Polling Map Thread
Post by: eric82oslo on July 24, 2014, 08:38:02 PM
Here is the current ranking of the (29) states which so far have witnessed the most dramatic changes, measured in percentage of Obama's 2012 numbers (his 2012 numbers equal to 100%; a switch of party affiliation or an improvement for the 2012 state victor party equals to more than/exceeding 100%):
1. Colorado: Republican candidates [in plural, including Paul Ryan] improve by more than 100%, switch in partisan loyalty
2. North Carolina: Hillary improves (on Obama) by more than 100%, switch in partisan loyalty
3. Florida: Hillary improves by more than 100%, currently by 661%
4. Ohio: Hillary improves by more than 100%, currently by 208%
5. New Mexico: Hillary improves by more than 100%, currently by 138%
6. Arizona: Hillary improves by 89%
7. Arkansas: Hillary improves by 87% *
8. Louisiana: Hillary improves by 83%
9. Kentucky: Hillary improves by 82%
10. Georgia: Hillary improves by 74%
11. New Hampshire: Huckebee improves by 62%, though keep in mind that he has only been included in one single NH poll
12. Kansas: Hillary improves by 59%
13. Alaska: Hillary improves by 50%, cutting Republican lead/victory in half
14. Texas: Hillary improves by 49%
15. West Virginia: Hillary improves by 48%
16. Maine: Christie improves by 48%, though keep in mind that poll was conducted pre-Bridgegate
17. New Jersey: Christie improves by 46%
18. Mississippi: Hillary improves by 39%
19. Michigan: Christie improves by 36%
20. Pennsylvania: Christie improves by 35%
21. Iowa: Christie improves by 33%, cutting one third of Democratic lead/victory
22. South Carolina: Hillary improves by 33%, cutting one third of the Republican lead/victory
23. Wyoming: Hillary improves by 31%
24. Wisconsin: Paul Ryan improves by 27%
25. Minnesota: Tim Pawlenty improves by 22%
26. Virginia: Christie improves by 6%
27. Montana: Hillary improves by 5% [while Brian Schweitzer improves by a more impressive 41%!]
28. New York: Christie improves by 0.6%, basically unchanged
29. Oregon: Unchanged from 2012
* I just realised I've underestimated her swing in Arkansas, it should be 21% rather than 17%, as I've been comparing her with Obama 2008 instead of 2012. My apologies. Which makes it even more impressive to think about the fact that Hillary is actually leading all Republican opponents in Arkansas except their former governor Huckabee, while Obama lost the state by a 23.7% margin in 2012.
Using this metric, Florida now shows up with the third most impressive boost so far this season, only spearheaded by the amazing turn-arounds of Colorado and North Carolina. I personally think the top 9 of this ranking are all showing truely remarkable signs of imminent change. Georgia, on place number 10, is more conventional wisdom, and thus less of a "shock".
Four states are currently basically unchanged from 2012; Oregon, New York, Montana and Virginia.
Title: Re: 2016 Official Polling Map Thread
Post by: pbrower2a on July 26, 2014, 09:28:53 AM
Gravis Marketing, Kentucky:
This one matches both Hillary Clinton and Elizabeth Warren against Rand Paul in Kentucky.
Kentucky did vote for Bill Clinton. But this said, a marginal win of 6% for a Favorite Son in an R-leaning state would not bode well. The Favorite Son effect is worth about 10% in most Presidential elections (OK, Obama outdid Kerry in Massachusetts between 2004 and 2008) whether for winners or losers as Presidential nominees. That is the difference between Dole and Bush in Texas (1996 and 2000) and between Bush and McCain in Texas (2004 and 2008). I'm not saying that Jeb Bush, Chris Christie, or Mike Huckabee loses Kentucky.
This poll suggests more than anything else that Rand Paul would be an unusually-weak Republican nominee for President. He would win Kentucky, but he might lose Indiana.
Hillary Clinton vs. Jeb Bush
()
Hillary Clinton vs. Chris Christie
()
Hillary Clinton vs. Mike Huckabee
()
Hillary Clinton vs. Rand Paul
()
blue, Republican -- red, Democratic
30% -- lead with 40-49% but a margin of 3% or less
40% -- lead with 40-49% but a margin of 4% or more
60% -- lead with 50-54%
70% -- lead with 55-59%
90% -- lead with 60% or more
[/quote]
This one matches both Hillary Clinton and Elizabeth Warren against Rand Paul in Kentucky.
Quote
Voters were also polled regarding the 2016 Presidential race. Senator Rand Paul (R) led both Democratic candidates in his home state. He leads Senator Elizabeth Warren 52% to 34% in a hypothetical matchup while he only leading former US Secretary of State Hillary Clinton 50% to 44%.
Kentucky did vote for Bill Clinton. But this said, a marginal win of 6% for a Favorite Son in an R-leaning state would not bode well. The Favorite Son effect is worth about 10% in most Presidential elections (OK, Obama outdid Kerry in Massachusetts between 2004 and 2008) whether for winners or losers as Presidential nominees. That is the difference between Dole and Bush in Texas (1996 and 2000) and between Bush and McCain in Texas (2004 and 2008). I'm not saying that Jeb Bush, Chris Christie, or Mike Huckabee loses Kentucky.
This poll suggests more than anything else that Rand Paul would be an unusually-weak Republican nominee for President. He would win Kentucky, but he might lose Indiana.
Hillary Clinton vs. Jeb Bush
(
Hillary Clinton vs. Chris Christie
(
Hillary Clinton vs. Mike Huckabee
(
Hillary Clinton vs. Rand Paul
(
blue, Republican -- red, Democratic
30% -- lead with 40-49% but a margin of 3% or less
40% -- lead with 40-49% but a margin of 4% or more
60% -- lead with 50-54%
70% -- lead with 55-59%
90% -- lead with 60% or more
[/quote]
Title: Re: 2016 Official Polling Map Thread
Post by: eric82oslo on July 26, 2014, 02:04:08 PM
With Gravis Marketing's July poll of Kentucky (their first one in the state), we now already have five 2016 polls from this state. The averages of Hillary vs GOP candidates tested in the state now look like this:
Vs Jeb Bush: R +4%
Vs Christie: R +4%
Vs Rand Paul: R +2.2% (based on five polls)
Vs Ted Cruz: D +3%
Vs Rubio: D +7% (based on two polls)
This means that Rand is still (!) not leading the GOP crop in his home state - believe it or not. What's dragging his average down are two early polls from 2012 and 2013 though.
The total number of state polls included in the lists below has thus now reached 144.
So here they are - all the 2016 poll averages for each state so far - 29 states having been polled to date - and how far off they are compared to the actual 2012 outcomes. I'm only including the Republican candidate with the best statewide polling.
Alaska: Hillary vs Jeb Bush: R +7%
+7% D improvement
(Updated on May 14, 2014)
Arizona: Hillary vs Bush: R +1%
+8% D improvement
(Updated on March 6, 2014)
Arkansas: Hillary vs Mike Huckabee: R +3%
+21% D improvement
(Updated on May 5, 2014)
Colorado: Hillary vs Paul Ryan: R +3.5%
+8.9% R improvement
Current Republican gain
(Updated on July 17, 2014)
Florida: Hillary vs Bush: D +5.8%
+4.9% D improvement
(Updated on July 24, 2014)
Georgia: Hillary vs Christie: R +2%
+6% D improvement
(Updated August 8, 2013)
Iowa: Hillary vs Christie: D +3.9%
+1.9% R improvement
(Updated on July 17, 2014)
Kansas: Hillary vs Bush: R +9%
+13% D improvement
(Updated on February 24, 2014)
Kentucky: Hillary vs Christie/Bush: R +4%
+19% D improvement
(Updated on July 26, 2014)
Louisiana: Hillary vs Huckabee: R +3%
+14% D improvement
(Updated on July 12, 2014)
Maine: Hillary vs Christie: D +8%
+7% R improvement
(Updated on November 13, 2013)
Michigan: Hillary vs Christie: D +6.1%
+3.4% R improvement
(Updated on June 3, 2014)
Minnesota: Hillary vs Tim Pawlenty: D +6%
+2% R improvement
(Updated on June 18, 2014)
Mississippi: Hillary vs Huckabee: R +7%
+4.5% D improvement
(Updated on July 20, 2014)
Montana: Hillary vs Rand Paul: R +13% (Brian Schweitzer vs Rand Paul: R +8%)
+1% D improvement
(Updated on July 23, 2014)
New Hampshire: Hillary vs Huckabee: D +2.1%
+3.5% R improvement
(Updated on July 17, 2014)
New Jersey: Hillary vs Christie: D +9.6%
+8.2% R improvement
(Updated on March 4, 2014; includes governor exit poll)
New Mexico: Hillary vs Susana Martinez: D +14%
+4% D improvement
(Updated on March 27, 2014)
New York: Hillary vs Christie: D +28%
+0.2% R improvement
(Updated on March 4, 2014)
North Carolina: Hillary vs Christie: D +1.25%
+3.3% D improvement
Current Democratic gain
(Updated on June 19, 2014)
Ohio: Hillary vs Christie: D +6.2%
+3.2% D improvement
(Updated on May 15, 2014)
Oregon: Hillary vs Rand Paul/Huckabee: D +12%
Unchanged from 2012
(Updated on May 30, 2014)
Pennsylvania: Hillary vs Christie: D +3.5%
+1.9% R improvement
(Updated on June 5, 2014)
South Carolina: Hillary vs Marco Rubio: R +7%
+3.5% D improvement
(Updated on November 2, 2013)
Texas: Hillary vs Huckabee: R +8%
+8% D improvement
(Updated on April 18, 2014)
Virginia: Hillary vs Christie: D +3.64%
+0.2% R improvement
(Updated on July 23, 2014)
West Virginia: Hillary vs Bush: R +14%
+13% D improvement
(Updated on October 1, 2013)
Wisconsin: Hillary vs Ryan: D +5.1%
+1.8% R improvement
(Updated on April 25, 2014)
Wyoming: Hillary vs Christie: R +28%
+13% D improvement
(Updated on July 23, 2013)
Average all 29 states: Hillary vs Best Republican: D +0.2%
+3.7% D improvement (from Obama 2012) [projecting a 7.6% victory for Hillary]
That gives us this map right now:
()
Red = Democratic lead or trend
Blue = Republican lead or trend
Green = Basically tied or hardly any trend, unchanged from 2012
Grey = No polling yet
Green = toss up or less than 0.5% lead
20% shade = 0.6-2% lead
30% shade = 2.1-4% lead
40% shade = 4.1-6% lead
50% shade = 6.1-9% lead
60% shade = 9.1-12% lead
70% shade = 12.1-15% lead
80% shade = 15.1-18% lead
90% shade = Above 18.1% lead
In the count of electoral votes, this means the current situation looks like this:
Hillary: 216 EVs (for a total of 15 states)
Best/Tailormade Republican: 120 EVs (for a total of 14 states)
Toss-up: None
No polling: 202 EVs (for a total of 21 states + D.C.)
Which means that Hillary has captured a rather impressive 64.3% of all EVs awarded thus far, against a disappointing 35.7% EVs for the tailormade Republican. Even as the biggest price by far, California, hasn't been added yet.
This is how the Trendline Map looks so far:
()
The states which right now are showing the strongest improvement for the Democratic (Hillary) or the Republican candidate (in 12 out of 29 cases, Christie is that person):
1. Arkansas: D +21%
2. Kentucky: D +19%
3. Louisiana: D +14%
4. Kansas: D +13%
5. West Virginia: D +13%
6. Wyoming: D +13%
7. Colorado: R +8.9%
8. New Jersey: R +8.2%
9. Arizona: D +8%
10. Texas: D +8%
11. Maine: R +7%
12. Alaska: D +7%
13. Georgia: D +6%
14. Florida: D +4.9%
15. Mississippi: D +4.5%
All of these changes (in the 15 states above) are (more than) statistically significant.
The whole list of states having been polled till now, going from Democratic stronghold to Republican stronghold:
New York: D +28%
New Mexico: D +14%
Oregon: D +12%
New Jersey: D +9.6%
Maine: D +8%
Currently estimated/projected national average: D +7.6%
Ohio: D +6.2%
Michigan: D +6.1%
Minnesota: D +6%
Florida: D +5.8%
Wisconsin: D +5.1%
Iowa: D +3.9%
Virginia: D +3.6%
Pennsylvania: D +3.5%
New Hampshire: D +2.1%
North Carolina: D +1.25%
Arizona: R +1%
Georgia: R +2%
Arkansas: R +3%
Louisiana: R +3%
Colorado: R +3.5%
Kentucky: R +4%
Alaska: R +7%
Mississippi: R +7%
South Carolina: R +7%
Texas: R +8%
Kansas: R +9%
Montana: R +13%
West Virginia: R +14%
Wyoming: R +28%
Here are the current stats on the best-tailored Republican candidates in all states polled so far:
1. Chris Christie favoured in 12 of 29 states (for 159 EVs)
2. Mike Huckabee in 6 states (Texas (!), Louisiana (!), Oregon (shared), Arkansas, Mississippi & New Hampshire (!) - for 69 EVs)
3. Jeb Bush favoured in 6 states (Florida, Arizona, Kentucky (!!) (shared), Kansas, West Virginia & Alaska - for 62 EVs)
4. Paul Ryan favoured in 2 states (Wisconsin & Colorado - for 19 EVs)
5. Rand Paul favoured in 2 states (Oregon (shared) & Montana - for 10 EVs)
6. Tim Pawlenty favoured in 1 state (Minnesota - for 10 EVs)
7. Marco Rubio favoured in 1 state (South Carolina - for 9 EVs)
8. Susana Martinez favoured in 1 state (New Mexico - for 5 EVs)
Current update as of July 27.
Vs Jeb Bush: R +4%
Vs Christie: R +4%
Vs Rand Paul: R +2.2% (based on five polls)
Vs Ted Cruz: D +3%
Vs Rubio: D +7% (based on two polls)
This means that Rand is still (!) not leading the GOP crop in his home state - believe it or not. What's dragging his average down are two early polls from 2012 and 2013 though.
The total number of state polls included in the lists below has thus now reached 144.
So here they are - all the 2016 poll averages for each state so far - 29 states having been polled to date - and how far off they are compared to the actual 2012 outcomes. I'm only including the Republican candidate with the best statewide polling.
Alaska: Hillary vs Jeb Bush: R +7%
+7% D improvement
(Updated on May 14, 2014)
Arizona: Hillary vs Bush: R +1%
+8% D improvement
(Updated on March 6, 2014)
Arkansas: Hillary vs Mike Huckabee: R +3%
+21% D improvement
(Updated on May 5, 2014)
Colorado: Hillary vs Paul Ryan: R +3.5%
+8.9% R improvement
Current Republican gain
(Updated on July 17, 2014)
Florida: Hillary vs Bush: D +5.8%
+4.9% D improvement
(Updated on July 24, 2014)
Georgia: Hillary vs Christie: R +2%
+6% D improvement
(Updated August 8, 2013)
Iowa: Hillary vs Christie: D +3.9%
+1.9% R improvement
(Updated on July 17, 2014)
Kansas: Hillary vs Bush: R +9%
+13% D improvement
(Updated on February 24, 2014)
Kentucky: Hillary vs Christie/Bush: R +4%
+19% D improvement
(Updated on July 26, 2014)
Louisiana: Hillary vs Huckabee: R +3%
+14% D improvement
(Updated on July 12, 2014)
Maine: Hillary vs Christie: D +8%
+7% R improvement
(Updated on November 13, 2013)
Michigan: Hillary vs Christie: D +6.1%
+3.4% R improvement
(Updated on June 3, 2014)
Minnesota: Hillary vs Tim Pawlenty: D +6%
+2% R improvement
(Updated on June 18, 2014)
Mississippi: Hillary vs Huckabee: R +7%
+4.5% D improvement
(Updated on July 20, 2014)
Montana: Hillary vs Rand Paul: R +13% (Brian Schweitzer vs Rand Paul: R +8%)
+1% D improvement
(Updated on July 23, 2014)
New Hampshire: Hillary vs Huckabee: D +2.1%
+3.5% R improvement
(Updated on July 17, 2014)
New Jersey: Hillary vs Christie: D +9.6%
+8.2% R improvement
(Updated on March 4, 2014; includes governor exit poll)
New Mexico: Hillary vs Susana Martinez: D +14%
+4% D improvement
(Updated on March 27, 2014)
New York: Hillary vs Christie: D +28%
+0.2% R improvement
(Updated on March 4, 2014)
North Carolina: Hillary vs Christie: D +1.25%
+3.3% D improvement
Current Democratic gain
(Updated on June 19, 2014)
Ohio: Hillary vs Christie: D +6.2%
+3.2% D improvement
(Updated on May 15, 2014)
Oregon: Hillary vs Rand Paul/Huckabee: D +12%
Unchanged from 2012
(Updated on May 30, 2014)
Pennsylvania: Hillary vs Christie: D +3.5%
+1.9% R improvement
(Updated on June 5, 2014)
South Carolina: Hillary vs Marco Rubio: R +7%
+3.5% D improvement
(Updated on November 2, 2013)
Texas: Hillary vs Huckabee: R +8%
+8% D improvement
(Updated on April 18, 2014)
Virginia: Hillary vs Christie: D +3.64%
+0.2% R improvement
(Updated on July 23, 2014)
West Virginia: Hillary vs Bush: R +14%
+13% D improvement
(Updated on October 1, 2013)
Wisconsin: Hillary vs Ryan: D +5.1%
+1.8% R improvement
(Updated on April 25, 2014)
Wyoming: Hillary vs Christie: R +28%
+13% D improvement
(Updated on July 23, 2013)
Average all 29 states: Hillary vs Best Republican: D +0.2%
+3.7% D improvement (from Obama 2012) [projecting a 7.6% victory for Hillary]
That gives us this map right now:
(
Red = Democratic lead or trend
Blue = Republican lead or trend
Green = Basically tied or hardly any trend, unchanged from 2012
Grey = No polling yet
Green = toss up or less than 0.5% lead
20% shade = 0.6-2% lead
30% shade = 2.1-4% lead
40% shade = 4.1-6% lead
50% shade = 6.1-9% lead
60% shade = 9.1-12% lead
70% shade = 12.1-15% lead
80% shade = 15.1-18% lead
90% shade = Above 18.1% lead
In the count of electoral votes, this means the current situation looks like this:
Hillary: 216 EVs (for a total of 15 states)
Best/Tailormade Republican: 120 EVs (for a total of 14 states)
Toss-up: None
No polling: 202 EVs (for a total of 21 states + D.C.)
Which means that Hillary has captured a rather impressive 64.3% of all EVs awarded thus far, against a disappointing 35.7% EVs for the tailormade Republican. Even as the biggest price by far, California, hasn't been added yet.
This is how the Trendline Map looks so far:
(
The states which right now are showing the strongest improvement for the Democratic (Hillary) or the Republican candidate (in 12 out of 29 cases, Christie is that person):
1. Arkansas: D +21%
2. Kentucky: D +19%
3. Louisiana: D +14%
4. Kansas: D +13%
5. West Virginia: D +13%
6. Wyoming: D +13%
7. Colorado: R +8.9%
8. New Jersey: R +8.2%
9. Arizona: D +8%
10. Texas: D +8%
11. Maine: R +7%
12. Alaska: D +7%
13. Georgia: D +6%
14. Florida: D +4.9%
15. Mississippi: D +4.5%
All of these changes (in the 15 states above) are (more than) statistically significant.
The whole list of states having been polled till now, going from Democratic stronghold to Republican stronghold:
New York: D +28%
New Mexico: D +14%
Oregon: D +12%
New Jersey: D +9.6%
Maine: D +8%
Currently estimated/projected national average: D +7.6%
Ohio: D +6.2%
Michigan: D +6.1%
Minnesota: D +6%
Florida: D +5.8%
Wisconsin: D +5.1%
Iowa: D +3.9%
Virginia: D +3.6%
Pennsylvania: D +3.5%
New Hampshire: D +2.1%
North Carolina: D +1.25%
Arizona: R +1%
Georgia: R +2%
Arkansas: R +3%
Louisiana: R +3%
Colorado: R +3.5%
Kentucky: R +4%
Alaska: R +7%
Mississippi: R +7%
South Carolina: R +7%
Texas: R +8%
Kansas: R +9%
Montana: R +13%
West Virginia: R +14%
Wyoming: R +28%
Here are the current stats on the best-tailored Republican candidates in all states polled so far:
1. Chris Christie favoured in 12 of 29 states (for 159 EVs)
2. Mike Huckabee in 6 states (Texas (!), Louisiana (!), Oregon (shared), Arkansas, Mississippi & New Hampshire (!) - for 69 EVs)
3. Jeb Bush favoured in 6 states (Florida, Arizona, Kentucky (!!) (shared), Kansas, West Virginia & Alaska - for 62 EVs)
4. Paul Ryan favoured in 2 states (Wisconsin & Colorado - for 19 EVs)
5. Rand Paul favoured in 2 states (Oregon (shared) & Montana - for 10 EVs)
6. Tim Pawlenty favoured in 1 state (Minnesota - for 10 EVs)
7. Marco Rubio favoured in 1 state (South Carolina - for 9 EVs)
8. Susana Martinez favoured in 1 state (New Mexico - for 5 EVs)
Current update as of July 27.
Title: Re: 2016 Official Polling Map Thread
Post by: pbrower2a on July 29, 2014, 01:51:08 PM
PPP, Colorado
Leading 41/40 over Jeb Bush
Leading 45/39 over Chris Christie
Leading 44/43 over Ted Cruz
Leading 45/43 over Mike Huckabee
Trailing 44/45 to Rand Paul
http://www.publicpolicypolling.com/pdf/2014/COMiscResults.pdf
Hillary Clinton vs. Jeb Bush
(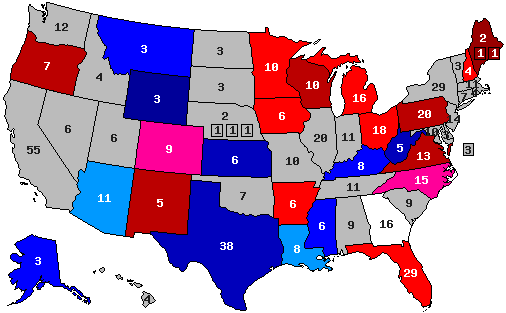 )
)
Hillary Clinton vs. Chris Christie
( )
)
Hillary Clinton vs. Mike Huckabee
()
Hillary Clinton vs. Rand Paul
()
blue, Republican -- red, Democratic
30% -- lead with 40-49% but a margin of 3% or less
40% -- lead with 40-49% but a margin of 4% or more
60% -- lead with 50-54%
70% -- lead with 55-59%
90% -- lead with 60% or more
Leading 41/40 over Jeb Bush
Leading 45/39 over Chris Christie
Leading 44/43 over Ted Cruz
Leading 45/43 over Mike Huckabee
Trailing 44/45 to Rand Paul
http://www.publicpolicypolling.com/pdf/2014/COMiscResults.pdf
Hillary Clinton vs. Jeb Bush
(
Hillary Clinton vs. Chris Christie
(
Hillary Clinton vs. Mike Huckabee
(
Hillary Clinton vs. Rand Paul
(
blue, Republican -- red, Democratic
30% -- lead with 40-49% but a margin of 3% or less
40% -- lead with 40-49% but a margin of 4% or more
60% -- lead with 50-54%
70% -- lead with 55-59%
90% -- lead with 60% or more
Title: Re: 2016 Official Polling Map Thread
Post by: eric82oslo on July 29, 2014, 03:58:43 PM
It's Colorado time - again! Unfortunately PPP decided not to poll Paul Ryan, the current leader in the state. This is the 10th 2016 poll in Colorado by either PPP or Quinnipiac. 7 GOPers have been tested in the state, and their averages against Hillary now look like this:
Vs Paul Ryan: R +3.5% (2 polls)
Vs Rand Paul: R +1.5% (8 polls)
Vs Chris Christie: R +0.3% (9 polls)
Vs Marco Rubio: D +1.5% (2 polls)
Vs Ted Cruz: D +2.8% (6 polls)
Vs Mike Huckabee: D +3.25% (4 polls)
Vs Jeb Bush: D +4.6% (5 polls)
Despite Christie's shellacking in this latest poll, he still manages to hold on to the tiniest lead on average in Colorado. However, Paul Ryan and Rand Paul seem right now to be far and away the strongest GOP candidates for the states. The bottom line is: The Mile High City and its surroundings seem still not to be Ready For Hillary. Notice that every single one of the 7 GOP candidates - even Ted Cruz! - would improve on Obama's Colorado margin over Romney in 2012.
PPP will be polling Alaska & Arkansas this weekend and hopefully they'll include 2016 match ups for both states as well.
The total number of state polls included in the lists below has thus now reached 145.
So here they are - all the 2016 poll averages for each state so far - 29 states having been polled to date - and how far off they are compared to the actual 2012 outcomes. I'm only including the Republican candidate with the best statewide polling.
Alaska: Hillary vs Jeb Bush: R +7%
+7% D improvement
(Updated on May 14, 2014)
Arizona: Hillary vs Bush: R +1%
+8% D improvement
(Updated on March 6, 2014)
Arkansas: Hillary vs Mike Huckabee: R +3%
+21% D improvement
(Updated on May 5, 2014)
Colorado: Hillary vs Paul Ryan: R +3.5%
+8.9% R improvement
Current Republican gain
(Updated on July 29, 2014)
Florida: Hillary vs Bush: D +5.8%
+4.9% D improvement
(Updated on July 24, 2014)
Georgia: Hillary vs Christie: R +2%
+6% D improvement
(Updated August 8, 2013)
Iowa: Hillary vs Christie: D +3.9%
+1.9% R improvement
(Updated on July 17, 2014)
Kansas: Hillary vs Bush: R +9%
+13% D improvement
(Updated on February 24, 2014)
Kentucky: Hillary vs Christie/Bush: R +4%
+19% D improvement
(Updated on July 26, 2014)
Louisiana: Hillary vs Huckabee: R +3%
+14% D improvement
(Updated on July 12, 2014)
Maine: Hillary vs Christie: D +8%
+7% R improvement
(Updated on November 13, 2013)
Michigan: Hillary vs Christie: D +6.1%
+3.4% R improvement
(Updated on June 3, 2014)
Minnesota: Hillary vs Tim Pawlenty: D +6%
+2% R improvement
(Updated on June 18, 2014)
Mississippi: Hillary vs Huckabee: R +7%
+4.5% D improvement
(Updated on July 20, 2014)
Montana: Hillary vs Rand Paul: R +13% (Brian Schweitzer vs Rand Paul: R +8%)
+1% D improvement
(Updated on July 23, 2014)
New Hampshire: Hillary vs Huckabee: D +2.1%
+3.5% R improvement
(Updated on July 17, 2014)
New Jersey: Hillary vs Christie: D +9.6%
+8.2% R improvement
(Updated on March 4, 2014; includes governor exit poll)
New Mexico: Hillary vs Susana Martinez: D +14%
+4% D improvement
(Updated on March 27, 2014)
New York: Hillary vs Christie: D +28%
+0.2% R improvement
(Updated on March 4, 2014)
North Carolina: Hillary vs Christie: D +1.25%
+3.3% D improvement
Current Democratic gain
(Updated on June 19, 2014)
Ohio: Hillary vs Christie: D +6.2%
+3.2% D improvement
(Updated on May 15, 2014)
Oregon: Hillary vs Rand Paul/Huckabee: D +12%
Unchanged from 2012
(Updated on May 30, 2014)
Pennsylvania: Hillary vs Christie: D +3.5%
+1.9% R improvement
(Updated on June 5, 2014)
South Carolina: Hillary vs Marco Rubio: R +7%
+3.5% D improvement
(Updated on November 2, 2013)
Texas: Hillary vs Huckabee: R +8%
+8% D improvement
(Updated on April 18, 2014)
Virginia: Hillary vs Christie: D +3.64%
+0.2% R improvement
(Updated on July 23, 2014)
West Virginia: Hillary vs Bush: R +14%
+13% D improvement
(Updated on October 1, 2013)
Wisconsin: Hillary vs Ryan: D +5.1%
+1.8% R improvement
(Updated on April 25, 2014)
Wyoming: Hillary vs Christie: R +28%
+13% D improvement
(Updated on July 23, 2013)
Average all 29 states: Hillary vs Best Republican: D +0.2%
+3.7% D improvement (from Obama 2012) [projecting a 7.6% victory for Hillary]
That gives us this map right now:
()
Red = Democratic lead or trend
Blue = Republican lead or trend
Green = Basically tied or hardly any trend, unchanged from 2012
Grey = No polling yet
Green = toss up or less than 0.5% lead
20% shade = 0.6-2% lead
30% shade = 2.1-4% lead
40% shade = 4.1-6% lead
50% shade = 6.1-9% lead
60% shade = 9.1-12% lead
70% shade = 12.1-15% lead
80% shade = 15.1-18% lead
90% shade = Above 18.1% lead
In the count of electoral votes, this means the current situation looks like this:
Hillary: 216 EVs (for a total of 15 states)
Best/Tailormade Republican: 120 EVs (for a total of 14 states)
Toss-up: None
No polling: 202 EVs (for a total of 21 states + D.C.)
Which means that Hillary has captured a rather impressive 64.3% of all EVs awarded thus far, against a disappointing 35.7% EVs for the tailormade Republican. Even as the biggest price by far, California, hasn't been added yet.
This is how the Trendline Map looks so far:
()
The states which right now are showing the strongest improvement for the Democratic (Hillary) or the Republican candidate (in 12 out of 29 cases, Christie is that person):
1. Arkansas: D +21%
2. Kentucky: D +19%
3. Louisiana: D +14%
4. Kansas: D +13%
5. West Virginia: D +13%
6. Wyoming: D +13%
7. Colorado: R +8.9%
8. New Jersey: R +8.2%
9. Arizona: D +8%
10. Texas: D +8%
11. Maine: R +7%
12. Alaska: D +7%
13. Georgia: D +6%
14. Florida: D +4.9%
15. Mississippi: D +4.5%
All of these changes (in the 15 states above) are (more than) statistically significant.
The whole list of states having been polled till now, going from Democratic stronghold to Republican stronghold:
New York: D +28%
New Mexico: D +14%
Oregon: D +12%
New Jersey: D +9.6%
Maine: D +8%
Currently estimated/projected national average: D +7.6%
Ohio: D +6.2%
Michigan: D +6.1%
Minnesota: D +6%
Florida: D +5.8%
Wisconsin: D +5.1%
Iowa: D +3.9%
Virginia: D +3.6%
Pennsylvania: D +3.5%
New Hampshire: D +2.1%
North Carolina: D +1.25%
Arizona: R +1%
Georgia: R +2%
Arkansas: R +3%
Louisiana: R +3%
Colorado: R +3.5%
Kentucky: R +4%
Alaska: R +7%
Mississippi: R +7%
South Carolina: R +7%
Texas: R +8%
Kansas: R +9%
Montana: R +13%
West Virginia: R +14%
Wyoming: R +28%
Here are the current stats on the best-tailored Republican candidates in all states polled so far:
1. Chris Christie favoured in 12 of 29 states (for 159 EVs)
2. Mike Huckabee in 6 states (Texas (!), Louisiana (!), Oregon (shared), Arkansas, Mississippi & New Hampshire (!) - for 69 EVs)
3. Jeb Bush favoured in 6 states (Florida, Arizona, Kentucky (!!) (shared), Kansas, West Virginia & Alaska - for 62 EVs)
4. Paul Ryan favoured in 2 states (Wisconsin & Colorado - for 19 EVs)
5. Rand Paul favoured in 2 states (Oregon (shared) & Montana - for 10 EVs)
6. Tim Pawlenty favoured in 1 state (Minnesota - for 10 EVs)
7. Marco Rubio favoured in 1 state (South Carolina - for 9 EVs)
8. Susana Martinez favoured in 1 state (New Mexico - for 5 EVs)
Current update as of July 29.
Vs Paul Ryan: R +3.5% (2 polls)
Vs Rand Paul: R +1.5% (8 polls)
Vs Chris Christie: R +0.3% (9 polls)
Vs Marco Rubio: D +1.5% (2 polls)
Vs Ted Cruz: D +2.8% (6 polls)
Vs Mike Huckabee: D +3.25% (4 polls)
Vs Jeb Bush: D +4.6% (5 polls)
Despite Christie's shellacking in this latest poll, he still manages to hold on to the tiniest lead on average in Colorado. However, Paul Ryan and Rand Paul seem right now to be far and away the strongest GOP candidates for the states. The bottom line is: The Mile High City and its surroundings seem still not to be Ready For Hillary. Notice that every single one of the 7 GOP candidates - even Ted Cruz! - would improve on Obama's Colorado margin over Romney in 2012.
PPP will be polling Alaska & Arkansas this weekend and hopefully they'll include 2016 match ups for both states as well.
The total number of state polls included in the lists below has thus now reached 145.
So here they are - all the 2016 poll averages for each state so far - 29 states having been polled to date - and how far off they are compared to the actual 2012 outcomes. I'm only including the Republican candidate with the best statewide polling.
Alaska: Hillary vs Jeb Bush: R +7%
+7% D improvement
(Updated on May 14, 2014)
Arizona: Hillary vs Bush: R +1%
+8% D improvement
(Updated on March 6, 2014)
Arkansas: Hillary vs Mike Huckabee: R +3%
+21% D improvement
(Updated on May 5, 2014)
Colorado: Hillary vs Paul Ryan: R +3.5%
+8.9% R improvement
Current Republican gain
(Updated on July 29, 2014)
Florida: Hillary vs Bush: D +5.8%
+4.9% D improvement
(Updated on July 24, 2014)
Georgia: Hillary vs Christie: R +2%
+6% D improvement
(Updated August 8, 2013)
Iowa: Hillary vs Christie: D +3.9%
+1.9% R improvement
(Updated on July 17, 2014)
Kansas: Hillary vs Bush: R +9%
+13% D improvement
(Updated on February 24, 2014)
Kentucky: Hillary vs Christie/Bush: R +4%
+19% D improvement
(Updated on July 26, 2014)
Louisiana: Hillary vs Huckabee: R +3%
+14% D improvement
(Updated on July 12, 2014)
Maine: Hillary vs Christie: D +8%
+7% R improvement
(Updated on November 13, 2013)
Michigan: Hillary vs Christie: D +6.1%
+3.4% R improvement
(Updated on June 3, 2014)
Minnesota: Hillary vs Tim Pawlenty: D +6%
+2% R improvement
(Updated on June 18, 2014)
Mississippi: Hillary vs Huckabee: R +7%
+4.5% D improvement
(Updated on July 20, 2014)
Montana: Hillary vs Rand Paul: R +13% (Brian Schweitzer vs Rand Paul: R +8%)
+1% D improvement
(Updated on July 23, 2014)
New Hampshire: Hillary vs Huckabee: D +2.1%
+3.5% R improvement
(Updated on July 17, 2014)
New Jersey: Hillary vs Christie: D +9.6%
+8.2% R improvement
(Updated on March 4, 2014; includes governor exit poll)
New Mexico: Hillary vs Susana Martinez: D +14%
+4% D improvement
(Updated on March 27, 2014)
New York: Hillary vs Christie: D +28%
+0.2% R improvement
(Updated on March 4, 2014)
North Carolina: Hillary vs Christie: D +1.25%
+3.3% D improvement
Current Democratic gain
(Updated on June 19, 2014)
Ohio: Hillary vs Christie: D +6.2%
+3.2% D improvement
(Updated on May 15, 2014)
Oregon: Hillary vs Rand Paul/Huckabee: D +12%
Unchanged from 2012
(Updated on May 30, 2014)
Pennsylvania: Hillary vs Christie: D +3.5%
+1.9% R improvement
(Updated on June 5, 2014)
South Carolina: Hillary vs Marco Rubio: R +7%
+3.5% D improvement
(Updated on November 2, 2013)
Texas: Hillary vs Huckabee: R +8%
+8% D improvement
(Updated on April 18, 2014)
Virginia: Hillary vs Christie: D +3.64%
+0.2% R improvement
(Updated on July 23, 2014)
West Virginia: Hillary vs Bush: R +14%
+13% D improvement
(Updated on October 1, 2013)
Wisconsin: Hillary vs Ryan: D +5.1%
+1.8% R improvement
(Updated on April 25, 2014)
Wyoming: Hillary vs Christie: R +28%
+13% D improvement
(Updated on July 23, 2013)
Average all 29 states: Hillary vs Best Republican: D +0.2%
+3.7% D improvement (from Obama 2012) [projecting a 7.6% victory for Hillary]
That gives us this map right now:
(
Red = Democratic lead or trend
Blue = Republican lead or trend
Green = Basically tied or hardly any trend, unchanged from 2012
Grey = No polling yet
Green = toss up or less than 0.5% lead
20% shade = 0.6-2% lead
30% shade = 2.1-4% lead
40% shade = 4.1-6% lead
50% shade = 6.1-9% lead
60% shade = 9.1-12% lead
70% shade = 12.1-15% lead
80% shade = 15.1-18% lead
90% shade = Above 18.1% lead
In the count of electoral votes, this means the current situation looks like this:
Hillary: 216 EVs (for a total of 15 states)
Best/Tailormade Republican: 120 EVs (for a total of 14 states)
Toss-up: None
No polling: 202 EVs (for a total of 21 states + D.C.)
Which means that Hillary has captured a rather impressive 64.3% of all EVs awarded thus far, against a disappointing 35.7% EVs for the tailormade Republican. Even as the biggest price by far, California, hasn't been added yet.
This is how the Trendline Map looks so far:
(
The states which right now are showing the strongest improvement for the Democratic (Hillary) or the Republican candidate (in 12 out of 29 cases, Christie is that person):
1. Arkansas: D +21%
2. Kentucky: D +19%
3. Louisiana: D +14%
4. Kansas: D +13%
5. West Virginia: D +13%
6. Wyoming: D +13%
7. Colorado: R +8.9%
8. New Jersey: R +8.2%
9. Arizona: D +8%
10. Texas: D +8%
11. Maine: R +7%
12. Alaska: D +7%
13. Georgia: D +6%
14. Florida: D +4.9%
15. Mississippi: D +4.5%
All of these changes (in the 15 states above) are (more than) statistically significant.
The whole list of states having been polled till now, going from Democratic stronghold to Republican stronghold:
New York: D +28%
New Mexico: D +14%
Oregon: D +12%
New Jersey: D +9.6%
Maine: D +8%
Currently estimated/projected national average: D +7.6%
Ohio: D +6.2%
Michigan: D +6.1%
Minnesota: D +6%
Florida: D +5.8%
Wisconsin: D +5.1%
Iowa: D +3.9%
Virginia: D +3.6%
Pennsylvania: D +3.5%
New Hampshire: D +2.1%
North Carolina: D +1.25%
Arizona: R +1%
Georgia: R +2%
Arkansas: R +3%
Louisiana: R +3%
Colorado: R +3.5%
Kentucky: R +4%
Alaska: R +7%
Mississippi: R +7%
South Carolina: R +7%
Texas: R +8%
Kansas: R +9%
Montana: R +13%
West Virginia: R +14%
Wyoming: R +28%
Here are the current stats on the best-tailored Republican candidates in all states polled so far:
1. Chris Christie favoured in 12 of 29 states (for 159 EVs)
2. Mike Huckabee in 6 states (Texas (!), Louisiana (!), Oregon (shared), Arkansas, Mississippi & New Hampshire (!) - for 69 EVs)
3. Jeb Bush favoured in 6 states (Florida, Arizona, Kentucky (!!) (shared), Kansas, West Virginia & Alaska - for 62 EVs)
4. Paul Ryan favoured in 2 states (Wisconsin & Colorado - for 19 EVs)
5. Rand Paul favoured in 2 states (Oregon (shared) & Montana - for 10 EVs)
6. Tim Pawlenty favoured in 1 state (Minnesota - for 10 EVs)
7. Marco Rubio favoured in 1 state (South Carolina - for 9 EVs)
8. Susana Martinez favoured in 1 state (New Mexico - for 5 EVs)
Current update as of July 29.
Title: Re: 2016 Official Polling Map Thread
Post by: pbrower2a on July 31, 2014, 06:22:50 AM
Quinnipiac, Ohio'
http://www.quinnipiac.edu/news-and-events/quinnipiac-university-poll/ohio/release-detail?ReleaseID=2066
Not at all suspect. Q is a good pollster. The Florida poll by Q still looks anomalous, and the Ohio poll does nothing to convince me that Florida will offer an easy victory for Hillary Clinton. I am more likely to believe that the Ohio poll is right for both Florida and Ohio.
The Democratic nominee has not won Florida by a double-digit margin or even a high-single-digit margin since 1948, when Florida really was a Southern state.
Hillary Clinton vs. Jeb Bush
()
Hillary Clinton vs. Chris Christie
()
Hillary Clinton vs. Mike Huckabee
()
Hillary Clinton vs. Rand Paul
()
blue, Republican -- red, Democratic
30% -- lead with 40-49% but a margin of 3% or less
40% -- lead with 40-49% but a margin of 4% or more
60% -- lead with 50-54%
70% -- lead with 55-59%
90% -- lead with 60% or more
Quote
Looking at the 2016 White House race, Ohio voters back Clinton over their Favorite Son, Gov. John Kasich, 47 - 40 percent. She tops other possible Republican contenders:
46 - 42 percent over U.S. Sen. Rand Paul of Kentucky;
48 - 37 percent over former Florida Gov. Jeb Bush;
46 - 37 percent over New Jersey Gov. Christopher Christie.
46 - 42 percent over U.S. Sen. Rand Paul of Kentucky;
48 - 37 percent over former Florida Gov. Jeb Bush;
46 - 37 percent over New Jersey Gov. Christopher Christie.
http://www.quinnipiac.edu/news-and-events/quinnipiac-university-poll/ohio/release-detail?ReleaseID=2066
Not at all suspect. Q is a good pollster. The Florida poll by Q still looks anomalous, and the Ohio poll does nothing to convince me that Florida will offer an easy victory for Hillary Clinton. I am more likely to believe that the Ohio poll is right for both Florida and Ohio.
The Democratic nominee has not won Florida by a double-digit margin or even a high-single-digit margin since 1948, when Florida really was a Southern state.
Hillary Clinton vs. Jeb Bush
(
Hillary Clinton vs. Chris Christie
(
Hillary Clinton vs. Mike Huckabee
(
Hillary Clinton vs. Rand Paul
(
blue, Republican -- red, Democratic
30% -- lead with 40-49% but a margin of 3% or less
40% -- lead with 40-49% but a margin of 4% or more
60% -- lead with 50-54%
70% -- lead with 55-59%
90% -- lead with 60% or more
Title: Re: 2016 Official Polling Map Thread
Post by: pbrower2a on July 31, 2014, 12:25:06 PM
Harper (R), Nevada:
Clinton (D) 47%
Paul (R) 44%
Clinton (D) 46%
Bush (R) 41%
Clinton (D) 48%
Martinez (R) 35%
http://www.ralstonreports.com/blog/poll-sandoval-would-defeat-reid-double-digits#.U9ptJ_l_vUU
http://cdn.ralstonreports.com/sites/default/files/HP%2014.07%20NV%20Memo.pdf
Limited results from an R pollster, but it is all that we have in Nevada so far. It corroborates the poor performance of Hillary Clinton in Colorado at least according to early polling. Harper must not take either Christie or Huckabee seriously.
Hillary Clinton vs. Jeb Bush
(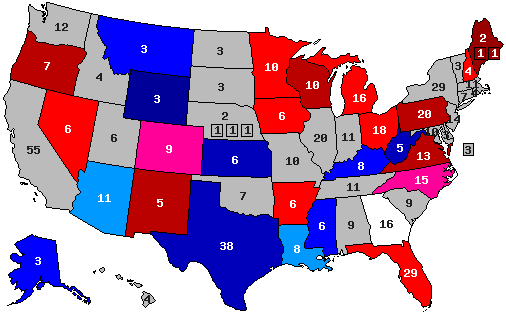 )
)
Hillary Clinton vs. Chris Christie
()
Hillary Clinton vs. Mike Huckabee
()
Hillary Clinton vs. Rand Paul
(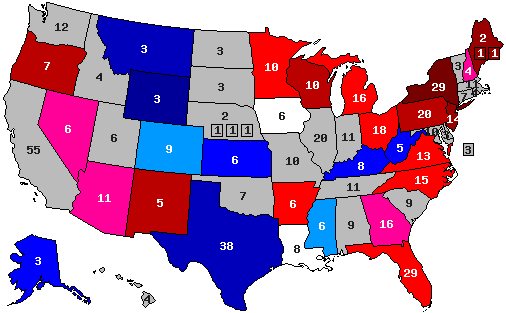 )
)
blue, Republican -- red, Democratic
30% -- lead with 40-49% but a margin of 3% or less
40% -- lead with 40-49% but a margin of 4% or more
60% -- lead with 50-54%
70% -- lead with 55-59%
90% -- lead with 60% or more
Clinton (D) 47%
Paul (R) 44%
Clinton (D) 46%
Bush (R) 41%
Clinton (D) 48%
Martinez (R) 35%
http://www.ralstonreports.com/blog/poll-sandoval-would-defeat-reid-double-digits#.U9ptJ_l_vUU
http://cdn.ralstonreports.com/sites/default/files/HP%2014.07%20NV%20Memo.pdf
Limited results from an R pollster, but it is all that we have in Nevada so far. It corroborates the poor performance of Hillary Clinton in Colorado at least according to early polling. Harper must not take either Christie or Huckabee seriously.
Hillary Clinton vs. Jeb Bush
(
Hillary Clinton vs. Chris Christie
(
Hillary Clinton vs. Mike Huckabee
(
Hillary Clinton vs. Rand Paul
(
blue, Republican -- red, Democratic
30% -- lead with 40-49% but a margin of 3% or less
40% -- lead with 40-49% but a margin of 4% or more
60% -- lead with 50-54%
70% -- lead with 55-59%
90% -- lead with 60% or more
Title: Re: 2016 Official Polling Map Thread
Post by: pbrower2a on July 31, 2014, 01:23:59 PM
Here's my projection of the 2016 election based upon what I see in Hillary Clinton against the main four potential nominees in current polls. I pay no attention to Ted Cruz, Mario Rubio, or Scott Walker, as they lose by ludicrous margins in all but sure-R states. Nevada is 'new' to polling, and it shows a surprise even if the poll is by an R pollster. Under the circumstances, beggars can't be choosers.
(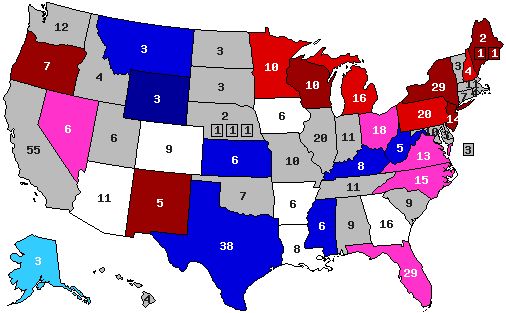 )
)
Legitimate swing states:
white -- mixed results or any tie
pink -- D lead in all 4 current polls, but swing states in 2008 and 2012
pale blue -- R lead in all current polls, all but one of them under 4%
Fringe swing states:
medium red -- D lead by at least 4% (but under 50%) in all but at most one poll but not swing states in 2008 or 2012
medium blue -- R lead by at least 4% (but under 50%) in all but at most one poll but not swing states in 2008 or 2012
Non-swing states
dark red -- D lead with at least 50% in at least two polls
dark blue -- R lead with at least 50% in at least two polls
Gray -- no polling
Now, based on how states did in 2008 and 2012 and how analogous states do, I fill in the rest:
(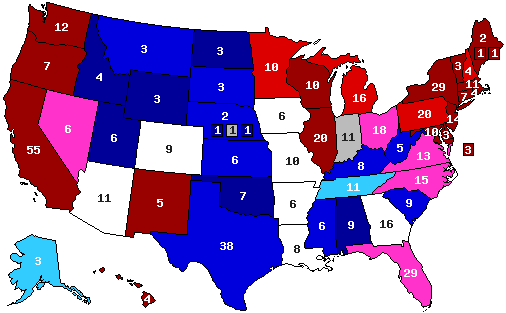 )
)
Legitimate swing states:
white -- mixed results or any tie 66
pink -- D lead in all 4 current polls, but swing states in 2008 and 2012, or a split 81
pale blue -- R lead in all current polls, all but one of them under 4% 14
Fringe swing states:
medium red -- D lead by at least 4% (but under 50%) in all but at most one poll but not swing states in 2008 or 2012 50
medium blue -- R lead by at least 4% (but under 50%) in all but at most one poll but not swing states in 2008 or 2012 76
Non-swing states
dark red -- D lead with at least 50% in at least two polls 199
dark blue -- R lead with at least 50% in at least two polls 32
Gray -- I have no idea (no suitable analogues) 12
The controversial ones are Missouri (Georgia now looks like a good analogue for Missouri with KC + STL = ATL; it's about half Iowa and half Arkansas, which both register as ties), Tennessee (which I am placing politically about halfway between Georgia and Mississippi or Georgia and Kentucky). Until I see commanding evidence to the contrary I practically define Florida, North Carolina, Ohio, and Virginia as swing states. I'm giving ND as more solidly R than SD because of the boom in natural gas in North Dakota. Indiana? NE-02? Go figure.
I see America much less polarized now than it was in 2008 or 2012.
(
Legitimate swing states:
white -- mixed results or any tie
pink -- D lead in all 4 current polls, but swing states in 2008 and 2012
pale blue -- R lead in all current polls, all but one of them under 4%
Fringe swing states:
medium red -- D lead by at least 4% (but under 50%) in all but at most one poll but not swing states in 2008 or 2012
medium blue -- R lead by at least 4% (but under 50%) in all but at most one poll but not swing states in 2008 or 2012
Non-swing states
dark red -- D lead with at least 50% in at least two polls
dark blue -- R lead with at least 50% in at least two polls
Gray -- no polling
Now, based on how states did in 2008 and 2012 and how analogous states do, I fill in the rest:
(
Legitimate swing states:
white -- mixed results or any tie 66
pink -- D lead in all 4 current polls, but swing states in 2008 and 2012, or a split 81
pale blue -- R lead in all current polls, all but one of them under 4% 14
Fringe swing states:
medium red -- D lead by at least 4% (but under 50%) in all but at most one poll but not swing states in 2008 or 2012 50
medium blue -- R lead by at least 4% (but under 50%) in all but at most one poll but not swing states in 2008 or 2012 76
Non-swing states
dark red -- D lead with at least 50% in at least two polls 199
dark blue -- R lead with at least 50% in at least two polls 32
Gray -- I have no idea (no suitable analogues) 12
The controversial ones are Missouri (Georgia now looks like a good analogue for Missouri with KC + STL = ATL; it's about half Iowa and half Arkansas, which both register as ties), Tennessee (which I am placing politically about halfway between Georgia and Mississippi or Georgia and Kentucky). Until I see commanding evidence to the contrary I practically define Florida, North Carolina, Ohio, and Virginia as swing states. I'm giving ND as more solidly R than SD because of the boom in natural gas in North Dakota. Indiana? NE-02? Go figure.
I see America much less polarized now than it was in 2008 or 2012.
Title: Re: 2016 Official Polling Map Thread
Post by: Senator Cris on July 31, 2014, 01:34:54 PM
Great work!
Title: Re: 2016 Official Polling Map Thread
Post by: eric82oslo on July 31, 2014, 02:55:53 PM
Christmas has come early! At least in the sense that we've finally got our first Nevada poll, from Harper, which shows Hillary leading Rand Paul by only 3% (she leads Bush by 5% & Martinez by 13%). This means a Republican swing so far for Nevada.
In North Carolina we got our 10th 2016 poll today. Only Rand Paul was tested, and he was only trailing Hillary by 2%. These are the current averages for N.C.:
Vs Christie: D +1.25%
Vs Rand Paul: D +4.8%
Finally we have Ohio & the 7th 2016 poll from that state. Rand Paul did very well, as did John Kasich, while Christie and Bush both did abysmal. Here are the current averages for Ohio:
Vs Christie: D +6.7%
Vs Rand Paul: D +8.8%
Vs John Kasich: D +10.6%
Vs Jeb Bush: D +12.4%
With this, Hillary improves her lead against Christie with another 0.5% in Ohio.
Nevada added to the mix gives Republicans some long-saught momentum. Hillary's predicted win across all 50 states is thus reduced from 7.6% to 7.4%, while her Electoral Vote count increases by 6.
The total number of state polls included in the lists below has thus now reached 148.
So here they are - all the 2016 poll averages for each state - 30 states having been polled to date - and how far off they are compared to the actual 2012 outcomes. I'm only including the Republican candidate with the best statewide polling.
Alaska: Hillary vs Jeb Bush: R +7%
+7% D improvement
(Updated on May 14, 2014)
Arizona: Hillary vs Bush: R +1%
+8% D improvement
(Updated on March 6, 2014)
Arkansas: Hillary vs Mike Huckabee: R +3%
+21% D improvement
(Updated on May 5, 2014)
Colorado: Hillary vs Paul Ryan: R +3.5%
+8.9% R improvement
Current Republican gain
(Updated on July 29, 2014)
Florida: Hillary vs Bush: D +5.8%
+4.9% D improvement
(Updated on July 24, 2014)
Georgia: Hillary vs Christie: R +2%
+6% D improvement
(Updated August 8, 2013)
Iowa: Hillary vs Christie: D +3.9%
+1.9% R improvement
(Updated on July 17, 2014)
Kansas: Hillary vs Bush: R +9%
+13% D improvement
(Updated on February 24, 2014)
Kentucky: Hillary vs Christie/Bush: R +4%
+19% D improvement
(Updated on July 26, 2014)
Louisiana: Hillary vs Huckabee: R +3%
+14% D improvement
(Updated on July 12, 2014)
Maine: Hillary vs Christie: D +8%
+7% R improvement
(Updated on November 13, 2013)
Michigan: Hillary vs Christie: D +6.1%
+3.4% R improvement
(Updated on June 3, 2014)
Minnesota: Hillary vs Tim Pawlenty: D +6%
+2% R improvement
(Updated on June 18, 2014)
Mississippi: Hillary vs Huckabee: R +7%
+4.5% D improvement
(Updated on July 20, 2014)
Montana: Hillary vs Rand Paul: R +13% (Brian Schweitzer vs Rand Paul: R +8%)
+1% D improvement
(Updated on July 23, 2014)
NEW! Nevada: Hillary vs Rand Paul: D +3%
+4% R improvement
(Updated on July 31, 2014)
New Hampshire: Hillary vs Huckabee: D +2.1%
+3.5% R improvement
(Updated on July 17, 2014)
New Jersey: Hillary vs Christie: D +9.6%
+8.2% R improvement
(Updated on March 4, 2014; includes governor exit poll)
New Mexico: Hillary vs Susana Martinez: D +14%
+4% D improvement
(Updated on March 27, 2014)
New York: Hillary vs Christie: D +28%
+0.2% R improvement
(Updated on March 4, 2014)
North Carolina: Hillary vs Christie: D +1.25%
+3.3% D improvement
Current Democratic gain
(Updated on July 31, 2014)
Ohio: Hillary vs Christie: D +6.7%
+3.7% D improvement
(Updated on July 31, 2014)
Oregon: Hillary vs Rand Paul/Huckabee: D +12%
Unchanged from 2012
(Updated on May 30, 2014)
Pennsylvania: Hillary vs Christie: D +3.5%
+1.9% R improvement
(Updated on June 5, 2014)
South Carolina: Hillary vs Marco Rubio: R +7%
+3.5% D improvement
(Updated on November 2, 2013)
Texas: Hillary vs Huckabee: R +8%
+8% D improvement
(Updated on April 18, 2014)
Virginia: Hillary vs Christie: D +3.64%
+0.2% R improvement
(Updated on July 23, 2014)
West Virginia: Hillary vs Bush: R +14%
+13% D improvement
(Updated on October 1, 2013)
Wisconsin: Hillary vs Ryan: D +5.1%
+1.8% R improvement
(Updated on April 25, 2014)
Wyoming: Hillary vs Christie: R +28%
+13% D improvement
(Updated on July 23, 2013)
Average all 30 states: Hillary vs Best Republican: D +0.3%
+3.5% D improvement (from Obama 2012) [projecting a 7.4% victory for Hillary]
That gives us this map right now:
(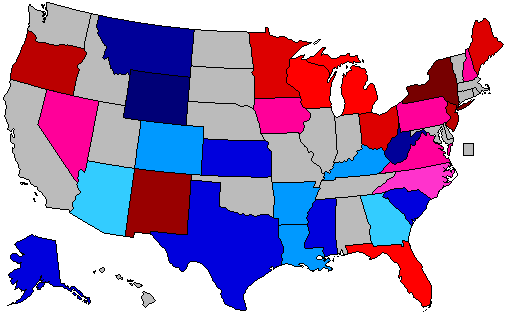 )
)
Red = Democratic lead or trend
Blue = Republican lead or trend
Green = Basically tied or hardly any trend, unchanged from 2012
Grey = No polling yet
Green = toss up or less than 0.5% lead
20% shade = 0.6-2% lead
30% shade = 2.1-4% lead
40% shade = 4.1-6% lead
50% shade = 6.1-9% lead
60% shade = 9.1-12% lead
70% shade = 12.1-15% lead
80% shade = 15.1-18% lead
90% shade = Above 18.1% lead
In the count of electoral votes, this means the current situation looks like this:
Hillary: 222 EVs (for a total of 16 states)
Best/Tailormade Republican: 120 EVs (for a total of 14 states)
Toss-up: None
No polling: 196 EVs (for a total of 20 states + D.C.)
So far, Hillary has captured an impressive 64.9% of all EVs awarded, against a disappointing 35.1% EVs for the tailormade Republican. Now imagine California being added.
This is how the Trendline Map looks so far:
(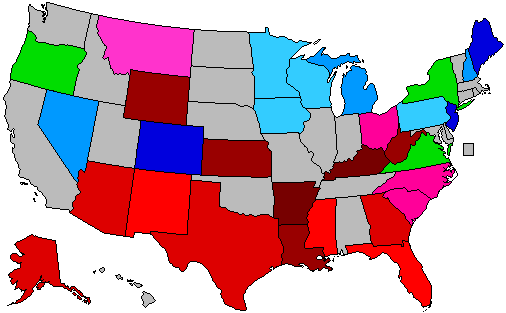 )
)
The states which right now are showing the strongest improvement for the Democratic (Hillary) or the Republican candidate (in 12 out of 30 cases, Christie is that person):
1. Arkansas: D +21%
2. Kentucky: D +19%
3. Louisiana: D +14%
4. Kansas: D +13%
5. West Virginia: D +13%
6. Wyoming: D +13%
7. Colorado: R +8.9%
8. New Jersey: R +8.2%
9. Arizona: D +8%
10. Texas: D +8%
11. Maine: R +7%
12. Alaska: D +7%
13. Georgia: D +6%
14. Florida: D +4.9%
15. Mississippi: D +4.5%
All of these changes (in the 15 states above) are (more than) statistically significant.
The whole list of states having been polled till now, going from Democratic stronghold to Republican stronghold:
New York: D +28%
New Mexico: D +14%
Oregon: D +12%
New Jersey: D +9.6%
Maine: D +8%
Currently estimated/projected national average: D +7.4%
Ohio: D +6.7%
Michigan: D +6.1%
Minnesota: D +6%
Florida: D +5.8%
Wisconsin: D +5.1%
Iowa: D +3.9%
Virginia: D +3.6%
Pennsylvania: D +3.5%
Nevada: D +3%
New Hampshire: D +2.1%
North Carolina: D +1.25%
Arizona: R +1%
Georgia: R +2%
Arkansas: R +3%
Louisiana: R +3%
Colorado: R +3.5%
Kentucky: R +4%
Alaska: R +7%
Mississippi: R +7%
South Carolina: R +7%
Texas: R +8%
Kansas: R +9%
Montana: R +13%
West Virginia: R +14%
Wyoming: R +28%
Here are the current stats on the best-tailored Republican candidates in all states polled so far:
1. Chris Christie favoured in 12 of 30 states (for 159 EVs)
2. Mike Huckabee in 6 states (Texas (!), Louisiana (!), Oregon (shared), Arkansas, Mississippi & New Hampshire (!) - for 69 EVs)
3. Jeb Bush favoured in 6 states (Florida, Arizona, Kentucky (!!) (shared), Kansas, West Virginia & Alaska - for 62 EVs)
4. Paul Ryan favoured in 2 states (Wisconsin & Colorado - for 19 EVs)
5. Rand Paul favoured in 3 states (Oregon (shared), Nevada & Montana - for 16 EVs)
6. Tim Pawlenty favoured in 1 state (Minnesota - for 10 EVs)
7. Marco Rubio favoured in 1 state (South Carolina - for 9 EVs)
8. Susana Martinez favoured in 1 state (New Mexico - for 5 EVs)
Current update as of July 31.
In North Carolina we got our 10th 2016 poll today. Only Rand Paul was tested, and he was only trailing Hillary by 2%. These are the current averages for N.C.:
Vs Christie: D +1.25%
Vs Rand Paul: D +4.8%
Finally we have Ohio & the 7th 2016 poll from that state. Rand Paul did very well, as did John Kasich, while Christie and Bush both did abysmal. Here are the current averages for Ohio:
Vs Christie: D +6.7%
Vs Rand Paul: D +8.8%
Vs John Kasich: D +10.6%
Vs Jeb Bush: D +12.4%
With this, Hillary improves her lead against Christie with another 0.5% in Ohio.
Nevada added to the mix gives Republicans some long-saught momentum. Hillary's predicted win across all 50 states is thus reduced from 7.6% to 7.4%, while her Electoral Vote count increases by 6.
The total number of state polls included in the lists below has thus now reached 148.
So here they are - all the 2016 poll averages for each state - 30 states having been polled to date - and how far off they are compared to the actual 2012 outcomes. I'm only including the Republican candidate with the best statewide polling.
Alaska: Hillary vs Jeb Bush: R +7%
+7% D improvement
(Updated on May 14, 2014)
Arizona: Hillary vs Bush: R +1%
+8% D improvement
(Updated on March 6, 2014)
Arkansas: Hillary vs Mike Huckabee: R +3%
+21% D improvement
(Updated on May 5, 2014)
Colorado: Hillary vs Paul Ryan: R +3.5%
+8.9% R improvement
Current Republican gain
(Updated on July 29, 2014)
Florida: Hillary vs Bush: D +5.8%
+4.9% D improvement
(Updated on July 24, 2014)
Georgia: Hillary vs Christie: R +2%
+6% D improvement
(Updated August 8, 2013)
Iowa: Hillary vs Christie: D +3.9%
+1.9% R improvement
(Updated on July 17, 2014)
Kansas: Hillary vs Bush: R +9%
+13% D improvement
(Updated on February 24, 2014)
Kentucky: Hillary vs Christie/Bush: R +4%
+19% D improvement
(Updated on July 26, 2014)
Louisiana: Hillary vs Huckabee: R +3%
+14% D improvement
(Updated on July 12, 2014)
Maine: Hillary vs Christie: D +8%
+7% R improvement
(Updated on November 13, 2013)
Michigan: Hillary vs Christie: D +6.1%
+3.4% R improvement
(Updated on June 3, 2014)
Minnesota: Hillary vs Tim Pawlenty: D +6%
+2% R improvement
(Updated on June 18, 2014)
Mississippi: Hillary vs Huckabee: R +7%
+4.5% D improvement
(Updated on July 20, 2014)
Montana: Hillary vs Rand Paul: R +13% (Brian Schweitzer vs Rand Paul: R +8%)
+1% D improvement
(Updated on July 23, 2014)
NEW! Nevada: Hillary vs Rand Paul: D +3%
+4% R improvement
(Updated on July 31, 2014)
New Hampshire: Hillary vs Huckabee: D +2.1%
+3.5% R improvement
(Updated on July 17, 2014)
New Jersey: Hillary vs Christie: D +9.6%
+8.2% R improvement
(Updated on March 4, 2014; includes governor exit poll)
New Mexico: Hillary vs Susana Martinez: D +14%
+4% D improvement
(Updated on March 27, 2014)
New York: Hillary vs Christie: D +28%
+0.2% R improvement
(Updated on March 4, 2014)
North Carolina: Hillary vs Christie: D +1.25%
+3.3% D improvement
Current Democratic gain
(Updated on July 31, 2014)
Ohio: Hillary vs Christie: D +6.7%
+3.7% D improvement
(Updated on July 31, 2014)
Oregon: Hillary vs Rand Paul/Huckabee: D +12%
Unchanged from 2012
(Updated on May 30, 2014)
Pennsylvania: Hillary vs Christie: D +3.5%
+1.9% R improvement
(Updated on June 5, 2014)
South Carolina: Hillary vs Marco Rubio: R +7%
+3.5% D improvement
(Updated on November 2, 2013)
Texas: Hillary vs Huckabee: R +8%
+8% D improvement
(Updated on April 18, 2014)
Virginia: Hillary vs Christie: D +3.64%
+0.2% R improvement
(Updated on July 23, 2014)
West Virginia: Hillary vs Bush: R +14%
+13% D improvement
(Updated on October 1, 2013)
Wisconsin: Hillary vs Ryan: D +5.1%
+1.8% R improvement
(Updated on April 25, 2014)
Wyoming: Hillary vs Christie: R +28%
+13% D improvement
(Updated on July 23, 2013)
Average all 30 states: Hillary vs Best Republican: D +0.3%
+3.5% D improvement (from Obama 2012) [projecting a 7.4% victory for Hillary]
That gives us this map right now:
(
Red = Democratic lead or trend
Blue = Republican lead or trend
Green = Basically tied or hardly any trend, unchanged from 2012
Grey = No polling yet
Green = toss up or less than 0.5% lead
20% shade = 0.6-2% lead
30% shade = 2.1-4% lead
40% shade = 4.1-6% lead
50% shade = 6.1-9% lead
60% shade = 9.1-12% lead
70% shade = 12.1-15% lead
80% shade = 15.1-18% lead
90% shade = Above 18.1% lead
In the count of electoral votes, this means the current situation looks like this:
Hillary: 222 EVs (for a total of 16 states)
Best/Tailormade Republican: 120 EVs (for a total of 14 states)
Toss-up: None
No polling: 196 EVs (for a total of 20 states + D.C.)
So far, Hillary has captured an impressive 64.9% of all EVs awarded, against a disappointing 35.1% EVs for the tailormade Republican. Now imagine California being added.
This is how the Trendline Map looks so far:
(
The states which right now are showing the strongest improvement for the Democratic (Hillary) or the Republican candidate (in 12 out of 30 cases, Christie is that person):
1. Arkansas: D +21%
2. Kentucky: D +19%
3. Louisiana: D +14%
4. Kansas: D +13%
5. West Virginia: D +13%
6. Wyoming: D +13%
7. Colorado: R +8.9%
8. New Jersey: R +8.2%
9. Arizona: D +8%
10. Texas: D +8%
11. Maine: R +7%
12. Alaska: D +7%
13. Georgia: D +6%
14. Florida: D +4.9%
15. Mississippi: D +4.5%
All of these changes (in the 15 states above) are (more than) statistically significant.
The whole list of states having been polled till now, going from Democratic stronghold to Republican stronghold:
New York: D +28%
New Mexico: D +14%
Oregon: D +12%
New Jersey: D +9.6%
Maine: D +8%
Currently estimated/projected national average: D +7.4%
Ohio: D +6.7%
Michigan: D +6.1%
Minnesota: D +6%
Florida: D +5.8%
Wisconsin: D +5.1%
Iowa: D +3.9%
Virginia: D +3.6%
Pennsylvania: D +3.5%
Nevada: D +3%
New Hampshire: D +2.1%
North Carolina: D +1.25%
Arizona: R +1%
Georgia: R +2%
Arkansas: R +3%
Louisiana: R +3%
Colorado: R +3.5%
Kentucky: R +4%
Alaska: R +7%
Mississippi: R +7%
South Carolina: R +7%
Texas: R +8%
Kansas: R +9%
Montana: R +13%
West Virginia: R +14%
Wyoming: R +28%
Here are the current stats on the best-tailored Republican candidates in all states polled so far:
1. Chris Christie favoured in 12 of 30 states (for 159 EVs)
2. Mike Huckabee in 6 states (Texas (!), Louisiana (!), Oregon (shared), Arkansas, Mississippi & New Hampshire (!) - for 69 EVs)
3. Jeb Bush favoured in 6 states (Florida, Arizona, Kentucky (!!) (shared), Kansas, West Virginia & Alaska - for 62 EVs)
4. Paul Ryan favoured in 2 states (Wisconsin & Colorado - for 19 EVs)
5. Rand Paul favoured in 3 states (Oregon (shared), Nevada & Montana - for 16 EVs)
6. Tim Pawlenty favoured in 1 state (Minnesota - for 10 EVs)
7. Marco Rubio favoured in 1 state (South Carolina - for 9 EVs)
8. Susana Martinez favoured in 1 state (New Mexico - for 5 EVs)
Current update as of July 31.
Title: Re: 2016 Official Polling Map Thread
Post by: eric82oslo on July 31, 2014, 07:57:14 PM
We finally have the very first California poll! However it does come with some serious flaws. This Gravis Marketing poll, which has Hillary up 9% over Rand Paul (unfortunately he was the only Republican tested), has the most peculiar demographic break down ever. According to its sample, the non-white turn out/demographic should actually be down by 6% compared to the 2012 exit poll, which for 2016 probably means that they're underestimating the non-white vote with at least 10-12%, possibly even more, as its likely to grow, and grow fast! 61% of the poll's respondents were either white or refused to name their race. Compare that with the current 37% of Californians being white according to the Census Bureau. Flawed or not, it's the only thing we have for the single biggest price in the election, so I'm more than happy to finally being able to add California to the polling database. :)
Hillary is currently winning 70% of the electoral votes in the 31 states having been polled to date. That's not an insignificant landslide actually. The biggest Republican state left is Tennessee, while Democrats have still loads left (Illinois, Massachusetts, Washington, Maryland etcetera).
The entire database will be up shortly. The 11 000 character issue is just growing bigger with each new state added.
Title: Re: 2016 Official Polling Map Thread
Post by: eric82oslo on July 31, 2014, 08:13:26 PM
We finally have the very first California poll! See the post I made right above this one for more info.
California's peculiar numbers - which isn't even in line with anything we've yet to see from any other state, even the weak Hillary numbers in Colorado isn't even remotely comparable - had the effect to suppress Hillary's projected nationwide lead from 7.4% to only 6.8%, all on its own! And I'm not even basing these projections on weighted state sizes!
If Gravis Marketing (and other pollsters) are right, the difference of partisan margins between California and Arkansas could be reduced from 47% in 2012 to only 12% in 2016 (yet only in the case that Huckabee & Paul split the ticket somehow). Not so likely, I'd say.
The total number of state polls included in the lists below has thus now reached 149.
So here they are - all the 2016 poll averages for each state - 31 states having been polled to date - and how far off they are compared to the actual 2012 outcomes. I'm only including the Republican candidate with the best statewide polling.
Alaska: Hillary vs Jeb Bush: R +7%
+7% D improvement
(Updated on May 14, 2014)
Arizona: Hillary vs Bush: R +1%
+8% D improvement
(Updated on March 6, 2014)
Arkansas: Hillary vs Mike Huckabee: R +3%
+21% D improvement
(Updated on May 5, 2014)
NEW! California: Hillary vs Rand Paul: D +9%
+14% R improvement
(Updated on August 1, 2014)
Colorado: Hillary vs Paul Ryan: R +3.5%
+8.9% R improvement
Current Republican gain
(Updated on July 29, 2014)
Florida: Hillary vs Bush: D +5.8%
+4.9% D improvement
(Updated on July 24, 2014)
Georgia: Hillary vs Christie: R +2%
+6% D improvement
(Updated August 8, 2013)
Iowa: Hillary vs Christie: D +3.9%
+1.9% R improvement
(Updated on July 17, 2014)
Kansas: Hillary vs Bush: R +9%
+13% D improvement
(Updated on February 24, 2014)
Kentucky: Hillary vs Christie/Bush: R +4%
+19% D improvement
(Updated on July 26, 2014)
Louisiana: Hillary vs Huckabee: R +3%
+14% D improvement
(Updated on July 12, 2014)
Maine: Hillary vs Christie: D +8%
+7% R improvement
(Updated on November 13, 2013)
Michigan: Hillary vs Christie: D +6.1%
+3.4% R improvement
(Updated on June 3, 2014)
Minnesota: Hillary vs Tim Pawlenty: D +6%
+2% R improvement
(Updated on June 18, 2014)
Mississippi: Hillary vs Huckabee: R +7%
+4.5% D improvement
(Updated on July 20, 2014)
Montana: Hillary vs Rand Paul: R +13% (Brian Schweitzer vs Rand Paul: R +8%)
+1% D improvement
(Updated on July 23, 2014)
NEW! Nevada: Hillary vs Rand Paul: D +3%
+4% R improvement
(Updated on July 31, 2014)
New Hampshire: Hillary vs Huckabee: D +2.1%
+3.5% R improvement
(Updated on July 17, 2014)
New Jersey: Hillary vs Christie: D +9.6%
+8.2% R improvement
(Updated on March 4, 2014; includes governor exit poll)
New Mexico: Hillary vs Susana Martinez: D +14%
+4% D improvement
(Updated on March 27, 2014)
New York: Hillary vs Christie: D +28%
+0.2% R improvement
(Updated on March 4, 2014)
North Carolina: Hillary vs Christie: D +1.25%
+3.3% D improvement
Current Democratic gain
(Updated on July 31, 2014)
Ohio: Hillary vs Christie: D +6.7%
+3.7% D improvement
(Updated on July 31, 2014)
Oregon: Hillary vs Rand Paul/Huckabee: D +12%
Unchanged from 2012
(Updated on May 30, 2014)
Pennsylvania: Hillary vs Christie: D +3.5%
+1.9% R improvement
(Updated on June 5, 2014)
South Carolina: Hillary vs Marco Rubio: R +7%
+3.5% D improvement
(Updated on November 2, 2013)
Texas: Hillary vs Huckabee: R +8%
+8% D improvement
(Updated on April 18, 2014)
Virginia: Hillary vs Christie: D +3.64%
+0.2% R improvement
(Updated on July 23, 2014)
West Virginia: Hillary vs Bush: R +14%
+13% D improvement
(Updated on October 1, 2013)
Wisconsin: Hillary vs Ryan: D +5.1%
+1.8% R improvement
(Updated on April 25, 2014)
Wyoming: Hillary vs Christie: R +28%
+13% D improvement
(Updated on July 23, 2013)
Average all 31 states: Hillary vs Best Republican: D +0.6%
+2.9% D improvement (from Obama 2012) [projecting a 6.8% victory for Hillary]
That gives us this map right now:
(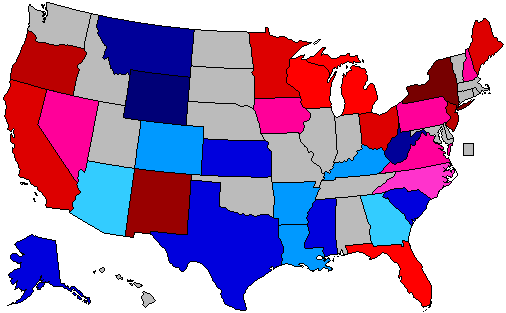 )
)
Red = Democratic lead or trend
Blue = Republican lead or trend
Green = Basically tied or hardly any trend, unchanged from 2012
Grey = No polling yet
Green = toss up or less than 0.5% lead
20% shade = 0.6-2% lead
30% shade = 2.1-4% lead
40% shade = 4.1-6% lead
50% shade = 6.1-9% lead
60% shade = 9.1-12% lead
70% shade = 12.1-15% lead
80% shade = 15.1-18% lead
90% shade = Above 18.1% lead
In the count of electoral votes, this means the current situation looks like this:
Hillary: 277 EVs (for a total of 17 states)
Best/Tailormade Republican: 120 EVs (for a total of 14 states)
Toss-up: None
No polling: 141 EVs (for a total of 19 states + D.C.)
So far, Hillary has captured an impressive 69.8% of all EVs awarded, against a disappointing 30.2% EVs for the tailormade Republican.
This is how the Trendline Map looks so far:
( )
)
The states which right now are showing the strongest improvement for the Democratic (Hillary) or the Republican candidate (in 12 out of 31 cases, Christie is that person):
1. Arkansas: D +21%
2. Kentucky: D +19%
3. California: R +14%
4. Louisiana: D +14%
5. Kansas: D +13%
6. West Virginia: D +13%
7. Wyoming: D +13%
8. Colorado: R +8.9%
9. New Jersey: R +8.2%
10. Arizona: D +8%
11. Texas: D +8%
12. Maine: R +7%
13. Alaska: D +7%
14. Georgia: D +6%
15. Florida: D +4.9%
16. Mississippi: D +4.5%
All of these changes (in the 16 states above) are (more than) statistically significant, except there are HUGE question marks with California.
The whole list of states having been polled till now, going from Democratic stronghold to Republican stronghold:
New York: D +28%
New Mexico: D +14%
Oregon: D +12%
New Jersey: D +9.6%
California: D +9%
Maine: D +8%
Currently estimated/projected national average: D +6.8%
Ohio: D +6.7%
Michigan: D +6.1%
Minnesota: D +6%
Florida: D +5.8%
Wisconsin: D +5.1%
Iowa: D +3.9%
Virginia: D +3.6%
Pennsylvania: D +3.5%
Nevada: D +3%
New Hampshire: D +2.1%
North Carolina: D +1.25%
Arizona: R +1%
Georgia: R +2%
Arkansas: R +3%
Louisiana: R +3%
Colorado: R +3.5%
Kentucky: R +4%
Alaska: R +7%
Mississippi: R +7%
South Carolina: R +7%
Texas: R +8%
Kansas: R +9%
Montana: R +13%
West Virginia: R +14%
Wyoming: R +28%
Here are the current stats on the best-tailored Republican candidates in all states polled so far:
1. Chris Christie favoured in 12 of 31 states (for 159 EVs)
2. Rand Paul favoured in 4 states (California, Oregon (shared), Nevada & Montana - for 71 EVs)
3. Mike Huckabee in 6 states (Texas (!), Louisiana (!), Oregon (shared), Arkansas, Mississippi & New Hampshire (!) - for 69 EVs)
4. Jeb Bush favoured in 6 states (Florida, Arizona, Kentucky (!) (shared), Kansas, West Virginia & Alaska - for 62 EVs)
5. Paul Ryan favoured in 2 states (Wisconsin & Colorado - for 19 EVs)
6. Tim Pawlenty favoured in 1 state (Minnesota - for 10 EVs)
7. Marco Rubio favoured in 1 state (South Carolina - for 9 EVs)
8. Susana Martinez favoured in 1 state (New Mexico - for 5 EVs)
Current update as of August 1.
California's peculiar numbers - which isn't even in line with anything we've yet to see from any other state, even the weak Hillary numbers in Colorado isn't even remotely comparable - had the effect to suppress Hillary's projected nationwide lead from 7.4% to only 6.8%, all on its own! And I'm not even basing these projections on weighted state sizes!
If Gravis Marketing (and other pollsters) are right, the difference of partisan margins between California and Arkansas could be reduced from 47% in 2012 to only 12% in 2016 (yet only in the case that Huckabee & Paul split the ticket somehow). Not so likely, I'd say.
The total number of state polls included in the lists below has thus now reached 149.
So here they are - all the 2016 poll averages for each state - 31 states having been polled to date - and how far off they are compared to the actual 2012 outcomes. I'm only including the Republican candidate with the best statewide polling.
Alaska: Hillary vs Jeb Bush: R +7%
+7% D improvement
(Updated on May 14, 2014)
Arizona: Hillary vs Bush: R +1%
+8% D improvement
(Updated on March 6, 2014)
Arkansas: Hillary vs Mike Huckabee: R +3%
+21% D improvement
(Updated on May 5, 2014)
NEW! California: Hillary vs Rand Paul: D +9%
+14% R improvement
(Updated on August 1, 2014)
Colorado: Hillary vs Paul Ryan: R +3.5%
+8.9% R improvement
Current Republican gain
(Updated on July 29, 2014)
Florida: Hillary vs Bush: D +5.8%
+4.9% D improvement
(Updated on July 24, 2014)
Georgia: Hillary vs Christie: R +2%
+6% D improvement
(Updated August 8, 2013)
Iowa: Hillary vs Christie: D +3.9%
+1.9% R improvement
(Updated on July 17, 2014)
Kansas: Hillary vs Bush: R +9%
+13% D improvement
(Updated on February 24, 2014)
Kentucky: Hillary vs Christie/Bush: R +4%
+19% D improvement
(Updated on July 26, 2014)
Louisiana: Hillary vs Huckabee: R +3%
+14% D improvement
(Updated on July 12, 2014)
Maine: Hillary vs Christie: D +8%
+7% R improvement
(Updated on November 13, 2013)
Michigan: Hillary vs Christie: D +6.1%
+3.4% R improvement
(Updated on June 3, 2014)
Minnesota: Hillary vs Tim Pawlenty: D +6%
+2% R improvement
(Updated on June 18, 2014)
Mississippi: Hillary vs Huckabee: R +7%
+4.5% D improvement
(Updated on July 20, 2014)
Montana: Hillary vs Rand Paul: R +13% (Brian Schweitzer vs Rand Paul: R +8%)
+1% D improvement
(Updated on July 23, 2014)
NEW! Nevada: Hillary vs Rand Paul: D +3%
+4% R improvement
(Updated on July 31, 2014)
New Hampshire: Hillary vs Huckabee: D +2.1%
+3.5% R improvement
(Updated on July 17, 2014)
New Jersey: Hillary vs Christie: D +9.6%
+8.2% R improvement
(Updated on March 4, 2014; includes governor exit poll)
New Mexico: Hillary vs Susana Martinez: D +14%
+4% D improvement
(Updated on March 27, 2014)
New York: Hillary vs Christie: D +28%
+0.2% R improvement
(Updated on March 4, 2014)
North Carolina: Hillary vs Christie: D +1.25%
+3.3% D improvement
Current Democratic gain
(Updated on July 31, 2014)
Ohio: Hillary vs Christie: D +6.7%
+3.7% D improvement
(Updated on July 31, 2014)
Oregon: Hillary vs Rand Paul/Huckabee: D +12%
Unchanged from 2012
(Updated on May 30, 2014)
Pennsylvania: Hillary vs Christie: D +3.5%
+1.9% R improvement
(Updated on June 5, 2014)
South Carolina: Hillary vs Marco Rubio: R +7%
+3.5% D improvement
(Updated on November 2, 2013)
Texas: Hillary vs Huckabee: R +8%
+8% D improvement
(Updated on April 18, 2014)
Virginia: Hillary vs Christie: D +3.64%
+0.2% R improvement
(Updated on July 23, 2014)
West Virginia: Hillary vs Bush: R +14%
+13% D improvement
(Updated on October 1, 2013)
Wisconsin: Hillary vs Ryan: D +5.1%
+1.8% R improvement
(Updated on April 25, 2014)
Wyoming: Hillary vs Christie: R +28%
+13% D improvement
(Updated on July 23, 2013)
Average all 31 states: Hillary vs Best Republican: D +0.6%
+2.9% D improvement (from Obama 2012) [projecting a 6.8% victory for Hillary]
That gives us this map right now:
(
Red = Democratic lead or trend
Blue = Republican lead or trend
Green = Basically tied or hardly any trend, unchanged from 2012
Grey = No polling yet
Green = toss up or less than 0.5% lead
20% shade = 0.6-2% lead
30% shade = 2.1-4% lead
40% shade = 4.1-6% lead
50% shade = 6.1-9% lead
60% shade = 9.1-12% lead
70% shade = 12.1-15% lead
80% shade = 15.1-18% lead
90% shade = Above 18.1% lead
In the count of electoral votes, this means the current situation looks like this:
Hillary: 277 EVs (for a total of 17 states)
Best/Tailormade Republican: 120 EVs (for a total of 14 states)
Toss-up: None
No polling: 141 EVs (for a total of 19 states + D.C.)
So far, Hillary has captured an impressive 69.8% of all EVs awarded, against a disappointing 30.2% EVs for the tailormade Republican.
This is how the Trendline Map looks so far:
(
The states which right now are showing the strongest improvement for the Democratic (Hillary) or the Republican candidate (in 12 out of 31 cases, Christie is that person):
1. Arkansas: D +21%
2. Kentucky: D +19%
3. California: R +14%
4. Louisiana: D +14%
5. Kansas: D +13%
6. West Virginia: D +13%
7. Wyoming: D +13%
8. Colorado: R +8.9%
9. New Jersey: R +8.2%
10. Arizona: D +8%
11. Texas: D +8%
12. Maine: R +7%
13. Alaska: D +7%
14. Georgia: D +6%
15. Florida: D +4.9%
16. Mississippi: D +4.5%
All of these changes (in the 16 states above) are (more than) statistically significant, except there are HUGE question marks with California.
The whole list of states having been polled till now, going from Democratic stronghold to Republican stronghold:
New York: D +28%
New Mexico: D +14%
Oregon: D +12%
New Jersey: D +9.6%
California: D +9%
Maine: D +8%
Currently estimated/projected national average: D +6.8%
Ohio: D +6.7%
Michigan: D +6.1%
Minnesota: D +6%
Florida: D +5.8%
Wisconsin: D +5.1%
Iowa: D +3.9%
Virginia: D +3.6%
Pennsylvania: D +3.5%
Nevada: D +3%
New Hampshire: D +2.1%
North Carolina: D +1.25%
Arizona: R +1%
Georgia: R +2%
Arkansas: R +3%
Louisiana: R +3%
Colorado: R +3.5%
Kentucky: R +4%
Alaska: R +7%
Mississippi: R +7%
South Carolina: R +7%
Texas: R +8%
Kansas: R +9%
Montana: R +13%
West Virginia: R +14%
Wyoming: R +28%
Here are the current stats on the best-tailored Republican candidates in all states polled so far:
1. Chris Christie favoured in 12 of 31 states (for 159 EVs)
2. Rand Paul favoured in 4 states (California, Oregon (shared), Nevada & Montana - for 71 EVs)
3. Mike Huckabee in 6 states (Texas (!), Louisiana (!), Oregon (shared), Arkansas, Mississippi & New Hampshire (!) - for 69 EVs)
4. Jeb Bush favoured in 6 states (Florida, Arizona, Kentucky (!) (shared), Kansas, West Virginia & Alaska - for 62 EVs)
5. Paul Ryan favoured in 2 states (Wisconsin & Colorado - for 19 EVs)
6. Tim Pawlenty favoured in 1 state (Minnesota - for 10 EVs)
7. Marco Rubio favoured in 1 state (South Carolina - for 9 EVs)
8. Susana Martinez favoured in 1 state (New Mexico - for 5 EVs)
Current update as of August 1.
Title: Re: 2016 Official Polling Map Thread
Post by: pbrower2a on August 01, 2014, 01:14:37 PM
Quote
As for the presidential election in 2016 with alternative candidate match ups, voters were polled If the election for President were held today and the candidates were Republican Rand Paul and Democrat Elizabeth Warren, whom would you vote for? A potential race between Rand Paul (R) and Elizabeth Warren (D) resulted in Paul holding an 11-point margin over Warren (44% to 33%) with 23% expressing uncertainty.
http://gravismarketing.com/polling-and-market-research/california-statewide-polling/
Talk about limited! Only two matchups, and only one of them has any relevance to this polling thread. But it does account for 10.2% of the electoral votes in the US. Like it or not it fills a gap.
Libertarians are a loud lot in California, but they also have a clear ceiling. I guess that Paul would not rise much from 40% of the vote share. Hillary Clinton will not lose California. I do not change my projection that she would get anything less than 55% of the vote -- heck, President Obama on this poll has a 48% approval rating in California, which is surely one of the highest.
Most R voters in California are Libertarians, so I can't imagine Christie, Bush, or Huckabee faring any better.
Hillary Clinton vs. Jeb Bush
(
Hillary Clinton vs. Chris Christie
(
Hillary Clinton vs. Mike Huckabee
(
Hillary Clinton vs. Rand Paul
(
blue, Republican -- red, Democratic
30% -- lead with 40-49% but a margin of 3% or less
40% -- lead with 40-49% but a margin of 4% or more
60% -- lead with 50-54%
70% -- lead with 55-59%
90% -- lead with 60% or more
Title: Re: 2016 Official Polling Map Thread
Post by: eric82oslo on August 04, 2014, 08:52:57 PM
Gravis doesn't look like the best and most serious pollster around to put it mildly, nevertheless I'm not in the business of cherrypicking certain polls and pollsters. This is a polling aggregate database that will accept any kind of polls and not discriminate against anyone.
Having said that, we have a new match-up for Wisconsin, done by Gravis, which shows Paul Ryan leading Hillary by 1%. It's the very first poll (out of 6) to show any Republican leading Hillary in the state. This thus reduces Hillary's average lead on Ryan by 1% in the state, from 5.1% to 4.1%.
Also, SurveyUSA have matched Hillary with Rick Perry in Florida. Hillary won easily by 10%.
The total number of state polls included in the lists below has thus now reached 151.
So here they are - all the 2016 poll averages for each state - 31 states having been polled to date - and how far off they are compared to the actual 2012 outcomes. I'm only including the Republican candidate with the best statewide polling.
Alaska: Hillary vs Jeb Bush: R +7%
+7% D improvement
(Updated on May 14, 2014)
Arizona: Hillary vs Bush: R +1%
+8% D improvement
(Updated on March 6, 2014)
Arkansas: Hillary vs Mike Huckabee: R +3%
+21% D improvement
(Updated on May 5, 2014)
NEW! California: Hillary vs Rand Paul: D +9%
+14% R improvement
(Updated on August 1, 2014)
Colorado: Hillary vs Paul Ryan: R +3.5%
+8.9% R improvement
Current Republican gain
(Updated on July 29, 2014)
Florida: Hillary vs Bush: D +5.8%
+4.9% D improvement
(Updated on July 24, 2014)
Georgia: Hillary vs Christie: R +2%
+6% D improvement
(Updated August 8, 2013)
Iowa: Hillary vs Christie: D +3.9%
+1.9% R improvement
(Updated on July 17, 2014)
Kansas: Hillary vs Bush: R +9%
+13% D improvement
(Updated on February 24, 2014)
Kentucky: Hillary vs Christie/Bush: R +4%
+19% D improvement
(Updated on July 26, 2014)
Louisiana: Hillary vs Huckabee: R +3%
+14% D improvement
(Updated on July 12, 2014)
Maine: Hillary vs Christie: D +8%
+7% R improvement
(Updated on November 13, 2013)
Michigan: Hillary vs Christie: D +6.1%
+3.4% R improvement
(Updated on June 3, 2014)
Minnesota: Hillary vs Tim Pawlenty: D +6%
+2% R improvement
(Updated on June 18, 2014)
Mississippi: Hillary vs Huckabee: R +7%
+4.5% D improvement
(Updated on July 20, 2014)
Montana: Hillary vs Rand Paul: R +13% (Brian Schweitzer vs Rand Paul: R +8%)
+1% D improvement
(Updated on July 23, 2014)
NEW! Nevada: Hillary vs Rand Paul: D +3%
+4% R improvement
(Updated on July 31, 2014)
New Hampshire: Hillary vs Huckabee: D +2.1%
+3.5% R improvement
(Updated on July 17, 2014)
New Jersey: Hillary vs Christie: D +9.6%
+8.2% R improvement
(Updated on March 4, 2014; includes governor exit poll)
New Mexico: Hillary vs Susana Martinez: D +14%
+4% D improvement
(Updated on March 27, 2014)
New York: Hillary vs Christie: D +28%
+0.2% R improvement
(Updated on March 4, 2014)
North Carolina: Hillary vs Christie: D +1.25%
+3.3% D improvement
Current Democratic gain
(Updated on July 31, 2014)
Ohio: Hillary vs Christie: D +6.7%
+3.7% D improvement
(Updated on July 31, 2014)
Oregon: Hillary vs Rand Paul/Huckabee: D +12%
Unchanged from 2012
(Updated on May 30, 2014)
Pennsylvania: Hillary vs Christie: D +3.5%
+1.9% R improvement
(Updated on June 5, 2014)
South Carolina: Hillary vs Marco Rubio: R +7%
+3.5% D improvement
(Updated on November 2, 2013)
Texas: Hillary vs Huckabee: R +8%
+8% D improvement
(Updated on April 18, 2014)
Virginia: Hillary vs Christie: D +3.64%
+0.2% R improvement
(Updated on July 23, 2014)
West Virginia: Hillary vs Bush: R +14%
+13% D improvement
(Updated on October 1, 2013)
Wisconsin: Hillary vs Ryan: D +4.1%
+2.8% R improvement
(Updated on August 5, 2014)
Wyoming: Hillary vs Christie: R +28%
+13% D improvement
(Updated on July 23, 2013)
Average all 31 states: Hillary vs Best Republican: D +0.6%
+2.9% D improvement (from Obama 2012) [projecting a 6.7% victory for Hillary]
That gives us this map right now:
()
Red = Democratic lead or trend
Blue = Republican lead or trend
Green = Basically tied or hardly any trend, unchanged from 2012
Grey = No polling yet
Green = toss up or less than 0.5% lead
20% shade = 0.6-2% lead
30% shade = 2.1-4% lead
40% shade = 4.1-6% lead
50% shade = 6.1-9% lead
60% shade = 9.1-12% lead
70% shade = 12.1-15% lead
80% shade = 15.1-18% lead
90% shade = Above 18.1% lead
In the count of electoral votes, this means the current situation looks like this:
Hillary: 277 EVs (for a total of 17 states)
Best/Tailormade Republican: 120 EVs (for a total of 14 states)
Toss-up: None
No polling: 141 EVs (for a total of 19 states + D.C.)
So far, Hillary has captured an impressive 69.8% of all EVs awarded, against a disappointing 30.2% EVs for the tailormade Republican.
This is how the Trendline Map looks so far:
(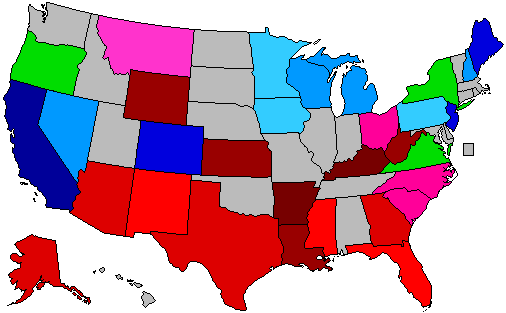 )
)
The states which right now are showing the strongest improvement for the Democratic (Hillary) or the Republican candidate (in 12 out of 31 cases, Christie is that person):
1. Arkansas: D +21%
2. Kentucky: D +19%
3. California: R +14%
4. Louisiana: D +14%
5. Kansas: D +13%
6. West Virginia: D +13%
7. Wyoming: D +13%
8. Colorado: R +8.9%
9. New Jersey: R +8.2%
10. Arizona: D +8%
11. Texas: D +8%
12. Maine: R +7%
13. Alaska: D +7%
14. Georgia: D +6%
15. Florida: D +4.9%
16. Mississippi: D +4.5%
All of these changes (in the 16 states above) are (more than) statistically significant, except there are HUGE question marks with California.
The whole list of states having been polled till now, going from Democratic stronghold to Republican stronghold:
New York: D +28%
New Mexico: D +14%
Oregon: D +12%
New Jersey: D +9.6%
California: D +9%
Maine: D +8%
Currently estimated/projected national average: D +6.7%
Ohio: D +6.7%
Michigan: D +6.1%
Minnesota: D +6%
Florida: D +5.8%
Wisconsin: D +4.1%
Iowa: D +3.9%
Virginia: D +3.6%
Pennsylvania: D +3.5%
Nevada: D +3%
New Hampshire: D +2.1%
North Carolina: D +1.25%
Arizona: R +1%
Georgia: R +2%
Arkansas: R +3%
Louisiana: R +3%
Colorado: R +3.5%
Kentucky: R +4%
Alaska: R +7%
Mississippi: R +7%
South Carolina: R +7%
Texas: R +8%
Kansas: R +9%
Montana: R +13%
West Virginia: R +14%
Wyoming: R +28%
Here are the current stats on the best-tailored Republican candidates in all states polled so far:
1. Chris Christie favoured in 12 of 31 states (for 159 EVs)
2. Rand Paul favoured in 4 states (California, Oregon (shared), Nevada & Montana - for 71 EVs)
3. Mike Huckabee in 6 states (Texas (!), Louisiana (!), Oregon (shared), Arkansas, Mississippi & New Hampshire (!) - for 69 EVs)
4. Jeb Bush favoured in 6 states (Florida, Arizona, Kentucky (!) (shared), Kansas, West Virginia & Alaska - for 62 EVs)
5. Paul Ryan favoured in 2 states (Wisconsin & Colorado - for 19 EVs)
6. Tim Pawlenty favoured in 1 state (Minnesota - for 10 EVs)
7. Marco Rubio favoured in 1 state (South Carolina - for 9 EVs)
8. Susana Martinez favoured in 1 state (New Mexico - for 5 EVs)
Current update as of August 5.
Having said that, we have a new match-up for Wisconsin, done by Gravis, which shows Paul Ryan leading Hillary by 1%. It's the very first poll (out of 6) to show any Republican leading Hillary in the state. This thus reduces Hillary's average lead on Ryan by 1% in the state, from 5.1% to 4.1%.
Also, SurveyUSA have matched Hillary with Rick Perry in Florida. Hillary won easily by 10%.
The total number of state polls included in the lists below has thus now reached 151.
So here they are - all the 2016 poll averages for each state - 31 states having been polled to date - and how far off they are compared to the actual 2012 outcomes. I'm only including the Republican candidate with the best statewide polling.
Alaska: Hillary vs Jeb Bush: R +7%
+7% D improvement
(Updated on May 14, 2014)
Arizona: Hillary vs Bush: R +1%
+8% D improvement
(Updated on March 6, 2014)
Arkansas: Hillary vs Mike Huckabee: R +3%
+21% D improvement
(Updated on May 5, 2014)
NEW! California: Hillary vs Rand Paul: D +9%
+14% R improvement
(Updated on August 1, 2014)
Colorado: Hillary vs Paul Ryan: R +3.5%
+8.9% R improvement
Current Republican gain
(Updated on July 29, 2014)
Florida: Hillary vs Bush: D +5.8%
+4.9% D improvement
(Updated on July 24, 2014)
Georgia: Hillary vs Christie: R +2%
+6% D improvement
(Updated August 8, 2013)
Iowa: Hillary vs Christie: D +3.9%
+1.9% R improvement
(Updated on July 17, 2014)
Kansas: Hillary vs Bush: R +9%
+13% D improvement
(Updated on February 24, 2014)
Kentucky: Hillary vs Christie/Bush: R +4%
+19% D improvement
(Updated on July 26, 2014)
Louisiana: Hillary vs Huckabee: R +3%
+14% D improvement
(Updated on July 12, 2014)
Maine: Hillary vs Christie: D +8%
+7% R improvement
(Updated on November 13, 2013)
Michigan: Hillary vs Christie: D +6.1%
+3.4% R improvement
(Updated on June 3, 2014)
Minnesota: Hillary vs Tim Pawlenty: D +6%
+2% R improvement
(Updated on June 18, 2014)
Mississippi: Hillary vs Huckabee: R +7%
+4.5% D improvement
(Updated on July 20, 2014)
Montana: Hillary vs Rand Paul: R +13% (Brian Schweitzer vs Rand Paul: R +8%)
+1% D improvement
(Updated on July 23, 2014)
NEW! Nevada: Hillary vs Rand Paul: D +3%
+4% R improvement
(Updated on July 31, 2014)
New Hampshire: Hillary vs Huckabee: D +2.1%
+3.5% R improvement
(Updated on July 17, 2014)
New Jersey: Hillary vs Christie: D +9.6%
+8.2% R improvement
(Updated on March 4, 2014; includes governor exit poll)
New Mexico: Hillary vs Susana Martinez: D +14%
+4% D improvement
(Updated on March 27, 2014)
New York: Hillary vs Christie: D +28%
+0.2% R improvement
(Updated on March 4, 2014)
North Carolina: Hillary vs Christie: D +1.25%
+3.3% D improvement
Current Democratic gain
(Updated on July 31, 2014)
Ohio: Hillary vs Christie: D +6.7%
+3.7% D improvement
(Updated on July 31, 2014)
Oregon: Hillary vs Rand Paul/Huckabee: D +12%
Unchanged from 2012
(Updated on May 30, 2014)
Pennsylvania: Hillary vs Christie: D +3.5%
+1.9% R improvement
(Updated on June 5, 2014)
South Carolina: Hillary vs Marco Rubio: R +7%
+3.5% D improvement
(Updated on November 2, 2013)
Texas: Hillary vs Huckabee: R +8%
+8% D improvement
(Updated on April 18, 2014)
Virginia: Hillary vs Christie: D +3.64%
+0.2% R improvement
(Updated on July 23, 2014)
West Virginia: Hillary vs Bush: R +14%
+13% D improvement
(Updated on October 1, 2013)
Wisconsin: Hillary vs Ryan: D +4.1%
+2.8% R improvement
(Updated on August 5, 2014)
Wyoming: Hillary vs Christie: R +28%
+13% D improvement
(Updated on July 23, 2013)
Average all 31 states: Hillary vs Best Republican: D +0.6%
+2.9% D improvement (from Obama 2012) [projecting a 6.7% victory for Hillary]
That gives us this map right now:
(
Red = Democratic lead or trend
Blue = Republican lead or trend
Green = Basically tied or hardly any trend, unchanged from 2012
Grey = No polling yet
Green = toss up or less than 0.5% lead
20% shade = 0.6-2% lead
30% shade = 2.1-4% lead
40% shade = 4.1-6% lead
50% shade = 6.1-9% lead
60% shade = 9.1-12% lead
70% shade = 12.1-15% lead
80% shade = 15.1-18% lead
90% shade = Above 18.1% lead
In the count of electoral votes, this means the current situation looks like this:
Hillary: 277 EVs (for a total of 17 states)
Best/Tailormade Republican: 120 EVs (for a total of 14 states)
Toss-up: None
No polling: 141 EVs (for a total of 19 states + D.C.)
So far, Hillary has captured an impressive 69.8% of all EVs awarded, against a disappointing 30.2% EVs for the tailormade Republican.
This is how the Trendline Map looks so far:
(
The states which right now are showing the strongest improvement for the Democratic (Hillary) or the Republican candidate (in 12 out of 31 cases, Christie is that person):
1. Arkansas: D +21%
2. Kentucky: D +19%
3. California: R +14%
4. Louisiana: D +14%
5. Kansas: D +13%
6. West Virginia: D +13%
7. Wyoming: D +13%
8. Colorado: R +8.9%
9. New Jersey: R +8.2%
10. Arizona: D +8%
11. Texas: D +8%
12. Maine: R +7%
13. Alaska: D +7%
14. Georgia: D +6%
15. Florida: D +4.9%
16. Mississippi: D +4.5%
All of these changes (in the 16 states above) are (more than) statistically significant, except there are HUGE question marks with California.
The whole list of states having been polled till now, going from Democratic stronghold to Republican stronghold:
New York: D +28%
New Mexico: D +14%
Oregon: D +12%
New Jersey: D +9.6%
California: D +9%
Maine: D +8%
Currently estimated/projected national average: D +6.7%
Ohio: D +6.7%
Michigan: D +6.1%
Minnesota: D +6%
Florida: D +5.8%
Wisconsin: D +4.1%
Iowa: D +3.9%
Virginia: D +3.6%
Pennsylvania: D +3.5%
Nevada: D +3%
New Hampshire: D +2.1%
North Carolina: D +1.25%
Arizona: R +1%
Georgia: R +2%
Arkansas: R +3%
Louisiana: R +3%
Colorado: R +3.5%
Kentucky: R +4%
Alaska: R +7%
Mississippi: R +7%
South Carolina: R +7%
Texas: R +8%
Kansas: R +9%
Montana: R +13%
West Virginia: R +14%
Wyoming: R +28%
Here are the current stats on the best-tailored Republican candidates in all states polled so far:
1. Chris Christie favoured in 12 of 31 states (for 159 EVs)
2. Rand Paul favoured in 4 states (California, Oregon (shared), Nevada & Montana - for 71 EVs)
3. Mike Huckabee in 6 states (Texas (!), Louisiana (!), Oregon (shared), Arkansas, Mississippi & New Hampshire (!) - for 69 EVs)
4. Jeb Bush favoured in 6 states (Florida, Arizona, Kentucky (!) (shared), Kansas, West Virginia & Alaska - for 62 EVs)
5. Paul Ryan favoured in 2 states (Wisconsin & Colorado - for 19 EVs)
6. Tim Pawlenty favoured in 1 state (Minnesota - for 10 EVs)
7. Marco Rubio favoured in 1 state (South Carolina - for 9 EVs)
8. Susana Martinez favoured in 1 state (New Mexico - for 5 EVs)
Current update as of August 5.
Title: Re: 2016 Official Polling Map Thread
Post by: sentinel on August 05, 2014, 05:59:17 PM
[bThis is a polling aggregate database that will accept any kind of polls and not discriminate against anyone.
Oh really?
SirNick Polling:
Every State:
Clinton: 99%
All Others: 1%
Margin of Error +/- 50%
Title: Re: 2016 Official Polling Map Thread
Post by: IceSpear on August 05, 2014, 08:03:13 PM
[bThis is a polling aggregate database that will accept any kind of polls and not discriminate against anyone.
Oh really?
SirNick Polling:
Every State:
Clinton: 99%
All Others: 1%
Margin of Error +/- 50%
This looks a bit hackish tbqh. My new venture, IceSpear Polling Company, has just polled Alabama. Here are my results:
Clinton 72%
Republican 17%
Undecided 11%
Title: Re: 2016 Official Polling Map Thread
Post by: pbrower2a on August 06, 2014, 09:06:22 AM
Arkansas now seems to be a quixotic quest for 2016 for Hillary, according to PPP:
Bush 46%
Clinton 41%
Christie 42%
Clinton 41%
Cruz 46%
Clinton 42%
Huckabee 55%
Clinton 39%
Paul 45%
Clinton 42%
http://www.publicpolicypolling.com/pdf/2014/PPP_Release_AR_806513.pdf
Q fills some holes for New Jersey:
50% Clinton
42% Christie
54% Clinton
34% Bush
55% Clinton
35% Paul
57% Clinton
34% Huckabee
From July 31 - August 4, Quinnipiac University surveyed 1,148 New Jersey registered voters, with a margin of error of +/- 2.9 percentage points. Live interviewers call land lines and cell phones.
http://www.quinnipiac.edu/news-and-events/quinnipiac-university-poll/new-jersey/release-detail?ReleaseID=2068
Hillary Clinton vs. Jeb Bush
(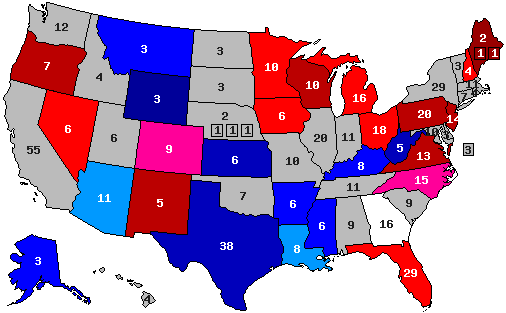 )
)
Hillary Clinton vs. Chris Christie
(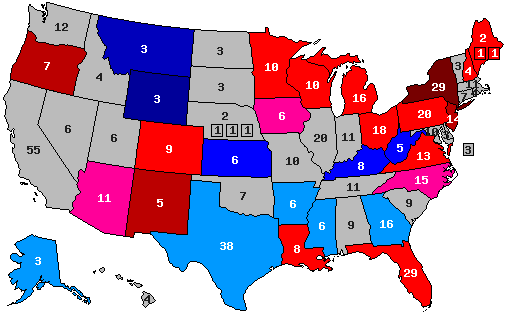 )
)
Hillary Clinton vs. Mike Huckabee
( )
)
Hillary Clinton vs. Rand Paul
(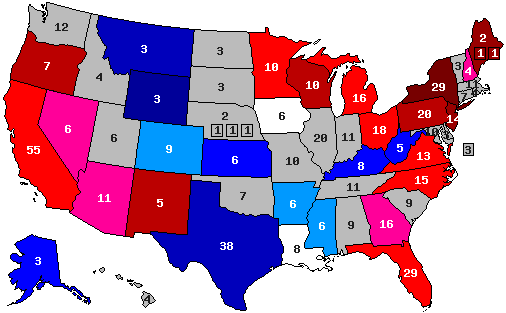 )
)
blue, Republican -- red, Democratic
30% -- lead with 40-49% but a margin of 3% or less
40% -- lead with 40-49% but a margin of 4% or more
60% -- lead with 50-54%
70% -- lead with 55-59%
90% -- lead with 60% or more
Bush 46%
Clinton 41%
Christie 42%
Clinton 41%
Cruz 46%
Clinton 42%
Huckabee 55%
Clinton 39%
Paul 45%
Clinton 42%
http://www.publicpolicypolling.com/pdf/2014/PPP_Release_AR_806513.pdf
Q fills some holes for New Jersey:
50% Clinton
42% Christie
54% Clinton
34% Bush
55% Clinton
35% Paul
57% Clinton
34% Huckabee
From July 31 - August 4, Quinnipiac University surveyed 1,148 New Jersey registered voters, with a margin of error of +/- 2.9 percentage points. Live interviewers call land lines and cell phones.
http://www.quinnipiac.edu/news-and-events/quinnipiac-university-poll/new-jersey/release-detail?ReleaseID=2068
Hillary Clinton vs. Jeb Bush
(
Hillary Clinton vs. Chris Christie
(
Hillary Clinton vs. Mike Huckabee
(
Hillary Clinton vs. Rand Paul
(
blue, Republican -- red, Democratic
30% -- lead with 40-49% but a margin of 3% or less
40% -- lead with 40-49% but a margin of 4% or more
60% -- lead with 50-54%
70% -- lead with 55-59%
90% -- lead with 60% or more
Title: Re: 2016 Official Polling Map Thread
Post by: pbrower2a on August 06, 2014, 09:15:44 AM
Here's my projection of the 2016 election based upon what I see in Hillary Clinton against the main four potential nominees in current polls. I pay no attention to Ted Cruz, Mario Rubio, or Scott Walker, as they lose by ludicrous margins in all but sure-R states.
Adjusting for Arkansas.
( )
)
Legitimate swing states:
white -- mixed results or any tie
pink -- D lead in all 4 current polls, but swing states in 2008 and 2012
pale blue -- R lead in all current polls, all but one of them under 4%
Fringe swing states:
medium red -- D lead by at least 4% (but under 50%) in all but at most one poll but not swing states in 2008 or 2012
medium blue -- R lead by at least 4% (but under 50%) in all but at most one poll but not swing states in 2008 or 2012
Non-swing states
dark red -- D lead with at least 50% in at least two polls
dark blue -- R lead with at least 50% in at least two polls
Gray -- no polling
Now, based on how states did in 2008 and 2012 and how analogous states do, I fill in the rest:
(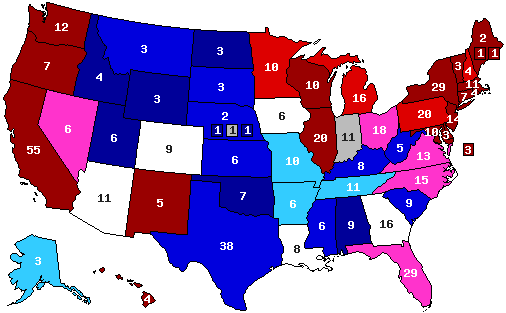 )
)
Legitimate swing states:
white -- mixed results or any tie 66
pink -- D lead in all 4 current polls, but swing states in 2008 and 2012, or a split 81
pale blue -- R lead in all current polls, all but one of them under 4% 14
Fringe swing states:
medium red -- D lead by at least 4% (but under 50%) in all but at most one poll but not swing states in 2008 or 2012 50
medium blue -- R lead by at least 4% (but under 50%) in all but at most one poll but not swing states in 2008 or 2012 76
Non-swing states
dark red -- D lead with at least 50% in at least two polls 199
dark blue -- R lead with at least 50% in at least two polls 32
Gray -- I have no idea (no suitable analogues) 12
I see America much less polarized now than it was in 2008 or 2012.
Adjusting for Arkansas.
(
Legitimate swing states:
white -- mixed results or any tie
pink -- D lead in all 4 current polls, but swing states in 2008 and 2012
pale blue -- R lead in all current polls, all but one of them under 4%
Fringe swing states:
medium red -- D lead by at least 4% (but under 50%) in all but at most one poll but not swing states in 2008 or 2012
medium blue -- R lead by at least 4% (but under 50%) in all but at most one poll but not swing states in 2008 or 2012
Non-swing states
dark red -- D lead with at least 50% in at least two polls
dark blue -- R lead with at least 50% in at least two polls
Gray -- no polling
Now, based on how states did in 2008 and 2012 and how analogous states do, I fill in the rest:
(
Legitimate swing states:
white -- mixed results or any tie 66
pink -- D lead in all 4 current polls, but swing states in 2008 and 2012, or a split 81
pale blue -- R lead in all current polls, all but one of them under 4% 14
Fringe swing states:
medium red -- D lead by at least 4% (but under 50%) in all but at most one poll but not swing states in 2008 or 2012 50
medium blue -- R lead by at least 4% (but under 50%) in all but at most one poll but not swing states in 2008 or 2012 76
Non-swing states
dark red -- D lead with at least 50% in at least two polls 199
dark blue -- R lead with at least 50% in at least two polls 32
Gray -- I have no idea (no suitable analogues) 12
I see America much less polarized now than it was in 2008 or 2012.
Title: Re: 2016 Official Polling Map Thread
Post by: pbrower2a on August 08, 2014, 04:07:43 PM
Connecticut, Gravis. Internet poll, so beware, and only one matchup between Hillary Clinton and anyone with legislative experience. One gap miserably filled. No Republican nominee has a real chance of winning Connecticut, which is about the only conclusion I can get.
It's the first one on Connecticut, and any fresh poll on Connecticut will be welcome. Q, perhaps, in view of the gubernatorial race?
Clinton (D)- 45%
Carson (R)- 36%
Clinton (D)- 48%
Paul (R)- 33%
http://gravismarketing.com/polling-and-market-research/connecticut-polling-data-august-2014/
Hillary Clinton vs. Jeb Bush
()
Hillary Clinton vs. Chris Christie
()
Hillary Clinton vs. Mike Huckabee
()
Hillary Clinton vs. Rand Paul
( )
)
blue, Republican -- red, Democratic
30% -- lead with 40-49% but a margin of 3% or less
40% -- lead with 40-49% but a margin of 4% or more
60% -- lead with 50-54%
70% -- lead with 55-59%
90% -- lead with 60% or more
[/quote]
It's the first one on Connecticut, and any fresh poll on Connecticut will be welcome. Q, perhaps, in view of the gubernatorial race?
Clinton (D)- 45%
Carson (R)- 36%
Clinton (D)- 48%
Paul (R)- 33%
http://gravismarketing.com/polling-and-market-research/connecticut-polling-data-august-2014/
Hillary Clinton vs. Jeb Bush
(
Hillary Clinton vs. Chris Christie
(
Hillary Clinton vs. Mike Huckabee
(
Hillary Clinton vs. Rand Paul
(
blue, Republican -- red, Democratic
30% -- lead with 40-49% but a margin of 3% or less
40% -- lead with 40-49% but a margin of 4% or more
60% -- lead with 50-54%
70% -- lead with 55-59%
90% -- lead with 60% or more
[/quote]
Title: Re: 2016 Official Polling Map Thread
Post by: eric82oslo on August 11, 2014, 01:49:40 PM
About time to update the database again, now that we've had four new polls released within the past few days, including the very first one from the great state of Connecticut. :) Unfortunately, the pollster behind the Connecticut poll was Gravis, but that's life. One poll is still immensely better than no poll. Actually I'm adding 6 more polls this time, more on that below.
The three other states having been polled again are North Carolina, Arkansas and New Jersey. In the Connecticut poll, Hillary was leading Ben Carson with only 9% (the first time he's ever been tested in a 2016 match-up to my knowledge!), while having a more comfortable 15% lead over Rand Paul.
In Arkansas, we've gotten our 3rd 2016 poll, including the 2nd one from PPP. For once, Hillary was trailing all 5 GOP candidates tested, thus making her average numbers now look much more grim in the state. These are her new, current averages in Arkansas:
Vs Huckabee: R +9.5% (2 polls)
Vs Cruz: R +4%
Vs Bush: Tie (2 polls)
Vs Rand Paul: D +2% (3 polls)
Vs Christie: D +3.3% (3 polls)
This means a 6.5% improvement for Huckabee compared to his previous lead in his home state. Also notice that Cruz was polled for the very first time, thus artificially inflating his numbers a bit compared to the rest.
In North Carolina, we've gotten our very first 2016 poll not conducted by PPP. The 10th NC poll was conducted by Gravis and it included only one Clinton match-up, against Rand Paul. Christie was the previous strongest GOPer in the state, so I'll include the new averages for just Paul and him:
Vs Christie: D +1.25% (8 polls)
Vs Rand Paul: D +4.8% (10 polls)
In other words, no change for this crucial battleground, and Christie's average popularity is still vastly superior to the young libertarian in this state.
Finally we have the latest poll from New Jersey (actually I've added 3 more polls from this state, though 2 of them were released in 2013), a state that hasn't been polled that much after Christie won reelection. This state is still the only case in which I'm including an exit poll (from the governor's election). This new poll was conducted by Quinnipiac - their third NJ poll of the season - and it was also the first to include match-ups with Huckabee and Bush. With the exit poll, this amounted to the 10th 2016 poll in New Jersey, conducted by 6 or 7 different pollsters (I'm not quite sure who conducted the exit poll, perhaps Marist?). The new averages against the 6 GOPers tried and tested in the state now look like this:
Vs Christie: D +8.5% (10 polls)
Vs Bush: D +20%
Vs Rand Paul: D +22% (3 polls)
Vs Huckabee: D +23%
Vs Cruz: D +23%
Vs Paul Ryan: D +25%
In other words, the Republican candidate will be smashed and heart-broken in this most urban of US states unless his name is Christie. Christie improves 1.1% (from -9.6% to the current -8.5%) in his home state from the previous update, but this is mostly due to me adding a couple of more polls from the state which I had previously ignored, from Quinnipiac and Monmouth last year [I just happened to come across them now that I was doing the update].
The entire, updated database to follow in my next post...
PS: With the latest 7 EVs awarded to Hillary from Connecticut - and the previous 61 EVs that just came her way from California and Nevada - Hillary has now reached 268 EVs, just two short of what she would need to secure the electoral college! And that is while more than one third of all states - 18 states + D.C. to be precise - of which 8 & DC are considered heavily Democratic - have still yet to be polled. If we'd award the remaining 139 EVs to the most likely recipient (basically assuming that all the remaining states will vote like they did in 2016), the final outcome would likely look like this:
Hillary: 338 EVs (62.8%) [70 outstanding EVs]
Tailor-made Republican opponent: 200 EVs (37.2%) [69 outstanding EVs]
Title: Re: 2016 Official Polling Map Thread
Post by: eric82oslo on August 11, 2014, 02:14:01 PM
So here it is again, the updated database after my adding of 6 more polls from 4 different states - Connecticut, Arkansas, New Jersey and North Carolina - enjoy. :)
The last few weeks of polling has been looking pretty grim for Hillary. Arkansas for instance, just went from one of Hillary's best red states, to her 4th worst state tested for 2016 (though it's still her 2nd best when it comes to trendline). On a more positive note though, due to California, Connecticut, Nevada and Oregon all having recently been polled for the first time, Hillary's EV collection has skyrocketed to beyond 67% of all awarded EVs.
The total number of state polls included below has now reached 157.
The 2016 poll averages for each state - 32 states right now - and the change from the actual 2012 outcomes. Only the Republican candidate with the best statewide polling included.
Alaska: Hillary vs Jeb Bush: R +7%
+7% D improvement
(Updated on May 14, 2014)
Arizona: Hillary vs Bush: R +1%
+8% D improvement
(Updated on March 6, 2014)
Arkansas: Hillary vs Mike Huckabee: R +9.5%
+14.2% D improvement
(Updated on August 11, 2014)
NEW! California: Hillary vs Rand Paul: D +9%
+14% R improvement
(Updated on August 1, 2014)
Colorado: Hillary vs Paul Ryan: R +3.5%
+8.9% R improvement
Current Republican gain
(Updated on July 29, 2014)
NEW! Connecticut: Hillary vs Ben Carson: D +9%
+8% R improvement
(Updated on August 11, 2014)
Florida: Hillary vs Bush: D +5.8%
+4.9% D improvement
(Updated on July 24, 2014)
Georgia: Hillary vs Christie: R +2%
+6% D improvement
(Updated August 8, 2013)
Iowa: Hillary vs Christie: D +3.9%
+1.9% R improvement
(Updated on July 17, 2014)
Kansas: Hillary vs Bush: R +9%
+13% D improvement
(Updated on February 24, 2014)
Kentucky: Hillary vs Christie/Bush: R +4%
+19% D improvement
(Updated on July 26, 2014)
Louisiana: Hillary vs Huckabee: R +3%
+14% D improvement
(Updated on July 12, 2014)
Maine: Hillary vs Christie: D +8%
+7% R improvement
(Updated on November 13, 2013)
Michigan: Hillary vs Christie: D +6.1%
+3.4% R improvement
(Updated on June 3, 2014)
Minnesota: Hillary vs Tim Pawlenty: D +6%
+2% R improvement
(Updated on June 18, 2014)
Mississippi: Hillary vs Huckabee: R +7%
+4.5% D improvement
(Updated on July 20, 2014)
Montana: Hillary vs Rand Paul: R +13% (Brian Schweitzer vs Rand Paul: R +8%)
+1% D improvement
(Updated on July 23, 2014)
NEW! Nevada: Hillary vs Rand Paul: D +3%
+4% R improvement
(Updated on July 31, 2014)
New Hampshire: Hillary vs Huckabee: D +2.1%
+3.5% R improvement
(Updated on July 17, 2014)
New Jersey: Hillary vs Christie: D +8.5%
+9.3% R improvement
(Updated on August 11, 2014)
New Mexico: Hillary vs Susana Martinez: D +14%
+4% D improvement
(Updated on March 27, 2014)
New York: Hillary vs Christie: D +28%
+0.2% R improvement
(Updated on March 4, 2014)
North Carolina: Hillary vs Christie: D +1.25%
+3.3% D improvement
Current Democratic gain
(Updated on August 11, 2014)
Ohio: Hillary vs Christie: D +6.7%
+3.7% D improvement
(Updated on July 31, 2014)
Oregon: Hillary vs Rand Paul/Huckabee: D +12%
Unchanged from 2012
(Updated on May 30, 2014)
Pennsylvania: Hillary vs Christie: D +3.5%
+1.9% R improvement
(Updated on June 5, 2014)
South Carolina: Hillary vs Marco Rubio: R +7%
+3.5% D improvement
(Updated on November 2, 2013)
Texas: Hillary vs Huckabee: R +8%
+8% D improvement
(Updated on April 18, 2014)
Virginia: Hillary vs Christie: D +3.64%
+0.2% R improvement
(Updated on July 23, 2014)
West Virginia: Hillary vs Bush: R +14%
+13% D improvement
(Updated on October 1, 2013)
Wisconsin: Hillary vs Ryan: D +4.1%
+2.8% R improvement
(Updated on August 5, 2014)
Wyoming: Hillary vs Christie: R +28%
+13% D improvement
(Updated on July 23, 2013)
Average all 32 states: Hillary vs Best Republican: D +0.6%
+2.3% D improvement (from Obama 2012) [projecting a 6.1% victory for Hillary]
That gives us this map right now:
(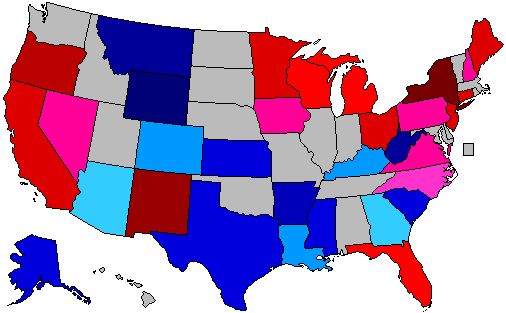 )
)
Red = Democratic lead/trend
Blue = Republican lead/trend
Green = Tied or no trend
Grey = No polling yet
Green = toss up or less than 0.5% lead
20% shade = 0.6-2% lead
30% shade = 2.1-4% lead
40% shade = 4.1-6% lead
50% shade = 6.1-9% lead
60% shade = 9.1-12% lead
70% shade = 12.1-15% lead
80% shade = 15.1-18% lead
90% shade = Above 18.1% lead
In the count of electoral votes, this means the current situation looks like this:
Hillary: 268 EVs (for a total of 18 states)
Best/Tailormade Republican: 131 EVs (for a total of 14 states)
Toss-up: None
No polling: 139 EVs (for a total of 18 states + D.C.)
So far, Hillary has captured a very impressive 67.2% of all EVs awarded, against a disappointing 32.8% EVs for the tailormade Republican.
This is how the Trendline Map looks so far:
( )
)
The states which right now are showing the strongest improvement for the Democratic (Hillary) or the Republican candidate (in 12 out of 32 cases, Christie is that person):
1. Kentucky: D +19%
2. Arkansas: D +14.2%
3. California: R +14%
4. Louisiana: D +14%
5. Kansas: D +13%
6. West Virginia: D +13%
7. Wyoming: D +13%
8. New Jersey: R +9.3%
9. Colorado: R +8.9%
10. Arizona: D +8%
11. Texas: D +8%
12. Connecticut: R +8%
13. Maine: R +7%
14. Alaska: D +7%
15. Georgia: D +6%
16. Florida: D +4.9%
17. Mississippi: D +4.5%
All of these changes (in the 17 states above) are statistically significant, though there are HUGE question marks concerning California.
The whole list of states having been polled till now, going from Democratic stronghold to Republican stronghold:
New York: D +28%
New Mexico: D +14%
Oregon: D +12%
California: D +9%
Connecticut: D +9%
New Jersey: D +8.5%
Maine: D +8%
Ohio: D +6.7%
Currently estimated/projected national average: D +6.1%
Michigan: D +6.1%
Minnesota: D +6%
Florida: D +5.8%
Wisconsin: D +4.1%
Iowa: D +3.9%
Virginia: D +3.6%
Pennsylvania: D +3.5%
Nevada: D +3%
New Hampshire: D +2.1%
North Carolina: D +1.25%
Arizona: R +1%
Georgia: R +2%
Louisiana: R +3%
Colorado: R +3.5%
Kentucky: R +4%
Alaska: R +7%
Mississippi: R +7%
South Carolina: R +7%
Texas: R +8%
Kansas: R +9%
Arkansas: R +9.5%
Montana: R +13%
West Virginia: R +14%
Wyoming: R +28%
The best-tailored Republican candidates in all states polled so far:
1. Chris Christie favoured in 12 of 32 states (for 159 EVs)
2. Rand Paul favoured in 4 states (California, Oregon (shared), Nevada & Montana - for 71 EVs)
3. Mike Huckabee favoured in 6 states (Texas (!), Louisiana (!), Oregon (shared), Arkansas, Mississippi & New Hampshire (!) - for 69 EVs)
4. Jeb Bush favoured in 6 states (Florida, Arizona, Kentucky (!) (shared), Kansas, West Virginia & Alaska - for 62 EVs)
5. Paul Ryan favoured in 2 states (Wisconsin & Colorado - for 19 EVs)
6. Tim Pawlenty favoured in 1 state (Minnesota - for 10 EVs)
7. Marco Rubio favoured in 1 state (South Carolina - for 9 EVs)
8. Ben Carson favoured in 1 state (Connecticut - for 7 EVs)
9. Susana Martinez favoured in 1 state (New Mexico - for 5 EVs)
Current update as of August 11.
The last few weeks of polling has been looking pretty grim for Hillary. Arkansas for instance, just went from one of Hillary's best red states, to her 4th worst state tested for 2016 (though it's still her 2nd best when it comes to trendline). On a more positive note though, due to California, Connecticut, Nevada and Oregon all having recently been polled for the first time, Hillary's EV collection has skyrocketed to beyond 67% of all awarded EVs.
The total number of state polls included below has now reached 157.
The 2016 poll averages for each state - 32 states right now - and the change from the actual 2012 outcomes. Only the Republican candidate with the best statewide polling included.
Alaska: Hillary vs Jeb Bush: R +7%
+7% D improvement
(Updated on May 14, 2014)
Arizona: Hillary vs Bush: R +1%
+8% D improvement
(Updated on March 6, 2014)
Arkansas: Hillary vs Mike Huckabee: R +9.5%
+14.2% D improvement
(Updated on August 11, 2014)
NEW! California: Hillary vs Rand Paul: D +9%
+14% R improvement
(Updated on August 1, 2014)
Colorado: Hillary vs Paul Ryan: R +3.5%
+8.9% R improvement
Current Republican gain
(Updated on July 29, 2014)
NEW! Connecticut: Hillary vs Ben Carson: D +9%
+8% R improvement
(Updated on August 11, 2014)
Florida: Hillary vs Bush: D +5.8%
+4.9% D improvement
(Updated on July 24, 2014)
Georgia: Hillary vs Christie: R +2%
+6% D improvement
(Updated August 8, 2013)
Iowa: Hillary vs Christie: D +3.9%
+1.9% R improvement
(Updated on July 17, 2014)
Kansas: Hillary vs Bush: R +9%
+13% D improvement
(Updated on February 24, 2014)
Kentucky: Hillary vs Christie/Bush: R +4%
+19% D improvement
(Updated on July 26, 2014)
Louisiana: Hillary vs Huckabee: R +3%
+14% D improvement
(Updated on July 12, 2014)
Maine: Hillary vs Christie: D +8%
+7% R improvement
(Updated on November 13, 2013)
Michigan: Hillary vs Christie: D +6.1%
+3.4% R improvement
(Updated on June 3, 2014)
Minnesota: Hillary vs Tim Pawlenty: D +6%
+2% R improvement
(Updated on June 18, 2014)
Mississippi: Hillary vs Huckabee: R +7%
+4.5% D improvement
(Updated on July 20, 2014)
Montana: Hillary vs Rand Paul: R +13% (Brian Schweitzer vs Rand Paul: R +8%)
+1% D improvement
(Updated on July 23, 2014)
NEW! Nevada: Hillary vs Rand Paul: D +3%
+4% R improvement
(Updated on July 31, 2014)
New Hampshire: Hillary vs Huckabee: D +2.1%
+3.5% R improvement
(Updated on July 17, 2014)
New Jersey: Hillary vs Christie: D +8.5%
+9.3% R improvement
(Updated on August 11, 2014)
New Mexico: Hillary vs Susana Martinez: D +14%
+4% D improvement
(Updated on March 27, 2014)
New York: Hillary vs Christie: D +28%
+0.2% R improvement
(Updated on March 4, 2014)
North Carolina: Hillary vs Christie: D +1.25%
+3.3% D improvement
Current Democratic gain
(Updated on August 11, 2014)
Ohio: Hillary vs Christie: D +6.7%
+3.7% D improvement
(Updated on July 31, 2014)
Oregon: Hillary vs Rand Paul/Huckabee: D +12%
Unchanged from 2012
(Updated on May 30, 2014)
Pennsylvania: Hillary vs Christie: D +3.5%
+1.9% R improvement
(Updated on June 5, 2014)
South Carolina: Hillary vs Marco Rubio: R +7%
+3.5% D improvement
(Updated on November 2, 2013)
Texas: Hillary vs Huckabee: R +8%
+8% D improvement
(Updated on April 18, 2014)
Virginia: Hillary vs Christie: D +3.64%
+0.2% R improvement
(Updated on July 23, 2014)
West Virginia: Hillary vs Bush: R +14%
+13% D improvement
(Updated on October 1, 2013)
Wisconsin: Hillary vs Ryan: D +4.1%
+2.8% R improvement
(Updated on August 5, 2014)
Wyoming: Hillary vs Christie: R +28%
+13% D improvement
(Updated on July 23, 2013)
Average all 32 states: Hillary vs Best Republican: D +0.6%
+2.3% D improvement (from Obama 2012) [projecting a 6.1% victory for Hillary]
That gives us this map right now:
(
Red = Democratic lead/trend
Blue = Republican lead/trend
Green = Tied or no trend
Grey = No polling yet
Green = toss up or less than 0.5% lead
20% shade = 0.6-2% lead
30% shade = 2.1-4% lead
40% shade = 4.1-6% lead
50% shade = 6.1-9% lead
60% shade = 9.1-12% lead
70% shade = 12.1-15% lead
80% shade = 15.1-18% lead
90% shade = Above 18.1% lead
In the count of electoral votes, this means the current situation looks like this:
Hillary: 268 EVs (for a total of 18 states)
Best/Tailormade Republican: 131 EVs (for a total of 14 states)
Toss-up: None
No polling: 139 EVs (for a total of 18 states + D.C.)
So far, Hillary has captured a very impressive 67.2% of all EVs awarded, against a disappointing 32.8% EVs for the tailormade Republican.
This is how the Trendline Map looks so far:
(
The states which right now are showing the strongest improvement for the Democratic (Hillary) or the Republican candidate (in 12 out of 32 cases, Christie is that person):
1. Kentucky: D +19%
2. Arkansas: D +14.2%
3. California: R +14%
4. Louisiana: D +14%
5. Kansas: D +13%
6. West Virginia: D +13%
7. Wyoming: D +13%
8. New Jersey: R +9.3%
9. Colorado: R +8.9%
10. Arizona: D +8%
11. Texas: D +8%
12. Connecticut: R +8%
13. Maine: R +7%
14. Alaska: D +7%
15. Georgia: D +6%
16. Florida: D +4.9%
17. Mississippi: D +4.5%
All of these changes (in the 17 states above) are statistically significant, though there are HUGE question marks concerning California.
The whole list of states having been polled till now, going from Democratic stronghold to Republican stronghold:
New York: D +28%
New Mexico: D +14%
Oregon: D +12%
California: D +9%
Connecticut: D +9%
New Jersey: D +8.5%
Maine: D +8%
Ohio: D +6.7%
Currently estimated/projected national average: D +6.1%
Michigan: D +6.1%
Minnesota: D +6%
Florida: D +5.8%
Wisconsin: D +4.1%
Iowa: D +3.9%
Virginia: D +3.6%
Pennsylvania: D +3.5%
Nevada: D +3%
New Hampshire: D +2.1%
North Carolina: D +1.25%
Arizona: R +1%
Georgia: R +2%
Louisiana: R +3%
Colorado: R +3.5%
Kentucky: R +4%
Alaska: R +7%
Mississippi: R +7%
South Carolina: R +7%
Texas: R +8%
Kansas: R +9%
Arkansas: R +9.5%
Montana: R +13%
West Virginia: R +14%
Wyoming: R +28%
The best-tailored Republican candidates in all states polled so far:
1. Chris Christie favoured in 12 of 32 states (for 159 EVs)
2. Rand Paul favoured in 4 states (California, Oregon (shared), Nevada & Montana - for 71 EVs)
3. Mike Huckabee favoured in 6 states (Texas (!), Louisiana (!), Oregon (shared), Arkansas, Mississippi & New Hampshire (!) - for 69 EVs)
4. Jeb Bush favoured in 6 states (Florida, Arizona, Kentucky (!) (shared), Kansas, West Virginia & Alaska - for 62 EVs)
5. Paul Ryan favoured in 2 states (Wisconsin & Colorado - for 19 EVs)
6. Tim Pawlenty favoured in 1 state (Minnesota - for 10 EVs)
7. Marco Rubio favoured in 1 state (South Carolina - for 9 EVs)
8. Ben Carson favoured in 1 state (Connecticut - for 7 EVs)
9. Susana Martinez favoured in 1 state (New Mexico - for 5 EVs)
Current update as of August 11.
Title: Re: 2016 Official Polling Map Thread
Post by: eric82oslo on August 11, 2014, 03:51:31 PM
Updated today, August 11!
To find out which state would be the most likely tipping point state in 2016 based on all the data gathered so far (from 157 individual polls across 32 states), I've worked out this list of states going from likely Democratic to likely Republican (assuming that the non-polled states stay the same as in 2012):
1. D.C. - 3 EVs (still not polled)
2. Hawaii - 7 EVs (accumulated) (still not polled)
3. Vermont - 10 EVs (still not polled)
4. New York - 39 EVs
5. Rhode Island - 43 EVs (still not polled)
6. Maryland - 53 EVs (still not polled)
7. Massachusetts - 64 EVs (still not polled)
8. Delaware - 67 EVs (still not polled)
9. Illinois - 87 EVs (still not polled)
10. Washington - 99 EVs (still not polled)
11. New Mexico - 104 EVs
12. Oregon - 111 EVs
13. California - 166 EVs
14. Connecticut - 173 EVs
15. New Jersey - 187 EVs
16. Maine - 191 EVs
17. Ohio - 209 EVs
18. Michigan - 225 EVs
19. Minnesota - 235 EVs
20. Florida - 264 EVs
21. Wisconsin - 274 EVs - currently the most likely tipping point state
22. Iowa - 280 EVs
23. Virginia - 293 EVs
24. Pennsylvania - 313 EVs
25. Nevada - 319 EVs
26. New Hampshire - 323 EVs
27. North Carolina - 338 EVs
---current red/blue divide---
28. Arizona - 349 EVs
29. Georgia - 365 EVs
30. Louisiana - 373 EVs
31. Colorado - 382 EVs
32. Kentucky - 390 EVs
33. South Carolina - 399 EVs
34. Mississippi - 405 EVs
35. Alaska - 408 EVs
36. Texas - 446 EVs
37. Kansas - 452 EVs
38. Missouri - 462 EVs (still not polled)
39. Arkansas - 468 EVs
40. Indiana - 479 EVs (still not polled)
41. Montana - 482 EVs
42. West Virginia - 487 EVs
43. South Dakota - 490 EVs (still not polled)
44. North Dakota - 493 EVs (still not polled)
45. Tennessee - 504 EVs (still not polled)
46. Nebraska - 509 EVs (still not polled)
47. Alabama - 518 EVs (still not polled)
48. Wyoming - 521 EVs
49. Idaho - 525 EVs (still not polled)
50. Oklahoma - 532 EVs (still not polled)
51. Utah - 538 EVs (still not polled)
Quite a bit of toss-around here since the last update, with California, Arkansas, Nevada and Connecticut having been especially brutally treated. They're all seen as less strong Hillary states now than they were perceived in the previous update. Though it can probably not be underscored enough that Gravis Marketing is the only pollster yet to have polled three of those four state.
Washington, Illinois, Delaware, Missouri, Indiana and Massachusetts would be very interesting to have polled next.
Title: Re: 2016 Official Polling Map Thread
Post by: eric82oslo on August 12, 2014, 03:53:45 PM
PPP has polled Alaska for the 5th time. Hillary trails 4 candidates with between 8% and 14%, while she's far ahead of Palin once again (+6%). The new Alaska averages:
Vs Rand Paul: R +8% (4 polls)
Vs Bush: R +7.5% (4 polls)
Vs Christie: R +5.4% (5 polls)
Vs Huckabee: R +4.3% (3 polls)
Vs Rubio: R +1% (2 polls)
Vs Paul Ryan: R +1%
Vs Palin: D +7% (5 polls)
This means that Rand Paul takes over the GOP crown from Jeb in Alaska, and that the GOP lead in the state is strenghtened by another percentage point, up from +7% to +8%.
There's also a new poll from Rutgers Eagleton Institute of Politics on New Jersey. Hillary leads Christie by 11%, meaning that Hillary's average lead in NJ increases from 8.5% to 8.7%.
The total number of state polls included below has now reached 159.
The 2016 poll averages for each state - 32 states right now - and the change from the actual 2012 outcomes. Only the Republican candidate with the best statewide polling included.
Alaska: Hillary vs Rand Paul: R +8%
+6% D improvement
(Updated on August 12, 2014)
Arizona: Hillary vs Bush: R +1%
+8% D improvement
(Updated on March 6, 2014)
Arkansas: Hillary vs Mike Huckabee: R +9.5%
+14.2% D improvement
(Updated on August 11, 2014)
NEW! California: Hillary vs Rand Paul: D +9%
+14% R improvement
(Updated on August 1, 2014)
Colorado: Hillary vs Paul Ryan: R +3.5%
+8.9% R improvement
Current Republican gain
(Updated on July 29, 2014)
NEW! Connecticut: Hillary vs Ben Carson: D +9%
+8% R improvement
(Updated on August 11, 2014)
Florida: Hillary vs Bush: D +5.8%
+4.9% D improvement
(Updated on July 24, 2014)
Georgia: Hillary vs Christie: R +2%
+6% D improvement
(Updated August 8, 2013)
Iowa: Hillary vs Christie: D +3.9%
+1.9% R improvement
(Updated on July 17, 2014)
Kansas: Hillary vs Bush: R +9%
+13% D improvement
(Updated on February 24, 2014)
Kentucky: Hillary vs Christie/Bush: R +4%
+19% D improvement
(Updated on July 26, 2014)
Louisiana: Hillary vs Huckabee: R +3%
+14% D improvement
(Updated on July 12, 2014)
Maine: Hillary vs Christie: D +8%
+7% R improvement
(Updated on November 13, 2013)
Michigan: Hillary vs Christie: D +6.1%
+3.4% R improvement
(Updated on June 3, 2014)
Minnesota: Hillary vs Tim Pawlenty: D +6%
+2% R improvement
(Updated on June 18, 2014)
Mississippi: Hillary vs Huckabee: R +7%
+4.5% D improvement
(Updated on July 20, 2014)
Montana: Hillary vs Rand Paul: R +13% (Brian Schweitzer vs Rand Paul: R +8%)
+1% D improvement
(Updated on July 23, 2014)
NEW! Nevada: Hillary vs Rand Paul: D +3%
+4% R improvement
(Updated on July 31, 2014)
New Hampshire: Hillary vs Huckabee: D +2.1%
+3.5% R improvement
(Updated on July 17, 2014)
New Jersey: Hillary vs Christie: D +8.7%
+9.1% R improvement
(Updated on August 13, 2014)
New Mexico: Hillary vs Susana Martinez: D +14%
+4% D improvement
(Updated on March 27, 2014)
New York: Hillary vs Christie: D +28%
+0.2% R improvement
(Updated on March 4, 2014)
North Carolina: Hillary vs Christie: D +1.25%
+3.3% D improvement
Current Democratic gain
(Updated on August 11, 2014)
Ohio: Hillary vs Christie: D +6.7%
+3.7% D improvement
(Updated on July 31, 2014)
Oregon: Hillary vs Rand Paul/Huckabee: D +12%
Unchanged from 2012
(Updated on May 30, 2014)
Pennsylvania: Hillary vs Christie: D +3.5%
+1.9% R improvement
(Updated on June 5, 2014)
South Carolina: Hillary vs Marco Rubio: R +7%
+3.5% D improvement
(Updated on November 2, 2013)
Texas: Hillary vs Huckabee: R +8%
+8% D improvement
(Updated on April 18, 2014)
Virginia: Hillary vs Christie: D +3.64%
+0.2% R improvement
(Updated on July 23, 2014)
West Virginia: Hillary vs Bush: R +14%
+13% D improvement
(Updated on October 1, 2013)
Wisconsin: Hillary vs Ryan: D +4.1%
+2.8% R improvement
(Updated on August 5, 2014)
Wyoming: Hillary vs Christie: R +28%
+13% D improvement
(Updated on July 23, 2013)
Average all 32 states: Hillary vs Best Republican: D +0.6%
+2.25% D improvement (from Obama 2012) [projecting a 6.1% victory for Hillary]
Giving us this map:
()
Red = Democratic lead/trend
Blue = Republican lead/trend
Green = Tied or no trend
Grey = No polling yet
Green = toss up or less than 0.5% lead
20% shade = 0.6-2% lead
30% shade = 2.1-4% lead
40% shade = 4.1-6% lead
50% shade = 6.1-9% lead
60% shade = 9.1-12% lead
70% shade = 12.1-15% lead
80% shade = 15.1-18% lead
90% shade = Above 18.1% lead
In the count of electoral votes, the current situation looks like this:
Hillary: 268 EVs (in 18 states)
Best/Tailormade Republican: 131 EVs (in 14 states)
Toss-up: None
No polling: 139 EVs (in 18 states + D.C.)
So far, Hillary has captured an impressive 67.2% of all EVs awarded, against only 32.8% EVs for the tailormade Republican.
This is how the Trendline Map looks so far:
( )
)
The states which right now are showing the strongest improvement for the Democratic (Hillary) or the Republican candidate (in 12 out of 32 cases, Christie is that person):
1. Kentucky: D +19%
2. Arkansas: D +14.2%
3. California: R +14%
4. Louisiana: D +14%
5. Kansas: D +13%
6. West Virginia: D +13%
7. Wyoming: D +13%
8. New Jersey: R +9.1%
9. Colorado: R +8.9%
10. Arizona: D +8%
11. Texas: D +8%
12. Connecticut: R +8%
13. Maine: R +7%
14. Georgia: D +6%
15. Alaska: D +6%
16. Florida: D +4.9%
17. Mississippi: D +4.5%
All of these changes (in the 17 states above) are statistically significant, though there are HUGE question marks concerning California.
The whole list of states having been polled till now, going from Democratic stronghold to Republican stronghold:
New York: D +28%
New Mexico: D +14%
Oregon: D +12%
California: D +9%
Connecticut: D +9%
New Jersey: D +8.7%
Maine: D +8%
Ohio: D +6.7%
Currently estimated/projected national average: D +6.1%
Michigan: D +6.1%
Minnesota: D +6%
Florida: D +5.8%
Wisconsin: D +4.1%
Iowa: D +3.9%
Virginia: D +3.6%
Pennsylvania: D +3.5%
Nevada: D +3%
New Hampshire: D +2.1%
North Carolina: D +1.25%
Arizona: R +1%
Georgia: R +2%
Louisiana: R +3%
Colorado: R +3.5%
Kentucky: R +4%
Mississippi: R +7%
South Carolina: R +7%
Alaska: R +8%
Texas: R +8%
Kansas: R +9%
Arkansas: R +9.5%
Montana: R +13%
West Virginia: R +14%
Wyoming: R +28%
The best-tailored Republican candidates in all states polled so far:
1. Chris Christie favoured in 12 of 32 states (for 159 EVs)
2. Rand Paul favoured in 5 states (California, Oregon (shared), Nevada, Montana & Alaska - for 74 EVs)
3. Mike Huckabee favoured in 6 states (Texas (!), Louisiana (!), Oregon (shared), Arkansas, Mississippi & New Hampshire (!) - for 69 EVs)
4. Jeb Bush favoured in 5 states (Florida, Arizona, Kentucky (!) (shared), Kansas & West Virginia - for 59 EVs)
5. Paul Ryan favoured in 2 states (Wisconsin & Colorado - for 19 EVs)
6. Tim Pawlenty favoured in 1 state (Minnesota - for 10 EVs)
7. Marco Rubio favoured in 1 state (South Carolina - for 9 EVs)
8. Ben Carson favoured in 1 state (Connecticut - for 7 EVs)
9. Susana Martinez favoured in 1 state (New Mexico - for 5 EVs)
Current update as of August 13.
Vs Rand Paul: R +8% (4 polls)
Vs Bush: R +7.5% (4 polls)
Vs Christie: R +5.4% (5 polls)
Vs Huckabee: R +4.3% (3 polls)
Vs Rubio: R +1% (2 polls)
Vs Paul Ryan: R +1%
Vs Palin: D +7% (5 polls)
This means that Rand Paul takes over the GOP crown from Jeb in Alaska, and that the GOP lead in the state is strenghtened by another percentage point, up from +7% to +8%.
There's also a new poll from Rutgers Eagleton Institute of Politics on New Jersey. Hillary leads Christie by 11%, meaning that Hillary's average lead in NJ increases from 8.5% to 8.7%.
The total number of state polls included below has now reached 159.
The 2016 poll averages for each state - 32 states right now - and the change from the actual 2012 outcomes. Only the Republican candidate with the best statewide polling included.
Alaska: Hillary vs Rand Paul: R +8%
+6% D improvement
(Updated on August 12, 2014)
Arizona: Hillary vs Bush: R +1%
+8% D improvement
(Updated on March 6, 2014)
Arkansas: Hillary vs Mike Huckabee: R +9.5%
+14.2% D improvement
(Updated on August 11, 2014)
NEW! California: Hillary vs Rand Paul: D +9%
+14% R improvement
(Updated on August 1, 2014)
Colorado: Hillary vs Paul Ryan: R +3.5%
+8.9% R improvement
Current Republican gain
(Updated on July 29, 2014)
NEW! Connecticut: Hillary vs Ben Carson: D +9%
+8% R improvement
(Updated on August 11, 2014)
Florida: Hillary vs Bush: D +5.8%
+4.9% D improvement
(Updated on July 24, 2014)
Georgia: Hillary vs Christie: R +2%
+6% D improvement
(Updated August 8, 2013)
Iowa: Hillary vs Christie: D +3.9%
+1.9% R improvement
(Updated on July 17, 2014)
Kansas: Hillary vs Bush: R +9%
+13% D improvement
(Updated on February 24, 2014)
Kentucky: Hillary vs Christie/Bush: R +4%
+19% D improvement
(Updated on July 26, 2014)
Louisiana: Hillary vs Huckabee: R +3%
+14% D improvement
(Updated on July 12, 2014)
Maine: Hillary vs Christie: D +8%
+7% R improvement
(Updated on November 13, 2013)
Michigan: Hillary vs Christie: D +6.1%
+3.4% R improvement
(Updated on June 3, 2014)
Minnesota: Hillary vs Tim Pawlenty: D +6%
+2% R improvement
(Updated on June 18, 2014)
Mississippi: Hillary vs Huckabee: R +7%
+4.5% D improvement
(Updated on July 20, 2014)
Montana: Hillary vs Rand Paul: R +13% (Brian Schweitzer vs Rand Paul: R +8%)
+1% D improvement
(Updated on July 23, 2014)
NEW! Nevada: Hillary vs Rand Paul: D +3%
+4% R improvement
(Updated on July 31, 2014)
New Hampshire: Hillary vs Huckabee: D +2.1%
+3.5% R improvement
(Updated on July 17, 2014)
New Jersey: Hillary vs Christie: D +8.7%
+9.1% R improvement
(Updated on August 13, 2014)
New Mexico: Hillary vs Susana Martinez: D +14%
+4% D improvement
(Updated on March 27, 2014)
New York: Hillary vs Christie: D +28%
+0.2% R improvement
(Updated on March 4, 2014)
North Carolina: Hillary vs Christie: D +1.25%
+3.3% D improvement
Current Democratic gain
(Updated on August 11, 2014)
Ohio: Hillary vs Christie: D +6.7%
+3.7% D improvement
(Updated on July 31, 2014)
Oregon: Hillary vs Rand Paul/Huckabee: D +12%
Unchanged from 2012
(Updated on May 30, 2014)
Pennsylvania: Hillary vs Christie: D +3.5%
+1.9% R improvement
(Updated on June 5, 2014)
South Carolina: Hillary vs Marco Rubio: R +7%
+3.5% D improvement
(Updated on November 2, 2013)
Texas: Hillary vs Huckabee: R +8%
+8% D improvement
(Updated on April 18, 2014)
Virginia: Hillary vs Christie: D +3.64%
+0.2% R improvement
(Updated on July 23, 2014)
West Virginia: Hillary vs Bush: R +14%
+13% D improvement
(Updated on October 1, 2013)
Wisconsin: Hillary vs Ryan: D +4.1%
+2.8% R improvement
(Updated on August 5, 2014)
Wyoming: Hillary vs Christie: R +28%
+13% D improvement
(Updated on July 23, 2013)
Average all 32 states: Hillary vs Best Republican: D +0.6%
+2.25% D improvement (from Obama 2012) [projecting a 6.1% victory for Hillary]
Giving us this map:
(
Red = Democratic lead/trend
Blue = Republican lead/trend
Green = Tied or no trend
Grey = No polling yet
Green = toss up or less than 0.5% lead
20% shade = 0.6-2% lead
30% shade = 2.1-4% lead
40% shade = 4.1-6% lead
50% shade = 6.1-9% lead
60% shade = 9.1-12% lead
70% shade = 12.1-15% lead
80% shade = 15.1-18% lead
90% shade = Above 18.1% lead
In the count of electoral votes, the current situation looks like this:
Hillary: 268 EVs (in 18 states)
Best/Tailormade Republican: 131 EVs (in 14 states)
Toss-up: None
No polling: 139 EVs (in 18 states + D.C.)
So far, Hillary has captured an impressive 67.2% of all EVs awarded, against only 32.8% EVs for the tailormade Republican.
This is how the Trendline Map looks so far:
(
The states which right now are showing the strongest improvement for the Democratic (Hillary) or the Republican candidate (in 12 out of 32 cases, Christie is that person):
1. Kentucky: D +19%
2. Arkansas: D +14.2%
3. California: R +14%
4. Louisiana: D +14%
5. Kansas: D +13%
6. West Virginia: D +13%
7. Wyoming: D +13%
8. New Jersey: R +9.1%
9. Colorado: R +8.9%
10. Arizona: D +8%
11. Texas: D +8%
12. Connecticut: R +8%
13. Maine: R +7%
14. Georgia: D +6%
15. Alaska: D +6%
16. Florida: D +4.9%
17. Mississippi: D +4.5%
All of these changes (in the 17 states above) are statistically significant, though there are HUGE question marks concerning California.
The whole list of states having been polled till now, going from Democratic stronghold to Republican stronghold:
New York: D +28%
New Mexico: D +14%
Oregon: D +12%
California: D +9%
Connecticut: D +9%
New Jersey: D +8.7%
Maine: D +8%
Ohio: D +6.7%
Currently estimated/projected national average: D +6.1%
Michigan: D +6.1%
Minnesota: D +6%
Florida: D +5.8%
Wisconsin: D +4.1%
Iowa: D +3.9%
Virginia: D +3.6%
Pennsylvania: D +3.5%
Nevada: D +3%
New Hampshire: D +2.1%
North Carolina: D +1.25%
Arizona: R +1%
Georgia: R +2%
Louisiana: R +3%
Colorado: R +3.5%
Kentucky: R +4%
Mississippi: R +7%
South Carolina: R +7%
Alaska: R +8%
Texas: R +8%
Kansas: R +9%
Arkansas: R +9.5%
Montana: R +13%
West Virginia: R +14%
Wyoming: R +28%
The best-tailored Republican candidates in all states polled so far:
1. Chris Christie favoured in 12 of 32 states (for 159 EVs)
2. Rand Paul favoured in 5 states (California, Oregon (shared), Nevada, Montana & Alaska - for 74 EVs)
3. Mike Huckabee favoured in 6 states (Texas (!), Louisiana (!), Oregon (shared), Arkansas, Mississippi & New Hampshire (!) - for 69 EVs)
4. Jeb Bush favoured in 5 states (Florida, Arizona, Kentucky (!) (shared), Kansas & West Virginia - for 59 EVs)
5. Paul Ryan favoured in 2 states (Wisconsin & Colorado - for 19 EVs)
6. Tim Pawlenty favoured in 1 state (Minnesota - for 10 EVs)
7. Marco Rubio favoured in 1 state (South Carolina - for 9 EVs)
8. Ben Carson favoured in 1 state (Connecticut - for 7 EVs)
9. Susana Martinez favoured in 1 state (New Mexico - for 5 EVs)
Current update as of August 13.
Title: Re: 2016 Official Polling Map Thread
Post by: pbrower2a on August 12, 2014, 08:58:41 PM
PPP, Alaska:
Hillary vs Palin: 46/40 (D +6%)
Hillary vs Huckabee: 39/47 (R +8%)
Hillary vs Bush: 38/47 (R +9%)
Hillary vs Christie: 34/45 (R +11%)
Hillary vs Rand Paul: 36/50 (R +14%)
http://www.publicpolicypolling.com/main/2014/08/alaskans-remain-down-on-palin.html#more
That's a bigger change than the map shows.
Also, Rutgers-Eagleton in New Jersey, with only one binary choice (Christie-Clinton):
Clinton 51%, Christie 40%, rest don't know or someone else.
http://eagletonpoll.rutgers.edu/new-wp/wp-content/uploads/2014/08/release_08-07-14.pdf
No obvious change.
Hillary Clinton vs. Jeb Bush
()
Hillary Clinton vs. Chris Christie
()
Hillary Clinton vs. Mike Huckabee
(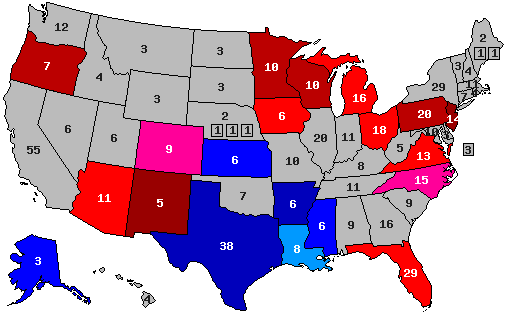 )
)
Hillary Clinton vs. Rand Paul
( )
)
blue, Republican -- red, Democratic
30% -- lead with 40-49% but a margin of 3% or less
40% -- lead with 40-49% but a margin of 4% or more
60% -- lead with 50-54%
70% -- lead with 55-59%
90% -- lead with 60% or more
Hillary vs Palin: 46/40 (D +6%)
Hillary vs Huckabee: 39/47 (R +8%)
Hillary vs Bush: 38/47 (R +9%)
Hillary vs Christie: 34/45 (R +11%)
Hillary vs Rand Paul: 36/50 (R +14%)
http://www.publicpolicypolling.com/main/2014/08/alaskans-remain-down-on-palin.html#more
That's a bigger change than the map shows.
Also, Rutgers-Eagleton in New Jersey, with only one binary choice (Christie-Clinton):
Clinton 51%, Christie 40%, rest don't know or someone else.
http://eagletonpoll.rutgers.edu/new-wp/wp-content/uploads/2014/08/release_08-07-14.pdf
No obvious change.
Hillary Clinton vs. Jeb Bush
(
Hillary Clinton vs. Chris Christie
(
Hillary Clinton vs. Mike Huckabee
(
Hillary Clinton vs. Rand Paul
(
blue, Republican -- red, Democratic
30% -- lead with 40-49% but a margin of 3% or less
40% -- lead with 40-49% but a margin of 4% or more
60% -- lead with 50-54%
70% -- lead with 55-59%
90% -- lead with 60% or more
Title: Re: 2016 Official Polling Map Thread
Post by: pbrower2a on August 12, 2014, 09:12:57 PM
Here's my projection of the 2016 election based upon what I see in Hillary Clinton against the main four potential nominees in current polls. I pay no attention to Ted Cruz, Mario Rubio, or Scott Walker, as they lose by ludicrous margins in all but sure-R states.
Adjusting for Alaska. I ignore Sarah Palin. I also ignore the Gravis poll for Wisconsin because the one binary choice involves Paul Ryan, who has never done well anywhere and is a classic non-choice for the Presidency.
(
Legitimate swing states:
white -- mixed results or any tie
pink -- D lead in all 4 current polls, but swing states in 2008 and 2012
pale blue -- R lead in all current polls, all but one of them under 4%
Fringe swing states:
medium red -- D lead by at least 4% (but under 50%) in all but at most one poll but not swing states in 2008 or 2012
medium blue -- R lead by at least 4% (but under 50%) in all but at most one poll but not swing states in 2008 or 2012
Non-swing states
dark red -- D lead with at least 50% in at least two polls
dark blue -- R lead with at least 50% in at least two polls
Gray -- no polling
Now, based on how states did in 2008 and 2012 and how analogous states do, I fill in the rest:
(
Legitimate swing states:
white -- mixed results or any tie 66
pink -- D lead in all 4 current polls, but swing states in 2008 and 2012, or a split 81
pale blue -- R lead in all current polls, all but one of them under 4% 14
Fringe swing states:
medium red -- D lead by at least 4% (but under 50%) in all but at most one poll but not swing states in 2008 or 2012 50
medium blue -- R lead by at least 4% (but under 50%) in all but at most one poll but not swing states in 2008 or 2012 76
Non-swing states
dark red -- D lead with at least 50% in at least two polls 199
dark blue -- R lead with at least 50% in at least two polls 32
Gray -- I have no idea (no suitable analogues) 12
I see America much less polarized now than it was in 2008 or 2012.
Title: Re: 2016 Official Polling Map Thread
Post by: eric82oslo on August 13, 2014, 09:23:12 AM
PPP will be polling Kansas and North Carolina this weekend.
Still no word out on whether they tested any match ups in Kentucky last weekend.
Still no word out on whether they tested any match ups in Kentucky last weekend.
Title: Re: 2016 Official Polling Map Thread
Post by: eric82oslo on August 13, 2014, 03:47:08 PM
Speaking of which, PPP's Kentucky numbers have been released. :) It's the 6th 2016 poll from the Bluegrass state and 4th from PPP alone, though its their first this year. Hillary leads Cruz & Christie, while trails Huckabee, Bush and Paul. This was the 1st bluegrass poll to include Mike. Here are her new averages:
Vs Bush: R +4.5% (2 polls)
Vs Huckabee: R +3%
Vs Rand Paul: R +2.8% (6 polls)
Vs Christie: R +0.5% (2 polls)
Vs Cruz: D +4% (2 polls)
Vs Rubio: D +7% (2 polls)
That means Bush expands his Kentucky lead from 4% to 4.5%.
The total number of state polls included below has now reached 160.
The 2016 poll averages for each state - 32 states right now - and the change from the actual 2012 outcomes. Only the Republican candidate with the best statewide polling included.
Alaska: Hillary vs Rand Paul: R +8%
+6% D improvement
(Updated on August 12, 2014)
Arizona: Hillary vs Bush: R +1%
+8% D improvement
(Updated on March 6, 2014)
Arkansas: Hillary vs Mike Huckabee: R +9.5%
+14.2% D improvement
(Updated on August 11, 2014)
NEW! California: Hillary vs Rand Paul: D +9%
+14% R improvement
(Updated on August 1, 2014)
Colorado: Hillary vs Paul Ryan: R +3.5%
+8.9% R improvement
Current Republican gain
(Updated on July 29, 2014)
NEW! Connecticut: Hillary vs Ben Carson: D +9%
+8% R improvement
(Updated on August 11, 2014)
Florida: Hillary vs Bush: D +5.8%
+4.9% D improvement
(Updated on July 24, 2014)
Georgia: Hillary vs Christie: R +2%
+6% D improvement
(Updated August 8, 2013)
Iowa: Hillary vs Christie: D +3.9%
+1.9% R improvement
(Updated on July 17, 2014)
Kansas: Hillary vs Bush: R +9%
+13% D improvement
(Updated on February 24, 2014)
Kentucky: Hillary vs Bush: R +4.5%
+18.2% D improvement
(Updated on August 13, 2014)
Louisiana: Hillary vs Huckabee: R +3%
+14% D improvement
(Updated on July 12, 2014)
Maine: Hillary vs Christie: D +8%
+7% R improvement
(Updated on November 13, 2013)
Michigan: Hillary vs Christie: D +6.1%
+3.4% R improvement
(Updated on June 3, 2014)
Minnesota: Hillary vs Tim Pawlenty: D +6%
+2% R improvement
(Updated on June 18, 2014)
Mississippi: Hillary vs Huckabee: R +7%
+4.5% D improvement
(Updated on July 20, 2014)
Montana: Hillary vs Rand Paul: R +13% (Brian Schweitzer vs Rand Paul: R +8%)
+1% D improvement
(Updated on July 23, 2014)
NEW! Nevada: Hillary vs Rand Paul: D +3%
+4% R improvement
(Updated on July 31, 2014)
New Hampshire: Hillary vs Huckabee: D +2.1%
+3.5% R improvement
(Updated on July 17, 2014)
New Jersey: Hillary vs Christie: D +8.7%
+9.1% R improvement
(Updated on August 13, 2014)
New Mexico: Hillary vs Susana Martinez: D +14%
+4% D improvement
(Updated on March 27, 2014)
New York: Hillary vs Christie: D +28%
+0.2% R improvement
(Updated on March 4, 2014)
North Carolina: Hillary vs Christie: D +1.25%
+3.3% D improvement
Current Democratic gain
(Updated on August 11, 2014)
Ohio: Hillary vs Christie: D +6.7%
+3.7% D improvement
(Updated on July 31, 2014)
Oregon: Hillary vs Rand Paul/Huckabee: D +12%
Unchanged from 2012
(Updated on May 30, 2014)
Pennsylvania: Hillary vs Christie: D +3.5%
+1.9% R improvement
(Updated on June 5, 2014)
South Carolina: Hillary vs Marco Rubio: R +7%
+3.5% D improvement
(Updated on November 2, 2013)
Texas: Hillary vs Huckabee: R +8%
+8% D improvement
(Updated on April 18, 2014)
Virginia: Hillary vs Christie: D +3.64%
+0.2% R improvement
(Updated on July 23, 2014)
West Virginia: Hillary vs Bush: R +14%
+13% D improvement
(Updated on October 1, 2013)
Wisconsin: Hillary vs Ryan: D +4.1%
+2.8% R improvement
(Updated on August 5, 2014)
Wyoming: Hillary vs Christie: R +28%
+13% D improvement
(Updated on July 23, 2013)
Average all 32 states: Hillary vs Best Republican: D +0.5%
+2.2% D improvement (from Obama 2012) [projecting a 6.1% victory for Hillary]
Giving us this map:
( )
)
Red = Democratic lead/trend
Blue = Republican lead/trend
Green = Tied or no trend
Grey = No polling yet
Green = toss up or less than 0.5% lead
20% shade = 0.6-2% lead
30% shade = 2.1-4% lead
40% shade = 4.1-6% lead
50% shade = 6.1-9% lead
60% shade = 9.1-12% lead
70% shade = 12.1-15% lead
80% shade = 15.1-18% lead
90% shade = Above 18.1% lead
In the count of electoral votes, the current situation looks like this:
Hillary: 268 EVs (in 18 states)
Best/Tailormade Republican: 131 EVs (in 14 states)
Toss-up: None
No polling: 139 EVs (in 18 states + D.C.)
So far, Hillary has captured an impressive 67.2% of all EVs awarded, against only 32.8% EVs for the tailormade Republican.
This is how the Trendline Map looks so far:
()
The states which right now are showing the strongest improvement for the Democratic (Hillary) or the Republican candidate (in 11 out of 32 cases, Christie is that person):
1. Kentucky: D +18.2%
2. Arkansas: D +14.2%
3. California: R +14%
4. Louisiana: D +14%
5. Kansas: D +13%
6. West Virginia: D +13%
7. Wyoming: D +13%
8. New Jersey: R +9.1%
9. Colorado: R +8.9%
10. Arizona: D +8%
11. Texas: D +8%
12. Connecticut: R +8%
13. Maine: R +7%
14. Georgia: D +6%
15. Alaska: D +6%
16. Florida: D +4.9%
17. Mississippi: D +4.5%
All of these changes (in the 17 states above) are statistically significant, though there are HUGE question marks concerning California.
The whole list of states having been polled till now, going from Democratic stronghold to Republican stronghold:
New York: D +28%
New Mexico: D +14%
Oregon: D +12%
California: D +9%
Connecticut: D +9%
New Jersey: D +8.7%
Maine: D +8%
Ohio: D +6.7%
Michigan: D +6.1%
Currently estimated/projected national average: D +6.1%
Minnesota: D +6%
Florida: D +5.8%
Wisconsin: D +4.1%
Iowa: D +3.9%
Virginia: D +3.6%
Pennsylvania: D +3.5%
Nevada: D +3%
New Hampshire: D +2.1%
North Carolina: D +1.25%
Arizona: R +1%
Georgia: R +2%
Louisiana: R +3%
Colorado: R +3.5%
Kentucky: R +4.5%
Mississippi: R +7%
South Carolina: R +7%
Alaska: R +8%
Texas: R +8%
Kansas: R +9%
Arkansas: R +9.5%
Montana: R +13%
West Virginia: R +14%
Wyoming: R +28%
The best-tailored Republican candidates in all states polled so far:
1. Chris Christie favoured in 11 of 32 states (for 151 EVs)
2. Rand Paul favoured in 5 states (California, Oregon (shared), Nevada, Montana & Alaska - for 74 EVs)
3. Mike Huckabee favoured in 6 states (Texas (!), Louisiana (!), Oregon (shared), Arkansas, Mississippi & New Hampshire (!) - for 69 EVs)
4. Jeb Bush favoured in 5 states (Florida, Arizona, Kentucky (!), Kansas & West Virginia - for 59 EVs)
5. Paul Ryan favoured in 2 states (Wisconsin & Colorado - for 19 EVs)
6. Tim Pawlenty favoured in 1 state (Minnesota - for 10 EVs)
7. Marco Rubio favoured in 1 state (South Carolina - for 9 EVs)
8. Ben Carson favoured in 1 state (Connecticut - for 7 EVs)
9. Susana Martinez favoured in 1 state (New Mexico - for 5 EVs)
Current update as of August 13.
Vs Bush: R +4.5% (2 polls)
Vs Huckabee: R +3%
Vs Rand Paul: R +2.8% (6 polls)
Vs Christie: R +0.5% (2 polls)
Vs Cruz: D +4% (2 polls)
Vs Rubio: D +7% (2 polls)
That means Bush expands his Kentucky lead from 4% to 4.5%.
The total number of state polls included below has now reached 160.
The 2016 poll averages for each state - 32 states right now - and the change from the actual 2012 outcomes. Only the Republican candidate with the best statewide polling included.
Alaska: Hillary vs Rand Paul: R +8%
+6% D improvement
(Updated on August 12, 2014)
Arizona: Hillary vs Bush: R +1%
+8% D improvement
(Updated on March 6, 2014)
Arkansas: Hillary vs Mike Huckabee: R +9.5%
+14.2% D improvement
(Updated on August 11, 2014)
NEW! California: Hillary vs Rand Paul: D +9%
+14% R improvement
(Updated on August 1, 2014)
Colorado: Hillary vs Paul Ryan: R +3.5%
+8.9% R improvement
Current Republican gain
(Updated on July 29, 2014)
NEW! Connecticut: Hillary vs Ben Carson: D +9%
+8% R improvement
(Updated on August 11, 2014)
Florida: Hillary vs Bush: D +5.8%
+4.9% D improvement
(Updated on July 24, 2014)
Georgia: Hillary vs Christie: R +2%
+6% D improvement
(Updated August 8, 2013)
Iowa: Hillary vs Christie: D +3.9%
+1.9% R improvement
(Updated on July 17, 2014)
Kansas: Hillary vs Bush: R +9%
+13% D improvement
(Updated on February 24, 2014)
Kentucky: Hillary vs Bush: R +4.5%
+18.2% D improvement
(Updated on August 13, 2014)
Louisiana: Hillary vs Huckabee: R +3%
+14% D improvement
(Updated on July 12, 2014)
Maine: Hillary vs Christie: D +8%
+7% R improvement
(Updated on November 13, 2013)
Michigan: Hillary vs Christie: D +6.1%
+3.4% R improvement
(Updated on June 3, 2014)
Minnesota: Hillary vs Tim Pawlenty: D +6%
+2% R improvement
(Updated on June 18, 2014)
Mississippi: Hillary vs Huckabee: R +7%
+4.5% D improvement
(Updated on July 20, 2014)
Montana: Hillary vs Rand Paul: R +13% (Brian Schweitzer vs Rand Paul: R +8%)
+1% D improvement
(Updated on July 23, 2014)
NEW! Nevada: Hillary vs Rand Paul: D +3%
+4% R improvement
(Updated on July 31, 2014)
New Hampshire: Hillary vs Huckabee: D +2.1%
+3.5% R improvement
(Updated on July 17, 2014)
New Jersey: Hillary vs Christie: D +8.7%
+9.1% R improvement
(Updated on August 13, 2014)
New Mexico: Hillary vs Susana Martinez: D +14%
+4% D improvement
(Updated on March 27, 2014)
New York: Hillary vs Christie: D +28%
+0.2% R improvement
(Updated on March 4, 2014)
North Carolina: Hillary vs Christie: D +1.25%
+3.3% D improvement
Current Democratic gain
(Updated on August 11, 2014)
Ohio: Hillary vs Christie: D +6.7%
+3.7% D improvement
(Updated on July 31, 2014)
Oregon: Hillary vs Rand Paul/Huckabee: D +12%
Unchanged from 2012
(Updated on May 30, 2014)
Pennsylvania: Hillary vs Christie: D +3.5%
+1.9% R improvement
(Updated on June 5, 2014)
South Carolina: Hillary vs Marco Rubio: R +7%
+3.5% D improvement
(Updated on November 2, 2013)
Texas: Hillary vs Huckabee: R +8%
+8% D improvement
(Updated on April 18, 2014)
Virginia: Hillary vs Christie: D +3.64%
+0.2% R improvement
(Updated on July 23, 2014)
West Virginia: Hillary vs Bush: R +14%
+13% D improvement
(Updated on October 1, 2013)
Wisconsin: Hillary vs Ryan: D +4.1%
+2.8% R improvement
(Updated on August 5, 2014)
Wyoming: Hillary vs Christie: R +28%
+13% D improvement
(Updated on July 23, 2013)
Average all 32 states: Hillary vs Best Republican: D +0.5%
+2.2% D improvement (from Obama 2012) [projecting a 6.1% victory for Hillary]
Giving us this map:
(
Red = Democratic lead/trend
Blue = Republican lead/trend
Green = Tied or no trend
Grey = No polling yet
Green = toss up or less than 0.5% lead
20% shade = 0.6-2% lead
30% shade = 2.1-4% lead
40% shade = 4.1-6% lead
50% shade = 6.1-9% lead
60% shade = 9.1-12% lead
70% shade = 12.1-15% lead
80% shade = 15.1-18% lead
90% shade = Above 18.1% lead
In the count of electoral votes, the current situation looks like this:
Hillary: 268 EVs (in 18 states)
Best/Tailormade Republican: 131 EVs (in 14 states)
Toss-up: None
No polling: 139 EVs (in 18 states + D.C.)
So far, Hillary has captured an impressive 67.2% of all EVs awarded, against only 32.8% EVs for the tailormade Republican.
This is how the Trendline Map looks so far:
(
The states which right now are showing the strongest improvement for the Democratic (Hillary) or the Republican candidate (in 11 out of 32 cases, Christie is that person):
1. Kentucky: D +18.2%
2. Arkansas: D +14.2%
3. California: R +14%
4. Louisiana: D +14%
5. Kansas: D +13%
6. West Virginia: D +13%
7. Wyoming: D +13%
8. New Jersey: R +9.1%
9. Colorado: R +8.9%
10. Arizona: D +8%
11. Texas: D +8%
12. Connecticut: R +8%
13. Maine: R +7%
14. Georgia: D +6%
15. Alaska: D +6%
16. Florida: D +4.9%
17. Mississippi: D +4.5%
All of these changes (in the 17 states above) are statistically significant, though there are HUGE question marks concerning California.
The whole list of states having been polled till now, going from Democratic stronghold to Republican stronghold:
New York: D +28%
New Mexico: D +14%
Oregon: D +12%
California: D +9%
Connecticut: D +9%
New Jersey: D +8.7%
Maine: D +8%
Ohio: D +6.7%
Michigan: D +6.1%
Currently estimated/projected national average: D +6.1%
Minnesota: D +6%
Florida: D +5.8%
Wisconsin: D +4.1%
Iowa: D +3.9%
Virginia: D +3.6%
Pennsylvania: D +3.5%
Nevada: D +3%
New Hampshire: D +2.1%
North Carolina: D +1.25%
Arizona: R +1%
Georgia: R +2%
Louisiana: R +3%
Colorado: R +3.5%
Kentucky: R +4.5%
Mississippi: R +7%
South Carolina: R +7%
Alaska: R +8%
Texas: R +8%
Kansas: R +9%
Arkansas: R +9.5%
Montana: R +13%
West Virginia: R +14%
Wyoming: R +28%
The best-tailored Republican candidates in all states polled so far:
1. Chris Christie favoured in 11 of 32 states (for 151 EVs)
2. Rand Paul favoured in 5 states (California, Oregon (shared), Nevada, Montana & Alaska - for 74 EVs)
3. Mike Huckabee favoured in 6 states (Texas (!), Louisiana (!), Oregon (shared), Arkansas, Mississippi & New Hampshire (!) - for 69 EVs)
4. Jeb Bush favoured in 5 states (Florida, Arizona, Kentucky (!), Kansas & West Virginia - for 59 EVs)
5. Paul Ryan favoured in 2 states (Wisconsin & Colorado - for 19 EVs)
6. Tim Pawlenty favoured in 1 state (Minnesota - for 10 EVs)
7. Marco Rubio favoured in 1 state (South Carolina - for 9 EVs)
8. Ben Carson favoured in 1 state (Connecticut - for 7 EVs)
9. Susana Martinez favoured in 1 state (New Mexico - for 5 EVs)
Current update as of August 13.
Title: Re: 2016 Official Polling Map Thread
Post by: pbrower2a on August 13, 2014, 06:59:08 PM
PPP, Kentucky.
Paul: 49% --- Clinton: 43%
Bush: 48% --- Clinton 43%
Huckabee: 47% --- Clinton: 44%
Clinton 44% --- Christie 41%
Clinton 46% --- Cruz 41%
http://www.publicpolicypolling.com/main/2014/08/kentucky-miscellany.html
For a state that Republicans have won by margins of 22% (2012), 16% (2008), 20% (2004), and 15% (2000) in the last five Presidential elections, these results show the prospect of a Republican nominee winning Kentucky, but not very impressively. Of course, 3% means the same as 30% in a winner-take-all election... but this bodes ill for a Republican nominee winning such states as Georgia, Indiana, Missouri, or North Carolina. A 6% lead for Rand Paul in Kentucky shows how weak his candidacy would be nationwide.
Oddity: Republicans have not won the Presidency without Kentucky since 1952.
Hillary Clinton vs. Jeb Bush
()
Hillary Clinton vs. Chris Christie
( )
)
Hillary Clinton vs. Mike Huckabee
( )
)
Hillary Clinton vs. Rand Paul
()
blue, Republican -- red, Democratic
30% -- lead with 40-49% but a margin of 3% or less
40% -- lead with 40-49% but a margin of 4% or more
60% -- lead with 50-54%
70% -- lead with 55-59%
90% -- lead with 60% or more
Paul: 49% --- Clinton: 43%
Bush: 48% --- Clinton 43%
Huckabee: 47% --- Clinton: 44%
Clinton 44% --- Christie 41%
Clinton 46% --- Cruz 41%
http://www.publicpolicypolling.com/main/2014/08/kentucky-miscellany.html
For a state that Republicans have won by margins of 22% (2012), 16% (2008), 20% (2004), and 15% (2000) in the last five Presidential elections, these results show the prospect of a Republican nominee winning Kentucky, but not very impressively. Of course, 3% means the same as 30% in a winner-take-all election... but this bodes ill for a Republican nominee winning such states as Georgia, Indiana, Missouri, or North Carolina. A 6% lead for Rand Paul in Kentucky shows how weak his candidacy would be nationwide.
Oddity: Republicans have not won the Presidency without Kentucky since 1952.
Hillary Clinton vs. Jeb Bush
(
Hillary Clinton vs. Chris Christie
(
Hillary Clinton vs. Mike Huckabee
(
Hillary Clinton vs. Rand Paul
(
blue, Republican -- red, Democratic
30% -- lead with 40-49% but a margin of 3% or less
40% -- lead with 40-49% but a margin of 4% or more
60% -- lead with 50-54%
70% -- lead with 55-59%
90% -- lead with 60% or more
Title: Re: 2016 Official Polling Map Thread
Post by: pbrower2a on August 13, 2014, 07:07:45 PM
Here's my projection of the 2016 election based upon what I see in Hillary Clinton against the main four potential nominees in current polls. I pay no attention to Ted Cruz, Mario Rubio, or Scott Walker, as they lose by ludicrous margins in all but sure-R states.
I don't really like to change this map more than once a day, but Kentucky results so compel me. The most recent PPP polls (1) supplant one Gravis poll, and (2) show mixed results with Christie slipping behind Hillary Clinton. Kentucky becomes a legitimate swing state, something that the GOP will be unable to afford. Missouri is more similar to Kentucky than to Arkansas, so Missouri shows up as a legitimate swing state again.
(
Legitimate swing states:
white -- mixed results or any tie
pink -- D lead in all 4 current polls, but swing states in 2008 and 2012
pale blue -- R lead in all current polls, all but one of them under 4%
Fringe swing states:
medium red -- D lead by at least 4% (but under 50%) in all but at most one poll but not swing states in 2008 or 2012
medium blue -- R lead by at least 4% (but under 50%) in all but at most one poll but not swing states in 2008 or 2012
Non-swing states
dark red -- D lead with at least 50% in at least two polls
dark blue -- R lead with at least 50% in at least two polls
Gray -- no polling
Now, based on how states did in 2008 and 2012 and how analogous states do, I fill in the rest:
(
Legitimate swing states:
white -- mixed results or any tie 66
pink -- D lead in all 4 current polls, but swing states in 2008 and 2012, or a split 81
pale blue -- R lead in all current polls, all but one of them under 4% 14
Fringe swing states:
medium red -- D lead by at least 4% (but under 50%) in all but at most one poll but not swing states in 2008 or 2012 50
medium blue -- R lead by at least 4% (but under 50%) in all but at most one poll but not swing states in 2008 or 2012 76
Non-swing states
dark red -- D lead with at least 50% in at least two polls 199
dark blue -- R lead with at least 50% in at least two polls 32
Gray -- I have no idea (no suitable analogues) 12
I see America much less polarized now than it was in 2008 or 2012.
Title: Re: 2016 Official Polling Map Thread
Post by: pbrower2a on August 20, 2014, 07:12:50 AM
Quote
Looking ahead to the 2016 presidential election, Democrat Hillary Clinton keeps Florida's critical 29 electoral college votes blue if she is opposed by a resurrected Mitt Romney. But Romney turns Florida red if he is opposed by Democrat Joe Biden. This is consistent with previous WFLA-TV polling, which shows that Clinton defeats each and every high-profile Republican in an election today, holding the state for the Democrats, but Biden loses to each and every high-profile Republican today. 270 electoral college votes are needed to win the White House; Florida alone accounts for 11% of the total needed.
http://www.surveyusa.com/client/PollReport.aspx?g=50582fcd-fbd1-4015-8068-45d66cc1cbf8
This is consistent with Hillary Clinton winning Florida against everyone but Jeb Bush, Jeb possibly winning solely due to the Favorite Son effect.
Title: Re: 2016 Official Polling Map Thread
Post by: pbrower2a on August 20, 2014, 01:31:46 PM
PPP, North Carolina.
Clinton 45%
Huckabee 44%
Clinton 46%
Bush 42%
Clinton 47%
Paul 42%
Clinton 47%
Cruz 41%
Clinton 45%
Christie 38%
http://www.publicpolicypolling.com/pdf/2014/PPP_Release_NC_8201205.pdf
North Carolina is a must-win state for any Republican nominee. Republicans have not won a Presidential election without North Carolina since 1956, when the South was the most D part of the US and North Carolina was decidedly D at practically every level.
PPP frequently polls North Carolina.
Jesse Helms must be rolling in his grave.
Hillary Clinton vs. Jeb Bush
( )
)
Hillary Clinton vs. Chris Christie
(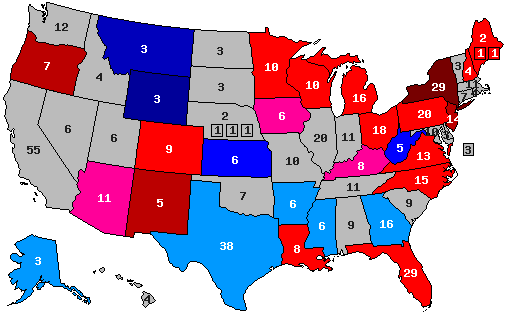 )
)
Hillary Clinton vs. Mike Huckabee
()
Hillary Clinton vs. Rand Paul
()
blue, Republican -- red, Democratic
30% -- lead with 40-49% but a margin of 3% or less
40% -- lead with 40-49% but a margin of 4% or more
60% -- lead with 50-54%
70% -- lead with 55-59%
90% -- lead with 60% or more
Clinton 45%
Huckabee 44%
Clinton 46%
Bush 42%
Clinton 47%
Paul 42%
Clinton 47%
Cruz 41%
Clinton 45%
Christie 38%
http://www.publicpolicypolling.com/pdf/2014/PPP_Release_NC_8201205.pdf
North Carolina is a must-win state for any Republican nominee. Republicans have not won a Presidential election without North Carolina since 1956, when the South was the most D part of the US and North Carolina was decidedly D at practically every level.
PPP frequently polls North Carolina.
Jesse Helms must be rolling in his grave.
Hillary Clinton vs. Jeb Bush
(
Hillary Clinton vs. Chris Christie
(
Hillary Clinton vs. Mike Huckabee
(
Hillary Clinton vs. Rand Paul
(
blue, Republican -- red, Democratic
30% -- lead with 40-49% but a margin of 3% or less
40% -- lead with 40-49% but a margin of 4% or more
60% -- lead with 50-54%
70% -- lead with 55-59%
90% -- lead with 60% or more
Title: Re: 2016 Official Polling Map Thread
Post by: eric82oslo on August 20, 2014, 04:16:39 PM
And we have the 12th (!) 2016 poll from North Carolina already, including the 10th from PPP alone. This one has some really great news for Hillary, as she easily beats all opponents sans Huckabee. Hillary's new NC average leads are thus now:
Vs Christie: D +1.6% (10 polls)
Vs Bush: D +2% (10 polls)
Vs Huckabee: D +4.2% (6 polls)
Vs Rand Paul: D +4.75% (12 polls)
Vs Rubio: D +7%
Vs Cruz: D +8% (4 polls)
Thus Hillary expands her NC lead by 0.4%, up from 1.2% to 1.6%, while Jeb is narrowing in on Christie.
The new Florida poll pitting Romney against Hillary, doesn't change anything in that state. Jeb is still the GOPer to beat there.
The total number of state polls included below has now reached 162.
The 2016 poll averages for each state - 32 states right now - and the change from the actual 2012 outcomes. Only the Republican candidate with the best statewide polling included.
Alaska: Hillary vs Rand Paul: R +8%
+6% D improvement
(Updated on August 12, 2014)
Arizona: Hillary vs Bush: R +1%
+8% D improvement
(Updated on March 6, 2014)
Arkansas: Hillary vs Mike Huckabee: R +9.5%
+14.2% D improvement
(Updated on August 11, 2014)
NEW! California: Hillary vs Rand Paul: D +9%
+14% R improvement
(Updated on August 1, 2014)
Colorado: Hillary vs Paul Ryan: R +3.5%
+8.9% R improvement
Current Republican gain
(Updated on July 29, 2014)
NEW! Connecticut: Hillary vs Ben Carson: D +9%
+8% R improvement
(Updated on August 11, 2014)
Florida: Hillary vs Bush: D +5.8%
+4.9% D improvement
(Updated on August 20, 2014)
Georgia: Hillary vs Christie: R +2%
+6% D improvement
(Updated August 8, 2013)
Iowa: Hillary vs Christie: D +3.9%
+1.9% R improvement
(Updated on July 17, 2014)
Kansas: Hillary vs Bush: R +9%
+13% D improvement
(Updated on February 24, 2014)
Kentucky: Hillary vs Bush: R +4.5%
+18.2% D improvement
(Updated on August 13, 2014)
Louisiana: Hillary vs Huckabee: R +3%
+14% D improvement
(Updated on July 12, 2014)
Maine: Hillary vs Christie: D +8%
+7% R improvement
(Updated on November 13, 2013)
Michigan: Hillary vs Christie: D +6.1%
+3.4% R improvement
(Updated on June 3, 2014)
Minnesota: Hillary vs Tim Pawlenty: D +6%
+2% R improvement
(Updated on June 18, 2014)
Mississippi: Hillary vs Huckabee: R +7%
+4.5% D improvement
(Updated on July 20, 2014)
Montana: Hillary vs Rand Paul: R +13% (Brian Schweitzer vs Rand Paul: R +8%)
+1% D improvement
(Updated on July 23, 2014)
NEW! Nevada: Hillary vs Rand Paul: D +3%
+4% R improvement
(Updated on July 31, 2014)
New Hampshire: Hillary vs Huckabee: D +2.1%
+3.5% R improvement
(Updated on July 17, 2014)
New Jersey: Hillary vs Christie: D +8.7%
+9.1% R improvement
(Updated on August 13, 2014)
New Mexico: Hillary vs Susana Martinez: D +14%
+4% D improvement
(Updated on March 27, 2014)
New York: Hillary vs Christie: D +28%
+0.2% R improvement
(Updated on March 4, 2014)
North Carolina: Hillary vs Christie: D +1.6%
+3.6% D improvement
Current Democratic gain
(Updated on August 20, 2014)
Ohio: Hillary vs Christie: D +6.7%
+3.7% D improvement
(Updated on July 31, 2014)
Oregon: Hillary vs Rand Paul/Huckabee: D +12%
Unchanged from 2012
(Updated on May 30, 2014)
Pennsylvania: Hillary vs Christie: D +3.5%
+1.9% R improvement
(Updated on June 5, 2014)
South Carolina: Hillary vs Marco Rubio: R +7%
+3.5% D improvement
(Updated on November 2, 2013)
Texas: Hillary vs Huckabee: R +8%
+8% D improvement
(Updated on April 18, 2014)
Virginia: Hillary vs Christie: D +3.64%
+0.2% R improvement
(Updated on July 23, 2014)
West Virginia: Hillary vs Bush: R +14%
+13% D improvement
(Updated on October 1, 2013)
Wisconsin: Hillary vs Ryan: D +4.1%
+2.8% R improvement
(Updated on August 5, 2014)
Wyoming: Hillary vs Christie: R +28%
+13% D improvement
(Updated on July 23, 2013)
Average all 32 states: Hillary vs Best Republican: D +0.6%
+2.3% D improvement (from Obama 2012) [projecting a 6.1% victory for Hillary]
Giving us this map:
()
Red = Democratic lead/trend
Blue = Republican lead/trend
Green = Tied or no trend
Grey = No polling yet
Green = toss up or less than 0.5% lead
20% shade = 0.6-2% lead
30% shade = 2.1-4% lead
40% shade = 4.1-6% lead
50% shade = 6.1-9% lead
60% shade = 9.1-12% lead
70% shade = 12.1-15% lead
80% shade = 15.1-18% lead
90% shade = Above 18.1% lead
In the count of electoral votes, the current situation looks like this:
Hillary: 268 EVs (in 18 states)
Best/Tailormade Republican: 131 EVs (in 14 states)
Toss-up: None
No polling: 139 EVs (in 18 states + D.C.)
So far, Hillary has captured an impressive 67.2% of all EVs awarded, against only 32.8% EVs for the tailormade Republican.
This is how the Trendline Map looks so far:
()
The states which right now are showing the strongest improvement for the Democratic (Hillary) or the Republican candidate (in 11 out of 32 cases, Christie is that person):
1. Kentucky: D +18.2%
2. Arkansas: D +14.2%
3. California: R +14%
4. Louisiana: D +14%
5. Kansas: D +13%
6. West Virginia: D +13%
7. Wyoming: D +13%
8. New Jersey: R +9.1%
9. Colorado: R +8.9%
10. Arizona: D +8%
11. Texas: D +8%
12. Connecticut: R +8%
13. Maine: R +7%
14. Georgia: D +6%
15. Alaska: D +6%
16. Florida: D +4.9%
17. Mississippi: D +4.5%
All of these changes (in the 17 states above) are statistically significant, though there are HUGE question marks concerning California.
The whole list of states having been polled till now, going from Democratic stronghold to Republican stronghold:
New York: D +28%
New Mexico: D +14%
Oregon: D +12%
California: D +9%
Connecticut: D +9%
New Jersey: D +8.7%
Maine: D +8%
Ohio: D +6.7%
Michigan: D +6.1%
Currently estimated/projected national average: D +6.1%
Minnesota: D +6%
Florida: D +5.8%
Wisconsin: D +4.1%
Iowa: D +3.9%
Virginia: D +3.6%
Pennsylvania: D +3.5%
Nevada: D +3%
New Hampshire: D +2.1%
North Carolina: D +1.6%
Arizona: R +1%
Georgia: R +2%
Louisiana: R +3%
Colorado: R +3.5%
Kentucky: R +4.5%
Mississippi: R +7%
South Carolina: R +7%
Alaska: R +8%
Texas: R +8%
Kansas: R +9%
Arkansas: R +9.5%
Montana: R +13%
West Virginia: R +14%
Wyoming: R +28%
The best-tailored Republican candidates in all states polled so far:
1. Chris Christie favoured in 11 of 32 states (for 151 EVs)
2. Rand Paul favoured in 5 states (California, Oregon (shared), Nevada, Montana & Alaska - for 74 EVs)
3. Mike Huckabee favoured in 6 states (Texas (!), Louisiana (!), Oregon (shared), Arkansas, Mississippi & New Hampshire (!) - for 69 EVs)
4. Jeb Bush favoured in 5 states (Florida, Arizona, Kentucky (!), Kansas & West Virginia - for 59 EVs)
5. Paul Ryan favoured in 2 states (Wisconsin & Colorado - for 19 EVs)
6. Tim Pawlenty favoured in 1 state (Minnesota - for 10 EVs)
7. Marco Rubio favoured in 1 state (South Carolina - for 9 EVs)
8. Ben Carson favoured in 1 state (Connecticut - for 7 EVs)
9. Susana Martinez favoured in 1 state (New Mexico - for 5 EVs)
Current update as of August 20.
Vs Christie: D +1.6% (10 polls)
Vs Bush: D +2% (10 polls)
Vs Huckabee: D +4.2% (6 polls)
Vs Rand Paul: D +4.75% (12 polls)
Vs Rubio: D +7%
Vs Cruz: D +8% (4 polls)
Thus Hillary expands her NC lead by 0.4%, up from 1.2% to 1.6%, while Jeb is narrowing in on Christie.
The new Florida poll pitting Romney against Hillary, doesn't change anything in that state. Jeb is still the GOPer to beat there.
The total number of state polls included below has now reached 162.
The 2016 poll averages for each state - 32 states right now - and the change from the actual 2012 outcomes. Only the Republican candidate with the best statewide polling included.
Alaska: Hillary vs Rand Paul: R +8%
+6% D improvement
(Updated on August 12, 2014)
Arizona: Hillary vs Bush: R +1%
+8% D improvement
(Updated on March 6, 2014)
Arkansas: Hillary vs Mike Huckabee: R +9.5%
+14.2% D improvement
(Updated on August 11, 2014)
NEW! California: Hillary vs Rand Paul: D +9%
+14% R improvement
(Updated on August 1, 2014)
Colorado: Hillary vs Paul Ryan: R +3.5%
+8.9% R improvement
Current Republican gain
(Updated on July 29, 2014)
NEW! Connecticut: Hillary vs Ben Carson: D +9%
+8% R improvement
(Updated on August 11, 2014)
Florida: Hillary vs Bush: D +5.8%
+4.9% D improvement
(Updated on August 20, 2014)
Georgia: Hillary vs Christie: R +2%
+6% D improvement
(Updated August 8, 2013)
Iowa: Hillary vs Christie: D +3.9%
+1.9% R improvement
(Updated on July 17, 2014)
Kansas: Hillary vs Bush: R +9%
+13% D improvement
(Updated on February 24, 2014)
Kentucky: Hillary vs Bush: R +4.5%
+18.2% D improvement
(Updated on August 13, 2014)
Louisiana: Hillary vs Huckabee: R +3%
+14% D improvement
(Updated on July 12, 2014)
Maine: Hillary vs Christie: D +8%
+7% R improvement
(Updated on November 13, 2013)
Michigan: Hillary vs Christie: D +6.1%
+3.4% R improvement
(Updated on June 3, 2014)
Minnesota: Hillary vs Tim Pawlenty: D +6%
+2% R improvement
(Updated on June 18, 2014)
Mississippi: Hillary vs Huckabee: R +7%
+4.5% D improvement
(Updated on July 20, 2014)
Montana: Hillary vs Rand Paul: R +13% (Brian Schweitzer vs Rand Paul: R +8%)
+1% D improvement
(Updated on July 23, 2014)
NEW! Nevada: Hillary vs Rand Paul: D +3%
+4% R improvement
(Updated on July 31, 2014)
New Hampshire: Hillary vs Huckabee: D +2.1%
+3.5% R improvement
(Updated on July 17, 2014)
New Jersey: Hillary vs Christie: D +8.7%
+9.1% R improvement
(Updated on August 13, 2014)
New Mexico: Hillary vs Susana Martinez: D +14%
+4% D improvement
(Updated on March 27, 2014)
New York: Hillary vs Christie: D +28%
+0.2% R improvement
(Updated on March 4, 2014)
North Carolina: Hillary vs Christie: D +1.6%
+3.6% D improvement
Current Democratic gain
(Updated on August 20, 2014)
Ohio: Hillary vs Christie: D +6.7%
+3.7% D improvement
(Updated on July 31, 2014)
Oregon: Hillary vs Rand Paul/Huckabee: D +12%
Unchanged from 2012
(Updated on May 30, 2014)
Pennsylvania: Hillary vs Christie: D +3.5%
+1.9% R improvement
(Updated on June 5, 2014)
South Carolina: Hillary vs Marco Rubio: R +7%
+3.5% D improvement
(Updated on November 2, 2013)
Texas: Hillary vs Huckabee: R +8%
+8% D improvement
(Updated on April 18, 2014)
Virginia: Hillary vs Christie: D +3.64%
+0.2% R improvement
(Updated on July 23, 2014)
West Virginia: Hillary vs Bush: R +14%
+13% D improvement
(Updated on October 1, 2013)
Wisconsin: Hillary vs Ryan: D +4.1%
+2.8% R improvement
(Updated on August 5, 2014)
Wyoming: Hillary vs Christie: R +28%
+13% D improvement
(Updated on July 23, 2013)
Average all 32 states: Hillary vs Best Republican: D +0.6%
+2.3% D improvement (from Obama 2012) [projecting a 6.1% victory for Hillary]
Giving us this map:
(
Red = Democratic lead/trend
Blue = Republican lead/trend
Green = Tied or no trend
Grey = No polling yet
Green = toss up or less than 0.5% lead
20% shade = 0.6-2% lead
30% shade = 2.1-4% lead
40% shade = 4.1-6% lead
50% shade = 6.1-9% lead
60% shade = 9.1-12% lead
70% shade = 12.1-15% lead
80% shade = 15.1-18% lead
90% shade = Above 18.1% lead
In the count of electoral votes, the current situation looks like this:
Hillary: 268 EVs (in 18 states)
Best/Tailormade Republican: 131 EVs (in 14 states)
Toss-up: None
No polling: 139 EVs (in 18 states + D.C.)
So far, Hillary has captured an impressive 67.2% of all EVs awarded, against only 32.8% EVs for the tailormade Republican.
This is how the Trendline Map looks so far:
(
The states which right now are showing the strongest improvement for the Democratic (Hillary) or the Republican candidate (in 11 out of 32 cases, Christie is that person):
1. Kentucky: D +18.2%
2. Arkansas: D +14.2%
3. California: R +14%
4. Louisiana: D +14%
5. Kansas: D +13%
6. West Virginia: D +13%
7. Wyoming: D +13%
8. New Jersey: R +9.1%
9. Colorado: R +8.9%
10. Arizona: D +8%
11. Texas: D +8%
12. Connecticut: R +8%
13. Maine: R +7%
14. Georgia: D +6%
15. Alaska: D +6%
16. Florida: D +4.9%
17. Mississippi: D +4.5%
All of these changes (in the 17 states above) are statistically significant, though there are HUGE question marks concerning California.
The whole list of states having been polled till now, going from Democratic stronghold to Republican stronghold:
New York: D +28%
New Mexico: D +14%
Oregon: D +12%
California: D +9%
Connecticut: D +9%
New Jersey: D +8.7%
Maine: D +8%
Ohio: D +6.7%
Michigan: D +6.1%
Currently estimated/projected national average: D +6.1%
Minnesota: D +6%
Florida: D +5.8%
Wisconsin: D +4.1%
Iowa: D +3.9%
Virginia: D +3.6%
Pennsylvania: D +3.5%
Nevada: D +3%
New Hampshire: D +2.1%
North Carolina: D +1.6%
Arizona: R +1%
Georgia: R +2%
Louisiana: R +3%
Colorado: R +3.5%
Kentucky: R +4.5%
Mississippi: R +7%
South Carolina: R +7%
Alaska: R +8%
Texas: R +8%
Kansas: R +9%
Arkansas: R +9.5%
Montana: R +13%
West Virginia: R +14%
Wyoming: R +28%
The best-tailored Republican candidates in all states polled so far:
1. Chris Christie favoured in 11 of 32 states (for 151 EVs)
2. Rand Paul favoured in 5 states (California, Oregon (shared), Nevada, Montana & Alaska - for 74 EVs)
3. Mike Huckabee favoured in 6 states (Texas (!), Louisiana (!), Oregon (shared), Arkansas, Mississippi & New Hampshire (!) - for 69 EVs)
4. Jeb Bush favoured in 5 states (Florida, Arizona, Kentucky (!), Kansas & West Virginia - for 59 EVs)
5. Paul Ryan favoured in 2 states (Wisconsin & Colorado - for 19 EVs)
6. Tim Pawlenty favoured in 1 state (Minnesota - for 10 EVs)
7. Marco Rubio favoured in 1 state (South Carolina - for 9 EVs)
8. Ben Carson favoured in 1 state (Connecticut - for 7 EVs)
9. Susana Martinez favoured in 1 state (New Mexico - for 5 EVs)
Current update as of August 20.
Title: Re: 2016 Official Polling Map Thread
Post by: pbrower2a on August 20, 2014, 10:25:28 PM
If things remain as they are with no Republican making gains against Hillary Clinton, then she wins a minimum of 330 electoral votes and a maximum of 410 electoral votes.
Title: Re: 2016 Official Polling Map Thread
Post by: pbrower2a on August 21, 2014, 06:23:46 AM
Quinnipiac, New York State:
Clinton 60%
Bush 29%
Clinton 61%
Paul 30%
Clinton 54%
Christie 34%
Cuomo 53%
Bush 30%
Cuomo 55%
Paul 31%
Cuomo 47%
Christie 37%
http://www.quinnipiac.edu/news-and-events/quinnipiac-university-poll/new-york-state/release-detail?ReleaseID=2072
Hillary Clinton vs. Jeb Bush
( )
)
Hillary Clinton vs. Chris Christie
(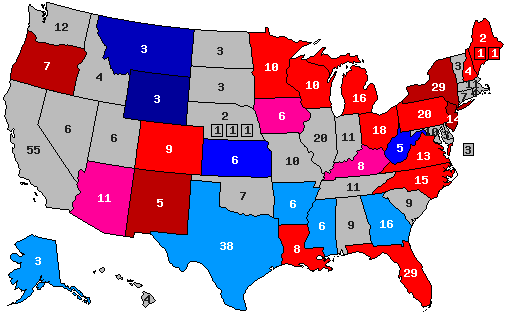 )
)
Hillary Clinton vs. Mike Huckabee
()
Hillary Clinton vs. Rand Paul
()
blue, Republican -- red, Democratic
30% -- lead with 40-49% but a margin of 3% or less
40% -- lead with 40-49% but a margin of 4% or more
60% -- lead with 50-54%
70% -- lead with 55-59%
90% -- lead with 60% or more
Clinton 60%
Bush 29%
Clinton 61%
Paul 30%
Clinton 54%
Christie 34%
Cuomo 53%
Bush 30%
Cuomo 55%
Paul 31%
Cuomo 47%
Christie 37%
http://www.quinnipiac.edu/news-and-events/quinnipiac-university-poll/new-york-state/release-detail?ReleaseID=2072
Hillary Clinton vs. Jeb Bush
(
Hillary Clinton vs. Chris Christie
(
Hillary Clinton vs. Mike Huckabee
(
Hillary Clinton vs. Rand Paul
(
blue, Republican -- red, Democratic
30% -- lead with 40-49% but a margin of 3% or less
40% -- lead with 40-49% but a margin of 4% or more
60% -- lead with 50-54%
70% -- lead with 55-59%
90% -- lead with 60% or more
Title: Re: 2016 Official Polling Map Thread
Post by: eric82oslo on August 21, 2014, 02:32:33 PM
Today we got the 7th 2016 poll from the grand state of New York. It has some great news for Christie, as he is "only" trailing Hillary by 20% in her adopted home state, far less than other candidates or himself in the past. Here are Hillary's new leads in the Empire State:
Vs Christie: D +24.6% (7 polls)
Vs Bush: D +31%
Vs Rand Paul: D +37% (2 polls)
Vs Paul Ryan: D +37%
This means an improvement of 3.4% for Christie in the state, up from -28% to his current -24.6%. Such a major change obviously affects Clinton nationally as well.
The total number of state polls included below has now reached 163.
The 2016 poll averages for each state - 32 states right now - and the change from the actual 2012 outcomes. Only the Republican candidate with the best statewide polling included.
Alaska: Hillary vs Rand Paul: R +8%
+6% D improvement
(Updated on August 12, 2014)
Arizona: Hillary vs Bush: R +1%
+8% D improvement
(Updated on March 6, 2014)
Arkansas: Hillary vs Mike Huckabee: R +9.5%
+14.2% D improvement
(Updated on August 11, 2014)
NEW! California: Hillary vs Rand Paul: D +9%
+14% R improvement
(Updated on August 1, 2014)
Colorado: Hillary vs Paul Ryan: R +3.5%
+8.9% R improvement
Current Republican gain
(Updated on July 29, 2014)
NEW! Connecticut: Hillary vs Ben Carson: D +9%
+8% R improvement
(Updated on August 11, 2014)
Florida: Hillary vs Bush: D +5.8%
+4.9% D improvement
(Updated on August 20, 2014)
Georgia: Hillary vs Christie: R +2%
+6% D improvement
(Updated August 8, 2013)
Iowa: Hillary vs Christie: D +3.9%
+1.9% R improvement
(Updated on July 17, 2014)
Kansas: Hillary vs Bush: R +9%
+13% D improvement
(Updated on February 24, 2014)
Kentucky: Hillary vs Bush: R +4.5%
+18.2% D improvement
(Updated on August 13, 2014)
Louisiana: Hillary vs Huckabee: R +3%
+14% D improvement
(Updated on July 12, 2014)
Maine: Hillary vs Christie: D +8%
+7% R improvement
(Updated on November 13, 2013)
Michigan: Hillary vs Christie: D +6.1%
+3.4% R improvement
(Updated on June 3, 2014)
Minnesota: Hillary vs Tim Pawlenty: D +6%
+2% R improvement
(Updated on June 18, 2014)
Mississippi: Hillary vs Huckabee: R +7%
+4.5% D improvement
(Updated on July 20, 2014)
Montana: Hillary vs Rand Paul: R +13% (Brian Schweitzer vs Rand Paul: R +8%)
+1% D improvement
(Updated on July 23, 2014)
NEW! Nevada: Hillary vs Rand Paul: D +3%
+4% R improvement
(Updated on July 31, 2014)
New Hampshire: Hillary vs Huckabee: D +2.1%
+3.5% R improvement
(Updated on July 17, 2014)
New Jersey: Hillary vs Christie: D +8.7%
+9.1% R improvement
(Updated on August 13, 2014)
New Mexico: Hillary vs Susana Martinez: D +14%
+4% D improvement
(Updated on March 27, 2014)
New York: Hillary vs Christie: D +24.6%
+3.6% R improvement
(Updated on August 21, 2014)
North Carolina: Hillary vs Christie: D +1.6%
+3.6% D improvement
Current Democratic gain
(Updated on August 20, 2014)
Ohio: Hillary vs Christie: D +6.7%
+3.7% D improvement
(Updated on July 31, 2014)
Oregon: Hillary vs Rand Paul/Huckabee: D +12%
Unchanged from 2012
(Updated on May 30, 2014)
Pennsylvania: Hillary vs Christie: D +3.5%
+1.9% R improvement
(Updated on June 5, 2014)
South Carolina: Hillary vs Marco Rubio: R +7%
+3.5% D improvement
(Updated on November 2, 2013)
Texas: Hillary vs Huckabee: R +8%
+8% D improvement
(Updated on April 18, 2014)
Virginia: Hillary vs Christie: D +3.64%
+0.2% R improvement
(Updated on July 23, 2014)
West Virginia: Hillary vs Bush: R +14%
+13% D improvement
(Updated on October 1, 2013)
Wisconsin: Hillary vs Ryan: D +4.1%
+2.8% R improvement
(Updated on August 5, 2014)
Wyoming: Hillary vs Christie: R +28%
+13% D improvement
(Updated on July 23, 2013)
Average all 32 states: Hillary vs Best Republican: D +0.4%
+2.1% D improvement (from Obama 2012) [projecting a 6.0% victory for Hillary]
Giving us this map:
()
Red = Democratic lead/trend
Blue = Republican lead/trend
Green = Tied or no trend
Grey = No polling yet
Green = toss up or less than 0.5% lead
20% shade = 0.6-2% lead
30% shade = 2.1-4% lead
40% shade = 4.1-6% lead
50% shade = 6.1-9% lead
60% shade = 9.1-12% lead
70% shade = 12.1-15% lead
80% shade = 15.1-18% lead
90% shade = Above 18.1% lead
In the count of electoral votes, the current situation looks like this:
Hillary: 268 EVs (in 18 states)
Best/Tailormade Republican: 131 EVs (in 14 states)
Toss-up: None
No polling: 139 EVs (in 18 states + D.C.)
So far, Hillary has captured an impressive 67.2% of all EVs awarded, against only 32.8% EVs for the tailormade Republican.
This is how the Trendline Map looks so far:
(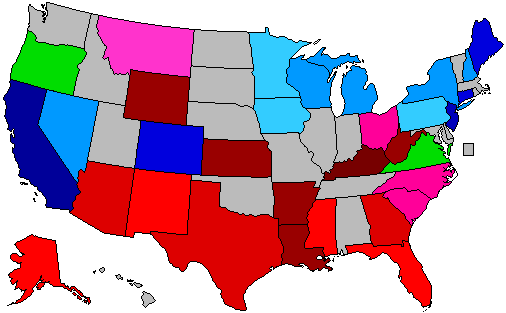 )
)
The states which right now are showing the strongest improvement for the Democratic (Hillary) or the Republican candidate (in 11 out of 32 cases, Christie is that person):
1. Kentucky: D +18.2%
2. Arkansas: D +14.2%
3. California: R +14%
4. Louisiana: D +14%
5. Kansas: D +13%
6. West Virginia: D +13%
7. Wyoming: D +13%
8. New Jersey: R +9.1%
9. Colorado: R +8.9%
10. Arizona: D +8%
11. Texas: D +8%
12. Connecticut: R +8%
13. Maine: R +7%
14. Georgia: D +6%
15. Alaska: D +6%
16. Florida: D +4.9%
17. Mississippi: D +4.5%
All of these changes (in the 17 states above) are statistically significant, though there are HUGE question marks concerning California.
The whole list of states having been polled till now, going from Democratic stronghold to Republican stronghold:
New York: D +24.6%
New Mexico: D +14%
Oregon: D +12%
California: D +9%
Connecticut: D +9%
New Jersey: D +8.7%
Maine: D +8%
Ohio: D +6.7%
Michigan: D +6.1%
Minnesota: D +6%
Currently estimated/projected national average: D +6.0%
Florida: D +5.8%
Wisconsin: D +4.1%
Iowa: D +3.9%
Virginia: D +3.6%
Pennsylvania: D +3.5%
Nevada: D +3%
New Hampshire: D +2.1%
North Carolina: D +1.6%
Arizona: R +1%
Georgia: R +2%
Louisiana: R +3%
Colorado: R +3.5%
Kentucky: R +4.5%
Mississippi: R +7%
South Carolina: R +7%
Alaska: R +8%
Texas: R +8%
Kansas: R +9%
Arkansas: R +9.5%
Montana: R +13%
West Virginia: R +14%
Wyoming: R +28%
The best-tailored Republican candidates in all states polled so far:
1. Chris Christie favoured in 11 of 32 states (for 151 EVs)
2. Rand Paul favoured in 5 states (California, Oregon (shared), Nevada, Montana & Alaska - for 74 EVs)
3. Mike Huckabee favoured in 6 states (Texas (!), Louisiana (!), Oregon (shared), Arkansas, Mississippi & New Hampshire (!) - for 69 EVs)
4. Jeb Bush favoured in 5 states (Florida, Arizona, Kentucky (!), Kansas & West Virginia - for 59 EVs)
5. Paul Ryan favoured in 2 states (Wisconsin & Colorado - for 19 EVs)
6. Tim Pawlenty favoured in 1 state (Minnesota - for 10 EVs)
7. Marco Rubio favoured in 1 state (South Carolina - for 9 EVs)
8. Ben Carson favoured in 1 state (Connecticut - for 7 EVs)
9. Susana Martinez favoured in 1 state (New Mexico - for 5 EVs)
Current update as of August 21.
Vs Christie: D +24.6% (7 polls)
Vs Bush: D +31%
Vs Rand Paul: D +37% (2 polls)
Vs Paul Ryan: D +37%
This means an improvement of 3.4% for Christie in the state, up from -28% to his current -24.6%. Such a major change obviously affects Clinton nationally as well.
The total number of state polls included below has now reached 163.
The 2016 poll averages for each state - 32 states right now - and the change from the actual 2012 outcomes. Only the Republican candidate with the best statewide polling included.
Alaska: Hillary vs Rand Paul: R +8%
+6% D improvement
(Updated on August 12, 2014)
Arizona: Hillary vs Bush: R +1%
+8% D improvement
(Updated on March 6, 2014)
Arkansas: Hillary vs Mike Huckabee: R +9.5%
+14.2% D improvement
(Updated on August 11, 2014)
NEW! California: Hillary vs Rand Paul: D +9%
+14% R improvement
(Updated on August 1, 2014)
Colorado: Hillary vs Paul Ryan: R +3.5%
+8.9% R improvement
Current Republican gain
(Updated on July 29, 2014)
NEW! Connecticut: Hillary vs Ben Carson: D +9%
+8% R improvement
(Updated on August 11, 2014)
Florida: Hillary vs Bush: D +5.8%
+4.9% D improvement
(Updated on August 20, 2014)
Georgia: Hillary vs Christie: R +2%
+6% D improvement
(Updated August 8, 2013)
Iowa: Hillary vs Christie: D +3.9%
+1.9% R improvement
(Updated on July 17, 2014)
Kansas: Hillary vs Bush: R +9%
+13% D improvement
(Updated on February 24, 2014)
Kentucky: Hillary vs Bush: R +4.5%
+18.2% D improvement
(Updated on August 13, 2014)
Louisiana: Hillary vs Huckabee: R +3%
+14% D improvement
(Updated on July 12, 2014)
Maine: Hillary vs Christie: D +8%
+7% R improvement
(Updated on November 13, 2013)
Michigan: Hillary vs Christie: D +6.1%
+3.4% R improvement
(Updated on June 3, 2014)
Minnesota: Hillary vs Tim Pawlenty: D +6%
+2% R improvement
(Updated on June 18, 2014)
Mississippi: Hillary vs Huckabee: R +7%
+4.5% D improvement
(Updated on July 20, 2014)
Montana: Hillary vs Rand Paul: R +13% (Brian Schweitzer vs Rand Paul: R +8%)
+1% D improvement
(Updated on July 23, 2014)
NEW! Nevada: Hillary vs Rand Paul: D +3%
+4% R improvement
(Updated on July 31, 2014)
New Hampshire: Hillary vs Huckabee: D +2.1%
+3.5% R improvement
(Updated on July 17, 2014)
New Jersey: Hillary vs Christie: D +8.7%
+9.1% R improvement
(Updated on August 13, 2014)
New Mexico: Hillary vs Susana Martinez: D +14%
+4% D improvement
(Updated on March 27, 2014)
New York: Hillary vs Christie: D +24.6%
+3.6% R improvement
(Updated on August 21, 2014)
North Carolina: Hillary vs Christie: D +1.6%
+3.6% D improvement
Current Democratic gain
(Updated on August 20, 2014)
Ohio: Hillary vs Christie: D +6.7%
+3.7% D improvement
(Updated on July 31, 2014)
Oregon: Hillary vs Rand Paul/Huckabee: D +12%
Unchanged from 2012
(Updated on May 30, 2014)
Pennsylvania: Hillary vs Christie: D +3.5%
+1.9% R improvement
(Updated on June 5, 2014)
South Carolina: Hillary vs Marco Rubio: R +7%
+3.5% D improvement
(Updated on November 2, 2013)
Texas: Hillary vs Huckabee: R +8%
+8% D improvement
(Updated on April 18, 2014)
Virginia: Hillary vs Christie: D +3.64%
+0.2% R improvement
(Updated on July 23, 2014)
West Virginia: Hillary vs Bush: R +14%
+13% D improvement
(Updated on October 1, 2013)
Wisconsin: Hillary vs Ryan: D +4.1%
+2.8% R improvement
(Updated on August 5, 2014)
Wyoming: Hillary vs Christie: R +28%
+13% D improvement
(Updated on July 23, 2013)
Average all 32 states: Hillary vs Best Republican: D +0.4%
+2.1% D improvement (from Obama 2012) [projecting a 6.0% victory for Hillary]
Giving us this map:
(
Red = Democratic lead/trend
Blue = Republican lead/trend
Green = Tied or no trend
Grey = No polling yet
Green = toss up or less than 0.5% lead
20% shade = 0.6-2% lead
30% shade = 2.1-4% lead
40% shade = 4.1-6% lead
50% shade = 6.1-9% lead
60% shade = 9.1-12% lead
70% shade = 12.1-15% lead
80% shade = 15.1-18% lead
90% shade = Above 18.1% lead
In the count of electoral votes, the current situation looks like this:
Hillary: 268 EVs (in 18 states)
Best/Tailormade Republican: 131 EVs (in 14 states)
Toss-up: None
No polling: 139 EVs (in 18 states + D.C.)
So far, Hillary has captured an impressive 67.2% of all EVs awarded, against only 32.8% EVs for the tailormade Republican.
This is how the Trendline Map looks so far:
(
The states which right now are showing the strongest improvement for the Democratic (Hillary) or the Republican candidate (in 11 out of 32 cases, Christie is that person):
1. Kentucky: D +18.2%
2. Arkansas: D +14.2%
3. California: R +14%
4. Louisiana: D +14%
5. Kansas: D +13%
6. West Virginia: D +13%
7. Wyoming: D +13%
8. New Jersey: R +9.1%
9. Colorado: R +8.9%
10. Arizona: D +8%
11. Texas: D +8%
12. Connecticut: R +8%
13. Maine: R +7%
14. Georgia: D +6%
15. Alaska: D +6%
16. Florida: D +4.9%
17. Mississippi: D +4.5%
All of these changes (in the 17 states above) are statistically significant, though there are HUGE question marks concerning California.
The whole list of states having been polled till now, going from Democratic stronghold to Republican stronghold:
New York: D +24.6%
New Mexico: D +14%
Oregon: D +12%
California: D +9%
Connecticut: D +9%
New Jersey: D +8.7%
Maine: D +8%
Ohio: D +6.7%
Michigan: D +6.1%
Minnesota: D +6%
Currently estimated/projected national average: D +6.0%
Florida: D +5.8%
Wisconsin: D +4.1%
Iowa: D +3.9%
Virginia: D +3.6%
Pennsylvania: D +3.5%
Nevada: D +3%
New Hampshire: D +2.1%
North Carolina: D +1.6%
Arizona: R +1%
Georgia: R +2%
Louisiana: R +3%
Colorado: R +3.5%
Kentucky: R +4.5%
Mississippi: R +7%
South Carolina: R +7%
Alaska: R +8%
Texas: R +8%
Kansas: R +9%
Arkansas: R +9.5%
Montana: R +13%
West Virginia: R +14%
Wyoming: R +28%
The best-tailored Republican candidates in all states polled so far:
1. Chris Christie favoured in 11 of 32 states (for 151 EVs)
2. Rand Paul favoured in 5 states (California, Oregon (shared), Nevada, Montana & Alaska - for 74 EVs)
3. Mike Huckabee favoured in 6 states (Texas (!), Louisiana (!), Oregon (shared), Arkansas, Mississippi & New Hampshire (!) - for 69 EVs)
4. Jeb Bush favoured in 5 states (Florida, Arizona, Kentucky (!), Kansas & West Virginia - for 59 EVs)
5. Paul Ryan favoured in 2 states (Wisconsin & Colorado - for 19 EVs)
6. Tim Pawlenty favoured in 1 state (Minnesota - for 10 EVs)
7. Marco Rubio favoured in 1 state (South Carolina - for 9 EVs)
8. Ben Carson favoured in 1 state (Connecticut - for 7 EVs)
9. Susana Martinez favoured in 1 state (New Mexico - for 5 EVs)
Current update as of August 21.
Title: Re: 2016 Official Polling Map Thread
Post by: eric82oslo on August 22, 2014, 03:24:06 PM
PPP has polled Kansas for the 3rd time this 2016 season. :) It's their 1st Kansas poll to feature a Ted Cruz match up. Generally, Hillary did considerably better than in February. Here are her new Kansas averages:
Vs Bush: R +7.5% (2 polls)
Vs Paul Ryan: R +7%
Vs Huckabee: R +6% (2 polls)
Vs Christie: R +5.5% (2 polls)
Vs Rand Paul: R +5.5% (2 polls)
Vs Rubio: R +5%
Vs Cruz: R +1%
The total number of state polls included below has now reached 164.
The 2016 poll averages for each state - 32 states right now - and the change from the actual 2012 outcomes. Only the Republican candidate with the best statewide polling included.
Alaska: Hillary vs Rand Paul: R +8%
+6% D improvement
(Updated on August 12, 2014)
Arizona: Hillary vs Bush: R +1%
+8% D improvement
(Updated on March 6, 2014)
Arkansas: Hillary vs Mike Huckabee: R +9.5%
+14.2% D improvement
(Updated on August 11, 2014)
NEW! California: Hillary vs Rand Paul: D +9%
+14% R improvement
(Updated on August 1, 2014)
Colorado: Hillary vs Paul Ryan: R +3.5%
+8.9% R improvement
Current Republican gain
(Updated on July 29, 2014)
NEW! Connecticut: Hillary vs Ben Carson: D +9%
+8% R improvement
(Updated on August 11, 2014)
Florida: Hillary vs Bush: D +5.8%
+4.9% D improvement
(Updated on August 20, 2014)
Georgia: Hillary vs Christie: R +2%
+6% D improvement
(Updated August 8, 2013)
Iowa: Hillary vs Christie: D +3.9%
+1.9% R improvement
(Updated on July 17, 2014)
Kansas: Hillary vs Bush: R +7.5%
+14.1% D improvement
(Updated on August 22, 2014)
Kentucky: Hillary vs Bush: R +4.5%
+18.2% D improvement
(Updated on August 13, 2014)
Louisiana: Hillary vs Huckabee: R +3%
+14% D improvement
(Updated on July 12, 2014)
Maine: Hillary vs Christie: D +8%
+7% R improvement
(Updated on November 13, 2013)
Michigan: Hillary vs Christie: D +6.1%
+3.4% R improvement
(Updated on June 3, 2014)
Minnesota: Hillary vs Tim Pawlenty: D +6%
+2% R improvement
(Updated on June 18, 2014)
Mississippi: Hillary vs Huckabee: R +7%
+4.5% D improvement
(Updated on July 20, 2014)
Montana: Hillary vs Rand Paul: R +13% (Brian Schweitzer vs Rand Paul: R +8%)
+1% D improvement
(Updated on July 23, 2014)
NEW! Nevada: Hillary vs Rand Paul: D +3%
+4% R improvement
(Updated on July 31, 2014)
New Hampshire: Hillary vs Huckabee: D +2.1%
+3.5% R improvement
(Updated on July 17, 2014)
New Jersey: Hillary vs Christie: D +8.7%
+9.1% R improvement
(Updated on August 13, 2014)
New Mexico: Hillary vs Susana Martinez: D +14%
+4% D improvement
(Updated on March 27, 2014)
New York: Hillary vs Christie: D +24.6%
+3.6% R improvement
(Updated on August 21, 2014)
North Carolina: Hillary vs Christie: D +1.6%
+3.6% D improvement
Current Democratic gain
(Updated on August 20, 2014)
Ohio: Hillary vs Christie: D +6.7%
+3.7% D improvement
(Updated on July 31, 2014)
Oregon: Hillary vs Rand Paul/Huckabee: D +12%
Unchanged from 2012
(Updated on May 30, 2014)
Pennsylvania: Hillary vs Christie: D +3.5%
+1.9% R improvement
(Updated on June 5, 2014)
South Carolina: Hillary vs Marco Rubio: R +7%
+3.5% D improvement
(Updated on November 2, 2013)
Texas: Hillary vs Huckabee: R +8%
+8% D improvement
(Updated on April 18, 2014)
Virginia: Hillary vs Christie: D +3.64%
+0.2% R improvement
(Updated on July 23, 2014)
West Virginia: Hillary vs Bush: R +14%
+13% D improvement
(Updated on October 1, 2013)
Wisconsin: Hillary vs Ryan: D +4.1%
+2.8% R improvement
(Updated on August 5, 2014)
Wyoming: Hillary vs Christie: R +28%
+13% D improvement
(Updated on July 23, 2013)
Average all 32 states: Hillary vs Best Republican: D +0.5%
+2.2% D improvement (from Obama 2012) [projecting a 6.0% victory for Hillary]
Giving us this map:
()
Red = Democratic lead/trend
Blue = Republican lead/trend
Green = Tied or no trend
Grey = No polling yet
Green = toss up or less than 0.5% lead
20% shade = 0.6-2% lead
30% shade = 2.1-4% lead
40% shade = 4.1-6% lead
50% shade = 6.1-9% lead
60% shade = 9.1-12% lead
70% shade = 12.1-15% lead
80% shade = 15.1-18% lead
90% shade = Above 18.1% lead
In the count of electoral votes, the current situation looks like this:
Hillary: 268 EVs (in 18 states)
Best/Tailormade Republican: 131 EVs (in 14 states)
Toss-up: None
No polling: 139 EVs (in 18 states + D.C.)
So far, Hillary has captured an impressive 67.2% of all EVs awarded, against only 32.8% EVs for the tailormade Republican.
This is how the Trendline Map looks so far:
()
The states which right now are showing the strongest improvement for the Democratic (Hillary) or the Republican candidate (in 11 out of 32 cases, Christie is that person):
1. Kentucky: D +18.2%
2. Arkansas: D +14.2%
3. Kansas: D +14.1%
4. California: R +14%
5. Louisiana: D +14%
6. West Virginia: D +13%
7. Wyoming: D +13%
8. New Jersey: R +9.1%
9. Colorado: R +8.9%
10. Arizona: D +8%
11. Texas: D +8%
12. Connecticut: R +8%
13. Maine: R +7%
14. Georgia: D +6%
15. Alaska: D +6%
16. Florida: D +4.9%
17. Mississippi: D +4.5%
All of these changes (in the 17 states above) are statistically significant, though there are HUGE question marks concerning California.
The whole list of states having been polled till now, going from Democratic stronghold to Republican stronghold:
New York: D +24.6%
New Mexico: D +14%
Oregon: D +12%
California: D +9%
Connecticut: D +9%
New Jersey: D +8.7%
Maine: D +8%
Ohio: D +6.7%
Michigan: D +6.1%
Currently estimated/projected national average: D +6.0%
Minnesota: D +6%
Florida: D +5.8%
Wisconsin: D +4.1%
Iowa: D +3.9%
Virginia: D +3.6%
Pennsylvania: D +3.5%
Nevada: D +3%
New Hampshire: D +2.1%
North Carolina: D +1.6%
Arizona: R +1%
Georgia: R +2%
Louisiana: R +3%
Colorado: R +3.5%
Kentucky: R +4.5%
Mississippi: R +7%
South Carolina: R +7%
Kansas: R +7.5%
Alaska: R +8%
Texas: R +8%
Arkansas: R +9.5%
Montana: R +13%
West Virginia: R +14%
Wyoming: R +28%
The best-tailored Republican candidates in all states polled so far:
1. Chris Christie favoured in 11 of 32 states (for 151 EVs)
2. Rand Paul favoured in 5 states (California, Oregon (shared), Nevada, Montana & Alaska - for 74 EVs)
3. Mike Huckabee favoured in 6 states (Texas (!), Louisiana (!), Oregon (shared), Arkansas, Mississippi & New Hampshire (!) - for 69 EVs)
4. Jeb Bush favoured in 5 states (Florida, Arizona, Kentucky (!), Kansas & West Virginia - for 59 EVs)
5. Paul Ryan favoured in 2 states (Wisconsin & Colorado - for 19 EVs)
6. Tim Pawlenty favoured in 1 state (Minnesota - for 10 EVs)
7. Marco Rubio favoured in 1 state (South Carolina - for 9 EVs)
8. Ben Carson favoured in 1 state (Connecticut - for 7 EVs)
9. Susana Martinez favoured in 1 state (New Mexico - for 5 EVs)
Current update as of August 22.
Vs Bush: R +7.5% (2 polls)
Vs Paul Ryan: R +7%
Vs Huckabee: R +6% (2 polls)
Vs Christie: R +5.5% (2 polls)
Vs Rand Paul: R +5.5% (2 polls)
Vs Rubio: R +5%
Vs Cruz: R +1%
The total number of state polls included below has now reached 164.
The 2016 poll averages for each state - 32 states right now - and the change from the actual 2012 outcomes. Only the Republican candidate with the best statewide polling included.
Alaska: Hillary vs Rand Paul: R +8%
+6% D improvement
(Updated on August 12, 2014)
Arizona: Hillary vs Bush: R +1%
+8% D improvement
(Updated on March 6, 2014)
Arkansas: Hillary vs Mike Huckabee: R +9.5%
+14.2% D improvement
(Updated on August 11, 2014)
NEW! California: Hillary vs Rand Paul: D +9%
+14% R improvement
(Updated on August 1, 2014)
Colorado: Hillary vs Paul Ryan: R +3.5%
+8.9% R improvement
Current Republican gain
(Updated on July 29, 2014)
NEW! Connecticut: Hillary vs Ben Carson: D +9%
+8% R improvement
(Updated on August 11, 2014)
Florida: Hillary vs Bush: D +5.8%
+4.9% D improvement
(Updated on August 20, 2014)
Georgia: Hillary vs Christie: R +2%
+6% D improvement
(Updated August 8, 2013)
Iowa: Hillary vs Christie: D +3.9%
+1.9% R improvement
(Updated on July 17, 2014)
Kansas: Hillary vs Bush: R +7.5%
+14.1% D improvement
(Updated on August 22, 2014)
Kentucky: Hillary vs Bush: R +4.5%
+18.2% D improvement
(Updated on August 13, 2014)
Louisiana: Hillary vs Huckabee: R +3%
+14% D improvement
(Updated on July 12, 2014)
Maine: Hillary vs Christie: D +8%
+7% R improvement
(Updated on November 13, 2013)
Michigan: Hillary vs Christie: D +6.1%
+3.4% R improvement
(Updated on June 3, 2014)
Minnesota: Hillary vs Tim Pawlenty: D +6%
+2% R improvement
(Updated on June 18, 2014)
Mississippi: Hillary vs Huckabee: R +7%
+4.5% D improvement
(Updated on July 20, 2014)
Montana: Hillary vs Rand Paul: R +13% (Brian Schweitzer vs Rand Paul: R +8%)
+1% D improvement
(Updated on July 23, 2014)
NEW! Nevada: Hillary vs Rand Paul: D +3%
+4% R improvement
(Updated on July 31, 2014)
New Hampshire: Hillary vs Huckabee: D +2.1%
+3.5% R improvement
(Updated on July 17, 2014)
New Jersey: Hillary vs Christie: D +8.7%
+9.1% R improvement
(Updated on August 13, 2014)
New Mexico: Hillary vs Susana Martinez: D +14%
+4% D improvement
(Updated on March 27, 2014)
New York: Hillary vs Christie: D +24.6%
+3.6% R improvement
(Updated on August 21, 2014)
North Carolina: Hillary vs Christie: D +1.6%
+3.6% D improvement
Current Democratic gain
(Updated on August 20, 2014)
Ohio: Hillary vs Christie: D +6.7%
+3.7% D improvement
(Updated on July 31, 2014)
Oregon: Hillary vs Rand Paul/Huckabee: D +12%
Unchanged from 2012
(Updated on May 30, 2014)
Pennsylvania: Hillary vs Christie: D +3.5%
+1.9% R improvement
(Updated on June 5, 2014)
South Carolina: Hillary vs Marco Rubio: R +7%
+3.5% D improvement
(Updated on November 2, 2013)
Texas: Hillary vs Huckabee: R +8%
+8% D improvement
(Updated on April 18, 2014)
Virginia: Hillary vs Christie: D +3.64%
+0.2% R improvement
(Updated on July 23, 2014)
West Virginia: Hillary vs Bush: R +14%
+13% D improvement
(Updated on October 1, 2013)
Wisconsin: Hillary vs Ryan: D +4.1%
+2.8% R improvement
(Updated on August 5, 2014)
Wyoming: Hillary vs Christie: R +28%
+13% D improvement
(Updated on July 23, 2013)
Average all 32 states: Hillary vs Best Republican: D +0.5%
+2.2% D improvement (from Obama 2012) [projecting a 6.0% victory for Hillary]
Giving us this map:
(
Red = Democratic lead/trend
Blue = Republican lead/trend
Green = Tied or no trend
Grey = No polling yet
Green = toss up or less than 0.5% lead
20% shade = 0.6-2% lead
30% shade = 2.1-4% lead
40% shade = 4.1-6% lead
50% shade = 6.1-9% lead
60% shade = 9.1-12% lead
70% shade = 12.1-15% lead
80% shade = 15.1-18% lead
90% shade = Above 18.1% lead
In the count of electoral votes, the current situation looks like this:
Hillary: 268 EVs (in 18 states)
Best/Tailormade Republican: 131 EVs (in 14 states)
Toss-up: None
No polling: 139 EVs (in 18 states + D.C.)
So far, Hillary has captured an impressive 67.2% of all EVs awarded, against only 32.8% EVs for the tailormade Republican.
This is how the Trendline Map looks so far:
(
The states which right now are showing the strongest improvement for the Democratic (Hillary) or the Republican candidate (in 11 out of 32 cases, Christie is that person):
1. Kentucky: D +18.2%
2. Arkansas: D +14.2%
3. Kansas: D +14.1%
4. California: R +14%
5. Louisiana: D +14%
6. West Virginia: D +13%
7. Wyoming: D +13%
8. New Jersey: R +9.1%
9. Colorado: R +8.9%
10. Arizona: D +8%
11. Texas: D +8%
12. Connecticut: R +8%
13. Maine: R +7%
14. Georgia: D +6%
15. Alaska: D +6%
16. Florida: D +4.9%
17. Mississippi: D +4.5%
All of these changes (in the 17 states above) are statistically significant, though there are HUGE question marks concerning California.
The whole list of states having been polled till now, going from Democratic stronghold to Republican stronghold:
New York: D +24.6%
New Mexico: D +14%
Oregon: D +12%
California: D +9%
Connecticut: D +9%
New Jersey: D +8.7%
Maine: D +8%
Ohio: D +6.7%
Michigan: D +6.1%
Currently estimated/projected national average: D +6.0%
Minnesota: D +6%
Florida: D +5.8%
Wisconsin: D +4.1%
Iowa: D +3.9%
Virginia: D +3.6%
Pennsylvania: D +3.5%
Nevada: D +3%
New Hampshire: D +2.1%
North Carolina: D +1.6%
Arizona: R +1%
Georgia: R +2%
Louisiana: R +3%
Colorado: R +3.5%
Kentucky: R +4.5%
Mississippi: R +7%
South Carolina: R +7%
Kansas: R +7.5%
Alaska: R +8%
Texas: R +8%
Arkansas: R +9.5%
Montana: R +13%
West Virginia: R +14%
Wyoming: R +28%
The best-tailored Republican candidates in all states polled so far:
1. Chris Christie favoured in 11 of 32 states (for 151 EVs)
2. Rand Paul favoured in 5 states (California, Oregon (shared), Nevada, Montana & Alaska - for 74 EVs)
3. Mike Huckabee favoured in 6 states (Texas (!), Louisiana (!), Oregon (shared), Arkansas, Mississippi & New Hampshire (!) - for 69 EVs)
4. Jeb Bush favoured in 5 states (Florida, Arizona, Kentucky (!), Kansas & West Virginia - for 59 EVs)
5. Paul Ryan favoured in 2 states (Wisconsin & Colorado - for 19 EVs)
6. Tim Pawlenty favoured in 1 state (Minnesota - for 10 EVs)
7. Marco Rubio favoured in 1 state (South Carolina - for 9 EVs)
8. Ben Carson favoured in 1 state (Connecticut - for 7 EVs)
9. Susana Martinez favoured in 1 state (New Mexico - for 5 EVs)
Current update as of August 22.
Title: Re: 2016 Official Polling Map Thread
Post by: pbrower2a on August 22, 2014, 05:10:34 PM
PPP, Kansas
(Democratic nominees have lost Kansas in every Presidential election since 1964).
Hillary Clinton vs. Jeb Bush
( )
)
Hillary Clinton vs. Chris Christie
()
Hillary Clinton vs. Mike Huckabee
()
Hillary Clinton vs. Rand Paul
()
blue, Republican -- red, Democratic
30% -- lead with 40-49% but a margin of 3% or less
40% -- lead with 40-49% but a margin of 4% or more
60% -- lead with 50-54%
70% -- lead with 55-59%
90% -- lead with 60% or more
Quote
-PPP's newest Kansas poll finds Hillary Clinton trailing all of her potential Republican foes in the state, but by much closer margins than Barack Obama lost by there. Clinton trails Jeb Bush
45/39, Mike Huckabee 46/41, Rand Paul 45/41, Chris Christie 42/38, and Ted Cruz 43/42. It's
not likely Clinton could win Kansas, but she would at least come closer than Democrats usually do.
http://www.publicpolicypolling.com/pdf/2014/PPP_Release_KS_822424.pdf45/39, Mike Huckabee 46/41, Rand Paul 45/41, Chris Christie 42/38, and Ted Cruz 43/42. It's
not likely Clinton could win Kansas, but she would at least come closer than Democrats usually do.
(Democratic nominees have lost Kansas in every Presidential election since 1964).
Hillary Clinton vs. Jeb Bush
(
Hillary Clinton vs. Chris Christie
(
Hillary Clinton vs. Mike Huckabee
(
Hillary Clinton vs. Rand Paul
(
blue, Republican -- red, Democratic
30% -- lead with 40-49% but a margin of 3% or less
40% -- lead with 40-49% but a margin of 4% or more
60% -- lead with 50-54%
70% -- lead with 55-59%
90% -- lead with 60% or more
Title: Re: 2016 Official Polling Map Thread
Post by: pbrower2a on August 31, 2014, 10:38:07 AM
Labor Day weekend. Expect few polls.
Title: Re: 2016 Official Polling Map Thread
Post by: eric82oslo on September 02, 2014, 07:29:55 PM
We now have the 18th official 2016 poll from the number 1 battleground state of any modern election, Florida, yet the very 2nd one coming from Gravis (they already polled Rubio once in the past). It only tested Hillary against Bush and Rubio. Here are everyone's new Florida averages:
Vs Bush: D +5.5% (13 polls)
Vs Romney: D +7%
Vs Rubio: D +9.9% (14 polls)
Vs Perry: D +10%
Vs Paul Ryan: D +11.2% (6 polls)
Vs Rand Paul: D +11.6% (8 polls)
Vs Christie: D +12.1% (7 polls)
Vs Huckabee: D +12.5% (2 polls)
Vs Cruz: D +17.8% (5 polls)
Due to Gravis only having Hillary leading Jeb by 2%, her lead against him is reduced by 0.3% in the state, going from 5.8% to her current 5.5%.
The total number of state polls included below has now reached 165.
The 2016 poll averages for each state - 32 states right now - and the change from the actual 2012 outcomes. Only the Republican candidate with the best statewide polling included.
Alaska: Hillary vs Rand Paul: R +8%
+6% D improvement
(Updated on August 12, 2014)
Arizona: Hillary vs Bush: R +1%
+8% D improvement
(Updated on March 6, 2014)
Arkansas: Hillary vs Mike Huckabee: R +9.5%
+14.2% D improvement
(Updated on August 11, 2014)
NEW! California: Hillary vs Rand Paul: D +9%
+14% R improvement
(Updated on August 1, 2014)
Colorado: Hillary vs Paul Ryan: R +3.5%
+8.9% R improvement
Current Republican gain
(Updated on July 29, 2014)
NEW! Connecticut: Hillary vs Ben Carson: D +9%
+8% R improvement
(Updated on August 11, 2014)
Florida: Hillary vs Bush: D +5.5%
+4.6% D improvement
(Updated on September 3, 2014)
Georgia: Hillary vs Christie: R +2%
+6% D improvement
(Updated August 8, 2013)
Iowa: Hillary vs Christie: D +3.9%
+1.9% R improvement
(Updated on July 17, 2014)
Kansas: Hillary vs Bush: R +7.5%
+14.1% D improvement
(Updated on August 22, 2014)
Kentucky: Hillary vs Bush: R +4.5%
+18.2% D improvement
(Updated on August 13, 2014)
Louisiana: Hillary vs Huckabee: R +3%
+14% D improvement
(Updated on July 12, 2014)
Maine: Hillary vs Christie: D +8%
+7% R improvement
(Updated on November 13, 2013)
Michigan: Hillary vs Christie: D +6.1%
+3.4% R improvement
(Updated on June 3, 2014)
Minnesota: Hillary vs Tim Pawlenty: D +6%
+2% R improvement
(Updated on June 18, 2014)
Mississippi: Hillary vs Huckabee: R +7%
+4.5% D improvement
(Updated on July 20, 2014)
Montana: Hillary vs Rand Paul: R +13% (Brian Schweitzer vs Rand Paul: R +8%)
+1% D improvement
(Updated on July 23, 2014)
NEW! Nevada: Hillary vs Rand Paul: D +3%
+4% R improvement
(Updated on July 31, 2014)
New Hampshire: Hillary vs Huckabee: D +2.1%
+3.5% R improvement
(Updated on July 17, 2014)
New Jersey: Hillary vs Christie: D +8.7%
+9.1% R improvement
(Updated on August 13, 2014)
New Mexico: Hillary vs Susana Martinez: D +14%
+4% D improvement
(Updated on March 27, 2014)
New York: Hillary vs Christie: D +24.6%
+3.6% R improvement
(Updated on August 21, 2014)
North Carolina: Hillary vs Christie: D +1.6%
+3.6% D improvement
Current Democratic gain
(Updated on August 20, 2014)
Ohio: Hillary vs Christie: D +6.7%
+3.7% D improvement
(Updated on July 31, 2014)
Oregon: Hillary vs Rand Paul/Huckabee: D +12%
Unchanged from 2012
(Updated on May 30, 2014)
Pennsylvania: Hillary vs Christie: D +3.5%
+1.9% R improvement
(Updated on June 5, 2014)
South Carolina: Hillary vs Marco Rubio: R +7%
+3.5% D improvement
(Updated on November 2, 2013)
Texas: Hillary vs Huckabee: R +8%
+8% D improvement
(Updated on April 18, 2014)
Virginia: Hillary vs Christie: D +3.64%
+0.2% R improvement
(Updated on July 23, 2014)
West Virginia: Hillary vs Bush: R +14%
+13% D improvement
(Updated on October 1, 2013)
Wisconsin: Hillary vs Ryan: D +4.1%
+2.8% R improvement
(Updated on August 5, 2014)
Wyoming: Hillary vs Christie: R +28%
+13% D improvement
(Updated on July 23, 2013)
Average all 32 states: Hillary vs Best Republican: D +0.5%
+2.2% D improvement (from Obama 2012) [projecting a 6.0% victory for Hillary]
Giving us this map:
()
Red = Democratic lead/trend
Blue = Republican lead/trend
Green = Tied or no trend
Grey = No polling yet
Green = toss up or less than 0.5% lead
20% shade = 0.6-2% lead
30% shade = 2.1-4% lead
40% shade = 4.1-6% lead
50% shade = 6.1-9% lead
60% shade = 9.1-12% lead
70% shade = 12.1-15% lead
80% shade = 15.1-18% lead
90% shade = Above 18.1% lead
In the count of electoral votes, the current situation looks like this:
Hillary: 268 EVs (in 18 states)
Best/Tailormade Republican: 131 EVs (in 14 states)
Toss-up: None
No polling: 139 EVs (in 18 states + D.C.)
So far, Hillary has captured an impressive 67.2% of all EVs awarded, against only 32.8% EVs for the tailormade Republican.
This is how the Trendline Map looks so far:
()
The states which right now are showing the strongest improvement for the Democratic (Hillary) or the Republican candidate (in 11 out of 32 cases, Christie is that person):
1. Kentucky: D +18.2%
2. Arkansas: D +14.2%
3. Kansas: D +14.1%
4. California: R +14%
5. Louisiana: D +14%
6. West Virginia: D +13%
7. Wyoming: D +13%
8. New Jersey: R +9.1%
9. Colorado: R +8.9%
10. Arizona: D +8%
11. Texas: D +8%
12. Connecticut: R +8%
13. Maine: R +7%
14. Georgia: D +6%
15. Alaska: D +6%
16. Florida: D +4.6%
17. Mississippi: D +4.5%
All of these changes (in the 17 states above) are statistically significant, though there are HUGE question marks concerning California.
The whole list of states having been polled till now, going from Democratic stronghold to Republican stronghold:
New York: D +24.6%
New Mexico: D +14%
Oregon: D +12%
California: D +9%
Connecticut: D +9%
New Jersey: D +8.7%
Maine: D +8%
Ohio: D +6.7%
Michigan: D +6.1%
Currently estimated/projected national average: D +6.0%
Minnesota: D +6%
Florida: D +5.5%
Wisconsin: D +4.1%
Iowa: D +3.9%
Virginia: D +3.6%
Pennsylvania: D +3.5%
Nevada: D +3%
New Hampshire: D +2.1%
North Carolina: D +1.6%
Arizona: R +1%
Georgia: R +2%
Louisiana: R +3%
Colorado: R +3.5%
Kentucky: R +4.5%
Mississippi: R +7%
South Carolina: R +7%
Kansas: R +7.5%
Alaska: R +8%
Texas: R +8%
Arkansas: R +9.5%
Montana: R +13%
West Virginia: R +14%
Wyoming: R +28%
The best-tailored Republican candidates in all states polled so far:
1. Chris Christie favoured in 11 of 32 states (for 151 EVs)
2. Rand Paul favoured in 5 states (California, Oregon (shared), Nevada, Montana & Alaska - for 74 EVs)
3. Mike Huckabee favoured in 6 states (Texas (!), Louisiana (!), Oregon (shared), Arkansas, Mississippi & New Hampshire (!) - for 69 EVs)
4. Jeb Bush favoured in 5 states (Florida, Arizona, Kentucky (!), Kansas & West Virginia - for 59 EVs)
5. Paul Ryan favoured in 2 states (Wisconsin & Colorado - for 19 EVs)
6. Tim Pawlenty favoured in 1 state (Minnesota - for 10 EVs)
7. Marco Rubio favoured in 1 state (South Carolina - for 9 EVs)
8. Ben Carson favoured in 1 state (Connecticut - for 7 EVs)
9. Susana Martinez favoured in 1 state (New Mexico - for 5 EVs)
Current update as of September 3.
Vs Bush: D +5.5% (13 polls)
Vs Romney: D +7%
Vs Rubio: D +9.9% (14 polls)
Vs Perry: D +10%
Vs Paul Ryan: D +11.2% (6 polls)
Vs Rand Paul: D +11.6% (8 polls)
Vs Christie: D +12.1% (7 polls)
Vs Huckabee: D +12.5% (2 polls)
Vs Cruz: D +17.8% (5 polls)
Due to Gravis only having Hillary leading Jeb by 2%, her lead against him is reduced by 0.3% in the state, going from 5.8% to her current 5.5%.
The total number of state polls included below has now reached 165.
The 2016 poll averages for each state - 32 states right now - and the change from the actual 2012 outcomes. Only the Republican candidate with the best statewide polling included.
Alaska: Hillary vs Rand Paul: R +8%
+6% D improvement
(Updated on August 12, 2014)
Arizona: Hillary vs Bush: R +1%
+8% D improvement
(Updated on March 6, 2014)
Arkansas: Hillary vs Mike Huckabee: R +9.5%
+14.2% D improvement
(Updated on August 11, 2014)
NEW! California: Hillary vs Rand Paul: D +9%
+14% R improvement
(Updated on August 1, 2014)
Colorado: Hillary vs Paul Ryan: R +3.5%
+8.9% R improvement
Current Republican gain
(Updated on July 29, 2014)
NEW! Connecticut: Hillary vs Ben Carson: D +9%
+8% R improvement
(Updated on August 11, 2014)
Florida: Hillary vs Bush: D +5.5%
+4.6% D improvement
(Updated on September 3, 2014)
Georgia: Hillary vs Christie: R +2%
+6% D improvement
(Updated August 8, 2013)
Iowa: Hillary vs Christie: D +3.9%
+1.9% R improvement
(Updated on July 17, 2014)
Kansas: Hillary vs Bush: R +7.5%
+14.1% D improvement
(Updated on August 22, 2014)
Kentucky: Hillary vs Bush: R +4.5%
+18.2% D improvement
(Updated on August 13, 2014)
Louisiana: Hillary vs Huckabee: R +3%
+14% D improvement
(Updated on July 12, 2014)
Maine: Hillary vs Christie: D +8%
+7% R improvement
(Updated on November 13, 2013)
Michigan: Hillary vs Christie: D +6.1%
+3.4% R improvement
(Updated on June 3, 2014)
Minnesota: Hillary vs Tim Pawlenty: D +6%
+2% R improvement
(Updated on June 18, 2014)
Mississippi: Hillary vs Huckabee: R +7%
+4.5% D improvement
(Updated on July 20, 2014)
Montana: Hillary vs Rand Paul: R +13% (Brian Schweitzer vs Rand Paul: R +8%)
+1% D improvement
(Updated on July 23, 2014)
NEW! Nevada: Hillary vs Rand Paul: D +3%
+4% R improvement
(Updated on July 31, 2014)
New Hampshire: Hillary vs Huckabee: D +2.1%
+3.5% R improvement
(Updated on July 17, 2014)
New Jersey: Hillary vs Christie: D +8.7%
+9.1% R improvement
(Updated on August 13, 2014)
New Mexico: Hillary vs Susana Martinez: D +14%
+4% D improvement
(Updated on March 27, 2014)
New York: Hillary vs Christie: D +24.6%
+3.6% R improvement
(Updated on August 21, 2014)
North Carolina: Hillary vs Christie: D +1.6%
+3.6% D improvement
Current Democratic gain
(Updated on August 20, 2014)
Ohio: Hillary vs Christie: D +6.7%
+3.7% D improvement
(Updated on July 31, 2014)
Oregon: Hillary vs Rand Paul/Huckabee: D +12%
Unchanged from 2012
(Updated on May 30, 2014)
Pennsylvania: Hillary vs Christie: D +3.5%
+1.9% R improvement
(Updated on June 5, 2014)
South Carolina: Hillary vs Marco Rubio: R +7%
+3.5% D improvement
(Updated on November 2, 2013)
Texas: Hillary vs Huckabee: R +8%
+8% D improvement
(Updated on April 18, 2014)
Virginia: Hillary vs Christie: D +3.64%
+0.2% R improvement
(Updated on July 23, 2014)
West Virginia: Hillary vs Bush: R +14%
+13% D improvement
(Updated on October 1, 2013)
Wisconsin: Hillary vs Ryan: D +4.1%
+2.8% R improvement
(Updated on August 5, 2014)
Wyoming: Hillary vs Christie: R +28%
+13% D improvement
(Updated on July 23, 2013)
Average all 32 states: Hillary vs Best Republican: D +0.5%
+2.2% D improvement (from Obama 2012) [projecting a 6.0% victory for Hillary]
Giving us this map:
(
Red = Democratic lead/trend
Blue = Republican lead/trend
Green = Tied or no trend
Grey = No polling yet
Green = toss up or less than 0.5% lead
20% shade = 0.6-2% lead
30% shade = 2.1-4% lead
40% shade = 4.1-6% lead
50% shade = 6.1-9% lead
60% shade = 9.1-12% lead
70% shade = 12.1-15% lead
80% shade = 15.1-18% lead
90% shade = Above 18.1% lead
In the count of electoral votes, the current situation looks like this:
Hillary: 268 EVs (in 18 states)
Best/Tailormade Republican: 131 EVs (in 14 states)
Toss-up: None
No polling: 139 EVs (in 18 states + D.C.)
So far, Hillary has captured an impressive 67.2% of all EVs awarded, against only 32.8% EVs for the tailormade Republican.
This is how the Trendline Map looks so far:
(
The states which right now are showing the strongest improvement for the Democratic (Hillary) or the Republican candidate (in 11 out of 32 cases, Christie is that person):
1. Kentucky: D +18.2%
2. Arkansas: D +14.2%
3. Kansas: D +14.1%
4. California: R +14%
5. Louisiana: D +14%
6. West Virginia: D +13%
7. Wyoming: D +13%
8. New Jersey: R +9.1%
9. Colorado: R +8.9%
10. Arizona: D +8%
11. Texas: D +8%
12. Connecticut: R +8%
13. Maine: R +7%
14. Georgia: D +6%
15. Alaska: D +6%
16. Florida: D +4.6%
17. Mississippi: D +4.5%
All of these changes (in the 17 states above) are statistically significant, though there are HUGE question marks concerning California.
The whole list of states having been polled till now, going from Democratic stronghold to Republican stronghold:
New York: D +24.6%
New Mexico: D +14%
Oregon: D +12%
California: D +9%
Connecticut: D +9%
New Jersey: D +8.7%
Maine: D +8%
Ohio: D +6.7%
Michigan: D +6.1%
Currently estimated/projected national average: D +6.0%
Minnesota: D +6%
Florida: D +5.5%
Wisconsin: D +4.1%
Iowa: D +3.9%
Virginia: D +3.6%
Pennsylvania: D +3.5%
Nevada: D +3%
New Hampshire: D +2.1%
North Carolina: D +1.6%
Arizona: R +1%
Georgia: R +2%
Louisiana: R +3%
Colorado: R +3.5%
Kentucky: R +4.5%
Mississippi: R +7%
South Carolina: R +7%
Kansas: R +7.5%
Alaska: R +8%
Texas: R +8%
Arkansas: R +9.5%
Montana: R +13%
West Virginia: R +14%
Wyoming: R +28%
The best-tailored Republican candidates in all states polled so far:
1. Chris Christie favoured in 11 of 32 states (for 151 EVs)
2. Rand Paul favoured in 5 states (California, Oregon (shared), Nevada, Montana & Alaska - for 74 EVs)
3. Mike Huckabee favoured in 6 states (Texas (!), Louisiana (!), Oregon (shared), Arkansas, Mississippi & New Hampshire (!) - for 69 EVs)
4. Jeb Bush favoured in 5 states (Florida, Arizona, Kentucky (!), Kansas & West Virginia - for 59 EVs)
5. Paul Ryan favoured in 2 states (Wisconsin & Colorado - for 19 EVs)
6. Tim Pawlenty favoured in 1 state (Minnesota - for 10 EVs)
7. Marco Rubio favoured in 1 state (South Carolina - for 9 EVs)
8. Ben Carson favoured in 1 state (Connecticut - for 7 EVs)
9. Susana Martinez favoured in 1 state (New Mexico - for 5 EVs)
Current update as of September 3.
Title: Re: 2016 Official Polling Map Thread
Post by: eric82oslo on September 09, 2014, 11:50:54 AM
PPP has just released new numbers on the Michigan race, and it shows a vast improvement for Hillary, particularily against Christie. :) Here are the new Michigan averages:
Vs Christie: D+6.9% (8 polls, improvement of +0.8%)
Vs Paul Ryan: D+7% (2 polls)
Vs Bush: D+10% (5 polls)
Vs Rand Paul: D+10.5% (6 polls)
Vs Huckabee: D+12% (3 polls)
Vs Rubio: D+15.5% (2 polls)
The total number of state polls included below has now reached 166.
The 2016 poll averages for each state - 32 states right now - and the change from the actual 2012 outcomes. Only the Republican candidate with the best statewide polling included.
Alaska: Hillary vs Rand Paul: R +8%
+6% D improvement
(Updated on August 12, 2014)
Arizona: Hillary vs Bush: R +1%
+8% D improvement
(Updated on March 6, 2014)
Arkansas: Hillary vs Mike Huckabee: R +9.5%
+14.2% D improvement
(Updated on August 11, 2014)
California: Hillary vs Rand Paul: D +9%
+14% R improvement
(Updated on August 1, 2014)
Colorado: Hillary vs Paul Ryan: R +3.5%
+8.9% R improvement
Current Republican gain
(Updated on July 29, 2014)
Connecticut: Hillary vs Ben Carson: D +9%
+8% R improvement
(Updated on August 11, 2014)
Florida: Hillary vs Bush: D +5.5%
+4.6% D improvement
(Updated on September 3, 2014)
Georgia: Hillary vs Christie: R +2%
+6% D improvement
(Updated August 8, 2013)
Iowa: Hillary vs Christie: D +3.9%
+1.9% R improvement
(Updated on July 17, 2014)
Kansas: Hillary vs Bush: R +7.5%
+14.1% D improvement
(Updated on August 22, 2014)
Kentucky: Hillary vs Bush: R +4.5%
+18.2% D improvement
(Updated on August 13, 2014)
Louisiana: Hillary vs Huckabee: R +3%
+14% D improvement
(Updated on July 12, 2014)
Maine: Hillary vs Christie: D +8%
+7% R improvement
(Updated on November 13, 2013)
Michigan: Hillary vs Christie: D +6.9%
+2.6% R improvement
(Updated on September 9, 2014)
Minnesota: Hillary vs Tim Pawlenty: D +6%
+2% R improvement
(Updated on June 18, 2014)
Mississippi: Hillary vs Huckabee: R +7%
+4.5% D improvement
(Updated on July 20, 2014)
Montana: Hillary vs Rand Paul: R +13% (Brian Schweitzer vs Rand Paul: R +8%)
+1% D improvement
(Updated on July 23, 2014)
Nevada: Hillary vs Rand Paul: D +3%
+4% R improvement
(Updated on July 31, 2014)
New Hampshire: Hillary vs Huckabee: D +2.1%
+3.5% R improvement
(Updated on July 17, 2014)
New Jersey: Hillary vs Christie: D +8.7%
+9.1% R improvement
(Updated on August 13, 2014)
New Mexico: Hillary vs Susana Martinez: D +14%
+4% D improvement
(Updated on March 27, 2014)
New York: Hillary vs Christie: D +24.6%
+3.6% R improvement
(Updated on August 21, 2014)
North Carolina: Hillary vs Christie: D +1.6%
+3.6% D improvement
Current Democratic gain
(Updated on August 20, 2014)
Ohio: Hillary vs Christie: D +6.7%
+3.7% D improvement
(Updated on July 31, 2014)
Oregon: Hillary vs Rand Paul/Huckabee: D +12%
Unchanged from 2012
(Updated on May 30, 2014)
Pennsylvania: Hillary vs Christie: D +3.5%
+1.9% R improvement
(Updated on June 5, 2014)
South Carolina: Hillary vs Marco Rubio: R +7%
+3.5% D improvement
(Updated on November 2, 2013)
Texas: Hillary vs Huckabee: R +8%
+8% D improvement
(Updated on April 18, 2014)
Virginia: Hillary vs Christie: D +3.64%
+0.2% R improvement
(Updated on July 23, 2014)
West Virginia: Hillary vs Bush: R +14%
+13% D improvement
(Updated on October 1, 2013)
Wisconsin: Hillary vs Ryan: D +4.1%
+2.8% R improvement
(Updated on August 5, 2014)
Wyoming: Hillary vs Christie: R +28%
+13% D improvement
(Updated on July 23, 2013)
Average all 32 states: Hillary vs Best Republican: D +0.5%
+2.2% D improvement (from Obama 2012) [projecting a 6.0% victory for Hillary]
Giving us this map:
()
Red = Democratic lead/trend
Blue = Republican lead/trend
Green = Tied or no trend
Grey = No polling yet
Green = toss up or less than 0.5% lead
20% shade = 0.6-2% lead
30% shade = 2.1-4% lead
40% shade = 4.1-6% lead
50% shade = 6.1-9% lead
60% shade = 9.1-12% lead
70% shade = 12.1-15% lead
80% shade = 15.1-18% lead
90% shade = Above 18.1% lead
In the count of electoral votes, the current situation looks like this:
Hillary: 268 EVs (in 18 states)
Best/Tailormade Republican: 131 EVs (in 14 states)
Toss-up: None
No polling: 139 EVs (in 18 states + D.C.)
So far, Hillary has captured an impressive 67.2% of all EVs awarded, against only 32.8% EVs for the tailormade Republican.
This is how the Trendline Map looks so far:
()
The states which right now are showing the strongest improvement for the Democratic (Hillary) or the Republican candidate (in 11 out of 32 cases, Christie is that person):
1. Kentucky: D +18.2%
2. Arkansas: D +14.2%
3. Kansas: D +14.1%
4. California: R +14%
5. Louisiana: D +14%
6. West Virginia: D +13%
7. Wyoming: D +13%
8. New Jersey: R +9.1%
9. Colorado: R +8.9%
10. Arizona: D +8%
11. Texas: D +8%
12. Connecticut: R +8%
13. Maine: R +7%
14. Georgia: D +6%
15. Alaska: D +6%
16. Florida: D +4.6%
17. Mississippi: D +4.5%
All of these changes (in the 17 states above) are statistically significant, though there are HUGE question marks concerning California.
The whole list of states having been polled till now, going from Democratic stronghold to Republican stronghold:
New York: D +24.6%
New Mexico: D +14%
Oregon: D +12%
California: D +9%
Connecticut: D +9%
New Jersey: D +8.7%
Maine: D +8%
Michigan: D +6.9%
Ohio: D +6.7%
Currently estimated/projected national average: D +6.0%
Minnesota: D +6%
Florida: D +5.5%
Wisconsin: D +4.1%
Iowa: D +3.9%
Virginia: D +3.6%
Pennsylvania: D +3.5%
Nevada: D +3%
New Hampshire: D +2.1%
North Carolina: D +1.6%
Arizona: R +1%
Georgia: R +2%
Louisiana: R +3%
Colorado: R +3.5%
Kentucky: R +4.5%
Mississippi: R +7%
South Carolina: R +7%
Kansas: R +7.5%
Alaska: R +8%
Texas: R +8%
Arkansas: R +9.5%
Montana: R +13%
West Virginia: R +14%
Wyoming: R +28%
The best-tailored Republican candidates in all states polled so far:
1. Chris Christie favoured in 11 of 32 states (for 151 EVs)
2. Rand Paul favoured in 5 states (California, Oregon (shared), Nevada, Montana & Alaska - for 74 EVs)
3. Mike Huckabee favoured in 6 states (Texas (!), Louisiana (!), Oregon (shared), Arkansas, Mississippi & New Hampshire (!) - for 69 EVs)
4. Jeb Bush favoured in 5 states (Florida, Arizona, Kentucky (!), Kansas & West Virginia - for 59 EVs)
5. Paul Ryan favoured in 2 states (Wisconsin & Colorado - for 19 EVs)
6. Tim Pawlenty favoured in 1 state (Minnesota - for 10 EVs)
7. Marco Rubio favoured in 1 state (South Carolina - for 9 EVs)
8. Ben Carson favoured in 1 state (Connecticut - for 7 EVs)
9. Susana Martinez favoured in 1 state (New Mexico - for 5 EVs)
Current update as of September 9.
Vs Christie: D+6.9% (8 polls, improvement of +0.8%)
Vs Paul Ryan: D+7% (2 polls)
Vs Bush: D+10% (5 polls)
Vs Rand Paul: D+10.5% (6 polls)
Vs Huckabee: D+12% (3 polls)
Vs Rubio: D+15.5% (2 polls)
The total number of state polls included below has now reached 166.
The 2016 poll averages for each state - 32 states right now - and the change from the actual 2012 outcomes. Only the Republican candidate with the best statewide polling included.
Alaska: Hillary vs Rand Paul: R +8%
+6% D improvement
(Updated on August 12, 2014)
Arizona: Hillary vs Bush: R +1%
+8% D improvement
(Updated on March 6, 2014)
Arkansas: Hillary vs Mike Huckabee: R +9.5%
+14.2% D improvement
(Updated on August 11, 2014)
California: Hillary vs Rand Paul: D +9%
+14% R improvement
(Updated on August 1, 2014)
Colorado: Hillary vs Paul Ryan: R +3.5%
+8.9% R improvement
Current Republican gain
(Updated on July 29, 2014)
Connecticut: Hillary vs Ben Carson: D +9%
+8% R improvement
(Updated on August 11, 2014)
Florida: Hillary vs Bush: D +5.5%
+4.6% D improvement
(Updated on September 3, 2014)
Georgia: Hillary vs Christie: R +2%
+6% D improvement
(Updated August 8, 2013)
Iowa: Hillary vs Christie: D +3.9%
+1.9% R improvement
(Updated on July 17, 2014)
Kansas: Hillary vs Bush: R +7.5%
+14.1% D improvement
(Updated on August 22, 2014)
Kentucky: Hillary vs Bush: R +4.5%
+18.2% D improvement
(Updated on August 13, 2014)
Louisiana: Hillary vs Huckabee: R +3%
+14% D improvement
(Updated on July 12, 2014)
Maine: Hillary vs Christie: D +8%
+7% R improvement
(Updated on November 13, 2013)
Michigan: Hillary vs Christie: D +6.9%
+2.6% R improvement
(Updated on September 9, 2014)
Minnesota: Hillary vs Tim Pawlenty: D +6%
+2% R improvement
(Updated on June 18, 2014)
Mississippi: Hillary vs Huckabee: R +7%
+4.5% D improvement
(Updated on July 20, 2014)
Montana: Hillary vs Rand Paul: R +13% (Brian Schweitzer vs Rand Paul: R +8%)
+1% D improvement
(Updated on July 23, 2014)
Nevada: Hillary vs Rand Paul: D +3%
+4% R improvement
(Updated on July 31, 2014)
New Hampshire: Hillary vs Huckabee: D +2.1%
+3.5% R improvement
(Updated on July 17, 2014)
New Jersey: Hillary vs Christie: D +8.7%
+9.1% R improvement
(Updated on August 13, 2014)
New Mexico: Hillary vs Susana Martinez: D +14%
+4% D improvement
(Updated on March 27, 2014)
New York: Hillary vs Christie: D +24.6%
+3.6% R improvement
(Updated on August 21, 2014)
North Carolina: Hillary vs Christie: D +1.6%
+3.6% D improvement
Current Democratic gain
(Updated on August 20, 2014)
Ohio: Hillary vs Christie: D +6.7%
+3.7% D improvement
(Updated on July 31, 2014)
Oregon: Hillary vs Rand Paul/Huckabee: D +12%
Unchanged from 2012
(Updated on May 30, 2014)
Pennsylvania: Hillary vs Christie: D +3.5%
+1.9% R improvement
(Updated on June 5, 2014)
South Carolina: Hillary vs Marco Rubio: R +7%
+3.5% D improvement
(Updated on November 2, 2013)
Texas: Hillary vs Huckabee: R +8%
+8% D improvement
(Updated on April 18, 2014)
Virginia: Hillary vs Christie: D +3.64%
+0.2% R improvement
(Updated on July 23, 2014)
West Virginia: Hillary vs Bush: R +14%
+13% D improvement
(Updated on October 1, 2013)
Wisconsin: Hillary vs Ryan: D +4.1%
+2.8% R improvement
(Updated on August 5, 2014)
Wyoming: Hillary vs Christie: R +28%
+13% D improvement
(Updated on July 23, 2013)
Average all 32 states: Hillary vs Best Republican: D +0.5%
+2.2% D improvement (from Obama 2012) [projecting a 6.0% victory for Hillary]
Giving us this map:
(
Red = Democratic lead/trend
Blue = Republican lead/trend
Green = Tied or no trend
Grey = No polling yet
Green = toss up or less than 0.5% lead
20% shade = 0.6-2% lead
30% shade = 2.1-4% lead
40% shade = 4.1-6% lead
50% shade = 6.1-9% lead
60% shade = 9.1-12% lead
70% shade = 12.1-15% lead
80% shade = 15.1-18% lead
90% shade = Above 18.1% lead
In the count of electoral votes, the current situation looks like this:
Hillary: 268 EVs (in 18 states)
Best/Tailormade Republican: 131 EVs (in 14 states)
Toss-up: None
No polling: 139 EVs (in 18 states + D.C.)
So far, Hillary has captured an impressive 67.2% of all EVs awarded, against only 32.8% EVs for the tailormade Republican.
This is how the Trendline Map looks so far:
(
The states which right now are showing the strongest improvement for the Democratic (Hillary) or the Republican candidate (in 11 out of 32 cases, Christie is that person):
1. Kentucky: D +18.2%
2. Arkansas: D +14.2%
3. Kansas: D +14.1%
4. California: R +14%
5. Louisiana: D +14%
6. West Virginia: D +13%
7. Wyoming: D +13%
8. New Jersey: R +9.1%
9. Colorado: R +8.9%
10. Arizona: D +8%
11. Texas: D +8%
12. Connecticut: R +8%
13. Maine: R +7%
14. Georgia: D +6%
15. Alaska: D +6%
16. Florida: D +4.6%
17. Mississippi: D +4.5%
All of these changes (in the 17 states above) are statistically significant, though there are HUGE question marks concerning California.
The whole list of states having been polled till now, going from Democratic stronghold to Republican stronghold:
New York: D +24.6%
New Mexico: D +14%
Oregon: D +12%
California: D +9%
Connecticut: D +9%
New Jersey: D +8.7%
Maine: D +8%
Michigan: D +6.9%
Ohio: D +6.7%
Currently estimated/projected national average: D +6.0%
Minnesota: D +6%
Florida: D +5.5%
Wisconsin: D +4.1%
Iowa: D +3.9%
Virginia: D +3.6%
Pennsylvania: D +3.5%
Nevada: D +3%
New Hampshire: D +2.1%
North Carolina: D +1.6%
Arizona: R +1%
Georgia: R +2%
Louisiana: R +3%
Colorado: R +3.5%
Kentucky: R +4.5%
Mississippi: R +7%
South Carolina: R +7%
Kansas: R +7.5%
Alaska: R +8%
Texas: R +8%
Arkansas: R +9.5%
Montana: R +13%
West Virginia: R +14%
Wyoming: R +28%
The best-tailored Republican candidates in all states polled so far:
1. Chris Christie favoured in 11 of 32 states (for 151 EVs)
2. Rand Paul favoured in 5 states (California, Oregon (shared), Nevada, Montana & Alaska - for 74 EVs)
3. Mike Huckabee favoured in 6 states (Texas (!), Louisiana (!), Oregon (shared), Arkansas, Mississippi & New Hampshire (!) - for 69 EVs)
4. Jeb Bush favoured in 5 states (Florida, Arizona, Kentucky (!), Kansas & West Virginia - for 59 EVs)
5. Paul Ryan favoured in 2 states (Wisconsin & Colorado - for 19 EVs)
6. Tim Pawlenty favoured in 1 state (Minnesota - for 10 EVs)
7. Marco Rubio favoured in 1 state (South Carolina - for 9 EVs)
8. Ben Carson favoured in 1 state (Connecticut - for 7 EVs)
9. Susana Martinez favoured in 1 state (New Mexico - for 5 EVs)
Current update as of September 9.
Title: Re: 2016 Official Polling Map Thread
Post by: pbrower2a on September 09, 2014, 03:03:08 PM
Michigan, PPP.
http://www.publicpolicypolling.com/main/2014/09/peters-has-biggest-lead-snyder-and-schauer-tight.html#more
Michigan is nowhere close to being close for the 2016 Presidential election.
Hillary Clinton vs. Jeb Bush
()
Hillary Clinton vs. Chris Christie
()
Hillary Clinton vs. Mike Huckabee
( )
)
Hillary Clinton vs. Rand Paul
()
blue, Republican -- red, Democratic
30% -- lead with 40-49% but a margin of 3% or less
40% -- lead with 40-49% but a margin of 4% or more
60% -- lead with 50-54%
70% -- lead with 55-59%
90% -- lead with 60% or more
Quote
If Hillary Clinton is the Democratic nominee for President in 2016 it appears the state will remain safely blue. She has double digit advantages over all of her potential Republican opponents- 49/39 over Rand Paul, 49/38 over Jeb Bush, 48/36 over Chris Christie, 50/38 over Mike Huckabee, and 51/37 over Ted Cruz.
http://www.publicpolicypolling.com/main/2014/09/peters-has-biggest-lead-snyder-and-schauer-tight.html#more
Michigan is nowhere close to being close for the 2016 Presidential election.
Hillary Clinton vs. Jeb Bush
(
Hillary Clinton vs. Chris Christie
(
Hillary Clinton vs. Mike Huckabee
(
Hillary Clinton vs. Rand Paul
(
blue, Republican -- red, Democratic
30% -- lead with 40-49% but a margin of 3% or less
40% -- lead with 40-49% but a margin of 4% or more
60% -- lead with 50-54%
70% -- lead with 55-59%
90% -- lead with 60% or more
Title: Re: 2016 Official Polling Map Thread
Post by: eric82oslo on September 09, 2014, 07:18:49 PM
PPP is hot as fire today and as a consequence has released its 2nd 2016 poll of the day, this time in Florida. Regardless of pollsters, this happens to be the 19th Florida poll on the 2016 race. It shows a fairly decent result for Bush, and it's certainly not as great news for Hillary as the just released Michigan poll. New averages versus Hillary in Florida now look like this:
Vs Bush: D +5.3% (14 polls, down by 0.2%)
Vs Romney: D +7%
Vs Rubio: D +9.7% (15 polls)
Vs Perry: D +10%
Vs Rand Paul: D +11.2% (9 polls)
Vs Paul Ryan: D +11.2% (6 polls)
Vs Huckabee: D +11.3% (3 polls)
Vs Christie: D +11.6% (8 polls)
Vs Cruz: D +17.3% (6 polls)
The total number of state polls included below has now reached 167.
The 2016 poll averages for each state - 32 states right now - and the change from the actual 2012 outcomes. Only the Republican candidate with the best statewide polling included.
Alaska: Hillary vs Rand Paul: R +8%
+6% D improvement
(Updated on August 12, 2014)
Arizona: Hillary vs Bush: R +1%
+8% D improvement
(Updated on March 6, 2014)
Arkansas: Hillary vs Mike Huckabee: R +9.5%
+14.2% D improvement
(Updated on August 11, 2014)
California: Hillary vs Rand Paul: D +9%
+14% R improvement
(Updated on August 1, 2014)
Colorado: Hillary vs Paul Ryan: R +3.5%
+8.9% R improvement
Current Republican gain
(Updated on July 29, 2014)
Connecticut: Hillary vs Ben Carson: D +9%
+8% R improvement
(Updated on August 11, 2014)
Florida: Hillary vs Bush: D +5.3%
+4.4% D improvement
(Updated on September 10, 2014)
Georgia: Hillary vs Christie: R +2%
+6% D improvement
(Updated August 8, 2013)
Iowa: Hillary vs Christie: D +3.9%
+1.9% R improvement
(Updated on July 17, 2014)
Kansas: Hillary vs Bush: R +7.5%
+14.1% D improvement
(Updated on August 22, 2014)
Kentucky: Hillary vs Bush: R +4.5%
+18.2% D improvement
(Updated on August 13, 2014)
Louisiana: Hillary vs Huckabee: R +3%
+14% D improvement
(Updated on July 12, 2014)
Maine: Hillary vs Christie: D +8%
+7% R improvement
(Updated on November 13, 2013)
Michigan: Hillary vs Christie: D +6.9%
+2.6% R improvement
(Updated on September 9, 2014)
Minnesota: Hillary vs Tim Pawlenty: D +6%
+2% R improvement
(Updated on June 18, 2014)
Mississippi: Hillary vs Huckabee: R +7%
+4.5% D improvement
(Updated on July 20, 2014)
Montana: Hillary vs Rand Paul: R +13% (Brian Schweitzer vs Rand Paul: R +8%)
+1% D improvement
(Updated on July 23, 2014)
Nevada: Hillary vs Rand Paul: D +3%
+4% R improvement
(Updated on July 31, 2014)
New Hampshire: Hillary vs Huckabee: D +2.1%
+3.5% R improvement
(Updated on July 17, 2014)
New Jersey: Hillary vs Christie: D +8.7%
+9.1% R improvement
(Updated on August 13, 2014)
New Mexico: Hillary vs Susana Martinez: D +14%
+4% D improvement
(Updated on March 27, 2014)
New York: Hillary vs Christie: D +24.6%
+3.6% R improvement
(Updated on August 21, 2014)
North Carolina: Hillary vs Christie: D +1.6%
+3.6% D improvement
Current Democratic gain
(Updated on August 20, 2014)
Ohio: Hillary vs Christie: D +6.7%
+3.7% D improvement
(Updated on July 31, 2014)
Oregon: Hillary vs Rand Paul/Huckabee: D +12%
Unchanged from 2012
(Updated on May 30, 2014)
Pennsylvania: Hillary vs Christie: D +3.5%
+1.9% R improvement
(Updated on June 5, 2014)
South Carolina: Hillary vs Marco Rubio: R +7%
+3.5% D improvement
(Updated on November 2, 2013)
Texas: Hillary vs Huckabee: R +8%
+8% D improvement
(Updated on April 18, 2014)
Virginia: Hillary vs Christie: D +3.64%
+0.2% R improvement
(Updated on July 23, 2014)
West Virginia: Hillary vs Bush: R +14%
+13% D improvement
(Updated on October 1, 2013)
Wisconsin: Hillary vs Ryan: D +4.1%
+2.8% R improvement
(Updated on August 5, 2014)
Wyoming: Hillary vs Christie: R +28%
+13% D improvement
(Updated on July 23, 2013)
Average all 32 states: Hillary vs Best Republican: D +0.5%
+2.2% D improvement (from Obama 2012) [projecting a 6.0% victory for Hillary]
Giving us this map:
()
Red = Democratic lead/trend
Blue = Republican lead/trend
Green = Tied or no trend
Grey = No polling yet
Green = toss up or less than 0.5% lead
20% shade = 0.6-2% lead
30% shade = 2.1-4% lead
40% shade = 4.1-6% lead
50% shade = 6.1-9% lead
60% shade = 9.1-12% lead
70% shade = 12.1-15% lead
80% shade = 15.1-18% lead
90% shade = Above 18.1% lead
In the count of electoral votes, the current situation looks like this:
Hillary: 268 EVs (in 18 states)
Best/Tailormade Republican: 131 EVs (in 14 states)
Toss-up: None
No polling: 139 EVs (in 18 states + D.C.)
So far, Hillary has captured an impressive 67.2% of all EVs awarded, against only 32.8% EVs for the tailormade Republican.
This is how the Trendline Map looks so far:
()
The states which right now are showing the strongest improvement for the Democratic (Hillary) or the Republican candidate (in 11 out of 32 cases, Christie is that person):
1. Kentucky: D +18.2%
2. Arkansas: D +14.2%
3. Kansas: D +14.1%
4. California: R +14%
5. Louisiana: D +14%
6. West Virginia: D +13%
7. Wyoming: D +13%
8. New Jersey: R +9.1%
9. Colorado: R +8.9%
10. Arizona: D +8%
11. Texas: D +8%
12. Connecticut: R +8%
13. Maine: R +7%
14. Georgia: D +6%
15. Alaska: D +6%
16. Mississippi: D +4.5%
17. Florida: D +4.4%
All of these changes (in the 17 states above) are statistically significant, though there are HUGE question marks concerning California.
The whole list of states having been polled till now, going from Democratic stronghold to Republican stronghold:
New York: D +24.6%
New Mexico: D +14%
Oregon: D +12%
California: D +9%
Connecticut: D +9%
New Jersey: D +8.7%
Maine: D +8%
Michigan: D +6.9%
Ohio: D +6.7%
Currently estimated/projected national average: D +6.0%
Minnesota: D +6%
Florida: D +5.3%
Wisconsin: D +4.1%
Iowa: D +3.9%
Virginia: D +3.6%
Pennsylvania: D +3.5%
Nevada: D +3%
New Hampshire: D +2.1%
North Carolina: D +1.6%
Arizona: R +1%
Georgia: R +2%
Louisiana: R +3%
Colorado: R +3.5%
Kentucky: R +4.5%
Mississippi: R +7%
South Carolina: R +7%
Kansas: R +7.5%
Alaska: R +8%
Texas: R +8%
Arkansas: R +9.5%
Montana: R +13%
West Virginia: R +14%
Wyoming: R +28%
The best-tailored Republican candidates in all states polled so far:
1. Chris Christie favoured in 11 of 32 states (for 151 EVs)
2. Rand Paul favoured in 5 states (California, Oregon (shared), Nevada, Montana & Alaska - for 74 EVs)
3. Mike Huckabee favoured in 6 states (Texas (!), Louisiana (!), Oregon (shared), Arkansas, Mississippi & New Hampshire (!) - for 69 EVs)
4. Jeb Bush favoured in 5 states (Florida, Arizona, Kentucky (!), Kansas & West Virginia - for 59 EVs)
5. Paul Ryan favoured in 2 states (Wisconsin & Colorado - for 19 EVs)
6. Tim Pawlenty favoured in 1 state (Minnesota - for 10 EVs)
7. Marco Rubio favoured in 1 state (South Carolina - for 9 EVs)
8. Ben Carson favoured in 1 state (Connecticut - for 7 EVs)
9. Susana Martinez favoured in 1 state (New Mexico - for 5 EVs)
Current update as of September 10.
Vs Bush: D +5.3% (14 polls, down by 0.2%)
Vs Romney: D +7%
Vs Rubio: D +9.7% (15 polls)
Vs Perry: D +10%
Vs Rand Paul: D +11.2% (9 polls)
Vs Paul Ryan: D +11.2% (6 polls)
Vs Huckabee: D +11.3% (3 polls)
Vs Christie: D +11.6% (8 polls)
Vs Cruz: D +17.3% (6 polls)
The total number of state polls included below has now reached 167.
The 2016 poll averages for each state - 32 states right now - and the change from the actual 2012 outcomes. Only the Republican candidate with the best statewide polling included.
Alaska: Hillary vs Rand Paul: R +8%
+6% D improvement
(Updated on August 12, 2014)
Arizona: Hillary vs Bush: R +1%
+8% D improvement
(Updated on March 6, 2014)
Arkansas: Hillary vs Mike Huckabee: R +9.5%
+14.2% D improvement
(Updated on August 11, 2014)
California: Hillary vs Rand Paul: D +9%
+14% R improvement
(Updated on August 1, 2014)
Colorado: Hillary vs Paul Ryan: R +3.5%
+8.9% R improvement
Current Republican gain
(Updated on July 29, 2014)
Connecticut: Hillary vs Ben Carson: D +9%
+8% R improvement
(Updated on August 11, 2014)
Florida: Hillary vs Bush: D +5.3%
+4.4% D improvement
(Updated on September 10, 2014)
Georgia: Hillary vs Christie: R +2%
+6% D improvement
(Updated August 8, 2013)
Iowa: Hillary vs Christie: D +3.9%
+1.9% R improvement
(Updated on July 17, 2014)
Kansas: Hillary vs Bush: R +7.5%
+14.1% D improvement
(Updated on August 22, 2014)
Kentucky: Hillary vs Bush: R +4.5%
+18.2% D improvement
(Updated on August 13, 2014)
Louisiana: Hillary vs Huckabee: R +3%
+14% D improvement
(Updated on July 12, 2014)
Maine: Hillary vs Christie: D +8%
+7% R improvement
(Updated on November 13, 2013)
Michigan: Hillary vs Christie: D +6.9%
+2.6% R improvement
(Updated on September 9, 2014)
Minnesota: Hillary vs Tim Pawlenty: D +6%
+2% R improvement
(Updated on June 18, 2014)
Mississippi: Hillary vs Huckabee: R +7%
+4.5% D improvement
(Updated on July 20, 2014)
Montana: Hillary vs Rand Paul: R +13% (Brian Schweitzer vs Rand Paul: R +8%)
+1% D improvement
(Updated on July 23, 2014)
Nevada: Hillary vs Rand Paul: D +3%
+4% R improvement
(Updated on July 31, 2014)
New Hampshire: Hillary vs Huckabee: D +2.1%
+3.5% R improvement
(Updated on July 17, 2014)
New Jersey: Hillary vs Christie: D +8.7%
+9.1% R improvement
(Updated on August 13, 2014)
New Mexico: Hillary vs Susana Martinez: D +14%
+4% D improvement
(Updated on March 27, 2014)
New York: Hillary vs Christie: D +24.6%
+3.6% R improvement
(Updated on August 21, 2014)
North Carolina: Hillary vs Christie: D +1.6%
+3.6% D improvement
Current Democratic gain
(Updated on August 20, 2014)
Ohio: Hillary vs Christie: D +6.7%
+3.7% D improvement
(Updated on July 31, 2014)
Oregon: Hillary vs Rand Paul/Huckabee: D +12%
Unchanged from 2012
(Updated on May 30, 2014)
Pennsylvania: Hillary vs Christie: D +3.5%
+1.9% R improvement
(Updated on June 5, 2014)
South Carolina: Hillary vs Marco Rubio: R +7%
+3.5% D improvement
(Updated on November 2, 2013)
Texas: Hillary vs Huckabee: R +8%
+8% D improvement
(Updated on April 18, 2014)
Virginia: Hillary vs Christie: D +3.64%
+0.2% R improvement
(Updated on July 23, 2014)
West Virginia: Hillary vs Bush: R +14%
+13% D improvement
(Updated on October 1, 2013)
Wisconsin: Hillary vs Ryan: D +4.1%
+2.8% R improvement
(Updated on August 5, 2014)
Wyoming: Hillary vs Christie: R +28%
+13% D improvement
(Updated on July 23, 2013)
Average all 32 states: Hillary vs Best Republican: D +0.5%
+2.2% D improvement (from Obama 2012) [projecting a 6.0% victory for Hillary]
Giving us this map:
(
Red = Democratic lead/trend
Blue = Republican lead/trend
Green = Tied or no trend
Grey = No polling yet
Green = toss up or less than 0.5% lead
20% shade = 0.6-2% lead
30% shade = 2.1-4% lead
40% shade = 4.1-6% lead
50% shade = 6.1-9% lead
60% shade = 9.1-12% lead
70% shade = 12.1-15% lead
80% shade = 15.1-18% lead
90% shade = Above 18.1% lead
In the count of electoral votes, the current situation looks like this:
Hillary: 268 EVs (in 18 states)
Best/Tailormade Republican: 131 EVs (in 14 states)
Toss-up: None
No polling: 139 EVs (in 18 states + D.C.)
So far, Hillary has captured an impressive 67.2% of all EVs awarded, against only 32.8% EVs for the tailormade Republican.
This is how the Trendline Map looks so far:
(
The states which right now are showing the strongest improvement for the Democratic (Hillary) or the Republican candidate (in 11 out of 32 cases, Christie is that person):
1. Kentucky: D +18.2%
2. Arkansas: D +14.2%
3. Kansas: D +14.1%
4. California: R +14%
5. Louisiana: D +14%
6. West Virginia: D +13%
7. Wyoming: D +13%
8. New Jersey: R +9.1%
9. Colorado: R +8.9%
10. Arizona: D +8%
11. Texas: D +8%
12. Connecticut: R +8%
13. Maine: R +7%
14. Georgia: D +6%
15. Alaska: D +6%
16. Mississippi: D +4.5%
17. Florida: D +4.4%
All of these changes (in the 17 states above) are statistically significant, though there are HUGE question marks concerning California.
The whole list of states having been polled till now, going from Democratic stronghold to Republican stronghold:
New York: D +24.6%
New Mexico: D +14%
Oregon: D +12%
California: D +9%
Connecticut: D +9%
New Jersey: D +8.7%
Maine: D +8%
Michigan: D +6.9%
Ohio: D +6.7%
Currently estimated/projected national average: D +6.0%
Minnesota: D +6%
Florida: D +5.3%
Wisconsin: D +4.1%
Iowa: D +3.9%
Virginia: D +3.6%
Pennsylvania: D +3.5%
Nevada: D +3%
New Hampshire: D +2.1%
North Carolina: D +1.6%
Arizona: R +1%
Georgia: R +2%
Louisiana: R +3%
Colorado: R +3.5%
Kentucky: R +4.5%
Mississippi: R +7%
South Carolina: R +7%
Kansas: R +7.5%
Alaska: R +8%
Texas: R +8%
Arkansas: R +9.5%
Montana: R +13%
West Virginia: R +14%
Wyoming: R +28%
The best-tailored Republican candidates in all states polled so far:
1. Chris Christie favoured in 11 of 32 states (for 151 EVs)
2. Rand Paul favoured in 5 states (California, Oregon (shared), Nevada, Montana & Alaska - for 74 EVs)
3. Mike Huckabee favoured in 6 states (Texas (!), Louisiana (!), Oregon (shared), Arkansas, Mississippi & New Hampshire (!) - for 69 EVs)
4. Jeb Bush favoured in 5 states (Florida, Arizona, Kentucky (!), Kansas & West Virginia - for 59 EVs)
5. Paul Ryan favoured in 2 states (Wisconsin & Colorado - for 19 EVs)
6. Tim Pawlenty favoured in 1 state (Minnesota - for 10 EVs)
7. Marco Rubio favoured in 1 state (South Carolina - for 9 EVs)
8. Ben Carson favoured in 1 state (Connecticut - for 7 EVs)
9. Susana Martinez favoured in 1 state (New Mexico - for 5 EVs)
Current update as of September 10.
Title: Re: 2016 Official Polling Map Thread
Post by: pbrower2a on September 10, 2014, 07:17:54 AM
Quote
Hillary Clinton leads the entire GOP field for President in Florida, although a match up with Jeb Bush would be very close with Clinton holding only a 46/44 advantage. She leads by at least 7 points over the rest of the GOP field- it's 49/42 over Marco Rubio, 46/38 over Chris Christie, 48/40 over Rand Paul, 49/40 over Mike Huckabee, and 51/36 over Ted Cruz.
PPP surveyed 818 likely voters from September 4th to 7th. The margin of error for the survey is
+/- 3.4%. 80% of interviews for the poll were conducted over the phone with 20% interviewed
over the internet to reach respondent s who dont have landline telephones.
PPP surveyed 818 likely voters from September 4th to 7th. The margin of error for the survey is
+/- 3.4%. 80% of interviews for the poll were conducted over the phone with 20% interviewed
over the internet to reach respondent s who dont have landline telephones.
http://www.publicpolicypolling.com/pdf/2014/PPP_Release_FL_909704.pdf
Mid-week poll, which could distort things some from the usual weekend poll; it might catch fewer working people than a weekend poll. Not as strong as the recent Q poll (which I did not believe or show in my maps) in Florida, but bad news for all Republicans trying to succeed President Obama. Jeb Bush, who would probably have been a better President than his brother, would need to win Florida fair-and-square -- especially if Charlie Crist is Governor. He would have a significant edge in Florida over any other possible R nominee, but most likely not enough of an edge. Hillary Clinton could still be elected President without Florida, but no Republican can be elected President without Florida.
Hillary Clinton vs. Jeb Bush
(
Hillary Clinton vs. Chris Christie
(
Hillary Clinton vs. Mike Huckabee
(
Hillary Clinton vs. Rand Paul
(
blue, Republican -- red, Democratic
30% -- lead with 40-49% but a margin of 3% or less
40% -- lead with 40-49% but a margin of 4% or more
60% -- lead with 50-54%
70% -- lead with 55-59%
90% -- lead with 60% or more
Title: Re: 2016 Official Polling Map Thread
Post by: Mr. Morden on September 10, 2014, 07:37:09 AM
Quote
Hillary Clinton leads the entire GOP field for President in Florida, although a match up with Jeb Bush would be very close with Clinton holding only a 46/44 advantage. She leads by at least 7 points over the rest of the GOP field- it's 49/42 over Marco Rubio, 46/38 over Chris Christie, 48/40 over Rand Paul, 49/40 over Mike Huckabee, and 51/36 over Ted Cruz.
PPP surveyed 818 likely voters from September 4th to 7th. The margin of error for the survey is
+/- 3.4%. 80% of interviews for the poll were conducted over the phone with 20% interviewed
over the internet to reach respondent s who dont have landline telephones.
PPP surveyed 818 likely voters from September 4th to 7th. The margin of error for the survey is
+/- 3.4%. 80% of interviews for the poll were conducted over the phone with 20% interviewed
over the internet to reach respondent s who dont have landline telephones.
http://www.publicpolicypolling.com/pdf/2014/PPP_Release_FL_909704.pdf
Mid-week poll, which could distort things some from the usual weekend poll; it might catch fewer working people than a weekend poll.
How is Sept. 4th-7th "mid-week"?
Title: Re: 2016 Official Polling Map Thread
Post by: Flake on September 10, 2014, 01:55:22 PM
I really wish the color coding would be consistent.
Title: Re: 2016 Official Polling Map Thread
Post by: pbrower2a on September 10, 2014, 08:46:16 PM
Quote
Hillary Clinton leads the entire GOP field for President in Florida, although a match up with Jeb Bush would be very close with Clinton holding only a 46/44 advantage. She leads by at least 7 points over the rest of the GOP field- it's 49/42 over Marco Rubio, 46/38 over Chris Christie, 48/40 over Rand Paul, 49/40 over Mike Huckabee, and 51/36 over Ted Cruz.
PPP surveyed 818 likely voters from September 4th to 7th. The margin of error for the survey is
+/- 3.4%. 80% of interviews for the poll were conducted over the phone with 20% interviewed
over the internet to reach respondent s who dont have landline telephones.
PPP surveyed 818 likely voters from September 4th to 7th. The margin of error for the survey is
+/- 3.4%. 80% of interviews for the poll were conducted over the phone with 20% interviewed
over the internet to reach respondent s who dont have landline telephones.
http://www.publicpolicypolling.com/pdf/2014/PPP_Release_FL_909704.pdf
Mid-week poll, which could distort things some from the usual weekend poll; it might catch fewer working people than a weekend poll.
How is Sept. 4th-7th "mid-week"?
Whoops -- not strictly a weekend poll.
Title: Re: 2016 Official Polling Map Thread
Post by: pbrower2a on September 10, 2014, 08:57:59 PM
I really wish the color coding would be consistent.
Eric and I are measuring different things.
1. He has maps for swings, which I do not have.
2. He is averaging polls; I do not average polls unless the polls are within a week from each other. I normally replace polls with new ones.
3. I reject polls that seem grossly out of line (unless someone corroborates them) and any in which someone leads with less than 40% of the vote. Thus I have no poll from New Hampshire, the poll that Eric accepted being something like a 38-37 poll.
4. Check the legends on any maps that either of us make.
Title: Re: 2016 Official Polling Map Thread
Post by: eric82oslo on September 11, 2014, 09:38:07 AM
Today, thanks to Fairleigh Dickinson University, we got our 11th poll of the 2016 season from the most densely populated of US states, New Jersey. It includes some splendid news for their Governor Christie, both as he only trails Hillary with 3%, as well as him doing far better than his competitors Rand Paul & Bush (trailing by 15% & 19%). Here are the new NJ averages against Clinton:
Vs Christie: D +8.25% (12 polls, an improvement of 0.5%!)
Vs Bush: D +19.5% (2 polls)
Vs Rand Paul: D +20.25% (4 polls)
Vs Huckabee: D +23%
Vs Cruz: D +23%
Vs Paul Ryan: D +25%
Is Christie starting to rebounce already in the polls? Most such improvements usually starts closest to home.
The total number of state polls included below has now reached 168.
The 2016 poll averages for each state - 32 states right now - and the change from the actual 2012 outcomes. Only the Republican candidate with the best statewide polling included.
Alaska: Hillary vs Rand Paul: R +8%
+6% D improvement
(Updated on August 12, 2014)
Arizona: Hillary vs Bush: R +1%
+8% D improvement
(Updated on March 6, 2014)
Arkansas: Hillary vs Mike Huckabee: R +9.5%
+14.2% D improvement
(Updated on August 11, 2014)
California: Hillary vs Rand Paul: D +9%
+14% R improvement
(Updated on August 1, 2014)
Colorado: Hillary vs Paul Ryan: R +3.5%
+8.9% R improvement
Current Republican gain
(Updated on July 29, 2014)
Connecticut: Hillary vs Ben Carson: D +9%
+8% R improvement
(Updated on August 11, 2014)
Florida: Hillary vs Bush: D +5.3%
+4.4% D improvement
(Updated on September 10, 2014)
Georgia: Hillary vs Christie: R +2%
+6% D improvement
(Updated August 8, 2013)
Iowa: Hillary vs Christie: D +3.9%
+1.9% R improvement
(Updated on July 17, 2014)
Kansas: Hillary vs Bush: R +7.5%
+14.1% D improvement
(Updated on August 22, 2014)
Kentucky: Hillary vs Bush: R +4.5%
+18.2% D improvement
(Updated on August 13, 2014)
Louisiana: Hillary vs Huckabee: R +3%
+14% D improvement
(Updated on July 12, 2014)
Maine: Hillary vs Christie: D +8%
+7% R improvement
(Updated on November 13, 2013)
Michigan: Hillary vs Christie: D +6.9%
+2.6% R improvement
(Updated on September 9, 2014)
Minnesota: Hillary vs Tim Pawlenty: D +6%
+2% R improvement
(Updated on June 18, 2014)
Mississippi: Hillary vs Huckabee: R +7%
+4.5% D improvement
(Updated on July 20, 2014)
Montana: Hillary vs Rand Paul: R +13% (Brian Schweitzer vs Rand Paul: R +8%)
+1% D improvement
(Updated on July 23, 2014)
Nevada: Hillary vs Rand Paul: D +3%
+4% R improvement
(Updated on July 31, 2014)
New Hampshire: Hillary vs Huckabee: D +2.1%
+3.5% R improvement
(Updated on July 17, 2014)
New Jersey: Hillary vs Christie: D +8.25%
+9.5% R improvement
(Updated on September 11, 2014)
New Mexico: Hillary vs Susana Martinez: D +14%
+4% D improvement
(Updated on March 27, 2014)
New York: Hillary vs Christie: D +24.6%
+3.6% R improvement
(Updated on August 21, 2014)
North Carolina: Hillary vs Christie: D +1.6%
+3.6% D improvement
Current Democratic gain
(Updated on August 20, 2014)
Ohio: Hillary vs Christie: D +6.7%
+3.7% D improvement
(Updated on July 31, 2014)
Oregon: Hillary vs Rand Paul/Huckabee: D +12%
Unchanged from 2012
(Updated on May 30, 2014)
Pennsylvania: Hillary vs Christie: D +3.5%
+1.9% R improvement
(Updated on June 5, 2014)
South Carolina: Hillary vs Marco Rubio: R +7%
+3.5% D improvement
(Updated on November 2, 2013)
Texas: Hillary vs Huckabee: R +8%
+8% D improvement
(Updated on April 18, 2014)
Virginia: Hillary vs Christie: D +3.64%
+0.2% R improvement
(Updated on July 23, 2014)
West Virginia: Hillary vs Bush: R +14%
+13% D improvement
(Updated on October 1, 2013)
Wisconsin: Hillary vs Ryan: D +4.1%
+2.8% R improvement
(Updated on August 5, 2014)
Wyoming: Hillary vs Christie: R +28%
+13% D improvement
(Updated on July 23, 2013)
Average all 32 states: Hillary vs Best Republican: D +0.5%
+2.2% D improvement (from Obama 2012) [projecting a 6.0% victory for Hillary]
Giving us this map:
()
Red = Democratic lead/trend
Blue = Republican lead/trend
Green = Tied or no trend
Grey = No polling yet
Green = toss up or less than 0.5% lead
20% shade = 0.6-2% lead
30% shade = 2.1-4% lead
40% shade = 4.1-6% lead
50% shade = 6.1-9% lead
60% shade = 9.1-12% lead
70% shade = 12.1-15% lead
80% shade = 15.1-18% lead
90% shade = Above 18.1% lead
In the count of electoral votes, the current situation looks like this:
Hillary: 268 EVs (in 18 states)
Best/Tailormade Republican: 131 EVs (in 14 states)
Toss-up: None
No polling: 139 EVs (in 18 states + D.C.)
So far, Hillary has captured an impressive 67.2% of all EVs awarded, against only 32.8% EVs for the tailormade Republican.
This is how the Trendline Map looks so far:
()
The states which right now are showing the strongest improvement for the Democratic (Hillary) or the Republican candidate (in 11 out of 32 cases, Christie is that person):
1. Kentucky: D +18.2%
2. Arkansas: D +14.2%
3. Kansas: D +14.1%
4. California: R +14%
5. Louisiana: D +14%
6. West Virginia: D +13%
7. Wyoming: D +13%
8. New Jersey: R +9.5%
9. Colorado: R +8.9%
10. Arizona: D +8%
11. Texas: D +8%
12. Connecticut: R +8%
13. Maine: R +7%
14. Georgia: D +6%
15. Alaska: D +6%
16. Mississippi: D +4.5%
17. Florida: D +4.4%
All of these changes (in the 17 states above) are statistically significant, though there are HUGE question marks concerning California.
The whole list of states having been polled till now, going from Democratic stronghold to Republican stronghold:
New York: D +24.6%
New Mexico: D +14%
Oregon: D +12%
California: D +9%
Connecticut: D +9%
New Jersey: D +8.25%
Maine: D +8%
Michigan: D +6.9%
Ohio: D +6.7%
Currently estimated/projected national average: D +6.0%
Minnesota: D +6%
Florida: D +5.3%
Wisconsin: D +4.1%
Iowa: D +3.9%
Virginia: D +3.6%
Pennsylvania: D +3.5%
Nevada: D +3%
New Hampshire: D +2.1%
North Carolina: D +1.6%
Arizona: R +1%
Georgia: R +2%
Louisiana: R +3%
Colorado: R +3.5%
Kentucky: R +4.5%
Mississippi: R +7%
South Carolina: R +7%
Kansas: R +7.5%
Alaska: R +8%
Texas: R +8%
Arkansas: R +9.5%
Montana: R +13%
West Virginia: R +14%
Wyoming: R +28%
The best-tailored Republican candidates in all states polled so far:
1. Chris Christie favoured in 11 of 32 states (for 151 EVs)
2. Rand Paul favoured in 5 states (California, Oregon (shared), Nevada, Montana & Alaska - for 74 EVs)
3. Mike Huckabee favoured in 6 states (Texas (!), Louisiana (!), Oregon (shared), Arkansas, Mississippi & New Hampshire (!) - for 69 EVs)
4. Jeb Bush favoured in 5 states (Florida, Arizona, Kentucky (!), Kansas & West Virginia - for 59 EVs)
5. Paul Ryan favoured in 2 states (Wisconsin & Colorado - for 19 EVs)
6. Tim Pawlenty favoured in 1 state (Minnesota - for 10 EVs)
7. Marco Rubio favoured in 1 state (South Carolina - for 9 EVs)
8. Ben Carson favoured in 1 state (Connecticut - for 7 EVs)
9. Susana Martinez favoured in 1 state (New Mexico - for 5 EVs)
Current update as of September 11.
Vs Christie: D +8.25% (12 polls, an improvement of 0.5%!)
Vs Bush: D +19.5% (2 polls)
Vs Rand Paul: D +20.25% (4 polls)
Vs Huckabee: D +23%
Vs Cruz: D +23%
Vs Paul Ryan: D +25%
Is Christie starting to rebounce already in the polls? Most such improvements usually starts closest to home.
The total number of state polls included below has now reached 168.
The 2016 poll averages for each state - 32 states right now - and the change from the actual 2012 outcomes. Only the Republican candidate with the best statewide polling included.
Alaska: Hillary vs Rand Paul: R +8%
+6% D improvement
(Updated on August 12, 2014)
Arizona: Hillary vs Bush: R +1%
+8% D improvement
(Updated on March 6, 2014)
Arkansas: Hillary vs Mike Huckabee: R +9.5%
+14.2% D improvement
(Updated on August 11, 2014)
California: Hillary vs Rand Paul: D +9%
+14% R improvement
(Updated on August 1, 2014)
Colorado: Hillary vs Paul Ryan: R +3.5%
+8.9% R improvement
Current Republican gain
(Updated on July 29, 2014)
Connecticut: Hillary vs Ben Carson: D +9%
+8% R improvement
(Updated on August 11, 2014)
Florida: Hillary vs Bush: D +5.3%
+4.4% D improvement
(Updated on September 10, 2014)
Georgia: Hillary vs Christie: R +2%
+6% D improvement
(Updated August 8, 2013)
Iowa: Hillary vs Christie: D +3.9%
+1.9% R improvement
(Updated on July 17, 2014)
Kansas: Hillary vs Bush: R +7.5%
+14.1% D improvement
(Updated on August 22, 2014)
Kentucky: Hillary vs Bush: R +4.5%
+18.2% D improvement
(Updated on August 13, 2014)
Louisiana: Hillary vs Huckabee: R +3%
+14% D improvement
(Updated on July 12, 2014)
Maine: Hillary vs Christie: D +8%
+7% R improvement
(Updated on November 13, 2013)
Michigan: Hillary vs Christie: D +6.9%
+2.6% R improvement
(Updated on September 9, 2014)
Minnesota: Hillary vs Tim Pawlenty: D +6%
+2% R improvement
(Updated on June 18, 2014)
Mississippi: Hillary vs Huckabee: R +7%
+4.5% D improvement
(Updated on July 20, 2014)
Montana: Hillary vs Rand Paul: R +13% (Brian Schweitzer vs Rand Paul: R +8%)
+1% D improvement
(Updated on July 23, 2014)
Nevada: Hillary vs Rand Paul: D +3%
+4% R improvement
(Updated on July 31, 2014)
New Hampshire: Hillary vs Huckabee: D +2.1%
+3.5% R improvement
(Updated on July 17, 2014)
New Jersey: Hillary vs Christie: D +8.25%
+9.5% R improvement
(Updated on September 11, 2014)
New Mexico: Hillary vs Susana Martinez: D +14%
+4% D improvement
(Updated on March 27, 2014)
New York: Hillary vs Christie: D +24.6%
+3.6% R improvement
(Updated on August 21, 2014)
North Carolina: Hillary vs Christie: D +1.6%
+3.6% D improvement
Current Democratic gain
(Updated on August 20, 2014)
Ohio: Hillary vs Christie: D +6.7%
+3.7% D improvement
(Updated on July 31, 2014)
Oregon: Hillary vs Rand Paul/Huckabee: D +12%
Unchanged from 2012
(Updated on May 30, 2014)
Pennsylvania: Hillary vs Christie: D +3.5%
+1.9% R improvement
(Updated on June 5, 2014)
South Carolina: Hillary vs Marco Rubio: R +7%
+3.5% D improvement
(Updated on November 2, 2013)
Texas: Hillary vs Huckabee: R +8%
+8% D improvement
(Updated on April 18, 2014)
Virginia: Hillary vs Christie: D +3.64%
+0.2% R improvement
(Updated on July 23, 2014)
West Virginia: Hillary vs Bush: R +14%
+13% D improvement
(Updated on October 1, 2013)
Wisconsin: Hillary vs Ryan: D +4.1%
+2.8% R improvement
(Updated on August 5, 2014)
Wyoming: Hillary vs Christie: R +28%
+13% D improvement
(Updated on July 23, 2013)
Average all 32 states: Hillary vs Best Republican: D +0.5%
+2.2% D improvement (from Obama 2012) [projecting a 6.0% victory for Hillary]
Giving us this map:
(
Red = Democratic lead/trend
Blue = Republican lead/trend
Green = Tied or no trend
Grey = No polling yet
Green = toss up or less than 0.5% lead
20% shade = 0.6-2% lead
30% shade = 2.1-4% lead
40% shade = 4.1-6% lead
50% shade = 6.1-9% lead
60% shade = 9.1-12% lead
70% shade = 12.1-15% lead
80% shade = 15.1-18% lead
90% shade = Above 18.1% lead
In the count of electoral votes, the current situation looks like this:
Hillary: 268 EVs (in 18 states)
Best/Tailormade Republican: 131 EVs (in 14 states)
Toss-up: None
No polling: 139 EVs (in 18 states + D.C.)
So far, Hillary has captured an impressive 67.2% of all EVs awarded, against only 32.8% EVs for the tailormade Republican.
This is how the Trendline Map looks so far:
(
The states which right now are showing the strongest improvement for the Democratic (Hillary) or the Republican candidate (in 11 out of 32 cases, Christie is that person):
1. Kentucky: D +18.2%
2. Arkansas: D +14.2%
3. Kansas: D +14.1%
4. California: R +14%
5. Louisiana: D +14%
6. West Virginia: D +13%
7. Wyoming: D +13%
8. New Jersey: R +9.5%
9. Colorado: R +8.9%
10. Arizona: D +8%
11. Texas: D +8%
12. Connecticut: R +8%
13. Maine: R +7%
14. Georgia: D +6%
15. Alaska: D +6%
16. Mississippi: D +4.5%
17. Florida: D +4.4%
All of these changes (in the 17 states above) are statistically significant, though there are HUGE question marks concerning California.
The whole list of states having been polled till now, going from Democratic stronghold to Republican stronghold:
New York: D +24.6%
New Mexico: D +14%
Oregon: D +12%
California: D +9%
Connecticut: D +9%
New Jersey: D +8.25%
Maine: D +8%
Michigan: D +6.9%
Ohio: D +6.7%
Currently estimated/projected national average: D +6.0%
Minnesota: D +6%
Florida: D +5.3%
Wisconsin: D +4.1%
Iowa: D +3.9%
Virginia: D +3.6%
Pennsylvania: D +3.5%
Nevada: D +3%
New Hampshire: D +2.1%
North Carolina: D +1.6%
Arizona: R +1%
Georgia: R +2%
Louisiana: R +3%
Colorado: R +3.5%
Kentucky: R +4.5%
Mississippi: R +7%
South Carolina: R +7%
Kansas: R +7.5%
Alaska: R +8%
Texas: R +8%
Arkansas: R +9.5%
Montana: R +13%
West Virginia: R +14%
Wyoming: R +28%
The best-tailored Republican candidates in all states polled so far:
1. Chris Christie favoured in 11 of 32 states (for 151 EVs)
2. Rand Paul favoured in 5 states (California, Oregon (shared), Nevada, Montana & Alaska - for 74 EVs)
3. Mike Huckabee favoured in 6 states (Texas (!), Louisiana (!), Oregon (shared), Arkansas, Mississippi & New Hampshire (!) - for 69 EVs)
4. Jeb Bush favoured in 5 states (Florida, Arizona, Kentucky (!), Kansas & West Virginia - for 59 EVs)
5. Paul Ryan favoured in 2 states (Wisconsin & Colorado - for 19 EVs)
6. Tim Pawlenty favoured in 1 state (Minnesota - for 10 EVs)
7. Marco Rubio favoured in 1 state (South Carolina - for 9 EVs)
8. Ben Carson favoured in 1 state (Connecticut - for 7 EVs)
9. Susana Martinez favoured in 1 state (New Mexico - for 5 EVs)
Current update as of September 11.
Title: Re: 2016 Official Polling Map Thread
Post by: New_Conservative on September 14, 2014, 09:55:30 PM
Why do you think the Northern states and California are trending Republican in the polls, in theory, compared to the southern states?
I don't really take stock in polls that are taken 2 years away from the election but I find it interesting, states like California getting a +14% jump for Republicans. I don't expect it to stay like that but I'm wondering why that is.
Is it just a matter of the Democrats maxed out their vote with Obama in 2008 and 2012 since their base was extremely enthusiastic in both elections, and it's possible they are not as enthused heading into 2016? Or just a way the pollsters are polling?
Title: Re: 2016 Official Polling Map Thread
Post by: eric82oslo on September 14, 2014, 10:01:20 PM
Why do you think the Northern states and California are trending Republican in the polls, in theory, compared to the southern states?
I don't really take stock in polls that are taken 2 years away from the election but I find it interesting, states like California getting a +14% jump for Republicans. I don't expect it to stay like that but I'm wondering why that is.
Is it just a matter of the Democrats maxed out their vote with Obama in 2008 and 2012?
Bad polling, that's the only explanation I have. :P
On the other hand, Obama was probably a near perfect match for California...but still.
Gravis Marketing seems to have a terribly strong Republican house bias, even in the two other states they've polled (Connecticut & Nevada).
Title: Re: 2016 Official Polling Map Thread
Post by: New_Conservative on September 14, 2014, 10:09:14 PM
Why do you think the Northern states and California are trending Republican in the polls, in theory, compared to the southern states?
I don't really take stock in polls that are taken 2 years away from the election but I find it interesting, states like California getting a +14% jump for Republicans. I don't expect it to stay like that but I'm wondering why that is.
Is it just a matter of the Democrats maxed out their vote with Obama in 2008 and 2012?
I don't really take stock in polls that are taken 2 years away from the election but I find it interesting, states like California getting a +14% jump for Republicans. I don't expect it to stay like that but I'm wondering why that is.
Is it just a matter of the Democrats maxed out their vote with Obama in 2008 and 2012?
Bad polling, that's the only explanation I have. :P
On the other hand, Obama was probably a near perfect match for California...but still.
Gravis Marketing seems to have a terribly strong Republican house bias, even in the two other states they've polled (Connecticut & Nevada).
But it seems that's the general result for most polls that have been released, trends in the opposite direction from 2012. (Southern states trending Democrat, Northern states trending Republican) Which is why I am wondering if both parties just maxed out their electorate in 2012 in those places. Like I said, I don't really take any stock in the polling this far out so I am not expecting a trend like that but I find it interesting that they bother releasing this data with such questionable information.
Title: Re: 2016 Official Polling Map Thread
Post by: eric82oslo on September 14, 2014, 10:22:15 PM
Why do you think the Northern states and California are trending Republican in the polls, in theory, compared to the southern states?
I don't really take stock in polls that are taken 2 years away from the election but I find it interesting, states like California getting a +14% jump for Republicans. I don't expect it to stay like that but I'm wondering why that is.
Is it just a matter of the Democrats maxed out their vote with Obama in 2008 and 2012?
I don't really take stock in polls that are taken 2 years away from the election but I find it interesting, states like California getting a +14% jump for Republicans. I don't expect it to stay like that but I'm wondering why that is.
Is it just a matter of the Democrats maxed out their vote with Obama in 2008 and 2012?
Bad polling, that's the only explanation I have. :P
On the other hand, Obama was probably a near perfect match for California...but still.
Gravis Marketing seems to have a terribly strong Republican house bias, even in the two other states they've polled (Connecticut & Nevada).
But it seems that's the general result for most polls that have been released, trends in the opposite direction from 2012. (Southern states trending Democrat, Northern states trending Republican) Which is why I am wondering if both parties just maxed out their electorate in 2012 in those places. Like I said, I don't really take any stock in the polling this far out so I am not expecting a trend like that but I find it interesting that they bother releasing this data with such questionable information.
Ah, right. I was only answering your California question, sorry.
I think there are at least three reasons why almost every state so far has been moving towards the center:
1) Hillary is seen as much more moderate/less liberal than Obama, rightly or wrongly (I don't think there is that much difference between them honestly, except for foreign policy possibly). It also helps that she's white and that people want to finally elect a woman president, plus being highly qualified (while Obama had almost no experience).
2) Hillary is partly connected to the South, Arkansas, rural places, while Obama for natural reasons has been linked to very urban, liberal and exotic places like Chicago, Hawaii, Indonesia and Africa/Kenya.
3) There are still (probably) a whole bunch of undecided voters who eventually will probably make the margins bigger in most states, or stop flirting with Hillary/the Republican nominees and return to their old parties once the campaigns get started for real and bad blood is being exchanged.
I do expect a less polarized map than in 2008/2012, perhaps much less so, but almost certainly not as smooth as it looks like at the moment. It will get more polarized, yet the question is by how much?
Title: Re: 2016 Official Polling Map Thread
Post by: Flake on September 15, 2014, 01:09:39 AM
I really wish the color coding would be consistent.
Eric and I are measuring different things.
1. He has maps for swings, which I do not have.
2. He is averaging polls; I do not average polls unless the polls are within a week from each other. I normally replace polls with new ones.
3. I reject polls that seem grossly out of line (unless someone corroborates them) and any in which someone leads with less than 40% of the vote. Thus I have no poll from New Hampshire, the poll that Eric accepted being something like a 38-37 poll.
4. Check the legends on any maps that either of us make.
I'm talking about Eric's maps because in some parts of the post he uses red to represent Clinton, and in some parts he uses blue to represent Clinton and he should stick with one color for one candidate (not to be mean, but it just makes more sense).
Average all 32 states: Hillary vs Best Republican: D +0.5%
+2.2% D improvement (from Obama 2012) [projecting a 6.0% victory for Hillary]
Giving us this map:
(
Title: Re: 2016 Official Polling Map Thread
Post by: pbrower2a on September 15, 2014, 08:32:36 AM
Why do you think the Northern states and California are trending Republican in the polls, in theory, compared to the southern states?
I don't really take stock in polls that are taken 2 years away from the election but I find it interesting, states like California getting a +14% jump for Republicans. I don't expect it to stay like that but I'm wondering why that is.
Is it just a matter of the Democrats maxed out their vote with Obama in 2008 and 2012 since their base was extremely enthusiastic in both elections, and it's possible they are not as enthused heading into 2016? Or just a way the pollsters are polling?
Reversion to the mean?
Barack Obama is about as polarizing a politician as there has been.
Title: Re: 2016 Official Polling Map Thread
Post by: eric82oslo on September 15, 2014, 10:54:34 AM
I'm talking about Eric's maps because in some parts of the post he uses red to represent Clinton, and in some parts he uses blue to represent Clinton and he should stick with one color for one candidate (not to be mean, but it just makes more sense).
Average all 32 states: Hillary vs Best Republican: D +0.5%
+2.2% D improvement (from Obama 2012) [projecting a 6.0% victory for Hillary]
Giving us this map:
()
Average all 32 states: Hillary vs Best Republican: D +0.5%
+2.2% D improvement (from Obama 2012) [projecting a 6.0% victory for Hillary]
Giving us this map:
(
You're right. It's annoying that the maps are like they are. But I figured it would probably be even more confusing if I consistently use the Atlas colors, since most people think of red and blue America as the Republican and Democratic America.
I will keep it in mind, and perhaps change it one day. I could of course change the maps as well, so that red would actually mean Republican on the maps too, but wouldn't that just be even more confusing? I'm sure it would.
Title: Re: 2016 Official Polling Map Thread
Post by: eric82oslo on September 15, 2014, 11:01:08 AM
Following the Iowa steak fry with retiring Senator Tom Harkin yesterday, Hillary doesn't even get one day of rest, as today she's being pitted against Jeb and Rand Paul in Arkansas. This time they did really well against her there, yet still trailing substantially to native son Mike on the averages of the 4 polls released in Arkansas so far:
Vs Huckabee: R +9.5% (2 polls)
Vs Cruz: R +4%
Vs Bush: R +2.3% (2 polls)
Vs Rand Paul: Toss up (4 polls)
Vs Christie: D +3.3% (3 polls)
In other words, it's still Huck time in the Little Rock State.
The total number of state polls included below has now reached 169.
The 2016 poll averages for each state - 32 states right now - and the change from the actual 2012 outcomes. Only the Republican candidate with the best statewide polling included.
Alaska: Hillary vs Rand Paul: R +8%
+6% D improvement
(Updated on August 12, 2014)
Arizona: Hillary vs Bush: R +1%
+8% D improvement
(Updated on March 6, 2014)
Arkansas: Hillary vs Mike Huckabee: R +9.5%
+14.2% D improvement
(Updated on September 15, 2014)
California: Hillary vs Rand Paul: D +9%
+14% R improvement
(Updated on August 1, 2014)
Colorado: Hillary vs Paul Ryan: R +3.5%
+8.9% R improvement
Current Republican gain
(Updated on July 29, 2014)
Connecticut: Hillary vs Ben Carson: D +9%
+8% R improvement
(Updated on August 11, 2014)
Florida: Hillary vs Bush: D +5.3%
+4.4% D improvement
(Updated on September 10, 2014)
Georgia: Hillary vs Christie: R +2%
+6% D improvement
(Updated August 8, 2013)
Iowa: Hillary vs Christie: D +3.9%
+1.9% R improvement
(Updated on July 17, 2014)
Kansas: Hillary vs Bush: R +7.5%
+14.1% D improvement
(Updated on August 22, 2014)
Kentucky: Hillary vs Bush: R +4.5%
+18.2% D improvement
(Updated on August 13, 2014)
Louisiana: Hillary vs Huckabee: R +3%
+14% D improvement
(Updated on July 12, 2014)
Maine: Hillary vs Christie: D +8%
+7% R improvement
(Updated on November 13, 2013)
Michigan: Hillary vs Christie: D +6.9%
+2.6% R improvement
(Updated on September 9, 2014)
Minnesota: Hillary vs Tim Pawlenty: D +6%
+2% R improvement
(Updated on June 18, 2014)
Mississippi: Hillary vs Huckabee: R +7%
+4.5% D improvement
(Updated on July 20, 2014)
Montana: Hillary vs Rand Paul: R +13% (Brian Schweitzer vs Rand Paul: R +8%)
+1% D improvement
(Updated on July 23, 2014)
Nevada: Hillary vs Rand Paul: D +3%
+4% R improvement
(Updated on July 31, 2014)
New Hampshire: Hillary vs Huckabee: D +2.1%
+3.5% R improvement
(Updated on July 17, 2014)
New Jersey: Hillary vs Christie: D +8.25%
+9.5% R improvement
(Updated on September 11, 2014)
New Mexico: Hillary vs Susana Martinez: D +14%
+4% D improvement
(Updated on March 27, 2014)
New York: Hillary vs Christie: D +24.6%
+3.6% R improvement
(Updated on August 21, 2014)
North Carolina: Hillary vs Christie: D +1.6%
+3.6% D improvement
Current Democratic gain
(Updated on August 20, 2014)
Ohio: Hillary vs Christie: D +6.7%
+3.7% D improvement
(Updated on July 31, 2014)
Oregon: Hillary vs Rand Paul/Huckabee: D +12%
Unchanged from 2012
(Updated on May 30, 2014)
Pennsylvania: Hillary vs Christie: D +3.5%
+1.9% R improvement
(Updated on June 5, 2014)
South Carolina: Hillary vs Marco Rubio: R +7%
+3.5% D improvement
(Updated on November 2, 2013)
Texas: Hillary vs Huckabee: R +8%
+8% D improvement
(Updated on April 18, 2014)
Virginia: Hillary vs Christie: D +3.64%
+0.2% R improvement
(Updated on July 23, 2014)
West Virginia: Hillary vs Bush: R +14%
+13% D improvement
(Updated on October 1, 2013)
Wisconsin: Hillary vs Ryan: D +4.1%
+2.8% R improvement
(Updated on August 5, 2014)
Wyoming: Hillary vs Christie: R +28%
+13% D improvement
(Updated on July 23, 2013)
Average all 32 states: Hillary vs Best Republican: D +0.5%
+2.2% D improvement (from Obama 2012) [projecting a 6.0% victory for Hillary]
Giving us this map:
()
Red = Democratic lead/trend
Blue = Republican lead/trend
Green = Tied or no trend
Grey = No polling yet
Green = toss up or less than 0.5% lead
20% shade = 0.6-2% lead
30% shade = 2.1-4% lead
40% shade = 4.1-6% lead
50% shade = 6.1-9% lead
60% shade = 9.1-12% lead
70% shade = 12.1-15% lead
80% shade = 15.1-18% lead
90% shade = Above 18.1% lead
In the count of electoral votes, the current situation looks like this:
Hillary: 268 EVs (in 18 states)
Best/Tailormade Republican: 131 EVs (in 14 states)
Toss-up: None
No polling: 139 EVs (in 18 states + D.C.)
So far, Hillary has captured an impressive 67.2% of all EVs awarded, against only 32.8% EVs for the tailormade Republican.
This is how the Trendline Map looks so far:
()
The states which right now are showing the strongest improvement for the Democratic (Hillary) or the Republican candidate (in 11 out of 32 cases, Christie is that person):
1. Kentucky: D +18.2%
2. Arkansas: D +14.2%
3. Kansas: D +14.1%
4. California: R +14%
5. Louisiana: D +14%
6. West Virginia: D +13%
7. Wyoming: D +13%
8. New Jersey: R +9.5%
9. Colorado: R +8.9%
10. Arizona: D +8%
11. Texas: D +8%
12. Connecticut: R +8%
13. Maine: R +7%
14. Georgia: D +6%
15. Alaska: D +6%
16. Mississippi: D +4.5%
17. Florida: D +4.4%
All of these changes (in the 17 states above) are statistically significant, though there are HUGE question marks concerning California.
The whole list of states having been polled till now, going from Democratic stronghold to Republican stronghold:
New York: D +24.6%
New Mexico: D +14%
Oregon: D +12%
California: D +9%
Connecticut: D +9%
New Jersey: D +8.25%
Maine: D +8%
Michigan: D +6.9%
Ohio: D +6.7%
Currently estimated/projected national average: D +6.0%
Minnesota: D +6%
Florida: D +5.3%
Wisconsin: D +4.1%
Iowa: D +3.9%
Virginia: D +3.6%
Pennsylvania: D +3.5%
Nevada: D +3%
New Hampshire: D +2.1%
North Carolina: D +1.6%
Arizona: R +1%
Georgia: R +2%
Louisiana: R +3%
Colorado: R +3.5%
Kentucky: R +4.5%
Mississippi: R +7%
South Carolina: R +7%
Kansas: R +7.5%
Alaska: R +8%
Texas: R +8%
Arkansas: R +9.5%
Montana: R +13%
West Virginia: R +14%
Wyoming: R +28%
The best-tailored Republican candidates in all states polled so far:
1. Chris Christie favoured in 11 of 32 states (for 151 EVs)
2. Rand Paul favoured in 5 states (California, Oregon (shared), Nevada, Montana & Alaska - for 74 EVs)
3. Mike Huckabee favoured in 6 states (Texas (!), Louisiana (!), Oregon (shared), Arkansas, Mississippi & New Hampshire (!) - for 69 EVs)
4. Jeb Bush favoured in 5 states (Florida, Arizona, Kentucky (!), Kansas & West Virginia - for 59 EVs)
5. Paul Ryan favoured in 2 states (Wisconsin & Colorado - for 19 EVs)
6. Tim Pawlenty favoured in 1 state (Minnesota - for 10 EVs)
7. Marco Rubio favoured in 1 state (South Carolina - for 9 EVs)
8. Ben Carson favoured in 1 state (Connecticut - for 7 EVs)
9. Susana Martinez favoured in 1 state (New Mexico - for 5 EVs)
Current update as of September 15.
Vs Huckabee: R +9.5% (2 polls)
Vs Cruz: R +4%
Vs Bush: R +2.3% (2 polls)
Vs Rand Paul: Toss up (4 polls)
Vs Christie: D +3.3% (3 polls)
In other words, it's still Huck time in the Little Rock State.
The total number of state polls included below has now reached 169.
The 2016 poll averages for each state - 32 states right now - and the change from the actual 2012 outcomes. Only the Republican candidate with the best statewide polling included.
Alaska: Hillary vs Rand Paul: R +8%
+6% D improvement
(Updated on August 12, 2014)
Arizona: Hillary vs Bush: R +1%
+8% D improvement
(Updated on March 6, 2014)
Arkansas: Hillary vs Mike Huckabee: R +9.5%
+14.2% D improvement
(Updated on September 15, 2014)
California: Hillary vs Rand Paul: D +9%
+14% R improvement
(Updated on August 1, 2014)
Colorado: Hillary vs Paul Ryan: R +3.5%
+8.9% R improvement
Current Republican gain
(Updated on July 29, 2014)
Connecticut: Hillary vs Ben Carson: D +9%
+8% R improvement
(Updated on August 11, 2014)
Florida: Hillary vs Bush: D +5.3%
+4.4% D improvement
(Updated on September 10, 2014)
Georgia: Hillary vs Christie: R +2%
+6% D improvement
(Updated August 8, 2013)
Iowa: Hillary vs Christie: D +3.9%
+1.9% R improvement
(Updated on July 17, 2014)
Kansas: Hillary vs Bush: R +7.5%
+14.1% D improvement
(Updated on August 22, 2014)
Kentucky: Hillary vs Bush: R +4.5%
+18.2% D improvement
(Updated on August 13, 2014)
Louisiana: Hillary vs Huckabee: R +3%
+14% D improvement
(Updated on July 12, 2014)
Maine: Hillary vs Christie: D +8%
+7% R improvement
(Updated on November 13, 2013)
Michigan: Hillary vs Christie: D +6.9%
+2.6% R improvement
(Updated on September 9, 2014)
Minnesota: Hillary vs Tim Pawlenty: D +6%
+2% R improvement
(Updated on June 18, 2014)
Mississippi: Hillary vs Huckabee: R +7%
+4.5% D improvement
(Updated on July 20, 2014)
Montana: Hillary vs Rand Paul: R +13% (Brian Schweitzer vs Rand Paul: R +8%)
+1% D improvement
(Updated on July 23, 2014)
Nevada: Hillary vs Rand Paul: D +3%
+4% R improvement
(Updated on July 31, 2014)
New Hampshire: Hillary vs Huckabee: D +2.1%
+3.5% R improvement
(Updated on July 17, 2014)
New Jersey: Hillary vs Christie: D +8.25%
+9.5% R improvement
(Updated on September 11, 2014)
New Mexico: Hillary vs Susana Martinez: D +14%
+4% D improvement
(Updated on March 27, 2014)
New York: Hillary vs Christie: D +24.6%
+3.6% R improvement
(Updated on August 21, 2014)
North Carolina: Hillary vs Christie: D +1.6%
+3.6% D improvement
Current Democratic gain
(Updated on August 20, 2014)
Ohio: Hillary vs Christie: D +6.7%
+3.7% D improvement
(Updated on July 31, 2014)
Oregon: Hillary vs Rand Paul/Huckabee: D +12%
Unchanged from 2012
(Updated on May 30, 2014)
Pennsylvania: Hillary vs Christie: D +3.5%
+1.9% R improvement
(Updated on June 5, 2014)
South Carolina: Hillary vs Marco Rubio: R +7%
+3.5% D improvement
(Updated on November 2, 2013)
Texas: Hillary vs Huckabee: R +8%
+8% D improvement
(Updated on April 18, 2014)
Virginia: Hillary vs Christie: D +3.64%
+0.2% R improvement
(Updated on July 23, 2014)
West Virginia: Hillary vs Bush: R +14%
+13% D improvement
(Updated on October 1, 2013)
Wisconsin: Hillary vs Ryan: D +4.1%
+2.8% R improvement
(Updated on August 5, 2014)
Wyoming: Hillary vs Christie: R +28%
+13% D improvement
(Updated on July 23, 2013)
Average all 32 states: Hillary vs Best Republican: D +0.5%
+2.2% D improvement (from Obama 2012) [projecting a 6.0% victory for Hillary]
Giving us this map:
(
Red = Democratic lead/trend
Blue = Republican lead/trend
Green = Tied or no trend
Grey = No polling yet
Green = toss up or less than 0.5% lead
20% shade = 0.6-2% lead
30% shade = 2.1-4% lead
40% shade = 4.1-6% lead
50% shade = 6.1-9% lead
60% shade = 9.1-12% lead
70% shade = 12.1-15% lead
80% shade = 15.1-18% lead
90% shade = Above 18.1% lead
In the count of electoral votes, the current situation looks like this:
Hillary: 268 EVs (in 18 states)
Best/Tailormade Republican: 131 EVs (in 14 states)
Toss-up: None
No polling: 139 EVs (in 18 states + D.C.)
So far, Hillary has captured an impressive 67.2% of all EVs awarded, against only 32.8% EVs for the tailormade Republican.
This is how the Trendline Map looks so far:
(
The states which right now are showing the strongest improvement for the Democratic (Hillary) or the Republican candidate (in 11 out of 32 cases, Christie is that person):
1. Kentucky: D +18.2%
2. Arkansas: D +14.2%
3. Kansas: D +14.1%
4. California: R +14%
5. Louisiana: D +14%
6. West Virginia: D +13%
7. Wyoming: D +13%
8. New Jersey: R +9.5%
9. Colorado: R +8.9%
10. Arizona: D +8%
11. Texas: D +8%
12. Connecticut: R +8%
13. Maine: R +7%
14. Georgia: D +6%
15. Alaska: D +6%
16. Mississippi: D +4.5%
17. Florida: D +4.4%
All of these changes (in the 17 states above) are statistically significant, though there are HUGE question marks concerning California.
The whole list of states having been polled till now, going from Democratic stronghold to Republican stronghold:
New York: D +24.6%
New Mexico: D +14%
Oregon: D +12%
California: D +9%
Connecticut: D +9%
New Jersey: D +8.25%
Maine: D +8%
Michigan: D +6.9%
Ohio: D +6.7%
Currently estimated/projected national average: D +6.0%
Minnesota: D +6%
Florida: D +5.3%
Wisconsin: D +4.1%
Iowa: D +3.9%
Virginia: D +3.6%
Pennsylvania: D +3.5%
Nevada: D +3%
New Hampshire: D +2.1%
North Carolina: D +1.6%
Arizona: R +1%
Georgia: R +2%
Louisiana: R +3%
Colorado: R +3.5%
Kentucky: R +4.5%
Mississippi: R +7%
South Carolina: R +7%
Kansas: R +7.5%
Alaska: R +8%
Texas: R +8%
Arkansas: R +9.5%
Montana: R +13%
West Virginia: R +14%
Wyoming: R +28%
The best-tailored Republican candidates in all states polled so far:
1. Chris Christie favoured in 11 of 32 states (for 151 EVs)
2. Rand Paul favoured in 5 states (California, Oregon (shared), Nevada, Montana & Alaska - for 74 EVs)
3. Mike Huckabee favoured in 6 states (Texas (!), Louisiana (!), Oregon (shared), Arkansas, Mississippi & New Hampshire (!) - for 69 EVs)
4. Jeb Bush favoured in 5 states (Florida, Arizona, Kentucky (!), Kansas & West Virginia - for 59 EVs)
5. Paul Ryan favoured in 2 states (Wisconsin & Colorado - for 19 EVs)
6. Tim Pawlenty favoured in 1 state (Minnesota - for 10 EVs)
7. Marco Rubio favoured in 1 state (South Carolina - for 9 EVs)
8. Ben Carson favoured in 1 state (Connecticut - for 7 EVs)
9. Susana Martinez favoured in 1 state (New Mexico - for 5 EVs)
Current update as of September 15.
Title: Re: 2016 Official Polling Map Thread
Post by: pbrower2a on September 15, 2014, 01:45:06 PM
Gravis Marketing, Arkansas
Paul (R)- 48%
Clinton (D)- 42%
Bush (R)- 49%
Clinton (D)- 42%
http://gravismarketing.com/polling-and-market-research/telephone-survey-arkansas-political-poll/
Hillary Clinton vs. Jeb Bush
(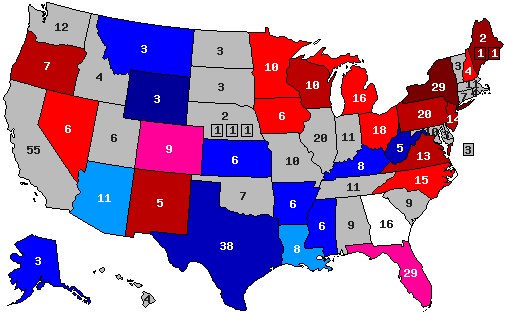 )
)
Hillary Clinton vs. Chris Christie
()
Hillary Clinton vs. Mike Huckabee
()
Hillary Clinton vs. Rand Paul
( )
)
blue, Republican -- red, Democratic
30% -- lead with 40-49% but a margin of 3% or less
40% -- lead with 40-49% but a margin of 4% or more
60% -- lead with 50-54%
70% -- lead with 55-59%
90% -- lead with 60% or more
Paul (R)- 48%
Clinton (D)- 42%
Bush (R)- 49%
Clinton (D)- 42%
http://gravismarketing.com/polling-and-market-research/telephone-survey-arkansas-political-poll/
Hillary Clinton vs. Jeb Bush
(
Hillary Clinton vs. Chris Christie
(
Hillary Clinton vs. Mike Huckabee
(
Hillary Clinton vs. Rand Paul
(
blue, Republican -- red, Democratic
30% -- lead with 40-49% but a margin of 3% or less
40% -- lead with 40-49% but a margin of 4% or more
60% -- lead with 50-54%
70% -- lead with 55-59%
90% -- lead with 60% or more
Title: Re: 2016 Official Polling Map Thread
Post by: Mr. Morden on September 15, 2014, 02:46:15 PM
I'm talking about Eric's maps because in some parts of the post he uses red to represent Clinton, and in some parts he uses blue to represent Clinton and he should stick with one color for one candidate (not to be mean, but it just makes more sense).
Average all 32 states: Hillary vs Best Republican: D +0.5%
+2.2% D improvement (from Obama 2012) [projecting a 6.0% victory for Hillary]
Giving us this map:
()
Average all 32 states: Hillary vs Best Republican: D +0.5%
+2.2% D improvement (from Obama 2012) [projecting a 6.0% victory for Hillary]
Giving us this map:
(
You're right. It's annoying that the maps are like they are. But I figured it would probably be even more confusing if I consistently use the Atlas colors, since most people think of red and blue America as the Republican and Democratic America.
Not most people on this forum.
Title: Re: 2016 Official Polling Map Thread
Post by: eric82oslo on September 16, 2014, 12:30:12 PM
And along comes the 14th North Carolina poll on the 2016 race. Once more it's confirmed that candidate quality truely matters. Christie is slipping fast: In this latest poll, he's only the 4th most popular (out of 5) GOP candidates. The new NC averages are:
Vs Bush: D +1.6% (11 polls, up +0.4%)
Vs Christie: D +2.1% (11 polls, down -0.5%)
Vs Huckabee: D +3.4% (7 polls, up +0.8%)
Vs Rand Paul: D +4.8% (13 polls)
Vs Rubio: D +7%
Vs Cruz: D +8% (5 polls)
Bush has for the 1st time surpassed Christie in popularity in this vital battleground state.
Jeb now polls the best in 6 states, including the crucial states of Florida, NC and Arizona, making him currently the 2nd strongest GOPer in the country.
The total number of state polls included below has now reached 170.
The 2016 poll averages for each state - 32 states right now - and the change from the actual 2012 outcomes. Only the Republican candidate with the best statewide polling included.
Alaska: Hillary vs Rand Paul: R +8%
+6% D improvement
(Updated on August 12, 2014)
Arizona: Hillary vs Bush: R +1%
+8% D improvement
(Updated on March 6, 2014)
Arkansas: Hillary vs Mike Huckabee: R +9.5%
+14.2% D improvement
(Updated on September 15, 2014)
California: Hillary vs Rand Paul: D +9%
+14% R improvement
(Updated on August 1, 2014)
Colorado: Hillary vs Paul Ryan: R +3.5%
+8.9% R improvement
Current Republican gain
(Updated on July 29, 2014)
Connecticut: Hillary vs Ben Carson: D +9%
+8% R improvement
(Updated on August 11, 2014)
Florida: Hillary vs Bush: D +5.3%
+4.4% D improvement
(Updated on September 10, 2014)
Georgia: Hillary vs Christie: R +2%
+6% D improvement
(Updated August 8, 2013)
Iowa: Hillary vs Christie: D +3.9%
+1.9% R improvement
(Updated on July 17, 2014)
Kansas: Hillary vs Bush: R +7.5%
+14.1% D improvement
(Updated on August 22, 2014)
Kentucky: Hillary vs Bush: R +4.5%
+18.2% D improvement
(Updated on August 13, 2014)
Louisiana: Hillary vs Huckabee: R +3%
+14% D improvement
(Updated on July 12, 2014)
Maine: Hillary vs Christie: D +8%
+7% R improvement
(Updated on November 13, 2013)
Michigan: Hillary vs Christie: D +6.9%
+2.6% R improvement
(Updated on September 9, 2014)
Minnesota: Hillary vs Tim Pawlenty: D +6%
+2% R improvement
(Updated on June 18, 2014)
Mississippi: Hillary vs Huckabee: R +7%
+4.5% D improvement
(Updated on July 20, 2014)
Montana: Hillary vs Rand Paul: R +13% (Brian Schweitzer vs Rand Paul: R +8%)
+1% D improvement
(Updated on July 23, 2014)
Nevada: Hillary vs Rand Paul: D +3%
+4% R improvement
(Updated on July 31, 2014)
New Hampshire: Hillary vs Huckabee: D +2.1%
+3.5% R improvement
(Updated on July 17, 2014)
New Jersey: Hillary vs Christie: D +8.25%
+9.5% R improvement
(Updated on September 11, 2014)
New Mexico: Hillary vs Susana Martinez: D +14%
+4% D improvement
(Updated on March 27, 2014)
New York: Hillary vs Christie: D +24.6%
+3.6% R improvement
(Updated on August 21, 2014)
North Carolina: Hillary vs Bush: D +1.6%
+3.6% D improvement
Current Democratic gain
(Updated on September 16, 2014)
Ohio: Hillary vs Christie: D +6.7%
+3.7% D improvement
(Updated on July 31, 2014)
Oregon: Hillary vs Rand Paul/Huckabee: D +12%
Unchanged from 2012
(Updated on May 30, 2014)
Pennsylvania: Hillary vs Christie: D +3.5%
+1.9% R improvement
(Updated on June 5, 2014)
South Carolina: Hillary vs Marco Rubio: R +7%
+3.5% D improvement
(Updated on November 2, 2013)
Texas: Hillary vs Huckabee: R +8%
+8% D improvement
(Updated on April 18, 2014)
Virginia: Hillary vs Christie: D +3.64%
+0.2% R improvement
(Updated on July 23, 2014)
West Virginia: Hillary vs Bush: R +14%
+13% D improvement
(Updated on October 1, 2013)
Wisconsin: Hillary vs Ryan: D +4.1%
+2.8% R improvement
(Updated on August 5, 2014)
Wyoming: Hillary vs Christie: R +28%
+13% D improvement
(Updated on July 23, 2013)
Average all 32 states: Hillary vs Best Republican: D +0.5%
+2.2% D improvement (from Obama 2012) [projecting a 6.0% victory for Hillary]
Giving us this map:
()
Red = Democratic lead/trend
Blue = Republican lead/trend
Green = Tied or no trend
Grey = No polling yet
Green = toss up or less than 0.5% lead
20% shade = 0.6-2% lead
30% shade = 2.1-4% lead
40% shade = 4.1-6% lead
50% shade = 6.1-9% lead
60% shade = 9.1-12% lead
70% shade = 12.1-15% lead
80% shade = 15.1-18% lead
90% shade = Above 18.1% lead
In the count of electoral votes, the current situation looks like this:
Hillary: 268 EVs (in 18 states)
Best/Tailormade Republican: 131 EVs (in 14 states)
Toss-up: None
No polling: 139 EVs (in 18 states + D.C.)
So far, Hillary has captured an impressive 67.2% of all EVs awarded, against only 32.8% EVs for the tailormade Republican.
This is how the Trendline Map looks so far:
()
The states which right now are showing the strongest improvement for the Democratic (Hillary) or the Republican candidate (in 10 out of 32 cases, Christie is that person):
1. Kentucky: D +18.2%
2. Arkansas: D +14.2%
3. Kansas: D +14.1%
4. California: R +14%
5. Louisiana: D +14%
6. West Virginia: D +13%
7. Wyoming: D +13%
8. New Jersey: R +9.5%
9. Colorado: R +8.9%
10. Arizona: D +8%
11. Texas: D +8%
12. Connecticut: R +8%
13. Maine: R +7%
14. Georgia: D +6%
15. Alaska: D +6%
16. Mississippi: D +4.5%
17. Florida: D +4.4%
All of these changes (in the 17 states above) are statistically significant, though there are HUGE question marks concerning California.
The whole list of states having been polled till now, going from Democratic stronghold to Republican stronghold:
New York: D +24.6%
New Mexico: D +14%
Oregon: D +12%
California: D +9%
Connecticut: D +9%
New Jersey: D +8.25%
Maine: D +8%
Michigan: D +6.9%
Ohio: D +6.7%
Currently estimated/projected national average: D +6.0%
Minnesota: D +6%
Florida: D +5.3%
Wisconsin: D +4.1%
Iowa: D +3.9%
Virginia: D +3.6%
Pennsylvania: D +3.5%
Nevada: D +3%
New Hampshire: D +2.1%
North Carolina: D +1.6%
Arizona: R +1%
Georgia: R +2%
Louisiana: R +3%
Colorado: R +3.5%
Kentucky: R +4.5%
Mississippi: R +7%
South Carolina: R +7%
Kansas: R +7.5%
Alaska: R +8%
Texas: R +8%
Arkansas: R +9.5%
Montana: R +13%
West Virginia: R +14%
Wyoming: R +28%
The best-tailored Republican candidates in all states polled so far:
1. Chris Christie favoured in 10 of 32 states (for 136 EVs)
2. Jeb Bush favoured in 6 states (Florida, North Carolina, Arizona, Kentucky (!), Kansas & West Virginia - for 74 EVs)
3. Rand Paul favoured in 5 states (California, Oregon (shared), Nevada, Montana & Alaska - for 74 EVs)
4. Mike Huckabee favoured in 6 states (Texas (!), Louisiana (!), Oregon (shared), Arkansas, Mississippi & New Hampshire (!) - for 69 EVs)
5. Paul Ryan favoured in 2 states (Wisconsin & Colorado - for 19 EVs)
6. Tim Pawlenty favoured in 1 state (Minnesota - for 10 EVs)
7. Marco Rubio favoured in 1 state (South Carolina - for 9 EVs)
8. Ben Carson favoured in 1 state (Connecticut - for 7 EVs)
9. Susana Martinez favoured in 1 state (New Mexico - for 5 EVs)
Current update as of September 16.
Vs Bush: D +1.6% (11 polls, up +0.4%)
Vs Christie: D +2.1% (11 polls, down -0.5%)
Vs Huckabee: D +3.4% (7 polls, up +0.8%)
Vs Rand Paul: D +4.8% (13 polls)
Vs Rubio: D +7%
Vs Cruz: D +8% (5 polls)
Bush has for the 1st time surpassed Christie in popularity in this vital battleground state.
Jeb now polls the best in 6 states, including the crucial states of Florida, NC and Arizona, making him currently the 2nd strongest GOPer in the country.
The total number of state polls included below has now reached 170.
The 2016 poll averages for each state - 32 states right now - and the change from the actual 2012 outcomes. Only the Republican candidate with the best statewide polling included.
Alaska: Hillary vs Rand Paul: R +8%
+6% D improvement
(Updated on August 12, 2014)
Arizona: Hillary vs Bush: R +1%
+8% D improvement
(Updated on March 6, 2014)
Arkansas: Hillary vs Mike Huckabee: R +9.5%
+14.2% D improvement
(Updated on September 15, 2014)
California: Hillary vs Rand Paul: D +9%
+14% R improvement
(Updated on August 1, 2014)
Colorado: Hillary vs Paul Ryan: R +3.5%
+8.9% R improvement
Current Republican gain
(Updated on July 29, 2014)
Connecticut: Hillary vs Ben Carson: D +9%
+8% R improvement
(Updated on August 11, 2014)
Florida: Hillary vs Bush: D +5.3%
+4.4% D improvement
(Updated on September 10, 2014)
Georgia: Hillary vs Christie: R +2%
+6% D improvement
(Updated August 8, 2013)
Iowa: Hillary vs Christie: D +3.9%
+1.9% R improvement
(Updated on July 17, 2014)
Kansas: Hillary vs Bush: R +7.5%
+14.1% D improvement
(Updated on August 22, 2014)
Kentucky: Hillary vs Bush: R +4.5%
+18.2% D improvement
(Updated on August 13, 2014)
Louisiana: Hillary vs Huckabee: R +3%
+14% D improvement
(Updated on July 12, 2014)
Maine: Hillary vs Christie: D +8%
+7% R improvement
(Updated on November 13, 2013)
Michigan: Hillary vs Christie: D +6.9%
+2.6% R improvement
(Updated on September 9, 2014)
Minnesota: Hillary vs Tim Pawlenty: D +6%
+2% R improvement
(Updated on June 18, 2014)
Mississippi: Hillary vs Huckabee: R +7%
+4.5% D improvement
(Updated on July 20, 2014)
Montana: Hillary vs Rand Paul: R +13% (Brian Schweitzer vs Rand Paul: R +8%)
+1% D improvement
(Updated on July 23, 2014)
Nevada: Hillary vs Rand Paul: D +3%
+4% R improvement
(Updated on July 31, 2014)
New Hampshire: Hillary vs Huckabee: D +2.1%
+3.5% R improvement
(Updated on July 17, 2014)
New Jersey: Hillary vs Christie: D +8.25%
+9.5% R improvement
(Updated on September 11, 2014)
New Mexico: Hillary vs Susana Martinez: D +14%
+4% D improvement
(Updated on March 27, 2014)
New York: Hillary vs Christie: D +24.6%
+3.6% R improvement
(Updated on August 21, 2014)
North Carolina: Hillary vs Bush: D +1.6%
+3.6% D improvement
Current Democratic gain
(Updated on September 16, 2014)
Ohio: Hillary vs Christie: D +6.7%
+3.7% D improvement
(Updated on July 31, 2014)
Oregon: Hillary vs Rand Paul/Huckabee: D +12%
Unchanged from 2012
(Updated on May 30, 2014)
Pennsylvania: Hillary vs Christie: D +3.5%
+1.9% R improvement
(Updated on June 5, 2014)
South Carolina: Hillary vs Marco Rubio: R +7%
+3.5% D improvement
(Updated on November 2, 2013)
Texas: Hillary vs Huckabee: R +8%
+8% D improvement
(Updated on April 18, 2014)
Virginia: Hillary vs Christie: D +3.64%
+0.2% R improvement
(Updated on July 23, 2014)
West Virginia: Hillary vs Bush: R +14%
+13% D improvement
(Updated on October 1, 2013)
Wisconsin: Hillary vs Ryan: D +4.1%
+2.8% R improvement
(Updated on August 5, 2014)
Wyoming: Hillary vs Christie: R +28%
+13% D improvement
(Updated on July 23, 2013)
Average all 32 states: Hillary vs Best Republican: D +0.5%
+2.2% D improvement (from Obama 2012) [projecting a 6.0% victory for Hillary]
Giving us this map:
(
Red = Democratic lead/trend
Blue = Republican lead/trend
Green = Tied or no trend
Grey = No polling yet
Green = toss up or less than 0.5% lead
20% shade = 0.6-2% lead
30% shade = 2.1-4% lead
40% shade = 4.1-6% lead
50% shade = 6.1-9% lead
60% shade = 9.1-12% lead
70% shade = 12.1-15% lead
80% shade = 15.1-18% lead
90% shade = Above 18.1% lead
In the count of electoral votes, the current situation looks like this:
Hillary: 268 EVs (in 18 states)
Best/Tailormade Republican: 131 EVs (in 14 states)
Toss-up: None
No polling: 139 EVs (in 18 states + D.C.)
So far, Hillary has captured an impressive 67.2% of all EVs awarded, against only 32.8% EVs for the tailormade Republican.
This is how the Trendline Map looks so far:
(
The states which right now are showing the strongest improvement for the Democratic (Hillary) or the Republican candidate (in 10 out of 32 cases, Christie is that person):
1. Kentucky: D +18.2%
2. Arkansas: D +14.2%
3. Kansas: D +14.1%
4. California: R +14%
5. Louisiana: D +14%
6. West Virginia: D +13%
7. Wyoming: D +13%
8. New Jersey: R +9.5%
9. Colorado: R +8.9%
10. Arizona: D +8%
11. Texas: D +8%
12. Connecticut: R +8%
13. Maine: R +7%
14. Georgia: D +6%
15. Alaska: D +6%
16. Mississippi: D +4.5%
17. Florida: D +4.4%
All of these changes (in the 17 states above) are statistically significant, though there are HUGE question marks concerning California.
The whole list of states having been polled till now, going from Democratic stronghold to Republican stronghold:
New York: D +24.6%
New Mexico: D +14%
Oregon: D +12%
California: D +9%
Connecticut: D +9%
New Jersey: D +8.25%
Maine: D +8%
Michigan: D +6.9%
Ohio: D +6.7%
Currently estimated/projected national average: D +6.0%
Minnesota: D +6%
Florida: D +5.3%
Wisconsin: D +4.1%
Iowa: D +3.9%
Virginia: D +3.6%
Pennsylvania: D +3.5%
Nevada: D +3%
New Hampshire: D +2.1%
North Carolina: D +1.6%
Arizona: R +1%
Georgia: R +2%
Louisiana: R +3%
Colorado: R +3.5%
Kentucky: R +4.5%
Mississippi: R +7%
South Carolina: R +7%
Kansas: R +7.5%
Alaska: R +8%
Texas: R +8%
Arkansas: R +9.5%
Montana: R +13%
West Virginia: R +14%
Wyoming: R +28%
The best-tailored Republican candidates in all states polled so far:
1. Chris Christie favoured in 10 of 32 states (for 136 EVs)
2. Jeb Bush favoured in 6 states (Florida, North Carolina, Arizona, Kentucky (!), Kansas & West Virginia - for 74 EVs)
3. Rand Paul favoured in 5 states (California, Oregon (shared), Nevada, Montana & Alaska - for 74 EVs)
4. Mike Huckabee favoured in 6 states (Texas (!), Louisiana (!), Oregon (shared), Arkansas, Mississippi & New Hampshire (!) - for 69 EVs)
5. Paul Ryan favoured in 2 states (Wisconsin & Colorado - for 19 EVs)
6. Tim Pawlenty favoured in 1 state (Minnesota - for 10 EVs)
7. Marco Rubio favoured in 1 state (South Carolina - for 9 EVs)
8. Ben Carson favoured in 1 state (Connecticut - for 7 EVs)
9. Susana Martinez favoured in 1 state (New Mexico - for 5 EVs)
Current update as of September 16.
Title: Re: 2016 Official Polling Map Thread
Post by: pbrower2a on September 16, 2014, 02:02:07 PM
NC, PPP
-The 2016 Presidential race in North Carolina continues to look like it will be close if Hillary Clinton is the Democratic nominee, but the numbers are a little bit better for Republicans this month. Clinton trails both Jeb Bush (45/43) and Mike Huckabee (46/45) by modest margins. She leads Rand Paul (46/41), Chris Christie (45/38), and Ted Cruz (48/40) in hypothetical head to heads.
http://www.publicpolicypolling.com/main/2014/09/hagan-lead-steady-at-4-points.html
Hillary seems to have slipped a bit.
Hillary Clinton vs. Jeb Bush
(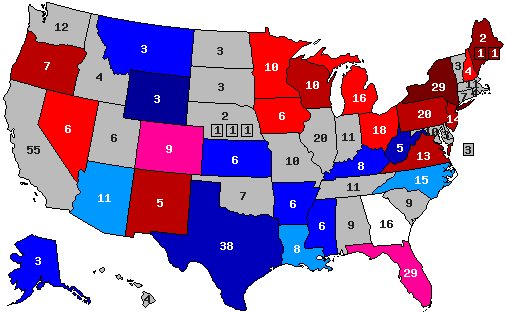 )
)
Hillary Clinton vs. Chris Christie
()
Hillary Clinton vs. Mike Huckabee
(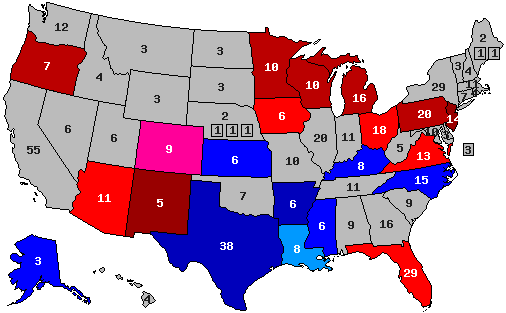 )
)
Hillary Clinton vs. Rand Paul
()
blue, Republican -- red, Democratic
30% -- lead with 40-49% but a margin of 3% or less
40% -- lead with 40-49% but a margin of 4% or more
60% -- lead with 50-54%
70% -- lead with 55-59%
90% -- lead with 60% or more
-The 2016 Presidential race in North Carolina continues to look like it will be close if Hillary Clinton is the Democratic nominee, but the numbers are a little bit better for Republicans this month. Clinton trails both Jeb Bush (45/43) and Mike Huckabee (46/45) by modest margins. She leads Rand Paul (46/41), Chris Christie (45/38), and Ted Cruz (48/40) in hypothetical head to heads.
http://www.publicpolicypolling.com/main/2014/09/hagan-lead-steady-at-4-points.html
Hillary seems to have slipped a bit.
Hillary Clinton vs. Jeb Bush
(
Hillary Clinton vs. Chris Christie
(
Hillary Clinton vs. Mike Huckabee
(
Hillary Clinton vs. Rand Paul
(
blue, Republican -- red, Democratic
30% -- lead with 40-49% but a margin of 3% or less
40% -- lead with 40-49% but a margin of 4% or more
60% -- lead with 50-54%
70% -- lead with 55-59%
90% -- lead with 60% or more
Title: Re: 2016 Official Polling Map Thread
Post by: pbrower2a on September 16, 2014, 02:11:47 PM
The most recent poll by PPP of North Carolina compels me to rate North Carolina as a pure toss-up with Hillary Clinton as the Democratic nominee. Christie and Paul lose, but Bush and Huckabee get bare edges. Mixed results imply a tie.
Here's my projection of the 2016 election based upon what I see in Hillary Clinton against the main four potential nominees in current polls. I pay no attention to Ted Cruz, Mario Rubio, or Scott Walker, as they lose by ludicrous margins in all but sure-R states.
Adjusting for Alaska. I ignore Sarah Palin. I also ignore the Gravis poll for Wisconsin because the one binary choice involves Paul Ryan, who has never done well anywhere and is a classic non-choice for the Presidency.
( )
)
Legitimate swing states:
white -- mixed results or any tie
pink -- D lead in all 4 current polls, but swing states in 2008 and 2012
pale blue -- R lead in all current polls, all but one of them under 4%
Fringe swing states:
medium red -- D lead by at least 4% (but under 50%) in all but at most one poll but not swing states in 2008 or 2012
medium blue -- R lead by at least 4% (but under 50%) in all but at most one poll but not swing states in 2008 or 2012
Non-swing states
dark red -- D lead with at least 50% in at least two polls
dark blue -- R lead with at least 50% in at least two polls
Gray -- no polling
Now, based on how states did in 2008 and 2012 and how analogous states do, I fill in the rest:
(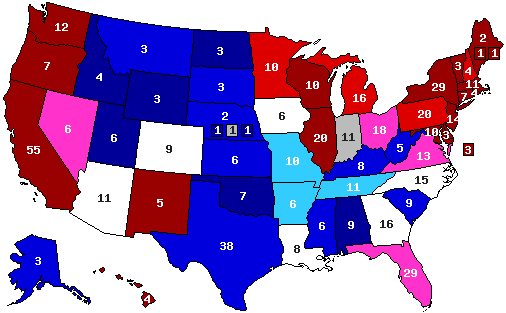 )
)
Legitimate swing states:
white -- mixed results or any tie 66
pink -- D lead in all 4 current polls, but swing states in 2008 and 2012, or a split 81
pale blue -- R lead in all current polls, all but one of them under 4% 14
Fringe swing states:
medium red -- D lead by at least 4% (but under 50%) in all but at most one poll but not swing states in 2008 or 2012 50
medium blue -- R lead by at least 4% (but under 50%) in all but at most one poll but not swing states in 2008 or 2012 76
Non-swing states
dark red -- D lead with at least 50% in at least two polls 199
dark blue -- R lead with at least 50% in at least two polls 32
Gray -- I have no idea (no suitable analogues) 12
I see America much less polarized now than it was in 2008 or 2012.
Here's my projection of the 2016 election based upon what I see in Hillary Clinton against the main four potential nominees in current polls. I pay no attention to Ted Cruz, Mario Rubio, or Scott Walker, as they lose by ludicrous margins in all but sure-R states.
Adjusting for Alaska. I ignore Sarah Palin. I also ignore the Gravis poll for Wisconsin because the one binary choice involves Paul Ryan, who has never done well anywhere and is a classic non-choice for the Presidency.
(
Legitimate swing states:
white -- mixed results or any tie
pink -- D lead in all 4 current polls, but swing states in 2008 and 2012
pale blue -- R lead in all current polls, all but one of them under 4%
Fringe swing states:
medium red -- D lead by at least 4% (but under 50%) in all but at most one poll but not swing states in 2008 or 2012
medium blue -- R lead by at least 4% (but under 50%) in all but at most one poll but not swing states in 2008 or 2012
Non-swing states
dark red -- D lead with at least 50% in at least two polls
dark blue -- R lead with at least 50% in at least two polls
Gray -- no polling
Now, based on how states did in 2008 and 2012 and how analogous states do, I fill in the rest:
(
Legitimate swing states:
white -- mixed results or any tie 66
pink -- D lead in all 4 current polls, but swing states in 2008 and 2012, or a split 81
pale blue -- R lead in all current polls, all but one of them under 4% 14
Fringe swing states:
medium red -- D lead by at least 4% (but under 50%) in all but at most one poll but not swing states in 2008 or 2012 50
medium blue -- R lead by at least 4% (but under 50%) in all but at most one poll but not swing states in 2008 or 2012 76
Non-swing states
dark red -- D lead with at least 50% in at least two polls 199
dark blue -- R lead with at least 50% in at least two polls 32
Gray -- I have no idea (no suitable analogues) 12
I see America much less polarized now than it was in 2008 or 2012.
Title: Re: 2016 Official Polling Map Thread
Post by: eric82oslo on September 16, 2014, 06:33:21 PM
PPP just released its 2nd 2016 poll of the day - which also happens to be the 4th one from Kansas. :) Of the 5 GOPers, only Cruz is trailing Clinton, and here are the new Kansas averages:
Cruz: D +1% (2 polls, down 2%)
Christie: R +4.3% (3 polls, down 1.2%)
Rand Paul: R +4.3% (3 polls, down 1.2%)
Rubio: R +5%
Huckabee: R +5% (3 polls, down 1%)
Paul Ryan: R +7%
Bush: R +7% (3 polls, down 0.5%)
That means that Jeb is losing his exclusive lead in Kansas - he has to share it with Paul Ryan for now. However, since Bush has been polled more extensively, he's probably keeping the edge, though that's speculation.
Kansas is now the state showing the 2nd strongest shift towards Hillary, after Kentucky - and just before Arkansas.
The total number of state polls included below has now reached 171.
The 2016 poll averages for each state - 32 states right now - and the change from the actual 2012 outcomes. Only the Republican candidate with the best statewide polling included.
Alaska: Hillary vs Rand Paul: R +8%
+6% D improvement
(Updated on August 12, 2014)
Arizona: Hillary vs Bush: R +1%
+8% D improvement
(Updated on March 6, 2014)
Arkansas: Hillary vs Mike Huckabee: R +9.5%
+14.2% D improvement
(Updated on September 15, 2014)
California: Hillary vs Rand Paul: D +9%
+14% R improvement
(Updated on August 1, 2014)
Colorado: Hillary vs Paul Ryan: R +3.5%
+8.9% R improvement
Current Republican gain
(Updated on July 29, 2014)
Connecticut: Hillary vs Ben Carson: D +9%
+8% R improvement
(Updated on August 11, 2014)
Florida: Hillary vs Bush: D +5.3%
+4.4% D improvement
(Updated on September 10, 2014)
Georgia: Hillary vs Christie: R +2%
+6% D improvement
(Updated August 8, 2013)
Iowa: Hillary vs Christie: D +3.9%
+1.9% R improvement
(Updated on July 17, 2014)
Kansas: Hillary vs Bush/Ryan: R +7%
+14.6% D improvement
(Updated on September 17, 2014)
Kentucky: Hillary vs Bush: R +4.5%
+18.2% D improvement
(Updated on August 13, 2014)
Louisiana: Hillary vs Huckabee: R +3%
+14% D improvement
(Updated on July 12, 2014)
Maine: Hillary vs Christie: D +8%
+7% R improvement
(Updated on November 13, 2013)
Michigan: Hillary vs Christie: D +6.9%
+2.6% R improvement
(Updated on September 9, 2014)
Minnesota: Hillary vs Tim Pawlenty: D +6%
+2% R improvement
(Updated on June 18, 2014)
Mississippi: Hillary vs Huckabee: R +7%
+4.5% D improvement
(Updated on July 20, 2014)
Montana: Hillary vs Rand Paul: R +13% (Brian Schweitzer vs Rand Paul: R +8%)
+1% D improvement
(Updated on July 23, 2014)
Nevada: Hillary vs Rand Paul: D +3%
+4% R improvement
(Updated on July 31, 2014)
New Hampshire: Hillary vs Huckabee: D +2.1%
+3.5% R improvement
(Updated on July 17, 2014)
New Jersey: Hillary vs Christie: D +8.25%
+9.5% R improvement
(Updated on September 11, 2014)
New Mexico: Hillary vs Susana Martinez: D +14%
+4% D improvement
(Updated on March 27, 2014)
New York: Hillary vs Christie: D +24.6%
+3.6% R improvement
(Updated on August 21, 2014)
North Carolina: Hillary vs Bush: D +1.6%
+3.6% D improvement
Current Democratic gain
(Updated on September 16, 2014)
Ohio: Hillary vs Christie: D +6.7%
+3.7% D improvement
(Updated on July 31, 2014)
Oregon: Hillary vs Rand Paul/Huckabee: D +12%
Unchanged from 2012
(Updated on May 30, 2014)
Pennsylvania: Hillary vs Christie: D +3.5%
+1.9% R improvement
(Updated on June 5, 2014)
South Carolina: Hillary vs Marco Rubio: R +7%
+3.5% D improvement
(Updated on November 2, 2013)
Texas: Hillary vs Huckabee: R +8%
+8% D improvement
(Updated on April 18, 2014)
Virginia: Hillary vs Christie: D +3.64%
+0.2% R improvement
(Updated on July 23, 2014)
West Virginia: Hillary vs Bush: R +14%
+13% D improvement
(Updated on October 1, 2013)
Wisconsin: Hillary vs Ryan: D +4.1%
+2.8% R improvement
(Updated on August 5, 2014)
Wyoming: Hillary vs Christie: R +28%
+13% D improvement
(Updated on July 23, 2013)
Average all 32 states: Hillary vs Best Republican: D +0.5%
+2.2% D improvement (from Obama 2012) [projecting a 6.0% victory for Hillary]
Giving us this map:
()
Red = Democratic lead/trend
Blue = Republican lead/trend
Green = Tied or no trend
Grey = No polling yet
Green = toss up or less than 0.5% lead
20% shade = 0.6-2% lead
30% shade = 2.1-4% lead
40% shade = 4.1-6% lead
50% shade = 6.1-9% lead
60% shade = 9.1-12% lead
70% shade = 12.1-15% lead
80% shade = 15.1-18% lead
90% shade = Above 18.1% lead
In the count of electoral votes, the current situation looks like this:
Hillary: 268 EVs (in 18 states)
Best/Tailormade Republican: 131 EVs (in 14 states)
Toss-up: None
No polling: 139 EVs (in 18 states + D.C.)
So far, Hillary has captured an impressive 67.2% of all EVs awarded, against only 32.8% EVs for the tailormade Republican.
This is how the Trendline Map looks so far:
()
The states which right now are showing the strongest improvement for the Democratic (Hillary) or the Republican candidate (in 10 out of 32 cases, Christie is that person):
1. Kentucky: D +18.2%
2. Kansas: D +14.6%
3. Arkansas: D +14.2%
4. California: R +14%
5. Louisiana: D +14%
6. West Virginia: D +13%
7. Wyoming: D +13%
8. New Jersey: R +9.5%
9. Colorado: R +8.9%
10. Arizona: D +8%
11. Texas: D +8%
12. Connecticut: R +8%
13. Maine: R +7%
14. Georgia: D +6%
15. Alaska: D +6%
16. Mississippi: D +4.5%
17. Florida: D +4.4%
All of these changes (in the 17 states above) are statistically significant, though there are HUGE question marks concerning California.
The whole list of states having been polled till now, going from Democratic stronghold to Republican stronghold:
New York: D +24.6%
New Mexico: D +14%
Oregon: D +12%
California: D +9%
Connecticut: D +9%
New Jersey: D +8.25%
Maine: D +8%
Michigan: D +6.9%
Ohio: D +6.7%
Currently estimated/projected national average: D +6.0%
Minnesota: D +6%
Florida: D +5.3%
Wisconsin: D +4.1%
Iowa: D +3.9%
Virginia: D +3.6%
Pennsylvania: D +3.5%
Nevada: D +3%
New Hampshire: D +2.1%
North Carolina: D +1.6%
Arizona: R +1%
Georgia: R +2%
Louisiana: R +3%
Colorado: R +3.5%
Kentucky: R +4.5%
Kansas: R +7%
Mississippi: R +7%
South Carolina: R +7%
Alaska: R +8%
Texas: R +8%
Arkansas: R +9.5%
Montana: R +13%
West Virginia: R +14%
Wyoming: R +28%
The best-tailored Republican candidates in all states polled so far:
1. Chris Christie favoured in 10 of 32 states (for 136 EVs)
2. Jeb Bush favoured in 6 states (Florida, North Carolina, Arizona, Kentucky (!), Kansas (shared) & West Virginia - for 74 EVs)
3. Rand Paul favoured in 5 states (California, Oregon (shared), Nevada, Montana & Alaska - for 74 EVs)
4. Mike Huckabee favoured in 6 states (Texas (!), Louisiana (!), Oregon (shared), Arkansas, Mississippi & New Hampshire (!) - for 69 EVs)
5. Paul Ryan favoured in 3 states (Wisconsin, Colorado & Kansas - for 25 EVs)
6. Tim Pawlenty favoured in 1 state (Minnesota - for 10 EVs)
7. Marco Rubio favoured in 1 state (South Carolina - for 9 EVs)
8. Ben Carson favoured in 1 state (Connecticut - for 7 EVs)
9. Susana Martinez favoured in 1 state (New Mexico - for 5 EVs)
Current update as of September 17.
Cruz: D +1% (2 polls, down 2%)
Christie: R +4.3% (3 polls, down 1.2%)
Rand Paul: R +4.3% (3 polls, down 1.2%)
Rubio: R +5%
Huckabee: R +5% (3 polls, down 1%)
Paul Ryan: R +7%
Bush: R +7% (3 polls, down 0.5%)
That means that Jeb is losing his exclusive lead in Kansas - he has to share it with Paul Ryan for now. However, since Bush has been polled more extensively, he's probably keeping the edge, though that's speculation.
Kansas is now the state showing the 2nd strongest shift towards Hillary, after Kentucky - and just before Arkansas.
The total number of state polls included below has now reached 171.
The 2016 poll averages for each state - 32 states right now - and the change from the actual 2012 outcomes. Only the Republican candidate with the best statewide polling included.
Alaska: Hillary vs Rand Paul: R +8%
+6% D improvement
(Updated on August 12, 2014)
Arizona: Hillary vs Bush: R +1%
+8% D improvement
(Updated on March 6, 2014)
Arkansas: Hillary vs Mike Huckabee: R +9.5%
+14.2% D improvement
(Updated on September 15, 2014)
California: Hillary vs Rand Paul: D +9%
+14% R improvement
(Updated on August 1, 2014)
Colorado: Hillary vs Paul Ryan: R +3.5%
+8.9% R improvement
Current Republican gain
(Updated on July 29, 2014)
Connecticut: Hillary vs Ben Carson: D +9%
+8% R improvement
(Updated on August 11, 2014)
Florida: Hillary vs Bush: D +5.3%
+4.4% D improvement
(Updated on September 10, 2014)
Georgia: Hillary vs Christie: R +2%
+6% D improvement
(Updated August 8, 2013)
Iowa: Hillary vs Christie: D +3.9%
+1.9% R improvement
(Updated on July 17, 2014)
Kansas: Hillary vs Bush/Ryan: R +7%
+14.6% D improvement
(Updated on September 17, 2014)
Kentucky: Hillary vs Bush: R +4.5%
+18.2% D improvement
(Updated on August 13, 2014)
Louisiana: Hillary vs Huckabee: R +3%
+14% D improvement
(Updated on July 12, 2014)
Maine: Hillary vs Christie: D +8%
+7% R improvement
(Updated on November 13, 2013)
Michigan: Hillary vs Christie: D +6.9%
+2.6% R improvement
(Updated on September 9, 2014)
Minnesota: Hillary vs Tim Pawlenty: D +6%
+2% R improvement
(Updated on June 18, 2014)
Mississippi: Hillary vs Huckabee: R +7%
+4.5% D improvement
(Updated on July 20, 2014)
Montana: Hillary vs Rand Paul: R +13% (Brian Schweitzer vs Rand Paul: R +8%)
+1% D improvement
(Updated on July 23, 2014)
Nevada: Hillary vs Rand Paul: D +3%
+4% R improvement
(Updated on July 31, 2014)
New Hampshire: Hillary vs Huckabee: D +2.1%
+3.5% R improvement
(Updated on July 17, 2014)
New Jersey: Hillary vs Christie: D +8.25%
+9.5% R improvement
(Updated on September 11, 2014)
New Mexico: Hillary vs Susana Martinez: D +14%
+4% D improvement
(Updated on March 27, 2014)
New York: Hillary vs Christie: D +24.6%
+3.6% R improvement
(Updated on August 21, 2014)
North Carolina: Hillary vs Bush: D +1.6%
+3.6% D improvement
Current Democratic gain
(Updated on September 16, 2014)
Ohio: Hillary vs Christie: D +6.7%
+3.7% D improvement
(Updated on July 31, 2014)
Oregon: Hillary vs Rand Paul/Huckabee: D +12%
Unchanged from 2012
(Updated on May 30, 2014)
Pennsylvania: Hillary vs Christie: D +3.5%
+1.9% R improvement
(Updated on June 5, 2014)
South Carolina: Hillary vs Marco Rubio: R +7%
+3.5% D improvement
(Updated on November 2, 2013)
Texas: Hillary vs Huckabee: R +8%
+8% D improvement
(Updated on April 18, 2014)
Virginia: Hillary vs Christie: D +3.64%
+0.2% R improvement
(Updated on July 23, 2014)
West Virginia: Hillary vs Bush: R +14%
+13% D improvement
(Updated on October 1, 2013)
Wisconsin: Hillary vs Ryan: D +4.1%
+2.8% R improvement
(Updated on August 5, 2014)
Wyoming: Hillary vs Christie: R +28%
+13% D improvement
(Updated on July 23, 2013)
Average all 32 states: Hillary vs Best Republican: D +0.5%
+2.2% D improvement (from Obama 2012) [projecting a 6.0% victory for Hillary]
Giving us this map:
(
Red = Democratic lead/trend
Blue = Republican lead/trend
Green = Tied or no trend
Grey = No polling yet
Green = toss up or less than 0.5% lead
20% shade = 0.6-2% lead
30% shade = 2.1-4% lead
40% shade = 4.1-6% lead
50% shade = 6.1-9% lead
60% shade = 9.1-12% lead
70% shade = 12.1-15% lead
80% shade = 15.1-18% lead
90% shade = Above 18.1% lead
In the count of electoral votes, the current situation looks like this:
Hillary: 268 EVs (in 18 states)
Best/Tailormade Republican: 131 EVs (in 14 states)
Toss-up: None
No polling: 139 EVs (in 18 states + D.C.)
So far, Hillary has captured an impressive 67.2% of all EVs awarded, against only 32.8% EVs for the tailormade Republican.
This is how the Trendline Map looks so far:
(
The states which right now are showing the strongest improvement for the Democratic (Hillary) or the Republican candidate (in 10 out of 32 cases, Christie is that person):
1. Kentucky: D +18.2%
2. Kansas: D +14.6%
3. Arkansas: D +14.2%
4. California: R +14%
5. Louisiana: D +14%
6. West Virginia: D +13%
7. Wyoming: D +13%
8. New Jersey: R +9.5%
9. Colorado: R +8.9%
10. Arizona: D +8%
11. Texas: D +8%
12. Connecticut: R +8%
13. Maine: R +7%
14. Georgia: D +6%
15. Alaska: D +6%
16. Mississippi: D +4.5%
17. Florida: D +4.4%
All of these changes (in the 17 states above) are statistically significant, though there are HUGE question marks concerning California.
The whole list of states having been polled till now, going from Democratic stronghold to Republican stronghold:
New York: D +24.6%
New Mexico: D +14%
Oregon: D +12%
California: D +9%
Connecticut: D +9%
New Jersey: D +8.25%
Maine: D +8%
Michigan: D +6.9%
Ohio: D +6.7%
Currently estimated/projected national average: D +6.0%
Minnesota: D +6%
Florida: D +5.3%
Wisconsin: D +4.1%
Iowa: D +3.9%
Virginia: D +3.6%
Pennsylvania: D +3.5%
Nevada: D +3%
New Hampshire: D +2.1%
North Carolina: D +1.6%
Arizona: R +1%
Georgia: R +2%
Louisiana: R +3%
Colorado: R +3.5%
Kentucky: R +4.5%
Kansas: R +7%
Mississippi: R +7%
South Carolina: R +7%
Alaska: R +8%
Texas: R +8%
Arkansas: R +9.5%
Montana: R +13%
West Virginia: R +14%
Wyoming: R +28%
The best-tailored Republican candidates in all states polled so far:
1. Chris Christie favoured in 10 of 32 states (for 136 EVs)
2. Jeb Bush favoured in 6 states (Florida, North Carolina, Arizona, Kentucky (!), Kansas (shared) & West Virginia - for 74 EVs)
3. Rand Paul favoured in 5 states (California, Oregon (shared), Nevada, Montana & Alaska - for 74 EVs)
4. Mike Huckabee favoured in 6 states (Texas (!), Louisiana (!), Oregon (shared), Arkansas, Mississippi & New Hampshire (!) - for 69 EVs)
5. Paul Ryan favoured in 3 states (Wisconsin, Colorado & Kansas - for 25 EVs)
6. Tim Pawlenty favoured in 1 state (Minnesota - for 10 EVs)
7. Marco Rubio favoured in 1 state (South Carolina - for 9 EVs)
8. Ben Carson favoured in 1 state (Connecticut - for 7 EVs)
9. Susana Martinez favoured in 1 state (New Mexico - for 5 EVs)
Current update as of September 17.
Title: Re: 2016 Official Polling Map Thread
Post by: eric82oslo on September 17, 2014, 10:43:25 AM
Today we got the 7th poll of Louisiana, and the 1st one of the state from Gravis. It only polled 2 candidates, Paul doing poorly & Bush with a substantial lead. Here are the new averages against Hillary:
Jeb Bush: R +3.25% (4 polls, up 0.6%)
Mike Huckabee: R +3% (2 polls)
Rand Paul: R +1.5% (4 polls, down -0.2%)
Paul Ryan: R +1% (2 polls)
Ted Cruz: D +1%
Chris Christie: D +1.33% (3 polls)
Bobby Jindal: D +2.8% (5 polls)
Marco Rubio: D +3%
As was the case in North Carolina yesterday, Bush advances to the top of the field in another state, by surpassing Huckabee's strenght in Louisiana! With this, Jeb is becoming a serious contender for sure.
The total number of state polls included below has now reached 172.
The 2016 poll averages for each state - 32 states right now - and the change from the actual 2012 outcomes. Only the Republican candidate with the best statewide polling included.
Alaska: Hillary vs Rand Paul: R +8%
+6% D improvement
(Updated on August 12, 2014)
Arizona: Hillary vs Bush: R +1%
+8% D improvement
(Updated on March 6, 2014)
Arkansas: Hillary vs Mike Huckabee: R +9.5%
+14.2% D improvement
(Updated on September 15, 2014)
California: Hillary vs Rand Paul: D +9%
+14% R improvement
(Updated on August 1, 2014)
Colorado: Hillary vs Paul Ryan: R +3.5%
+8.9% R improvement
Current Republican gain
(Updated on July 29, 2014)
Connecticut: Hillary vs Ben Carson: D +9%
+8% R improvement
(Updated on August 11, 2014)
Florida: Hillary vs Bush: D +5.3%
+4.4% D improvement
(Updated on September 10, 2014)
Georgia: Hillary vs Christie: R +2%
+6% D improvement
(Updated August 8, 2013)
Iowa: Hillary vs Christie: D +3.9%
+1.9% R improvement
(Updated on July 17, 2014)
Kansas: Hillary vs Bush/Ryan: R +7%
+14.6% D improvement
(Updated on September 17, 2014)
Kentucky: Hillary vs Bush: R +4.5%
+18.2% D improvement
(Updated on August 13, 2014)
Louisiana: Hillary vs Bush: R +3.25%
+14% D improvement
(Updated on September 17, 2014)
Maine: Hillary vs Christie: D +8%
+7% R improvement
(Updated on November 13, 2013)
Michigan: Hillary vs Christie: D +6.9%
+2.6% R improvement
(Updated on September 9, 2014)
Minnesota: Hillary vs Tim Pawlenty: D +6%
+2% R improvement
(Updated on June 18, 2014)
Mississippi: Hillary vs Huckabee: R +7%
+4.5% D improvement
(Updated on July 20, 2014)
Montana: Hillary vs Rand Paul: R +13% (Brian Schweitzer vs Rand Paul: R +8%)
+1% D improvement
(Updated on July 23, 2014)
Nevada: Hillary vs Rand Paul: D +3%
+4% R improvement
(Updated on July 31, 2014)
New Hampshire: Hillary vs Huckabee: D +2.1%
+3.5% R improvement
(Updated on July 17, 2014)
New Jersey: Hillary vs Christie: D +8.25%
+9.5% R improvement
(Updated on September 11, 2014)
New Mexico: Hillary vs Susana Martinez: D +14%
+4% D improvement
(Updated on March 27, 2014)
New York: Hillary vs Christie: D +24.6%
+3.6% R improvement
(Updated on August 21, 2014)
North Carolina: Hillary vs Bush: D +1.6%
+3.6% D improvement
Current Democratic gain
(Updated on September 16, 2014)
Ohio: Hillary vs Christie: D +6.7%
+3.7% D improvement
(Updated on July 31, 2014)
Oregon: Hillary vs Rand Paul/Huckabee: D +12%
Unchanged from 2012
(Updated on May 30, 2014)
Pennsylvania: Hillary vs Christie: D +3.5%
+1.9% R improvement
(Updated on June 5, 2014)
South Carolina: Hillary vs Marco Rubio: R +7%
+3.5% D improvement
(Updated on November 2, 2013)
Texas: Hillary vs Huckabee: R +8%
+8% D improvement
(Updated on April 18, 2014)
Virginia: Hillary vs Christie: D +3.64%
+0.2% R improvement
(Updated on July 23, 2014)
West Virginia: Hillary vs Bush: R +14%
+13% D improvement
(Updated on October 1, 2013)
Wisconsin: Hillary vs Ryan: D +4.1%
+2.8% R improvement
(Updated on August 5, 2014)
Wyoming: Hillary vs Christie: R +28%
+13% D improvement
(Updated on July 23, 2013)
Average all 32 states: Hillary vs Best Republican: D +0.5%
+2.2% D improvement (from Obama 2012) [projecting a 6.0% victory for Hillary]
Giving us this map:
()
Red = Democratic lead/trend
Blue = Republican lead/trend
Green = Tied or no trend
Grey = No polling yet
Green = toss up or less than 0.5% lead
20% shade = 0.6-2% lead
30% shade = 2.1-4% lead
40% shade = 4.1-6% lead
50% shade = 6.1-9% lead
60% shade = 9.1-12% lead
70% shade = 12.1-15% lead
80% shade = 15.1-18% lead
90% shade = Above 18.1% lead
In the count of electoral votes, the current situation looks like this:
Hillary: 268 EVs (in 18 states)
Best/Tailormade Republican: 131 EVs (in 14 states)
Toss-up: None
No polling: 139 EVs (in 18 states + D.C.)
So far, Hillary has captured an impressive 67.2% of all EVs awarded, against only 32.8% EVs for the tailormade Republican.
This is how the Trendline Map looks so far:
()
The states which right now are showing the strongest improvement for the Democratic (Hillary) or the Republican candidate (in 10 out of 32 cases, Christie is that person):
1. Kentucky: D +18.2%
2. Kansas: D +14.6%
3. Arkansas: D +14.2%
4. California: R +14%
5. Louisiana: D +14%
6. West Virginia: D +13%
7. Wyoming: D +13%
8. New Jersey: R +9.5%
9. Colorado: R +8.9%
10. Arizona: D +8%
11. Texas: D +8%
12. Connecticut: R +8%
13. Maine: R +7%
14. Georgia: D +6%
15. Alaska: D +6%
16. Mississippi: D +4.5%
17. Florida: D +4.4%
All of these changes (in the 17 states above) are statistically significant, though there are HUGE question marks concerning California.
The whole list of states having been polled till now, going from Democratic stronghold to Republican stronghold:
New York: D +24.6%
New Mexico: D +14%
Oregon: D +12%
California: D +9%
Connecticut: D +9%
New Jersey: D +8.25%
Maine: D +8%
Michigan: D +6.9%
Ohio: D +6.7%
Currently estimated/projected national average: D +6.0%
Minnesota: D +6%
Florida: D +5.3%
Wisconsin: D +4.1%
Iowa: D +3.9%
Virginia: D +3.6%
Pennsylvania: D +3.5%
Nevada: D +3%
New Hampshire: D +2.1%
North Carolina: D +1.6%
Arizona: R +1%
Georgia: R +2%
Louisiana: R +3.25%
Colorado: R +3.5%
Kentucky: R +4.5%
Kansas: R +7%
Mississippi: R +7%
South Carolina: R +7%
Alaska: R +8%
Texas: R +8%
Arkansas: R +9.5%
Montana: R +13%
West Virginia: R +14%
Wyoming: R +28%
The best-tailored Republican candidates in all states polled so far:
1. Chris Christie favoured in 10 of 32 states (for 136 EVs)
2. Jeb Bush favoured in 7 states (Florida, North Carolina, Arizona, Kentucky (!), Louisiana (!), Kansas (shared) & West Virginia - for 82 EVs)
3. Rand Paul favoured in 5 states (California, Oregon (shared), Nevada, Montana & Alaska - for 74 EVs)
4. Mike Huckabee favoured in 5 states (Texas (!), Oregon (shared), Arkansas, Mississippi & New Hampshire (!) - for 61 EVs)
5. Paul Ryan favoured in 3 states (Wisconsin, Colorado & Kansas - for 25 EVs)
6. Tim Pawlenty favoured in 1 state (Minnesota - for 10 EVs)
7. Marco Rubio favoured in 1 state (South Carolina - for 9 EVs)
8. Ben Carson favoured in 1 state (Connecticut - for 7 EVs)
9. Susana Martinez favoured in 1 state (New Mexico - for 5 EVs)
Current update as of September 17.
Jeb Bush: R +3.25% (4 polls, up 0.6%)
Mike Huckabee: R +3% (2 polls)
Rand Paul: R +1.5% (4 polls, down -0.2%)
Paul Ryan: R +1% (2 polls)
Ted Cruz: D +1%
Chris Christie: D +1.33% (3 polls)
Bobby Jindal: D +2.8% (5 polls)
Marco Rubio: D +3%
As was the case in North Carolina yesterday, Bush advances to the top of the field in another state, by surpassing Huckabee's strenght in Louisiana! With this, Jeb is becoming a serious contender for sure.
The total number of state polls included below has now reached 172.
The 2016 poll averages for each state - 32 states right now - and the change from the actual 2012 outcomes. Only the Republican candidate with the best statewide polling included.
Alaska: Hillary vs Rand Paul: R +8%
+6% D improvement
(Updated on August 12, 2014)
Arizona: Hillary vs Bush: R +1%
+8% D improvement
(Updated on March 6, 2014)
Arkansas: Hillary vs Mike Huckabee: R +9.5%
+14.2% D improvement
(Updated on September 15, 2014)
California: Hillary vs Rand Paul: D +9%
+14% R improvement
(Updated on August 1, 2014)
Colorado: Hillary vs Paul Ryan: R +3.5%
+8.9% R improvement
Current Republican gain
(Updated on July 29, 2014)
Connecticut: Hillary vs Ben Carson: D +9%
+8% R improvement
(Updated on August 11, 2014)
Florida: Hillary vs Bush: D +5.3%
+4.4% D improvement
(Updated on September 10, 2014)
Georgia: Hillary vs Christie: R +2%
+6% D improvement
(Updated August 8, 2013)
Iowa: Hillary vs Christie: D +3.9%
+1.9% R improvement
(Updated on July 17, 2014)
Kansas: Hillary vs Bush/Ryan: R +7%
+14.6% D improvement
(Updated on September 17, 2014)
Kentucky: Hillary vs Bush: R +4.5%
+18.2% D improvement
(Updated on August 13, 2014)
Louisiana: Hillary vs Bush: R +3.25%
+14% D improvement
(Updated on September 17, 2014)
Maine: Hillary vs Christie: D +8%
+7% R improvement
(Updated on November 13, 2013)
Michigan: Hillary vs Christie: D +6.9%
+2.6% R improvement
(Updated on September 9, 2014)
Minnesota: Hillary vs Tim Pawlenty: D +6%
+2% R improvement
(Updated on June 18, 2014)
Mississippi: Hillary vs Huckabee: R +7%
+4.5% D improvement
(Updated on July 20, 2014)
Montana: Hillary vs Rand Paul: R +13% (Brian Schweitzer vs Rand Paul: R +8%)
+1% D improvement
(Updated on July 23, 2014)
Nevada: Hillary vs Rand Paul: D +3%
+4% R improvement
(Updated on July 31, 2014)
New Hampshire: Hillary vs Huckabee: D +2.1%
+3.5% R improvement
(Updated on July 17, 2014)
New Jersey: Hillary vs Christie: D +8.25%
+9.5% R improvement
(Updated on September 11, 2014)
New Mexico: Hillary vs Susana Martinez: D +14%
+4% D improvement
(Updated on March 27, 2014)
New York: Hillary vs Christie: D +24.6%
+3.6% R improvement
(Updated on August 21, 2014)
North Carolina: Hillary vs Bush: D +1.6%
+3.6% D improvement
Current Democratic gain
(Updated on September 16, 2014)
Ohio: Hillary vs Christie: D +6.7%
+3.7% D improvement
(Updated on July 31, 2014)
Oregon: Hillary vs Rand Paul/Huckabee: D +12%
Unchanged from 2012
(Updated on May 30, 2014)
Pennsylvania: Hillary vs Christie: D +3.5%
+1.9% R improvement
(Updated on June 5, 2014)
South Carolina: Hillary vs Marco Rubio: R +7%
+3.5% D improvement
(Updated on November 2, 2013)
Texas: Hillary vs Huckabee: R +8%
+8% D improvement
(Updated on April 18, 2014)
Virginia: Hillary vs Christie: D +3.64%
+0.2% R improvement
(Updated on July 23, 2014)
West Virginia: Hillary vs Bush: R +14%
+13% D improvement
(Updated on October 1, 2013)
Wisconsin: Hillary vs Ryan: D +4.1%
+2.8% R improvement
(Updated on August 5, 2014)
Wyoming: Hillary vs Christie: R +28%
+13% D improvement
(Updated on July 23, 2013)
Average all 32 states: Hillary vs Best Republican: D +0.5%
+2.2% D improvement (from Obama 2012) [projecting a 6.0% victory for Hillary]
Giving us this map:
(
Red = Democratic lead/trend
Blue = Republican lead/trend
Green = Tied or no trend
Grey = No polling yet
Green = toss up or less than 0.5% lead
20% shade = 0.6-2% lead
30% shade = 2.1-4% lead
40% shade = 4.1-6% lead
50% shade = 6.1-9% lead
60% shade = 9.1-12% lead
70% shade = 12.1-15% lead
80% shade = 15.1-18% lead
90% shade = Above 18.1% lead
In the count of electoral votes, the current situation looks like this:
Hillary: 268 EVs (in 18 states)
Best/Tailormade Republican: 131 EVs (in 14 states)
Toss-up: None
No polling: 139 EVs (in 18 states + D.C.)
So far, Hillary has captured an impressive 67.2% of all EVs awarded, against only 32.8% EVs for the tailormade Republican.
This is how the Trendline Map looks so far:
(
The states which right now are showing the strongest improvement for the Democratic (Hillary) or the Republican candidate (in 10 out of 32 cases, Christie is that person):
1. Kentucky: D +18.2%
2. Kansas: D +14.6%
3. Arkansas: D +14.2%
4. California: R +14%
5. Louisiana: D +14%
6. West Virginia: D +13%
7. Wyoming: D +13%
8. New Jersey: R +9.5%
9. Colorado: R +8.9%
10. Arizona: D +8%
11. Texas: D +8%
12. Connecticut: R +8%
13. Maine: R +7%
14. Georgia: D +6%
15. Alaska: D +6%
16. Mississippi: D +4.5%
17. Florida: D +4.4%
All of these changes (in the 17 states above) are statistically significant, though there are HUGE question marks concerning California.
The whole list of states having been polled till now, going from Democratic stronghold to Republican stronghold:
New York: D +24.6%
New Mexico: D +14%
Oregon: D +12%
California: D +9%
Connecticut: D +9%
New Jersey: D +8.25%
Maine: D +8%
Michigan: D +6.9%
Ohio: D +6.7%
Currently estimated/projected national average: D +6.0%
Minnesota: D +6%
Florida: D +5.3%
Wisconsin: D +4.1%
Iowa: D +3.9%
Virginia: D +3.6%
Pennsylvania: D +3.5%
Nevada: D +3%
New Hampshire: D +2.1%
North Carolina: D +1.6%
Arizona: R +1%
Georgia: R +2%
Louisiana: R +3.25%
Colorado: R +3.5%
Kentucky: R +4.5%
Kansas: R +7%
Mississippi: R +7%
South Carolina: R +7%
Alaska: R +8%
Texas: R +8%
Arkansas: R +9.5%
Montana: R +13%
West Virginia: R +14%
Wyoming: R +28%
The best-tailored Republican candidates in all states polled so far:
1. Chris Christie favoured in 10 of 32 states (for 136 EVs)
2. Jeb Bush favoured in 7 states (Florida, North Carolina, Arizona, Kentucky (!), Louisiana (!), Kansas (shared) & West Virginia - for 82 EVs)
3. Rand Paul favoured in 5 states (California, Oregon (shared), Nevada, Montana & Alaska - for 74 EVs)
4. Mike Huckabee favoured in 5 states (Texas (!), Oregon (shared), Arkansas, Mississippi & New Hampshire (!) - for 61 EVs)
5. Paul Ryan favoured in 3 states (Wisconsin, Colorado & Kansas - for 25 EVs)
6. Tim Pawlenty favoured in 1 state (Minnesota - for 10 EVs)
7. Marco Rubio favoured in 1 state (South Carolina - for 9 EVs)
8. Ben Carson favoured in 1 state (Connecticut - for 7 EVs)
9. Susana Martinez favoured in 1 state (New Mexico - for 5 EVs)
Current update as of September 17.
Title: Re: 2016 Official Polling Map Thread
Post by: pbrower2a on September 17, 2014, 01:03:19 PM
PPP poll of Kansas:
http://www.publicpolicypolling.com/main/2014/09/orman-davis-lead-kansas-races.html#more
Bush 46%
Clinton 40%
Christie 42%
Clinton 40%
Clinton 44%
Cruz 41%
Huckabee 45%
Clinton 42%
Paul 43%
Clinton 41%
I find it hard to believe that Kansas could be close in the 2016 Presidential election -- but ignoring Ted Cruz (who puts the GOP at risk of losing as badly as Barry Goldwater did in 1964), Kansas would be in play with any Republican other than Jeb Bush.
We're talking about Kansas. Something is going on there. All that I can figure is that the Hard Right fully took over the GOP and purged away the moderates -- but forgot to govern competently. What were moderates in the GOP can basically join the Kansas Democratic Party and take it over much as dissident Democrats took over the Republican Party in some Southern states. It's only six electoral votes, so it isn't as significant as Virginia. The Republican Party still can't afford to lose Kansas.
Hillary Clinton vs. Jeb Bush
()
Hillary Clinton vs. Chris Christie
(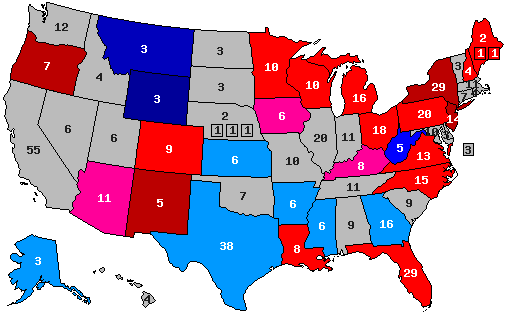 )
)
Hillary Clinton vs. Mike Huckabee
(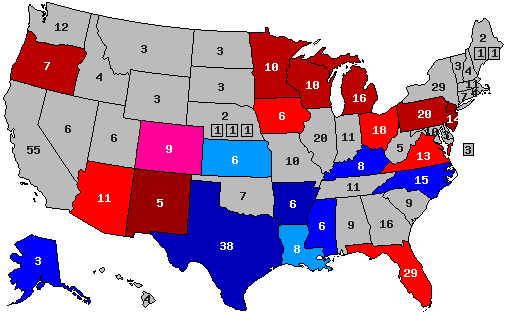 )
)
Hillary Clinton vs. Rand Paul
(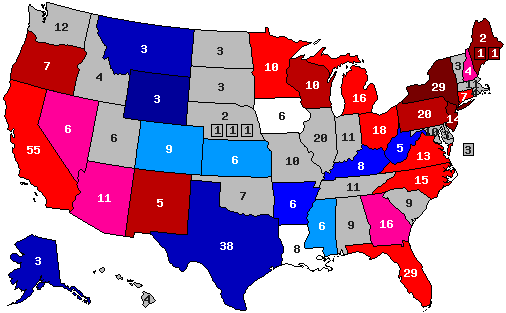 )
)
blue, Republican -- red, Democratic
30% -- lead with 40-49% but a margin of 3% or less
40% -- lead with 40-49% but a margin of 4% or more
60% -- lead with 50-54%
70% -- lead with 55-59%
90% -- lead with 60% or more
http://www.publicpolicypolling.com/main/2014/09/orman-davis-lead-kansas-races.html#more
Bush 46%
Clinton 40%
Christie 42%
Clinton 40%
Clinton 44%
Cruz 41%
Huckabee 45%
Clinton 42%
Paul 43%
Clinton 41%
I find it hard to believe that Kansas could be close in the 2016 Presidential election -- but ignoring Ted Cruz (who puts the GOP at risk of losing as badly as Barry Goldwater did in 1964), Kansas would be in play with any Republican other than Jeb Bush.
We're talking about Kansas. Something is going on there. All that I can figure is that the Hard Right fully took over the GOP and purged away the moderates -- but forgot to govern competently. What were moderates in the GOP can basically join the Kansas Democratic Party and take it over much as dissident Democrats took over the Republican Party in some Southern states. It's only six electoral votes, so it isn't as significant as Virginia. The Republican Party still can't afford to lose Kansas.
Hillary Clinton vs. Jeb Bush
(
Hillary Clinton vs. Chris Christie
(
Hillary Clinton vs. Mike Huckabee
(
Hillary Clinton vs. Rand Paul
(
blue, Republican -- red, Democratic
30% -- lead with 40-49% but a margin of 3% or less
40% -- lead with 40-49% but a margin of 4% or more
60% -- lead with 50-54%
70% -- lead with 55-59%
90% -- lead with 60% or more
Title: Re: 2016 Official Polling Map Thread
Post by: pbrower2a on September 17, 2014, 01:37:49 PM
Here's my projection of the 2016 election based upon what I see in Hillary Clinton against the main four potential nominees in current polls. I pay no attention to Ted Cruz, Mario Rubio, or Scott Walker, as they lose by ludicrous margins in all but sure-R states.
I don't really like to change this map often, especially over a state with 'only' six electoral votes. But the state in question is Kansas, and at this point the state is beginning to show trouble for all potential GOP nominees except Jeb Bush. That is without taking Ted Cruz seriously. Three of four potential nominees would make Kansas very close in 2016.
States have rarely flipped as sharply as Kansas seems to be doing now. This is 'awry' for Republicans who can't afford to lose anything that they used to find reliable, and potentially wondrous for Democrats.
(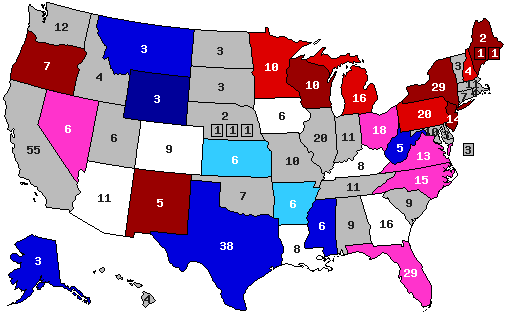 )
)
Legitimate swing states:
white -- mixed results or any tie
pink -- D lead in all 4 current polls, but swing states in 2008 and 2012
pale blue -- R lead in all current polls, all but one of them under 4%
Fringe swing states:
medium red -- D lead by at least 4% (but under 50%) in all but at most one poll but not swing states in 2008 or 2012
medium blue -- R lead by at least 4% (but under 50%) in all but at most one poll but not swing states in 2008 or 2012
Non-swing states
dark red -- D lead with at least 50% in at least two polls
dark blue -- R lead with at least 50% in at least two polls
Gray -- no polling
Now, based on how states did in 2008 and 2012 and how analogous states do, I fill in the rest:
(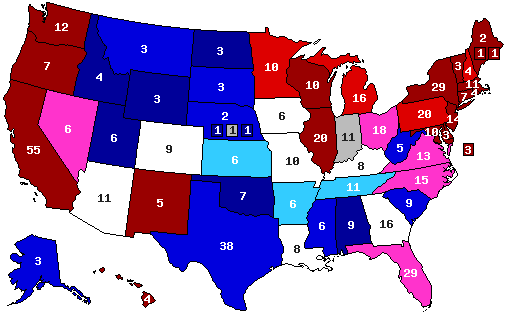 )
)
Legitimate swing states:
white -- mixed results or any tie 66
pink -- D lead in all 4 current polls, but swing states in 2008 and 2012, or a split 81
pale blue -- R lead in all current polls, all but one of them under 4% 14
Fringe swing states:
medium red -- D lead by at least 4% (but under 50%) in all but at most one poll but not swing states in 2008 or 2012 50
medium blue -- R lead by at least 4% (but under 50%) in all but at most one poll but not swing states in 2008 or 2012 76
Non-swing states
dark red -- D lead with at least 50% in at least two polls 199
dark blue -- R lead with at least 50% in at least two polls 32
Gray -- I have no idea (no suitable analogues) 12
I see America much less polarized now than it was in 2008 or 2012.
I don't really like to change this map often, especially over a state with 'only' six electoral votes. But the state in question is Kansas, and at this point the state is beginning to show trouble for all potential GOP nominees except Jeb Bush. That is without taking Ted Cruz seriously. Three of four potential nominees would make Kansas very close in 2016.
States have rarely flipped as sharply as Kansas seems to be doing now. This is 'awry' for Republicans who can't afford to lose anything that they used to find reliable, and potentially wondrous for Democrats.
(
Legitimate swing states:
white -- mixed results or any tie
pink -- D lead in all 4 current polls, but swing states in 2008 and 2012
pale blue -- R lead in all current polls, all but one of them under 4%
Fringe swing states:
medium red -- D lead by at least 4% (but under 50%) in all but at most one poll but not swing states in 2008 or 2012
medium blue -- R lead by at least 4% (but under 50%) in all but at most one poll but not swing states in 2008 or 2012
Non-swing states
dark red -- D lead with at least 50% in at least two polls
dark blue -- R lead with at least 50% in at least two polls
Gray -- no polling
Now, based on how states did in 2008 and 2012 and how analogous states do, I fill in the rest:
(
Legitimate swing states:
white -- mixed results or any tie 66
pink -- D lead in all 4 current polls, but swing states in 2008 and 2012, or a split 81
pale blue -- R lead in all current polls, all but one of them under 4% 14
Fringe swing states:
medium red -- D lead by at least 4% (but under 50%) in all but at most one poll but not swing states in 2008 or 2012 50
medium blue -- R lead by at least 4% (but under 50%) in all but at most one poll but not swing states in 2008 or 2012 76
Non-swing states
dark red -- D lead with at least 50% in at least two polls 199
dark blue -- R lead with at least 50% in at least two polls 32
Gray -- I have no idea (no suitable analogues) 12
I see America much less polarized now than it was in 2008 or 2012.
Title: Re: 2016 Official Polling Map Thread
Post by: pbrower2a on September 18, 2014, 11:09:42 AM
For what it is worth, Gravis shows Hillary Clinton only 2% behind Rand Paul in Kentucky. Nothing else that fits this map, but that is a very weak performance for someone who should be a Favorite Son in a state that has gone R by large margins in the last few Presidential elections.
Hillary Clinton vs. Jeb Bush
()
Hillary Clinton vs. Chris Christie
()
Hillary Clinton vs. Mike Huckabee
()
Hillary Clinton vs. Rand Paul
(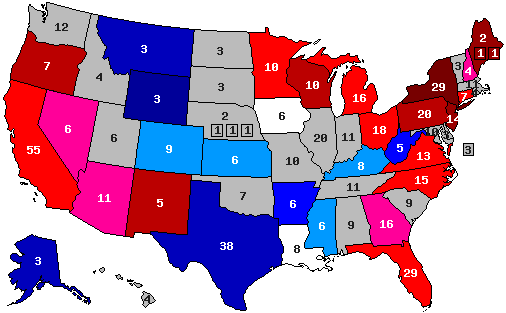 )
)
blue, Republican -- red, Democratic
30% -- lead with 40-49% but a margin of 3% or less
40% -- lead with 40-49% but a margin of 4% or more
60% -- lead with 50-54%
70% -- lead with 55-59%
90% -- lead with 60% or more
Hillary Clinton vs. Jeb Bush
(
Hillary Clinton vs. Chris Christie
(
Hillary Clinton vs. Mike Huckabee
(
Hillary Clinton vs. Rand Paul
(
blue, Republican -- red, Democratic
30% -- lead with 40-49% but a margin of 3% or less
40% -- lead with 40-49% but a margin of 4% or more
60% -- lead with 50-54%
70% -- lead with 55-59%
90% -- lead with 60% or more
Title: Re: 2016 Official Polling Map Thread
Post by: eric82oslo on September 18, 2014, 03:27:17 PM
And along came Gravis reasearching the bluegrass state of Kentucky carefully for us. :P Or perhaps not so carefully, as Rand Paul was the only GOPer tested. Pretty bad news for him, as it showed him basically with a statistical tie against Hillary in his own home state. Here are the new Kentucky averages:
Vs Bush: R +4.5% (2 polls)
Vs Huckabee: R +3%
Vs Rand Paul: R +2.7% (7 polls, down 0.1%)
Vs Christie: R +0.5% (2 polls)
Vs Cruz: D +4% (2 polls)
Vs Rubio: D +7% (2 polls)
Jeb still rules this state for now.
The total number of state polls included below has now reached 173.
The 2016 poll averages for each state - 32 states right now - and the change from the actual 2012 outcomes. Only the Republican candidate with the best statewide polling included.
Alaska: Hillary vs Rand Paul: R +8%
+6% D improvement
(Updated on August 12, 2014)
Arizona: Hillary vs Bush: R +1%
+8% D improvement
(Updated on March 6, 2014)
Arkansas: Hillary vs Mike Huckabee: R +9.5%
+14.2% D improvement
(Updated on September 15, 2014)
California: Hillary vs Rand Paul: D +9%
+14% R improvement
(Updated on August 1, 2014)
Colorado: Hillary vs Paul Ryan: R +3.5%
+8.9% R improvement
Current Republican gain
(Updated on July 29, 2014)
Connecticut: Hillary vs Ben Carson: D +9%
+8% R improvement
(Updated on August 11, 2014)
Florida: Hillary vs Bush: D +5.3%
+4.4% D improvement
(Updated on September 10, 2014)
Georgia: Hillary vs Christie: R +2%
+6% D improvement
(Updated August 8, 2013)
Iowa: Hillary vs Christie: D +3.9%
+1.9% R improvement
(Updated on July 17, 2014)
Kansas: Hillary vs Bush/Ryan: R +7%
+14.6% D improvement
(Updated on September 17, 2014)
Kentucky: Hillary vs Bush: R +4.5%
+18.2% D improvement
(Updated on August 13, 2014)
Louisiana: Hillary vs Bush: R +3.25%
+14% D improvement
(Updated on September 17, 2014)
Maine: Hillary vs Christie: D +8%
+7% R improvement
(Updated on November 13, 2013)
Michigan: Hillary vs Christie: D +6.9%
+2.6% R improvement
(Updated on September 9, 2014)
Minnesota: Hillary vs Tim Pawlenty: D +6%
+2% R improvement
(Updated on June 18, 2014)
Mississippi: Hillary vs Huckabee: R +7%
+4.5% D improvement
(Updated on July 20, 2014)
Montana: Hillary vs Rand Paul: R +13% (Brian Schweitzer vs Rand Paul: R +8%)
+1% D improvement
(Updated on July 23, 2014)
Nevada: Hillary vs Rand Paul: D +3%
+4% R improvement
(Updated on July 31, 2014)
New Hampshire: Hillary vs Huckabee: D +2.1%
+3.5% R improvement
(Updated on July 17, 2014)
New Jersey: Hillary vs Christie: D +8.25%
+9.5% R improvement
(Updated on September 11, 2014)
New Mexico: Hillary vs Susana Martinez: D +14%
+4% D improvement
(Updated on March 27, 2014)
New York: Hillary vs Christie: D +24.6%
+3.6% R improvement
(Updated on August 21, 2014)
North Carolina: Hillary vs Bush: D +1.6%
+3.6% D improvement
Current Democratic gain
(Updated on September 16, 2014)
Ohio: Hillary vs Christie: D +6.7%
+3.7% D improvement
(Updated on July 31, 2014)
Oregon: Hillary vs Rand Paul/Huckabee: D +12%
Unchanged from 2012
(Updated on May 30, 2014)
Pennsylvania: Hillary vs Christie: D +3.5%
+1.9% R improvement
(Updated on June 5, 2014)
South Carolina: Hillary vs Marco Rubio: R +7%
+3.5% D improvement
(Updated on November 2, 2013)
Texas: Hillary vs Huckabee: R +8%
+8% D improvement
(Updated on April 18, 2014)
Virginia: Hillary vs Christie: D +3.64%
+0.2% R improvement
(Updated on July 23, 2014)
West Virginia: Hillary vs Bush: R +14%
+13% D improvement
(Updated on October 1, 2013)
Wisconsin: Hillary vs Ryan: D +4.1%
+2.8% R improvement
(Updated on August 5, 2014)
Wyoming: Hillary vs Christie: R +28%
+13% D improvement
(Updated on July 23, 2013)
Average all 32 states: Hillary vs Best Republican: D +0.5%
+2.2% D improvement (from Obama 2012) [projecting a 6.0% victory for Hillary]
Giving us this map:
()
Red = Democratic lead/trend
Blue = Republican lead/trend
Green = Tied or no trend
Grey = No polling yet
Green = toss up or less than 0.5% lead
20% shade = 0.6-2% lead
30% shade = 2.1-4% lead
40% shade = 4.1-6% lead
50% shade = 6.1-9% lead
60% shade = 9.1-12% lead
70% shade = 12.1-15% lead
80% shade = 15.1-18% lead
90% shade = Above 18.1% lead
In the count of electoral votes, the current situation looks like this:
Hillary: 268 EVs (in 18 states)
Best/Tailormade Republican: 131 EVs (in 14 states)
Toss-up: None
No polling: 139 EVs (in 18 states + D.C.)
So far, Hillary has captured an impressive 67.2% of all EVs awarded, against only 32.8% EVs for the tailormade Republican.
This is how the Trendline Map looks so far:
()
The states which right now are showing the strongest improvement for the Democratic (Hillary) or the Republican candidate (in 10 out of 32 cases, Christie is that person):
1. Kentucky: D +18.2%
2. Kansas: D +14.6%
3. Arkansas: D +14.2%
4. California: R +14%
5. Louisiana: D +14%
6. West Virginia: D +13%
7. Wyoming: D +13%
8. New Jersey: R +9.5%
9. Colorado: R +8.9%
10. Arizona: D +8%
11. Texas: D +8%
12. Connecticut: R +8%
13. Maine: R +7%
14. Georgia: D +6%
15. Alaska: D +6%
16. Mississippi: D +4.5%
17. Florida: D +4.4%
All of these changes (in the 17 states above) are statistically significant, though there are HUGE question marks concerning California.
The whole list of states having been polled till now, going from Democratic stronghold to Republican stronghold:
New York: D +24.6%
New Mexico: D +14%
Oregon: D +12%
California: D +9%
Connecticut: D +9%
New Jersey: D +8.25%
Maine: D +8%
Michigan: D +6.9%
Ohio: D +6.7%
Currently estimated/projected national average: D +6.0%
Minnesota: D +6%
Florida: D +5.3%
Wisconsin: D +4.1%
Iowa: D +3.9%
Virginia: D +3.6%
Pennsylvania: D +3.5%
Nevada: D +3%
New Hampshire: D +2.1%
North Carolina: D +1.6%
Arizona: R +1%
Georgia: R +2%
Louisiana: R +3.25%
Colorado: R +3.5%
Kentucky: R +4.5%
Kansas: R +7%
Mississippi: R +7%
South Carolina: R +7%
Alaska: R +8%
Texas: R +8%
Arkansas: R +9.5%
Montana: R +13%
West Virginia: R +14%
Wyoming: R +28%
The best-tailored Republican candidates in all states polled so far:
1. Chris Christie favoured in 10 of 32 states (for 136 EVs)
2. Jeb Bush favoured in 7 states (Florida, North Carolina, Arizona, Kentucky (!), Louisiana (!), Kansas (shared) & West Virginia - for 82 EVs)
3. Rand Paul favoured in 5 states (California, Oregon (shared), Nevada, Montana & Alaska - for 74 EVs)
4. Mike Huckabee favoured in 5 states (Texas (!), Oregon (shared), Arkansas, Mississippi & New Hampshire (!) - for 61 EVs)
5. Paul Ryan favoured in 3 states (Wisconsin, Colorado & Kansas - for 25 EVs)
6. Tim Pawlenty favoured in 1 state (Minnesota - for 10 EVs)
7. Marco Rubio favoured in 1 state (South Carolina - for 9 EVs)
8. Ben Carson favoured in 1 state (Connecticut - for 7 EVs)
9. Susana Martinez favoured in 1 state (New Mexico - for 5 EVs)
Current update as of September 18.
Vs Bush: R +4.5% (2 polls)
Vs Huckabee: R +3%
Vs Rand Paul: R +2.7% (7 polls, down 0.1%)
Vs Christie: R +0.5% (2 polls)
Vs Cruz: D +4% (2 polls)
Vs Rubio: D +7% (2 polls)
Jeb still rules this state for now.
The total number of state polls included below has now reached 173.
The 2016 poll averages for each state - 32 states right now - and the change from the actual 2012 outcomes. Only the Republican candidate with the best statewide polling included.
Alaska: Hillary vs Rand Paul: R +8%
+6% D improvement
(Updated on August 12, 2014)
Arizona: Hillary vs Bush: R +1%
+8% D improvement
(Updated on March 6, 2014)
Arkansas: Hillary vs Mike Huckabee: R +9.5%
+14.2% D improvement
(Updated on September 15, 2014)
California: Hillary vs Rand Paul: D +9%
+14% R improvement
(Updated on August 1, 2014)
Colorado: Hillary vs Paul Ryan: R +3.5%
+8.9% R improvement
Current Republican gain
(Updated on July 29, 2014)
Connecticut: Hillary vs Ben Carson: D +9%
+8% R improvement
(Updated on August 11, 2014)
Florida: Hillary vs Bush: D +5.3%
+4.4% D improvement
(Updated on September 10, 2014)
Georgia: Hillary vs Christie: R +2%
+6% D improvement
(Updated August 8, 2013)
Iowa: Hillary vs Christie: D +3.9%
+1.9% R improvement
(Updated on July 17, 2014)
Kansas: Hillary vs Bush/Ryan: R +7%
+14.6% D improvement
(Updated on September 17, 2014)
Kentucky: Hillary vs Bush: R +4.5%
+18.2% D improvement
(Updated on August 13, 2014)
Louisiana: Hillary vs Bush: R +3.25%
+14% D improvement
(Updated on September 17, 2014)
Maine: Hillary vs Christie: D +8%
+7% R improvement
(Updated on November 13, 2013)
Michigan: Hillary vs Christie: D +6.9%
+2.6% R improvement
(Updated on September 9, 2014)
Minnesota: Hillary vs Tim Pawlenty: D +6%
+2% R improvement
(Updated on June 18, 2014)
Mississippi: Hillary vs Huckabee: R +7%
+4.5% D improvement
(Updated on July 20, 2014)
Montana: Hillary vs Rand Paul: R +13% (Brian Schweitzer vs Rand Paul: R +8%)
+1% D improvement
(Updated on July 23, 2014)
Nevada: Hillary vs Rand Paul: D +3%
+4% R improvement
(Updated on July 31, 2014)
New Hampshire: Hillary vs Huckabee: D +2.1%
+3.5% R improvement
(Updated on July 17, 2014)
New Jersey: Hillary vs Christie: D +8.25%
+9.5% R improvement
(Updated on September 11, 2014)
New Mexico: Hillary vs Susana Martinez: D +14%
+4% D improvement
(Updated on March 27, 2014)
New York: Hillary vs Christie: D +24.6%
+3.6% R improvement
(Updated on August 21, 2014)
North Carolina: Hillary vs Bush: D +1.6%
+3.6% D improvement
Current Democratic gain
(Updated on September 16, 2014)
Ohio: Hillary vs Christie: D +6.7%
+3.7% D improvement
(Updated on July 31, 2014)
Oregon: Hillary vs Rand Paul/Huckabee: D +12%
Unchanged from 2012
(Updated on May 30, 2014)
Pennsylvania: Hillary vs Christie: D +3.5%
+1.9% R improvement
(Updated on June 5, 2014)
South Carolina: Hillary vs Marco Rubio: R +7%
+3.5% D improvement
(Updated on November 2, 2013)
Texas: Hillary vs Huckabee: R +8%
+8% D improvement
(Updated on April 18, 2014)
Virginia: Hillary vs Christie: D +3.64%
+0.2% R improvement
(Updated on July 23, 2014)
West Virginia: Hillary vs Bush: R +14%
+13% D improvement
(Updated on October 1, 2013)
Wisconsin: Hillary vs Ryan: D +4.1%
+2.8% R improvement
(Updated on August 5, 2014)
Wyoming: Hillary vs Christie: R +28%
+13% D improvement
(Updated on July 23, 2013)
Average all 32 states: Hillary vs Best Republican: D +0.5%
+2.2% D improvement (from Obama 2012) [projecting a 6.0% victory for Hillary]
Giving us this map:
(
Red = Democratic lead/trend
Blue = Republican lead/trend
Green = Tied or no trend
Grey = No polling yet
Green = toss up or less than 0.5% lead
20% shade = 0.6-2% lead
30% shade = 2.1-4% lead
40% shade = 4.1-6% lead
50% shade = 6.1-9% lead
60% shade = 9.1-12% lead
70% shade = 12.1-15% lead
80% shade = 15.1-18% lead
90% shade = Above 18.1% lead
In the count of electoral votes, the current situation looks like this:
Hillary: 268 EVs (in 18 states)
Best/Tailormade Republican: 131 EVs (in 14 states)
Toss-up: None
No polling: 139 EVs (in 18 states + D.C.)
So far, Hillary has captured an impressive 67.2% of all EVs awarded, against only 32.8% EVs for the tailormade Republican.
This is how the Trendline Map looks so far:
(
The states which right now are showing the strongest improvement for the Democratic (Hillary) or the Republican candidate (in 10 out of 32 cases, Christie is that person):
1. Kentucky: D +18.2%
2. Kansas: D +14.6%
3. Arkansas: D +14.2%
4. California: R +14%
5. Louisiana: D +14%
6. West Virginia: D +13%
7. Wyoming: D +13%
8. New Jersey: R +9.5%
9. Colorado: R +8.9%
10. Arizona: D +8%
11. Texas: D +8%
12. Connecticut: R +8%
13. Maine: R +7%
14. Georgia: D +6%
15. Alaska: D +6%
16. Mississippi: D +4.5%
17. Florida: D +4.4%
All of these changes (in the 17 states above) are statistically significant, though there are HUGE question marks concerning California.
The whole list of states having been polled till now, going from Democratic stronghold to Republican stronghold:
New York: D +24.6%
New Mexico: D +14%
Oregon: D +12%
California: D +9%
Connecticut: D +9%
New Jersey: D +8.25%
Maine: D +8%
Michigan: D +6.9%
Ohio: D +6.7%
Currently estimated/projected national average: D +6.0%
Minnesota: D +6%
Florida: D +5.3%
Wisconsin: D +4.1%
Iowa: D +3.9%
Virginia: D +3.6%
Pennsylvania: D +3.5%
Nevada: D +3%
New Hampshire: D +2.1%
North Carolina: D +1.6%
Arizona: R +1%
Georgia: R +2%
Louisiana: R +3.25%
Colorado: R +3.5%
Kentucky: R +4.5%
Kansas: R +7%
Mississippi: R +7%
South Carolina: R +7%
Alaska: R +8%
Texas: R +8%
Arkansas: R +9.5%
Montana: R +13%
West Virginia: R +14%
Wyoming: R +28%
The best-tailored Republican candidates in all states polled so far:
1. Chris Christie favoured in 10 of 32 states (for 136 EVs)
2. Jeb Bush favoured in 7 states (Florida, North Carolina, Arizona, Kentucky (!), Louisiana (!), Kansas (shared) & West Virginia - for 82 EVs)
3. Rand Paul favoured in 5 states (California, Oregon (shared), Nevada, Montana & Alaska - for 74 EVs)
4. Mike Huckabee favoured in 5 states (Texas (!), Oregon (shared), Arkansas, Mississippi & New Hampshire (!) - for 61 EVs)
5. Paul Ryan favoured in 3 states (Wisconsin, Colorado & Kansas - for 25 EVs)
6. Tim Pawlenty favoured in 1 state (Minnesota - for 10 EVs)
7. Marco Rubio favoured in 1 state (South Carolina - for 9 EVs)
8. Ben Carson favoured in 1 state (Connecticut - for 7 EVs)
9. Susana Martinez favoured in 1 state (New Mexico - for 5 EVs)
Current update as of September 18.
Title: Re: 2016 Official Polling Map Thread
Post by: pbrower2a on September 23, 2014, 05:54:33 PM
PPP, Arkansas
Hillary vs Huckabee:41-53 (R+12%)
Hillary vs Bush: 41-46 (R+5%)
Hillary vs Rand Paul: 43-45 (R+2%)
Hillary vs Cruz: 43-44 (R+1%)
Hillary vs Christie: 42-41 (D+1%)
http://www.publicpolicypolling.com/main/2014/09/gop-ticket-leads-in-arkansas.html#more
Possibly in contention in 2016; the Senate race is a toss-up.
Christie looks like a horrible match for Arkansas. Really, if Rand Paul can do no better in Arkansas and Kentucky than recent polls suggest, he could lose the popular vote 55-45.
Alaska, PPP:
Hillary Clinton: 39%
Jeb Bush: 44%
Hillary Clinton: 36%
Chris Christie: 46%
Hillary Clinton: 39%
Ted Cruz: 46%
Hillary Clinton: 40%
Mike Huckabee: 44%
Hillary Clinton: 44%
Sarah Palin: 38%
Hillary Clinton: 40%
Rand Paul: 45%
The most northerly state in the Union looks like a Southern state in its voting. The most southerly state in the Union votes as if it were in New England.
Hillary Clinton vs. Jeb Bush
()
Hillary Clinton vs. Chris Christie
(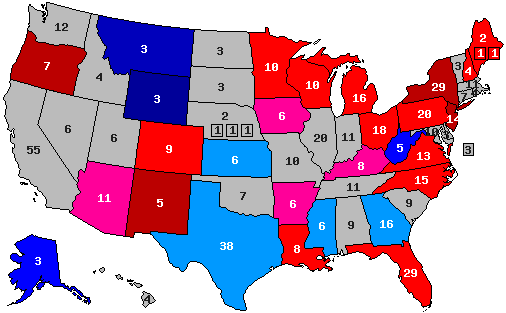 )
)
Hillary Clinton vs. Mike Huckabee
()
Hillary Clinton vs. Rand Paul
( )
)
blue, Republican -- red, Democratic
30% -- lead with 40-49% but a margin of 3% or less
40% -- lead with 40-49% but a margin of 4% or more
60% -- lead with 50-54%
70% -- lead with 55-59%
90% -- lead with 60% or more
Hillary vs Huckabee:41-53 (R+12%)
Hillary vs Bush: 41-46 (R+5%)
Hillary vs Rand Paul: 43-45 (R+2%)
Hillary vs Cruz: 43-44 (R+1%)
Hillary vs Christie: 42-41 (D+1%)
http://www.publicpolicypolling.com/main/2014/09/gop-ticket-leads-in-arkansas.html#more
Possibly in contention in 2016; the Senate race is a toss-up.
Christie looks like a horrible match for Arkansas. Really, if Rand Paul can do no better in Arkansas and Kentucky than recent polls suggest, he could lose the popular vote 55-45.
Alaska, PPP:
Hillary Clinton: 39%
Jeb Bush: 44%
Hillary Clinton: 36%
Chris Christie: 46%
Hillary Clinton: 39%
Ted Cruz: 46%
Hillary Clinton: 40%
Mike Huckabee: 44%
Hillary Clinton: 44%
Sarah Palin: 38%
Hillary Clinton: 40%
Rand Paul: 45%
The most northerly state in the Union looks like a Southern state in its voting. The most southerly state in the Union votes as if it were in New England.
Hillary Clinton vs. Jeb Bush
(
Hillary Clinton vs. Chris Christie
(
Hillary Clinton vs. Mike Huckabee
(
Hillary Clinton vs. Rand Paul
(
blue, Republican -- red, Democratic
30% -- lead with 40-49% but a margin of 3% or less
40% -- lead with 40-49% but a margin of 4% or more
60% -- lead with 50-54%
70% -- lead with 55-59%
90% -- lead with 60% or more
Title: Re: 2016 Official Polling Map Thread
Post by: pbrower2a on September 23, 2014, 06:03:20 PM
Here's my projection of the 2016 election based upon what I see in Hillary Clinton against the main four potential nominees in current polls. I pay no attention to Ted Cruz, Mario Rubio, or Scott Walker, as they lose by ludicrous margins in all but sure-R states.
I don't really like to change this map often, especially over a state with 'only' six electoral votes. The shift of Arkansas from barely R for everyone but Huckabee to having mixed results in polling forces a category change -- over very little.
(
Legitimate swing states:
white -- mixed results or any tie
pink -- D lead in all 4 current polls, but swing states in 2008 and 2012
pale blue -- R lead in all current polls, all but one of them under 4%
Fringe swing states:
medium red -- D lead by at least 4% (but under 50%) in all but at most one poll but not swing states in 2008 or 2012
medium blue -- R lead by at least 4% (but under 50%) in all but at most one poll but not swing states in 2008 or 2012
Non-swing states
dark red -- D lead with at least 50% in at least two polls
dark blue -- R lead with at least 50% in at least two polls
Gray -- no polling
Now, based on how states did in 2008 and 2012 and how analogous states do, I fill in the rest:
(
Legitimate swing states:
white -- mixed results or any tie 66
pink -- D lead in all 4 current polls, but swing states in 2008 and 2012, or a split 81
pale blue -- R lead in all current polls, all but one of them under 4% 14
Fringe swing states:
medium red -- D lead by at least 4% (but under 50%) in all but at most one poll but not swing states in 2008 or 2012 50
medium blue -- R lead by at least 4% (but under 50%) in all but at most one poll but not swing states in 2008 or 2012 76
Non-swing states
dark red -- D lead with at least 50% in at least two polls 199
dark blue -- R lead with at least 50% in at least two polls 32
Gray -- I have no idea (no suitable analogues) 12
I see America much less polarized now than it was in 2008 or 2012.
Title: Re: 2016 Official Polling Map Thread
Post by: eric82oslo on September 23, 2014, 09:16:01 PM
Today we got two new PPP state polls of Arkansas and Alaska. They generally show some good news for the GOPers in Arkansas, while the race in Alaska is relatively unchanged, though being slightly more favorable towards Hillary than the previous consensus. Except when it comes to Christie, who happened to have a fantastic Alaska poll this time around, leading Hillary there by a shocking 10%. A sign of a turnarond thanks to the recent news report stating his non-involvement in Bridgegate or simply a one time fluke? Time will tell. In the meantime, here are the new candidate averages in the two states:
Arkansas:
Vs Huckabee: R +10.3% (3 polls, up 0.8%)
Vs Bush: R +3.0% (4 polls, up 0.7%)
Vs Cruz: R +2.5% (2 polls, down 1.5%)
Vs Rand Paul: R +0.4% (5 polls, up 0.4%)
Vs Christie: D +2.75% (4 poll, up 0.55%)
As we see, Huckabee is increasing his lead in his home state by 0.8%, and he appears now more than three times as lethal there as Jeb (or any other candidate). Christie would have a very hard time in the state however! While Cruz continues to do shockingly well. Surely, Arkansas is a much more conservative state than your average state, further illustrated by how bad both of the moderates, Chris and Rand, do there.
Alaska:
Vs Rand Paul: R +7.4% (5 polls, down 0.6%)
Vs Bush: R +7% (5 polls, down 0.5%)
Vs Cruz: R +7%
Vs Christie: R +6.2% (6 polls, up 0.8%)
Vs Huckabee: R +4.25% (4 polls, unchanged)
Vs Rubio: R +1% (2 polls)
Vs Paul Ryan: R +1%
Vs Palin: D +6.8% (6 polls, up 0.2%)
Alaska on the other hand, is a different game altogether, although it appears somewhat more moderate than Arkansas. Cruz does shockingly well in this state as well, although this is the very first time he's been tested in Alaska. On the other hand, Huckabee does pretty badly here (could it be because Alaskans generally are not that religious and also that the state has a considerably younger population than your average state?) On the same time, the candidate with the most modern approach and the most fresh ideas (and thus more of a moderate), Rand Paul, is leading the pack still in Alaska. Favourite daughter Sarah is not much of a favourite, she would usually do about 14.2% worse than Rand in the state, if the election turned out to be a match-up with Hillary. So instead of winning the state by 7, she would actually be losing the state by 7! All in all, Hillary improves her take on her GOP foes in Alaska with 0.6% from the previous consensus.
A slight improvement for Hillary in Alaska and a slightly more unfavorable picture for her in Arkansas means a pretty unchanged race overall. She thus continues to lead the tailor-made Republican (a superman type of candidate which in reality doesn't or won't exist) by a strong 6% nationally.
Title: Re: 2016 Official Polling Map Thread
Post by: eric82oslo on September 23, 2014, 09:30:26 PM
With PPP's release of its two newest polls in Alaska and Arkansas (see previous post for more details), we now have an impressive 175 state polls registered into the 2016 database.
The total number of state polls included below has now reached 175.
The 2016 poll averages for each state - 32 states right now - and the change from the actual 2012 outcomes. Only the Republican candidate with the best statewide polling included.
Alaska: Hillary vs Rand Paul: R +7.4%
+6.6% D improvement
(Updated on September 24, 2014)
Arizona: Hillary vs Bush: R +1%
+8% D improvement
(Updated on March 6, 2014)
Arkansas: Hillary vs Mike Huckabee: R +10.3%
+13.4% D improvement
(Updated on September 24, 2014)
California: Hillary vs Rand Paul: D +9%
+14% R improvement
(Updated on August 1, 2014)
Colorado: Hillary vs Paul Ryan: R +3.5%
+8.9% R improvement
Current Republican gain
(Updated on July 29, 2014)
Connecticut: Hillary vs Ben Carson: D +9%
+8% R improvement
(Updated on August 11, 2014)
Florida: Hillary vs Bush: D +5.3%
+4.4% D improvement
(Updated on September 10, 2014)
Georgia: Hillary vs Christie: R +2%
+6% D improvement
(Updated August 8, 2013)
Iowa: Hillary vs Christie: D +3.9%
+1.9% R improvement
(Updated on July 17, 2014)
Kansas: Hillary vs Bush/Ryan: R +7%
+14.6% D improvement
(Updated on September 17, 2014)
Kentucky: Hillary vs Bush: R +4.5%
+18.2% D improvement
(Updated on August 13, 2014)
Louisiana: Hillary vs Bush: R +3.25%
+14% D improvement
(Updated on September 17, 2014)
Maine: Hillary vs Christie: D +8%
+7% R improvement
(Updated on November 13, 2013)
Michigan: Hillary vs Christie: D +6.9%
+2.6% R improvement
(Updated on September 9, 2014)
Minnesota: Hillary vs Tim Pawlenty: D +6%
+2% R improvement
(Updated on June 18, 2014)
Mississippi: Hillary vs Huckabee: R +7%
+4.5% D improvement
(Updated on July 20, 2014)
Montana: Hillary vs Rand Paul: R +13% (Brian Schweitzer vs Rand Paul: R +8%)
+1% D improvement
(Updated on July 23, 2014)
Nevada: Hillary vs Rand Paul: D +3%
+4% R improvement
(Updated on July 31, 2014)
New Hampshire: Hillary vs Huckabee: D +2.1%
+3.5% R improvement
(Updated on July 17, 2014)
New Jersey: Hillary vs Christie: D +8.25%
+9.5% R improvement
(Updated on September 11, 2014)
New Mexico: Hillary vs Susana Martinez: D +14%
+4% D improvement
(Updated on March 27, 2014)
New York: Hillary vs Christie: D +24.6%
+3.6% R improvement
(Updated on August 21, 2014)
North Carolina: Hillary vs Bush: D +1.6%
+3.6% D improvement
Current Democratic gain
(Updated on September 16, 2014)
Ohio: Hillary vs Christie: D +6.7%
+3.7% D improvement
(Updated on July 31, 2014)
Oregon: Hillary vs Rand Paul/Huckabee: D +12%
Unchanged from 2012
(Updated on May 30, 2014)
Pennsylvania: Hillary vs Christie: D +3.5%
+1.9% R improvement
(Updated on June 5, 2014)
South Carolina: Hillary vs Marco Rubio: R +7%
+3.5% D improvement
(Updated on November 2, 2013)
Texas: Hillary vs Huckabee: R +8%
+8% D improvement
(Updated on April 18, 2014)
Virginia: Hillary vs Christie: D +3.64%
+0.2% R improvement
(Updated on July 23, 2014)
West Virginia: Hillary vs Bush: R +14%
+13% D improvement
(Updated on October 1, 2013)
Wisconsin: Hillary vs Ryan: D +4.1%
+2.8% R improvement
(Updated on August 5, 2014)
Wyoming: Hillary vs Christie: R +28%
+13% D improvement
(Updated on July 23, 2013)
Average all 32 states: Hillary vs Best Republican: D +0.5%
+2.2% D improvement (from Obama 2012) [projecting a 6.0% victory for Hillary]
Giving us this map:
()
Red = Democratic lead/trend
Blue = Republican lead/trend
Green = Tied or no trend
Grey = No polling yet
Green = toss up or less than 0.5% lead
20% shade = 0.6-2% lead
30% shade = 2.1-4% lead
40% shade = 4.1-6% lead
50% shade = 6.1-9% lead
60% shade = 9.1-12% lead
70% shade = 12.1-15% lead
80% shade = 15.1-18% lead
90% shade = Above 18.1% lead
In the count of electoral votes, the current situation looks like this:
Hillary: 268 EVs (in 18 states)
Best/Tailormade Republican: 131 EVs (in 14 states)
Toss-up: None
No polling: 139 EVs (in 18 states + D.C.)
So far, Hillary has captured an impressive 67.2% of all EVs awarded, against only 32.8% EVs for the tailormade Republican.
This is how the Trendline Map looks so far:
( )
)
The states which right now are showing the strongest improvement for the Democratic (Hillary) or the Republican candidate (in 10 out of 32 cases, Christie is that person):
1. Kentucky: D +18.2%
2. Kansas: D +14.6%
3. California: R +14%
4. Louisiana: D +14%
5. Arkansas: D +13.4%
6. West Virginia: D +13%
7. Wyoming: D +13%
8. New Jersey: R +9.5%
9. Colorado: R +8.9%
10. Arizona: D +8%
11. Texas: D +8%
12. Connecticut: R +8%
13. Maine: R +7%
14. Alaska: D +6.6%
15. Georgia: D +6%
16. Mississippi: D +4.5%
17. Florida: D +4.4%
All of these changes (in the 17 states above) are statistically significant, though there are HUGE question marks concerning California.
The whole list of states having been polled till now, going from Democratic stronghold to Republican stronghold:
New York: D +24.6%
New Mexico: D +14%
Oregon: D +12%
California: D +9%
Connecticut: D +9%
New Jersey: D +8.25%
Maine: D +8%
Michigan: D +6.9%
Ohio: D +6.7%
Currently estimated/projected national average: D +6.0%
Minnesota: D +6%
Florida: D +5.3%
Wisconsin: D +4.1%
Iowa: D +3.9%
Virginia: D +3.6%
Pennsylvania: D +3.5%
Nevada: D +3%
New Hampshire: D +2.1%
North Carolina: D +1.6%
Arizona: R +1%
Georgia: R +2%
Louisiana: R +3.25%
Colorado: R +3.5%
Kentucky: R +4.5%
Kansas: R +7%
Mississippi: R +7%
South Carolina: R +7%
Alaska: R +7.4%
Texas: R +8%
Arkansas: R +10.3%
Montana: R +13%
West Virginia: R +14%
Wyoming: R +28%
The best-tailored Republican candidates in all states polled so far:
1. Chris Christie favoured in 10 of 32 states (for 136 EVs)
2. Jeb Bush favoured in 7 states (Florida, North Carolina, Arizona, Kentucky (!), Louisiana (!), Kansas (shared) & West Virginia - for 82 EVs)
3. Rand Paul favoured in 5 states (California, Oregon (shared), Nevada, Montana & Alaska - for 74 EVs)
4. Mike Huckabee favoured in 5 states (Texas (!), Oregon (shared), Arkansas, Mississippi & New Hampshire (!) - for 61 EVs)
5. Paul Ryan favoured in 3 states (Wisconsin, Colorado & Kansas - for 25 EVs)
6. Tim Pawlenty favoured in 1 state (Minnesota - for 10 EVs)
7. Marco Rubio favoured in 1 state (South Carolina - for 9 EVs)
8. Ben Carson favoured in 1 state (Connecticut - for 7 EVs)
9. Susana Martinez favoured in 1 state (New Mexico - for 5 EVs)
Current update as of September 24.
The total number of state polls included below has now reached 175.
The 2016 poll averages for each state - 32 states right now - and the change from the actual 2012 outcomes. Only the Republican candidate with the best statewide polling included.
Alaska: Hillary vs Rand Paul: R +7.4%
+6.6% D improvement
(Updated on September 24, 2014)
Arizona: Hillary vs Bush: R +1%
+8% D improvement
(Updated on March 6, 2014)
Arkansas: Hillary vs Mike Huckabee: R +10.3%
+13.4% D improvement
(Updated on September 24, 2014)
California: Hillary vs Rand Paul: D +9%
+14% R improvement
(Updated on August 1, 2014)
Colorado: Hillary vs Paul Ryan: R +3.5%
+8.9% R improvement
Current Republican gain
(Updated on July 29, 2014)
Connecticut: Hillary vs Ben Carson: D +9%
+8% R improvement
(Updated on August 11, 2014)
Florida: Hillary vs Bush: D +5.3%
+4.4% D improvement
(Updated on September 10, 2014)
Georgia: Hillary vs Christie: R +2%
+6% D improvement
(Updated August 8, 2013)
Iowa: Hillary vs Christie: D +3.9%
+1.9% R improvement
(Updated on July 17, 2014)
Kansas: Hillary vs Bush/Ryan: R +7%
+14.6% D improvement
(Updated on September 17, 2014)
Kentucky: Hillary vs Bush: R +4.5%
+18.2% D improvement
(Updated on August 13, 2014)
Louisiana: Hillary vs Bush: R +3.25%
+14% D improvement
(Updated on September 17, 2014)
Maine: Hillary vs Christie: D +8%
+7% R improvement
(Updated on November 13, 2013)
Michigan: Hillary vs Christie: D +6.9%
+2.6% R improvement
(Updated on September 9, 2014)
Minnesota: Hillary vs Tim Pawlenty: D +6%
+2% R improvement
(Updated on June 18, 2014)
Mississippi: Hillary vs Huckabee: R +7%
+4.5% D improvement
(Updated on July 20, 2014)
Montana: Hillary vs Rand Paul: R +13% (Brian Schweitzer vs Rand Paul: R +8%)
+1% D improvement
(Updated on July 23, 2014)
Nevada: Hillary vs Rand Paul: D +3%
+4% R improvement
(Updated on July 31, 2014)
New Hampshire: Hillary vs Huckabee: D +2.1%
+3.5% R improvement
(Updated on July 17, 2014)
New Jersey: Hillary vs Christie: D +8.25%
+9.5% R improvement
(Updated on September 11, 2014)
New Mexico: Hillary vs Susana Martinez: D +14%
+4% D improvement
(Updated on March 27, 2014)
New York: Hillary vs Christie: D +24.6%
+3.6% R improvement
(Updated on August 21, 2014)
North Carolina: Hillary vs Bush: D +1.6%
+3.6% D improvement
Current Democratic gain
(Updated on September 16, 2014)
Ohio: Hillary vs Christie: D +6.7%
+3.7% D improvement
(Updated on July 31, 2014)
Oregon: Hillary vs Rand Paul/Huckabee: D +12%
Unchanged from 2012
(Updated on May 30, 2014)
Pennsylvania: Hillary vs Christie: D +3.5%
+1.9% R improvement
(Updated on June 5, 2014)
South Carolina: Hillary vs Marco Rubio: R +7%
+3.5% D improvement
(Updated on November 2, 2013)
Texas: Hillary vs Huckabee: R +8%
+8% D improvement
(Updated on April 18, 2014)
Virginia: Hillary vs Christie: D +3.64%
+0.2% R improvement
(Updated on July 23, 2014)
West Virginia: Hillary vs Bush: R +14%
+13% D improvement
(Updated on October 1, 2013)
Wisconsin: Hillary vs Ryan: D +4.1%
+2.8% R improvement
(Updated on August 5, 2014)
Wyoming: Hillary vs Christie: R +28%
+13% D improvement
(Updated on July 23, 2013)
Average all 32 states: Hillary vs Best Republican: D +0.5%
+2.2% D improvement (from Obama 2012) [projecting a 6.0% victory for Hillary]
Giving us this map:
(
Red = Democratic lead/trend
Blue = Republican lead/trend
Green = Tied or no trend
Grey = No polling yet
Green = toss up or less than 0.5% lead
20% shade = 0.6-2% lead
30% shade = 2.1-4% lead
40% shade = 4.1-6% lead
50% shade = 6.1-9% lead
60% shade = 9.1-12% lead
70% shade = 12.1-15% lead
80% shade = 15.1-18% lead
90% shade = Above 18.1% lead
In the count of electoral votes, the current situation looks like this:
Hillary: 268 EVs (in 18 states)
Best/Tailormade Republican: 131 EVs (in 14 states)
Toss-up: None
No polling: 139 EVs (in 18 states + D.C.)
So far, Hillary has captured an impressive 67.2% of all EVs awarded, against only 32.8% EVs for the tailormade Republican.
This is how the Trendline Map looks so far:
(
The states which right now are showing the strongest improvement for the Democratic (Hillary) or the Republican candidate (in 10 out of 32 cases, Christie is that person):
1. Kentucky: D +18.2%
2. Kansas: D +14.6%
3. California: R +14%
4. Louisiana: D +14%
5. Arkansas: D +13.4%
6. West Virginia: D +13%
7. Wyoming: D +13%
8. New Jersey: R +9.5%
9. Colorado: R +8.9%
10. Arizona: D +8%
11. Texas: D +8%
12. Connecticut: R +8%
13. Maine: R +7%
14. Alaska: D +6.6%
15. Georgia: D +6%
16. Mississippi: D +4.5%
17. Florida: D +4.4%
All of these changes (in the 17 states above) are statistically significant, though there are HUGE question marks concerning California.
The whole list of states having been polled till now, going from Democratic stronghold to Republican stronghold:
New York: D +24.6%
New Mexico: D +14%
Oregon: D +12%
California: D +9%
Connecticut: D +9%
New Jersey: D +8.25%
Maine: D +8%
Michigan: D +6.9%
Ohio: D +6.7%
Currently estimated/projected national average: D +6.0%
Minnesota: D +6%
Florida: D +5.3%
Wisconsin: D +4.1%
Iowa: D +3.9%
Virginia: D +3.6%
Pennsylvania: D +3.5%
Nevada: D +3%
New Hampshire: D +2.1%
North Carolina: D +1.6%
Arizona: R +1%
Georgia: R +2%
Louisiana: R +3.25%
Colorado: R +3.5%
Kentucky: R +4.5%
Kansas: R +7%
Mississippi: R +7%
South Carolina: R +7%
Alaska: R +7.4%
Texas: R +8%
Arkansas: R +10.3%
Montana: R +13%
West Virginia: R +14%
Wyoming: R +28%
The best-tailored Republican candidates in all states polled so far:
1. Chris Christie favoured in 10 of 32 states (for 136 EVs)
2. Jeb Bush favoured in 7 states (Florida, North Carolina, Arizona, Kentucky (!), Louisiana (!), Kansas (shared) & West Virginia - for 82 EVs)
3. Rand Paul favoured in 5 states (California, Oregon (shared), Nevada, Montana & Alaska - for 74 EVs)
4. Mike Huckabee favoured in 5 states (Texas (!), Oregon (shared), Arkansas, Mississippi & New Hampshire (!) - for 61 EVs)
5. Paul Ryan favoured in 3 states (Wisconsin, Colorado & Kansas - for 25 EVs)
6. Tim Pawlenty favoured in 1 state (Minnesota - for 10 EVs)
7. Marco Rubio favoured in 1 state (South Carolina - for 9 EVs)
8. Ben Carson favoured in 1 state (Connecticut - for 7 EVs)
9. Susana Martinez favoured in 1 state (New Mexico - for 5 EVs)
Current update as of September 24.
Title: Re: 2016 Official Polling Map Thread
Post by: eric82oslo on September 24, 2014, 09:25:44 PM
With Roanoke doing its 3rd Virginia poll of the season, here's how it rolls in Virginia right now (current averages against Hillary):
Vs Christie: D +4.5% (11 polls, down 0.8%)
Vs Rubio: D +7.6% (5 polls)
Vs Bush: D +8.7% (3 polls)
Vs Bob McDonnell: D +9% (3 polls)
Vs Rand Paul: D +9.9% (10 polls, down 0.5%)
Vs Walker: D +11%
Vs Huckabee: D +11.5% (2 polls)
Vs Paul Ryan: D +11.6% (5 polls, down 0.35%)
Vs Cruz: D +12.3% (3 polls)
A sharp deterioration of Christie's numbers in this crucial battleground state. Despite a grand total of 15 polls, some of the main contenders have hardly even been polled here, Jeb included. Virginia is now trending ever so slightly Democratic.
The total number of state polls included below has now reached 176.
The 2016 poll averages for each state - 32 states right now - and the change from the actual 2012 outcomes. Only the Republican candidate with the best statewide polling included.
Alaska: Hillary vs Rand Paul: R +7.4%
+6.6% D improvement
(Updated on September 24, 2014)
Arizona: Hillary vs Bush: R +1%
+8% D improvement
(Updated on March 6, 2014)
Arkansas: Hillary vs Mike Huckabee: R +10.3%
+13.4% D improvement
(Updated on September 24, 2014)
California: Hillary vs Rand Paul: D +9%
+14% R improvement
(Updated on August 1, 2014)
Colorado: Hillary vs Paul Ryan: R +3.5%
+8.9% R improvement
Current Republican gain
(Updated on July 29, 2014)
Connecticut: Hillary vs Ben Carson: D +9%
+8% R improvement
(Updated on August 11, 2014)
Florida: Hillary vs Bush: D +5.3%
+4.4% D improvement
(Updated on September 10, 2014)
Georgia: Hillary vs Christie: R +2%
+6% D improvement
(Updated August 8, 2013)
Iowa: Hillary vs Christie: D +3.9%
+1.9% R improvement
(Updated on July 17, 2014)
Kansas: Hillary vs Bush/Ryan: R +7%
+14.6% D improvement
(Updated on September 17, 2014)
Kentucky: Hillary vs Bush: R +4.5%
+18.2% D improvement
(Updated on August 13, 2014)
Louisiana: Hillary vs Bush: R +3.25%
+14% D improvement
(Updated on September 17, 2014)
Maine: Hillary vs Christie: D +8%
+7% R improvement
(Updated on November 13, 2013)
Michigan: Hillary vs Christie: D +6.9%
+2.6% R improvement
(Updated on September 9, 2014)
Minnesota: Hillary vs Tim Pawlenty: D +6%
+2% R improvement
(Updated on June 18, 2014)
Mississippi: Hillary vs Huckabee: R +7%
+4.5% D improvement
(Updated on July 20, 2014)
Montana: Hillary vs Rand Paul: R +13% (Brian Schweitzer vs Rand Paul: R +8%)
+1% D improvement
(Updated on July 23, 2014)
Nevada: Hillary vs Rand Paul: D +3%
+4% R improvement
(Updated on July 31, 2014)
New Hampshire: Hillary vs Huckabee: D +2.1%
+3.5% R improvement
(Updated on July 17, 2014)
New Jersey: Hillary vs Christie: D +8.25%
+9.5% R improvement
(Updated on September 11, 2014)
New Mexico: Hillary vs Susana Martinez: D +14%
+4% D improvement
(Updated on March 27, 2014)
New York: Hillary vs Christie: D +24.6%
+3.6% R improvement
(Updated on August 21, 2014)
North Carolina: Hillary vs Bush: D +1.6%
+3.6% D improvement
Current Democratic gain
(Updated on September 16, 2014)
Ohio: Hillary vs Christie: D +6.7%
+3.7% D improvement
(Updated on July 31, 2014)
Oregon: Hillary vs Rand Paul/Huckabee: D +12%
Unchanged from 2012
(Updated on May 30, 2014)
Pennsylvania: Hillary vs Christie: D +3.5%
+1.9% R improvement
(Updated on June 5, 2014)
South Carolina: Hillary vs Marco Rubio: R +7%
+3.5% D improvement
(Updated on November 2, 2013)
Texas: Hillary vs Huckabee: R +8%
+8% D improvement
(Updated on April 18, 2014)
Virginia: Hillary vs Christie: D +4.5%
+0.6% D improvement
(Updated on September 25, 2014)
West Virginia: Hillary vs Bush: R +14%
+13% D improvement
(Updated on October 1, 2013)
Wisconsin: Hillary vs Ryan: D +4.1%
+2.8% R improvement
(Updated on August 5, 2014)
Wyoming: Hillary vs Christie: R +28%
+13% D improvement
(Updated on July 23, 2013)
Average all 32 states: Hillary vs Best Republican: D +0.5%
+2.2% D improvement (from Obama 2012) [projecting a 6.1% victory for Hillary]
Giving us this map:
( )
)
Red = Democratic lead/trend
Blue = Republican lead/trend
Green = Tied or no trend
Grey = No polling yet
Green = toss up or less than 0.5% lead
20% shade = 0.6-2% lead
30% shade = 2.1-4% lead
40% shade = 4.1-6% lead
50% shade = 6.1-9% lead
60% shade = 9.1-12% lead
70% shade = 12.1-15% lead
80% shade = 15.1-18% lead
90% shade = Above 18.1% lead
In the count of electoral votes, the current situation looks like this:
Hillary: 268 EVs (in 18 states)
Best/Tailormade Republican: 131 EVs (in 14 states)
Toss-up: None
No polling: 139 EVs (in 18 states + D.C.)
So far, Hillary has captured an impressive 67.2% of all EVs awarded, against only 32.8% EVs for the tailormade Republican.
This is how the Trendline Map looks so far:
( )
)
The states which right now are showing the strongest improvement for the Democratic (Hillary) or the Republican candidate (in 10 out of 32 cases, Christie is that person):
1. Kentucky: D +18.2%
2. Kansas: D +14.6%
3. California: R +14%
4. Louisiana: D +14%
5. Arkansas: D +13.4%
6. West Virginia: D +13%
7. Wyoming: D +13%
8. New Jersey: R +9.5%
9. Colorado: R +8.9%
10. Arizona: D +8%
11. Texas: D +8%
12. Connecticut: R +8%
13. Maine: R +7%
14. Alaska: D +6.6%
15. Georgia: D +6%
16. Mississippi: D +4.5%
17. Florida: D +4.4%
All of these changes (in the 17 states above) are statistically significant, though there are HUGE question marks concerning California.
The whole list of states having been polled till now, going from Democratic stronghold to Republican stronghold:
New York: D +24.6%
New Mexico: D +14%
Oregon: D +12%
California: D +9%
Connecticut: D +9%
New Jersey: D +8.25%
Maine: D +8%
Michigan: D +6.9%
Ohio: D +6.7%
Currently estimated/projected national average: D +6.1%
Minnesota: D +6%
Florida: D +5.3%
Virginia: D +4.5%
Wisconsin: D +4.1%
Iowa: D +3.9%
Pennsylvania: D +3.5%
Nevada: D +3%
New Hampshire: D +2.1%
North Carolina: D +1.6%
Arizona: R +1%
Georgia: R +2%
Louisiana: R +3.25%
Colorado: R +3.5%
Kentucky: R +4.5%
Kansas: R +7%
Mississippi: R +7%
South Carolina: R +7%
Alaska: R +7.4%
Texas: R +8%
Arkansas: R +10.3%
Montana: R +13%
West Virginia: R +14%
Wyoming: R +28%
The best-tailored Republican candidates in all states polled so far:
1. Chris Christie favoured in 10 of 32 states (for 136 EVs)
2. Jeb Bush favoured in 7 states (Florida, North Carolina, Arizona, Kentucky (!), Louisiana (!), Kansas (shared) & West Virginia - for 82 EVs)
3. Rand Paul favoured in 5 states (California, Oregon (shared), Nevada, Montana & Alaska - for 74 EVs)
4. Mike Huckabee favoured in 5 states (Texas (!), Oregon (shared), Arkansas, Mississippi & New Hampshire (!) - for 61 EVs)
5. Paul Ryan favoured in 3 states (Wisconsin, Colorado & Kansas - for 25 EVs)
6. Tim Pawlenty favoured in 1 state (Minnesota - for 10 EVs)
7. Marco Rubio favoured in 1 state (South Carolina - for 9 EVs)
8. Ben Carson favoured in 1 state (Connecticut - for 7 EVs)
9. Susana Martinez favoured in 1 state (New Mexico - for 5 EVs)
Current update as of September 25.
Vs Christie: D +4.5% (11 polls, down 0.8%)
Vs Rubio: D +7.6% (5 polls)
Vs Bush: D +8.7% (3 polls)
Vs Bob McDonnell: D +9% (3 polls)
Vs Rand Paul: D +9.9% (10 polls, down 0.5%)
Vs Walker: D +11%
Vs Huckabee: D +11.5% (2 polls)
Vs Paul Ryan: D +11.6% (5 polls, down 0.35%)
Vs Cruz: D +12.3% (3 polls)
A sharp deterioration of Christie's numbers in this crucial battleground state. Despite a grand total of 15 polls, some of the main contenders have hardly even been polled here, Jeb included. Virginia is now trending ever so slightly Democratic.
The total number of state polls included below has now reached 176.
The 2016 poll averages for each state - 32 states right now - and the change from the actual 2012 outcomes. Only the Republican candidate with the best statewide polling included.
Alaska: Hillary vs Rand Paul: R +7.4%
+6.6% D improvement
(Updated on September 24, 2014)
Arizona: Hillary vs Bush: R +1%
+8% D improvement
(Updated on March 6, 2014)
Arkansas: Hillary vs Mike Huckabee: R +10.3%
+13.4% D improvement
(Updated on September 24, 2014)
California: Hillary vs Rand Paul: D +9%
+14% R improvement
(Updated on August 1, 2014)
Colorado: Hillary vs Paul Ryan: R +3.5%
+8.9% R improvement
Current Republican gain
(Updated on July 29, 2014)
Connecticut: Hillary vs Ben Carson: D +9%
+8% R improvement
(Updated on August 11, 2014)
Florida: Hillary vs Bush: D +5.3%
+4.4% D improvement
(Updated on September 10, 2014)
Georgia: Hillary vs Christie: R +2%
+6% D improvement
(Updated August 8, 2013)
Iowa: Hillary vs Christie: D +3.9%
+1.9% R improvement
(Updated on July 17, 2014)
Kansas: Hillary vs Bush/Ryan: R +7%
+14.6% D improvement
(Updated on September 17, 2014)
Kentucky: Hillary vs Bush: R +4.5%
+18.2% D improvement
(Updated on August 13, 2014)
Louisiana: Hillary vs Bush: R +3.25%
+14% D improvement
(Updated on September 17, 2014)
Maine: Hillary vs Christie: D +8%
+7% R improvement
(Updated on November 13, 2013)
Michigan: Hillary vs Christie: D +6.9%
+2.6% R improvement
(Updated on September 9, 2014)
Minnesota: Hillary vs Tim Pawlenty: D +6%
+2% R improvement
(Updated on June 18, 2014)
Mississippi: Hillary vs Huckabee: R +7%
+4.5% D improvement
(Updated on July 20, 2014)
Montana: Hillary vs Rand Paul: R +13% (Brian Schweitzer vs Rand Paul: R +8%)
+1% D improvement
(Updated on July 23, 2014)
Nevada: Hillary vs Rand Paul: D +3%
+4% R improvement
(Updated on July 31, 2014)
New Hampshire: Hillary vs Huckabee: D +2.1%
+3.5% R improvement
(Updated on July 17, 2014)
New Jersey: Hillary vs Christie: D +8.25%
+9.5% R improvement
(Updated on September 11, 2014)
New Mexico: Hillary vs Susana Martinez: D +14%
+4% D improvement
(Updated on March 27, 2014)
New York: Hillary vs Christie: D +24.6%
+3.6% R improvement
(Updated on August 21, 2014)
North Carolina: Hillary vs Bush: D +1.6%
+3.6% D improvement
Current Democratic gain
(Updated on September 16, 2014)
Ohio: Hillary vs Christie: D +6.7%
+3.7% D improvement
(Updated on July 31, 2014)
Oregon: Hillary vs Rand Paul/Huckabee: D +12%
Unchanged from 2012
(Updated on May 30, 2014)
Pennsylvania: Hillary vs Christie: D +3.5%
+1.9% R improvement
(Updated on June 5, 2014)
South Carolina: Hillary vs Marco Rubio: R +7%
+3.5% D improvement
(Updated on November 2, 2013)
Texas: Hillary vs Huckabee: R +8%
+8% D improvement
(Updated on April 18, 2014)
Virginia: Hillary vs Christie: D +4.5%
+0.6% D improvement
(Updated on September 25, 2014)
West Virginia: Hillary vs Bush: R +14%
+13% D improvement
(Updated on October 1, 2013)
Wisconsin: Hillary vs Ryan: D +4.1%
+2.8% R improvement
(Updated on August 5, 2014)
Wyoming: Hillary vs Christie: R +28%
+13% D improvement
(Updated on July 23, 2013)
Average all 32 states: Hillary vs Best Republican: D +0.5%
+2.2% D improvement (from Obama 2012) [projecting a 6.1% victory for Hillary]
Giving us this map:
(
Red = Democratic lead/trend
Blue = Republican lead/trend
Green = Tied or no trend
Grey = No polling yet
Green = toss up or less than 0.5% lead
20% shade = 0.6-2% lead
30% shade = 2.1-4% lead
40% shade = 4.1-6% lead
50% shade = 6.1-9% lead
60% shade = 9.1-12% lead
70% shade = 12.1-15% lead
80% shade = 15.1-18% lead
90% shade = Above 18.1% lead
In the count of electoral votes, the current situation looks like this:
Hillary: 268 EVs (in 18 states)
Best/Tailormade Republican: 131 EVs (in 14 states)
Toss-up: None
No polling: 139 EVs (in 18 states + D.C.)
So far, Hillary has captured an impressive 67.2% of all EVs awarded, against only 32.8% EVs for the tailormade Republican.
This is how the Trendline Map looks so far:
(
The states which right now are showing the strongest improvement for the Democratic (Hillary) or the Republican candidate (in 10 out of 32 cases, Christie is that person):
1. Kentucky: D +18.2%
2. Kansas: D +14.6%
3. California: R +14%
4. Louisiana: D +14%
5. Arkansas: D +13.4%
6. West Virginia: D +13%
7. Wyoming: D +13%
8. New Jersey: R +9.5%
9. Colorado: R +8.9%
10. Arizona: D +8%
11. Texas: D +8%
12. Connecticut: R +8%
13. Maine: R +7%
14. Alaska: D +6.6%
15. Georgia: D +6%
16. Mississippi: D +4.5%
17. Florida: D +4.4%
All of these changes (in the 17 states above) are statistically significant, though there are HUGE question marks concerning California.
The whole list of states having been polled till now, going from Democratic stronghold to Republican stronghold:
New York: D +24.6%
New Mexico: D +14%
Oregon: D +12%
California: D +9%
Connecticut: D +9%
New Jersey: D +8.25%
Maine: D +8%
Michigan: D +6.9%
Ohio: D +6.7%
Currently estimated/projected national average: D +6.1%
Minnesota: D +6%
Florida: D +5.3%
Virginia: D +4.5%
Wisconsin: D +4.1%
Iowa: D +3.9%
Pennsylvania: D +3.5%
Nevada: D +3%
New Hampshire: D +2.1%
North Carolina: D +1.6%
Arizona: R +1%
Georgia: R +2%
Louisiana: R +3.25%
Colorado: R +3.5%
Kentucky: R +4.5%
Kansas: R +7%
Mississippi: R +7%
South Carolina: R +7%
Alaska: R +7.4%
Texas: R +8%
Arkansas: R +10.3%
Montana: R +13%
West Virginia: R +14%
Wyoming: R +28%
The best-tailored Republican candidates in all states polled so far:
1. Chris Christie favoured in 10 of 32 states (for 136 EVs)
2. Jeb Bush favoured in 7 states (Florida, North Carolina, Arizona, Kentucky (!), Louisiana (!), Kansas (shared) & West Virginia - for 82 EVs)
3. Rand Paul favoured in 5 states (California, Oregon (shared), Nevada, Montana & Alaska - for 74 EVs)
4. Mike Huckabee favoured in 5 states (Texas (!), Oregon (shared), Arkansas, Mississippi & New Hampshire (!) - for 61 EVs)
5. Paul Ryan favoured in 3 states (Wisconsin, Colorado & Kansas - for 25 EVs)
6. Tim Pawlenty favoured in 1 state (Minnesota - for 10 EVs)
7. Marco Rubio favoured in 1 state (South Carolina - for 9 EVs)
8. Ben Carson favoured in 1 state (Connecticut - for 7 EVs)
9. Susana Martinez favoured in 1 state (New Mexico - for 5 EVs)
Current update as of September 25.
Title: Re: 2016 Official Polling Map Thread
Post by: pbrower2a on September 25, 2014, 01:40:49 PM
Virginia, Roanoake Poll:
Hillary vs Christie: D +10% (47-37)
Hillary vs Paul Ryan: D +13% (50-37)
Hillary vs Rand Paul: D +16% (51-35)
Writes Roanoke: "Clinton has widened her lead over both Paul and Ryan, but the Christie margin is unchanged. The July RC Poll included registered voters, but did not screen for likely voters, so the results may not be directly comparable. "
http://roanoke.edu/A-Z_Index/Institute_for_Policy_and_Opinion_Research/Recent_News_Releases/RC_Poll_Election_Sept_2014.htm
Nothing on Jeb Bush or Mike Huckabee. This confirms what a weak candidate Rand Paul would be, and that Paul Ryan has shown that he is not Presidential.
Hillary Clinton vs. Jeb Bush
()
Hillary Clinton vs. Chris Christie
()
Hillary Clinton vs. Mike Huckabee
()
Hillary Clinton vs. Rand Paul
( )
)
blue, Republican -- red, Democratic
30% -- lead with 40-49% but a margin of 3% or less
40% -- lead with 40-49% but a margin of 4% or more
60% -- lead with 50-54%
70% -- lead with 55-59%
90% -- lead with 60% or more
[/quote]
Hillary vs Christie: D +10% (47-37)
Hillary vs Paul Ryan: D +13% (50-37)
Hillary vs Rand Paul: D +16% (51-35)
Writes Roanoke: "Clinton has widened her lead over both Paul and Ryan, but the Christie margin is unchanged. The July RC Poll included registered voters, but did not screen for likely voters, so the results may not be directly comparable. "
http://roanoke.edu/A-Z_Index/Institute_for_Policy_and_Opinion_Research/Recent_News_Releases/RC_Poll_Election_Sept_2014.htm
Nothing on Jeb Bush or Mike Huckabee. This confirms what a weak candidate Rand Paul would be, and that Paul Ryan has shown that he is not Presidential.
Hillary Clinton vs. Jeb Bush
(
Hillary Clinton vs. Chris Christie
(
Hillary Clinton vs. Mike Huckabee
(
Hillary Clinton vs. Rand Paul
(
blue, Republican -- red, Democratic
30% -- lead with 40-49% but a margin of 3% or less
40% -- lead with 40-49% but a margin of 4% or more
60% -- lead with 50-54%
70% -- lead with 55-59%
90% -- lead with 60% or more
[/quote]
Title: Re: 2016 Official Polling Map Thread
Post by: eric82oslo on September 27, 2014, 01:18:14 AM
Gravis Marketing is showing Ran Paul 1% ahead of Clinton in their new North Carolina poll. That doesn't change much, as the previous 13 NC polls matching up the two candidates had Hillary with an average lead over him of almost 5%. It is still an improvement for Paul of 3% since Gravis last time polled this match up in NC. Anyhow, the new North Carolina averages now look this this:
Vs Bush: D +1.6% (11 polls)
Vs Christie: D +2.1% (11 polls)
Vs Huckabee: D +3.4% (7 polls)
Vs Rand Paul: D +4.4% (14 polls, down 0.4% for Hillary)
Vs Rubio: D +7%
Vs Cruz: D +8% (5 polls)
In other words, it's basically an unchanged race.
The total number of state polls included below has now reached 177.
North Carolina: Hillary vs Bush: D +1.6%
+3.6% D improvement
Current Democratic gain
(Updated on September 27, 2014)
Current update as of September 27.
Title: Re: 2016 Official Polling Map Thread
Post by: eric82oslo on September 30, 2014, 06:03:42 AM
Gravis has done it again, polled Wisconsin for the 2nd time. Paul Ryan went from leading Hillary by a point to now trailing her by a point, so basically still toss-up according to Gravis. Other pollsters may beg to disagree, as the Wisconsin averages will show:
Vs Paul Ryan: D +3.7% (7 polls, down 0.4%)
Vs Jeb Bush: D +7.5% (2 polls)
Vs Chris Christie: D +8.1% (4 polls)
Vs Scott Walker: D +9.2% (5 polls)
Vs Rand Paul: D +9.9% (3 polls)
Vs Mike Huckabee: D +12% (1 poll)
Vs Marco Rubio: D +15.1% (2 polls)
Vs Ted Cruz: D +16.5% (2 polls)
Unless Paul Ryan gets the nomination, Wisconsin seems to be a pretty easy win for Hillary. Ryan seems to be a lot more popular than governor Walker among voters in their shared home state.
We've also got a second poll to include in our database today from PPP, the 8th poll this season of Louisiana. It showed some great news once more for Jeb and Mike, while local son Bobby and the big mouth from New Jersey both continue to face bad odds in this cajun hot spot. New averages from Louisiana are:
Mike Huckabee: R +4.3% (3 polls, Hillary down 1.3%)
Jeb Bush: R +4.2% (5 polls, Hillary down 1%)
Rand Paul: R +1.5% (4 polls)
Ted Cruz: R +1% (2 polls, Hillary down 2%)
Paul Ryan: R +1% (2 polls)
Chris Christie: D +1.5% (4 polls, Hillary up 0.2%)
Bobby Jindal: D +2.5% (6 polls, Hillary down 0.3%)
Marco Rubio: D +3% (1 poll)
For what I think might be the first time in Louisiana, Huckabee is now, on average, ever so slightly favoured by the state's voters, although the advantage over Jeb is absolutely insignificant.
Finally, PPP also released its weekend poll of Iowa today. It's the 14th Iowa poll to match 2016 candidates so far.
Chris Christie: D +3.9% (13 polls, unchanged)
Bobby Jindal: D +4.7% (1 poll)
Rand Paul: D +5.7% (12 polls, Hillary up 0.1%)
Jeb Bush: D +7.0% (10 polls, Bush up 0.7%)
Marco Rubio: D +7.6% (6 polls)
Scott Walker: D +8.5% (3 polls)
Ted Cruz: D +9.5% (5 polls, Cruz up 0.3%)
Mike Pence: D +11.8% (1 poll)
The Iowa race thus remains unchanged, as the GOP leader Christie received the same score in this latest PPP poll as his previous average also indicated.
Three different states with three different leaders on the GOP side. Full update on every state will follow in my next post.
Title: Re: 2016 Official Polling Map Thread
Post by: eric82oslo on September 30, 2014, 10:28:22 AM
With three new state polls from Louisiana, Wisconsin and Iowa (see previous post), Hillary is now in slightly worse state than she found herself yesterday, as her average lead over Paul Ryan was reduced by 0.4% in Wisconsin at the same time as she's now trailing the best Republican by 1% more in Louisiana than what was the general consensus up until now. There's now basically a tied first place between Huckabee and Bush in the Frenchified Southern state of Hurricane Katrina.
The total number of state polls included below has now reached 180.
The 2016 poll averages for each state - 32 states right now - and the change from the actual 2012 outcomes. Only the Republican candidate with the best statewide polling included.
Alaska: Hillary vs Rand Paul: R +7.4%
+6.6% D improvement
(Updated on September 24, 2014)
Arizona: Hillary vs Bush: R +1%
+8% D improvement
(Updated on March 6, 2014)
Arkansas: Hillary vs Mike Huckabee: R +10.3%
+13.4% D improvement
(Updated on September 24, 2014)
California: Hillary vs Rand Paul: D +9%
+14% R improvement
(Updated on August 1, 2014)
Colorado: Hillary vs Paul Ryan: R +3.5%
+8.9% R improvement
Current Republican gain
(Updated on July 29, 2014)
Connecticut: Hillary vs Ben Carson: D +9%
+8% R improvement
(Updated on August 11, 2014)
Florida: Hillary vs Bush: D +5.3%
+4.4% D improvement
(Updated on September 10, 2014)
Georgia: Hillary vs Christie: R +2%
+6% D improvement
(Updated August 8, 2013)
Iowa: Hillary vs Christie: D +3.9%
+1.9% R improvement
(Updated on September 30, 2014)
Kansas: Hillary vs Bush/Ryan: R +7%
+14.6% D improvement
(Updated on September 17, 2014)
Kentucky: Hillary vs Bush: R +4.5%
+18.2% D improvement
(Updated on August 13, 2014)
Louisiana: Hillary vs Huckabee: R +4.3%
+12.9% D improvement
(Updated on September 30, 2014)
Maine: Hillary vs Christie: D +8%
+7% R improvement
(Updated on November 13, 2013)
Michigan: Hillary vs Christie: D +6.9%
+2.6% R improvement
(Updated on September 9, 2014)
Minnesota: Hillary vs Tim Pawlenty: D +6%
+2% R improvement
(Updated on June 18, 2014)
Mississippi: Hillary vs Huckabee: R +7%
+4.5% D improvement
(Updated on July 20, 2014)
Montana: Hillary vs Rand Paul: R +13% (Brian Schweitzer vs Rand Paul: R +8%)
+1% D improvement
(Updated on July 23, 2014)
Nevada: Hillary vs Rand Paul: D +3%
+4% R improvement
(Updated on July 31, 2014)
New Hampshire: Hillary vs Huckabee: D +2.1%
+3.5% R improvement
(Updated on July 17, 2014)
New Jersey: Hillary vs Christie: D +8.25%
+9.5% R improvement
(Updated on September 11, 2014)
New Mexico: Hillary vs Susana Martinez: D +14%
+4% D improvement
(Updated on March 27, 2014)
New York: Hillary vs Christie: D +24.6%
+3.6% R improvement
(Updated on August 21, 2014)
North Carolina: Hillary vs Bush: D +1.6%
+3.6% D improvement
Current Democratic gain
(Updated on September 16, 2014)
Ohio: Hillary vs Christie: D +6.7%
+3.7% D improvement
(Updated on July 31, 2014)
Oregon: Hillary vs Rand Paul/Huckabee: D +12%
Unchanged from 2012
(Updated on May 30, 2014)
Pennsylvania: Hillary vs Christie: D +3.5%
+1.9% R improvement
(Updated on June 5, 2014)
South Carolina: Hillary vs Marco Rubio: R +7%
+3.5% D improvement
(Updated on November 2, 2013)
Texas: Hillary vs Huckabee: R +8%
+8% D improvement
(Updated on April 18, 2014)
Virginia: Hillary vs Christie: D +4.5%
+0.6% D improvement
(Updated on September 25, 2014)
West Virginia: Hillary vs Bush: R +14%
+13% D improvement
(Updated on October 1, 2013)
Wisconsin: Hillary vs Ryan: D +3.7%
+3.2% R improvement
(Updated on September 30, 2014)
Wyoming: Hillary vs Christie: R +28%
+13% D improvement
(Updated on July 23, 2013)
Average all 32 states: Hillary vs Best Republican: D +0.5%
+2.2% D improvement (from Obama 2012) [projecting a 6.0% victory for Hillary]
Giving us this map:
(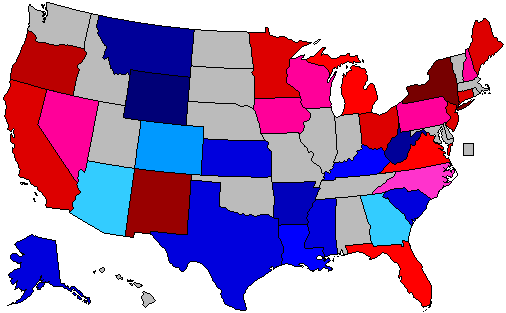 )
)
Red = Democratic lead/trend
Blue = Republican lead/trend
Green = Tied or no trend
Grey = No polling yet
Green = toss up or less than 0.5% lead
20% shade = 0.6-2% lead
30% shade = 2.1-4% lead
40% shade = 4.1-6% lead
50% shade = 6.1-9% lead
60% shade = 9.1-12% lead
70% shade = 12.1-15% lead
80% shade = 15.1-18% lead
90% shade = Above 18.1% lead
In the count of electoral votes, the current situation looks like this:
Hillary: 268 EVs (in 18 states)
Best/Tailormade Republican: 131 EVs (in 14 states)
Toss-up: None
No polling: 139 EVs (in 18 states + D.C.)
So far, Hillary has captured an impressive 67.2% of all EVs awarded, against only 32.8% EVs for the tailormade Republican.
This is how the Trendline Map looks so far:
()
The states which right now are showing the strongest improvement for the Democratic (Hillary) or the Republican candidate (in 10 out of 32 cases, Christie is that person):
1. Kentucky: D +18.2%
2. Kansas: D +14.6%
3. California: R +14%
4. Arkansas: D +13.4%
5. West Virginia: D +13%
6. Wyoming: D +13%
7. Louisiana: D +12.9%
8. New Jersey: R +9.5%
9. Colorado: R +8.9%
10. Arizona: D +8%
11. Texas: D +8%
12. Connecticut: R +8%
13. Maine: R +7%
14. Alaska: D +6.6%
15. Georgia: D +6%
16. Mississippi: D +4.5%
17. Florida: D +4.4%
All of these changes (in the 17 states above) are statistically significant, though there are HUGE question marks concerning California.
The whole list of states having been polled till now, going from Democratic stronghold to Republican stronghold:
New York: D +24.6%
New Mexico: D +14%
Oregon: D +12%
California: D +9%
Connecticut: D +9%
New Jersey: D +8.25%
Maine: D +8%
Michigan: D +6.9%
Ohio: D +6.7%
Minnesota: D +6%
Currently estimated/projected national average: D +6.0%
Florida: D +5.3%
Virginia: D +4.5%
Iowa: D +3.9%
Wisconsin: D +3.7%
Pennsylvania: D +3.5%
Nevada: D +3%
New Hampshire: D +2.1%
North Carolina: D +1.6%
Arizona: R +1%
Georgia: R +2%
Colorado: R +3.5%
Louisiana: R +4.3%
Kentucky: R +4.5%
Kansas: R +7%
Mississippi: R +7%
South Carolina: R +7%
Alaska: R +7.4%
Texas: R +8%
Arkansas: R +10.3%
Montana: R +13%
West Virginia: R +14%
Wyoming: R +28%
The best-tailored Republican candidates in all states polled so far:
1. Chris Christie favoured in 10 of 32 states (for 136 EVs)
2. Jeb Bush favoured in 6 states (Florida, North Carolina, Arizona, Kentucky (!), Kansas (shared) & West Virginia - for 74 EVs)
3. Rand Paul favoured in 5 states (California, Oregon (shared), Nevada, Montana & Alaska - for 74 EVs)
4. Mike Huckabee favoured in 6 states (Texas (!), Louisiana (!), Oregon (shared), Arkansas, Mississippi & New Hampshire (!) - for 69 EVs)
5. Paul Ryan favoured in 3 states (Wisconsin, Colorado & Kansas - for 25 EVs)
6. Tim Pawlenty favoured in 1 state (Minnesota - for 10 EVs)
7. Marco Rubio favoured in 1 state (South Carolina - for 9 EVs)
8. Ben Carson favoured in 1 state (Connecticut - for 7 EVs)
9. Susana Martinez favoured in 1 state (New Mexico - for 5 EVs)
Current update as of September 30.
The total number of state polls included below has now reached 180.
The 2016 poll averages for each state - 32 states right now - and the change from the actual 2012 outcomes. Only the Republican candidate with the best statewide polling included.
Alaska: Hillary vs Rand Paul: R +7.4%
+6.6% D improvement
(Updated on September 24, 2014)
Arizona: Hillary vs Bush: R +1%
+8% D improvement
(Updated on March 6, 2014)
Arkansas: Hillary vs Mike Huckabee: R +10.3%
+13.4% D improvement
(Updated on September 24, 2014)
California: Hillary vs Rand Paul: D +9%
+14% R improvement
(Updated on August 1, 2014)
Colorado: Hillary vs Paul Ryan: R +3.5%
+8.9% R improvement
Current Republican gain
(Updated on July 29, 2014)
Connecticut: Hillary vs Ben Carson: D +9%
+8% R improvement
(Updated on August 11, 2014)
Florida: Hillary vs Bush: D +5.3%
+4.4% D improvement
(Updated on September 10, 2014)
Georgia: Hillary vs Christie: R +2%
+6% D improvement
(Updated August 8, 2013)
Iowa: Hillary vs Christie: D +3.9%
+1.9% R improvement
(Updated on September 30, 2014)
Kansas: Hillary vs Bush/Ryan: R +7%
+14.6% D improvement
(Updated on September 17, 2014)
Kentucky: Hillary vs Bush: R +4.5%
+18.2% D improvement
(Updated on August 13, 2014)
Louisiana: Hillary vs Huckabee: R +4.3%
+12.9% D improvement
(Updated on September 30, 2014)
Maine: Hillary vs Christie: D +8%
+7% R improvement
(Updated on November 13, 2013)
Michigan: Hillary vs Christie: D +6.9%
+2.6% R improvement
(Updated on September 9, 2014)
Minnesota: Hillary vs Tim Pawlenty: D +6%
+2% R improvement
(Updated on June 18, 2014)
Mississippi: Hillary vs Huckabee: R +7%
+4.5% D improvement
(Updated on July 20, 2014)
Montana: Hillary vs Rand Paul: R +13% (Brian Schweitzer vs Rand Paul: R +8%)
+1% D improvement
(Updated on July 23, 2014)
Nevada: Hillary vs Rand Paul: D +3%
+4% R improvement
(Updated on July 31, 2014)
New Hampshire: Hillary vs Huckabee: D +2.1%
+3.5% R improvement
(Updated on July 17, 2014)
New Jersey: Hillary vs Christie: D +8.25%
+9.5% R improvement
(Updated on September 11, 2014)
New Mexico: Hillary vs Susana Martinez: D +14%
+4% D improvement
(Updated on March 27, 2014)
New York: Hillary vs Christie: D +24.6%
+3.6% R improvement
(Updated on August 21, 2014)
North Carolina: Hillary vs Bush: D +1.6%
+3.6% D improvement
Current Democratic gain
(Updated on September 16, 2014)
Ohio: Hillary vs Christie: D +6.7%
+3.7% D improvement
(Updated on July 31, 2014)
Oregon: Hillary vs Rand Paul/Huckabee: D +12%
Unchanged from 2012
(Updated on May 30, 2014)
Pennsylvania: Hillary vs Christie: D +3.5%
+1.9% R improvement
(Updated on June 5, 2014)
South Carolina: Hillary vs Marco Rubio: R +7%
+3.5% D improvement
(Updated on November 2, 2013)
Texas: Hillary vs Huckabee: R +8%
+8% D improvement
(Updated on April 18, 2014)
Virginia: Hillary vs Christie: D +4.5%
+0.6% D improvement
(Updated on September 25, 2014)
West Virginia: Hillary vs Bush: R +14%
+13% D improvement
(Updated on October 1, 2013)
Wisconsin: Hillary vs Ryan: D +3.7%
+3.2% R improvement
(Updated on September 30, 2014)
Wyoming: Hillary vs Christie: R +28%
+13% D improvement
(Updated on July 23, 2013)
Average all 32 states: Hillary vs Best Republican: D +0.5%
+2.2% D improvement (from Obama 2012) [projecting a 6.0% victory for Hillary]
Giving us this map:
(
Red = Democratic lead/trend
Blue = Republican lead/trend
Green = Tied or no trend
Grey = No polling yet
Green = toss up or less than 0.5% lead
20% shade = 0.6-2% lead
30% shade = 2.1-4% lead
40% shade = 4.1-6% lead
50% shade = 6.1-9% lead
60% shade = 9.1-12% lead
70% shade = 12.1-15% lead
80% shade = 15.1-18% lead
90% shade = Above 18.1% lead
In the count of electoral votes, the current situation looks like this:
Hillary: 268 EVs (in 18 states)
Best/Tailormade Republican: 131 EVs (in 14 states)
Toss-up: None
No polling: 139 EVs (in 18 states + D.C.)
So far, Hillary has captured an impressive 67.2% of all EVs awarded, against only 32.8% EVs for the tailormade Republican.
This is how the Trendline Map looks so far:
(
The states which right now are showing the strongest improvement for the Democratic (Hillary) or the Republican candidate (in 10 out of 32 cases, Christie is that person):
1. Kentucky: D +18.2%
2. Kansas: D +14.6%
3. California: R +14%
4. Arkansas: D +13.4%
5. West Virginia: D +13%
6. Wyoming: D +13%
7. Louisiana: D +12.9%
8. New Jersey: R +9.5%
9. Colorado: R +8.9%
10. Arizona: D +8%
11. Texas: D +8%
12. Connecticut: R +8%
13. Maine: R +7%
14. Alaska: D +6.6%
15. Georgia: D +6%
16. Mississippi: D +4.5%
17. Florida: D +4.4%
All of these changes (in the 17 states above) are statistically significant, though there are HUGE question marks concerning California.
The whole list of states having been polled till now, going from Democratic stronghold to Republican stronghold:
New York: D +24.6%
New Mexico: D +14%
Oregon: D +12%
California: D +9%
Connecticut: D +9%
New Jersey: D +8.25%
Maine: D +8%
Michigan: D +6.9%
Ohio: D +6.7%
Minnesota: D +6%
Currently estimated/projected national average: D +6.0%
Florida: D +5.3%
Virginia: D +4.5%
Iowa: D +3.9%
Wisconsin: D +3.7%
Pennsylvania: D +3.5%
Nevada: D +3%
New Hampshire: D +2.1%
North Carolina: D +1.6%
Arizona: R +1%
Georgia: R +2%
Colorado: R +3.5%
Louisiana: R +4.3%
Kentucky: R +4.5%
Kansas: R +7%
Mississippi: R +7%
South Carolina: R +7%
Alaska: R +7.4%
Texas: R +8%
Arkansas: R +10.3%
Montana: R +13%
West Virginia: R +14%
Wyoming: R +28%
The best-tailored Republican candidates in all states polled so far:
1. Chris Christie favoured in 10 of 32 states (for 136 EVs)
2. Jeb Bush favoured in 6 states (Florida, North Carolina, Arizona, Kentucky (!), Kansas (shared) & West Virginia - for 74 EVs)
3. Rand Paul favoured in 5 states (California, Oregon (shared), Nevada, Montana & Alaska - for 74 EVs)
4. Mike Huckabee favoured in 6 states (Texas (!), Louisiana (!), Oregon (shared), Arkansas, Mississippi & New Hampshire (!) - for 69 EVs)
5. Paul Ryan favoured in 3 states (Wisconsin, Colorado & Kansas - for 25 EVs)
6. Tim Pawlenty favoured in 1 state (Minnesota - for 10 EVs)
7. Marco Rubio favoured in 1 state (South Carolina - for 9 EVs)
8. Ben Carson favoured in 1 state (Connecticut - for 7 EVs)
9. Susana Martinez favoured in 1 state (New Mexico - for 5 EVs)
Current update as of September 30.
Title: Re: 2016 Official Polling Map Thread
Post by: pbrower2a on October 01, 2014, 07:48:15 AM
Iowa, PPP:
Clinton- 43%
Bush- 43%
Clinton- 45%
Christie- 41%
Clinton- 47%
Cruz- 39%
Clinton- 46%
Huckabee- 42%
Clinton- 47%
Paul- 42%
Trade-off of advantages between two Republicans.
PPP has once again polled the 2016 race in the normally not (so) competitive, jazzy, creole Mardi Gras state of Louisiana. Hillary leads two of her potential competitors, while trailing the three others by single digits:
Vs Jeb Bush: 41-49 (R+8%)
Vs Mike Huckabee: 43-50 (R+7%)
Vs Ted Cruz: 44-47 (R+3%)
Vs Bobby Jindal: 46-45 (D+1%)
Vs Chris Christie: 44-42 (D+2%)
http://www.publicpolicypolling.com/main/2014/09/cassidy-has-small-head-to-head-lead-over-landrieu.html#more
Hillary Clinton vs. Jeb Bush
(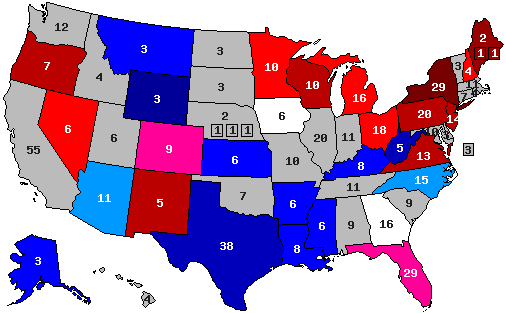 )
)
Hillary Clinton vs. Chris Christie
( )
)
Hillary Clinton vs. Mike Huckabee
(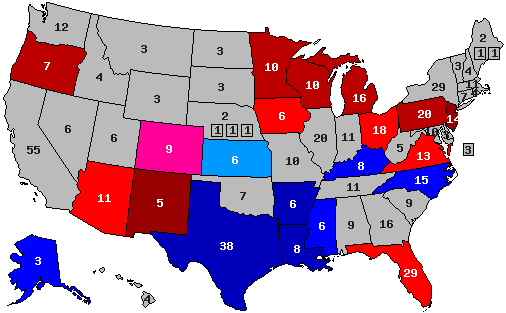 )
)
Hillary Clinton vs. Rand Paul
( )
)
blue, Republican -- red, Democratic
30% -- lead with 40-49% but a margin of 3% or less
40% -- lead with 40-49% but a margin of 4% or more
60% -- lead with 50-54%
70% -- lead with 55-59%
90% -- lead with 60% or more
Clinton- 43%
Bush- 43%
Clinton- 45%
Christie- 41%
Clinton- 47%
Cruz- 39%
Clinton- 46%
Huckabee- 42%
Clinton- 47%
Paul- 42%
Trade-off of advantages between two Republicans.
PPP has once again polled the 2016 race in the normally not (so) competitive, jazzy, creole Mardi Gras state of Louisiana. Hillary leads two of her potential competitors, while trailing the three others by single digits:
Vs Jeb Bush: 41-49 (R+8%)
Vs Mike Huckabee: 43-50 (R+7%)
Vs Ted Cruz: 44-47 (R+3%)
Vs Bobby Jindal: 46-45 (D+1%)
Vs Chris Christie: 44-42 (D+2%)
http://www.publicpolicypolling.com/main/2014/09/cassidy-has-small-head-to-head-lead-over-landrieu.html#more
Hillary Clinton vs. Jeb Bush
(
Hillary Clinton vs. Chris Christie
(
Hillary Clinton vs. Mike Huckabee
(
Hillary Clinton vs. Rand Paul
(
blue, Republican -- red, Democratic
30% -- lead with 40-49% but a margin of 3% or less
40% -- lead with 40-49% but a margin of 4% or more
60% -- lead with 50-54%
70% -- lead with 55-59%
90% -- lead with 60% or more
Title: Re: 2016 Official Polling Map Thread
Post by: eric82oslo on October 01, 2014, 04:12:24 PM
Quinnipiac has just polled New Jersey, which marks the 12th 2016 poll from Christie's home state. This time we have some good news for Hillary, as she improves slightly against the three competitors she was tested against. New state averages:
Vs Christie: D +8.4% (13 polls, Hillary up 0.15%)
Vs Bush: D +20% (3 polls, Hillary up 0.5%)
Vs Rand Paul: D +21% (5 polls, Hillary up 0.75%)
Vs Huckabee: D +23%
Vs Cruz: D +23%
Vs Paul Ryan: D +25%
The total number of state polls included below has now reached 181.
The 2016 poll averages for each state - 32 states right now - and the change from the actual 2012 outcomes. Only the Republican candidate with the best statewide polling included.
Alaska: Hillary vs Rand Paul: R +7.4%
+6.6% D improvement
(Updated on September 24, 2014)
Arizona: Hillary vs Bush: R +1%
+8% D improvement
(Updated on March 6, 2014)
Arkansas: Hillary vs Mike Huckabee: R +10.3%
+13.4% D improvement
(Updated on September 24, 2014)
California: Hillary vs Rand Paul: D +9%
+14% R improvement
(Updated on August 1, 2014)
Colorado: Hillary vs Paul Ryan: R +3.5%
+8.9% R improvement
Current Republican gain
(Updated on July 29, 2014)
Connecticut: Hillary vs Ben Carson: D +9%
+8% R improvement
(Updated on August 11, 2014)
Florida: Hillary vs Bush: D +5.3%
+4.4% D improvement
(Updated on September 10, 2014)
Georgia: Hillary vs Christie: R +2%
+6% D improvement
(Updated August 8, 2013)
Iowa: Hillary vs Christie: D +3.9%
+1.9% R improvement
(Updated on September 30, 2014)
Kansas: Hillary vs Bush/Ryan: R +7%
+14.6% D improvement
(Updated on September 17, 2014)
Kentucky: Hillary vs Bush: R +4.5%
+18.2% D improvement
(Updated on August 13, 2014)
Louisiana: Hillary vs Huckabee: R +4.3%
+12.9% D improvement
(Updated on September 30, 2014)
Maine: Hillary vs Christie: D +8%
+7% R improvement
(Updated on November 13, 2013)
Michigan: Hillary vs Christie: D +6.9%
+2.6% R improvement
(Updated on September 9, 2014)
Minnesota: Hillary vs Tim Pawlenty: D +6%
+2% R improvement
(Updated on June 18, 2014)
Mississippi: Hillary vs Huckabee: R +7%
+4.5% D improvement
(Updated on July 20, 2014)
Montana: Hillary vs Rand Paul: R +13% (Brian Schweitzer vs Rand Paul: R +8%)
+1% D improvement
(Updated on July 23, 2014)
Nevada: Hillary vs Rand Paul: D +3%
+4% R improvement
(Updated on July 31, 2014)
New Hampshire: Hillary vs Huckabee: D +2.1%
+3.5% R improvement
(Updated on July 17, 2014)
New Jersey: Hillary vs Christie: D +8.4%
+9.4% R improvement
(Updated on October 1, 2014)
New Mexico: Hillary vs Susana Martinez: D +14%
+4% D improvement
(Updated on March 27, 2014)
New York: Hillary vs Christie: D +24.6%
+3.6% R improvement
(Updated on August 21, 2014)
North Carolina: Hillary vs Bush: D +1.6%
+3.6% D improvement
Current Democratic gain
(Updated on September 16, 2014)
Ohio: Hillary vs Christie: D +6.7%
+3.7% D improvement
(Updated on July 31, 2014)
Oregon: Hillary vs Rand Paul/Huckabee: D +12%
Unchanged from 2012
(Updated on May 30, 2014)
Pennsylvania: Hillary vs Christie: D +3.5%
+1.9% R improvement
(Updated on June 5, 2014)
South Carolina: Hillary vs Marco Rubio: R +7%
+3.5% D improvement
(Updated on November 2, 2013)
Texas: Hillary vs Huckabee: R +8%
+8% D improvement
(Updated on April 18, 2014)
Virginia: Hillary vs Christie: D +4.5%
+0.6% D improvement
(Updated on September 25, 2014)
West Virginia: Hillary vs Bush: R +14%
+13% D improvement
(Updated on October 1, 2013)
Wisconsin: Hillary vs Ryan: D +3.7%
+3.2% R improvement
(Updated on September 30, 2014)
Wyoming: Hillary vs Christie: R +28%
+13% D improvement
(Updated on July 23, 2013)
Average all 32 states: Hillary vs Best Republican: D +0.5%
+2.2% D improvement (from Obama 2012) [projecting a 6.0% victory for Hillary]
Giving us this map:
()
Red = Democratic lead/trend
Blue = Republican lead/trend
Green = Tied or no trend
Grey = No polling yet
Green = toss up or less than 0.5% lead
20% shade = 0.6-2% lead
30% shade = 2.1-4% lead
40% shade = 4.1-6% lead
50% shade = 6.1-9% lead
60% shade = 9.1-12% lead
70% shade = 12.1-15% lead
80% shade = 15.1-18% lead
90% shade = Above 18.1% lead
In the count of electoral votes, the current situation looks like this:
Hillary: 268 EVs (in 18 states)
Best/Tailormade Republican: 131 EVs (in 14 states)
Toss-up: None
No polling: 139 EVs (in 18 states + D.C.)
So far, Hillary has captured an impressive 67.2% of all EVs awarded, against only 32.8% EVs for the tailormade Republican.
This is how the Trendline Map looks so far:
()
The states which right now are showing the strongest improvement for the Democratic (Hillary) or the Republican candidate (in 10 out of 32 cases, Christie is that person):
1. Kentucky: D +18.2%
2. Kansas: D +14.6%
3. California: R +14%
4. Arkansas: D +13.4%
5. West Virginia: D +13%
6. Wyoming: D +13%
7. Louisiana: D +12.9%
8. New Jersey: R +9.4%
9. Colorado: R +8.9%
10. Arizona: D +8%
11. Texas: D +8%
12. Connecticut: R +8%
13. Maine: R +7%
14. Alaska: D +6.6%
15. Georgia: D +6%
16. Mississippi: D +4.5%
17. Florida: D +4.4%
All of these changes (in the 17 states above) are statistically significant, though there are HUGE question marks concerning California.
The whole list of states having been polled till now, going from Democratic stronghold to Republican stronghold:
New York: D +24.6%
New Mexico: D +14%
Oregon: D +12%
California: D +9%
Connecticut: D +9%
New Jersey: D +8.4%
Maine: D +8%
Michigan: D +6.9%
Ohio: D +6.7%
Minnesota: D +6%
Currently estimated/projected national average: D +6.0%
Florida: D +5.3%
Virginia: D +4.5%
Iowa: D +3.9%
Wisconsin: D +3.7%
Pennsylvania: D +3.5%
Nevada: D +3%
New Hampshire: D +2.1%
North Carolina: D +1.6%
Arizona: R +1%
Georgia: R +2%
Colorado: R +3.5%
Louisiana: R +4.3%
Kentucky: R +4.5%
Kansas: R +7%
Mississippi: R +7%
South Carolina: R +7%
Alaska: R +7.4%
Texas: R +8%
Arkansas: R +10.3%
Montana: R +13%
West Virginia: R +14%
Wyoming: R +28%
The best-tailored Republican candidates in all states polled so far:
1. Chris Christie favoured in 10 of 32 states (for 136 EVs)
2. Jeb Bush favoured in 6 states (Florida, North Carolina, Arizona, Kentucky (!), Kansas (shared) & West Virginia - for 74 EVs)
3. Rand Paul favoured in 5 states (California, Oregon (shared), Nevada, Montana & Alaska - for 74 EVs)
4. Mike Huckabee favoured in 6 states (Texas (!), Louisiana (!), Oregon (shared), Arkansas, Mississippi & New Hampshire (!) - for 69 EVs)
5. Paul Ryan favoured in 3 states (Wisconsin, Colorado & Kansas - for 25 EVs)
6. Tim Pawlenty favoured in 1 state (Minnesota - for 10 EVs)
7. Marco Rubio favoured in 1 state (South Carolina - for 9 EVs)
8. Ben Carson favoured in 1 state (Connecticut - for 7 EVs)
9. Susana Martinez favoured in 1 state (New Mexico - for 5 EVs)
Current update as of October 1.
Vs Christie: D +8.4% (13 polls, Hillary up 0.15%)
Vs Bush: D +20% (3 polls, Hillary up 0.5%)
Vs Rand Paul: D +21% (5 polls, Hillary up 0.75%)
Vs Huckabee: D +23%
Vs Cruz: D +23%
Vs Paul Ryan: D +25%
The total number of state polls included below has now reached 181.
The 2016 poll averages for each state - 32 states right now - and the change from the actual 2012 outcomes. Only the Republican candidate with the best statewide polling included.
Alaska: Hillary vs Rand Paul: R +7.4%
+6.6% D improvement
(Updated on September 24, 2014)
Arizona: Hillary vs Bush: R +1%
+8% D improvement
(Updated on March 6, 2014)
Arkansas: Hillary vs Mike Huckabee: R +10.3%
+13.4% D improvement
(Updated on September 24, 2014)
California: Hillary vs Rand Paul: D +9%
+14% R improvement
(Updated on August 1, 2014)
Colorado: Hillary vs Paul Ryan: R +3.5%
+8.9% R improvement
Current Republican gain
(Updated on July 29, 2014)
Connecticut: Hillary vs Ben Carson: D +9%
+8% R improvement
(Updated on August 11, 2014)
Florida: Hillary vs Bush: D +5.3%
+4.4% D improvement
(Updated on September 10, 2014)
Georgia: Hillary vs Christie: R +2%
+6% D improvement
(Updated August 8, 2013)
Iowa: Hillary vs Christie: D +3.9%
+1.9% R improvement
(Updated on September 30, 2014)
Kansas: Hillary vs Bush/Ryan: R +7%
+14.6% D improvement
(Updated on September 17, 2014)
Kentucky: Hillary vs Bush: R +4.5%
+18.2% D improvement
(Updated on August 13, 2014)
Louisiana: Hillary vs Huckabee: R +4.3%
+12.9% D improvement
(Updated on September 30, 2014)
Maine: Hillary vs Christie: D +8%
+7% R improvement
(Updated on November 13, 2013)
Michigan: Hillary vs Christie: D +6.9%
+2.6% R improvement
(Updated on September 9, 2014)
Minnesota: Hillary vs Tim Pawlenty: D +6%
+2% R improvement
(Updated on June 18, 2014)
Mississippi: Hillary vs Huckabee: R +7%
+4.5% D improvement
(Updated on July 20, 2014)
Montana: Hillary vs Rand Paul: R +13% (Brian Schweitzer vs Rand Paul: R +8%)
+1% D improvement
(Updated on July 23, 2014)
Nevada: Hillary vs Rand Paul: D +3%
+4% R improvement
(Updated on July 31, 2014)
New Hampshire: Hillary vs Huckabee: D +2.1%
+3.5% R improvement
(Updated on July 17, 2014)
New Jersey: Hillary vs Christie: D +8.4%
+9.4% R improvement
(Updated on October 1, 2014)
New Mexico: Hillary vs Susana Martinez: D +14%
+4% D improvement
(Updated on March 27, 2014)
New York: Hillary vs Christie: D +24.6%
+3.6% R improvement
(Updated on August 21, 2014)
North Carolina: Hillary vs Bush: D +1.6%
+3.6% D improvement
Current Democratic gain
(Updated on September 16, 2014)
Ohio: Hillary vs Christie: D +6.7%
+3.7% D improvement
(Updated on July 31, 2014)
Oregon: Hillary vs Rand Paul/Huckabee: D +12%
Unchanged from 2012
(Updated on May 30, 2014)
Pennsylvania: Hillary vs Christie: D +3.5%
+1.9% R improvement
(Updated on June 5, 2014)
South Carolina: Hillary vs Marco Rubio: R +7%
+3.5% D improvement
(Updated on November 2, 2013)
Texas: Hillary vs Huckabee: R +8%
+8% D improvement
(Updated on April 18, 2014)
Virginia: Hillary vs Christie: D +4.5%
+0.6% D improvement
(Updated on September 25, 2014)
West Virginia: Hillary vs Bush: R +14%
+13% D improvement
(Updated on October 1, 2013)
Wisconsin: Hillary vs Ryan: D +3.7%
+3.2% R improvement
(Updated on September 30, 2014)
Wyoming: Hillary vs Christie: R +28%
+13% D improvement
(Updated on July 23, 2013)
Average all 32 states: Hillary vs Best Republican: D +0.5%
+2.2% D improvement (from Obama 2012) [projecting a 6.0% victory for Hillary]
Giving us this map:
(
Red = Democratic lead/trend
Blue = Republican lead/trend
Green = Tied or no trend
Grey = No polling yet
Green = toss up or less than 0.5% lead
20% shade = 0.6-2% lead
30% shade = 2.1-4% lead
40% shade = 4.1-6% lead
50% shade = 6.1-9% lead
60% shade = 9.1-12% lead
70% shade = 12.1-15% lead
80% shade = 15.1-18% lead
90% shade = Above 18.1% lead
In the count of electoral votes, the current situation looks like this:
Hillary: 268 EVs (in 18 states)
Best/Tailormade Republican: 131 EVs (in 14 states)
Toss-up: None
No polling: 139 EVs (in 18 states + D.C.)
So far, Hillary has captured an impressive 67.2% of all EVs awarded, against only 32.8% EVs for the tailormade Republican.
This is how the Trendline Map looks so far:
(
The states which right now are showing the strongest improvement for the Democratic (Hillary) or the Republican candidate (in 10 out of 32 cases, Christie is that person):
1. Kentucky: D +18.2%
2. Kansas: D +14.6%
3. California: R +14%
4. Arkansas: D +13.4%
5. West Virginia: D +13%
6. Wyoming: D +13%
7. Louisiana: D +12.9%
8. New Jersey: R +9.4%
9. Colorado: R +8.9%
10. Arizona: D +8%
11. Texas: D +8%
12. Connecticut: R +8%
13. Maine: R +7%
14. Alaska: D +6.6%
15. Georgia: D +6%
16. Mississippi: D +4.5%
17. Florida: D +4.4%
All of these changes (in the 17 states above) are statistically significant, though there are HUGE question marks concerning California.
The whole list of states having been polled till now, going from Democratic stronghold to Republican stronghold:
New York: D +24.6%
New Mexico: D +14%
Oregon: D +12%
California: D +9%
Connecticut: D +9%
New Jersey: D +8.4%
Maine: D +8%
Michigan: D +6.9%
Ohio: D +6.7%
Minnesota: D +6%
Currently estimated/projected national average: D +6.0%
Florida: D +5.3%
Virginia: D +4.5%
Iowa: D +3.9%
Wisconsin: D +3.7%
Pennsylvania: D +3.5%
Nevada: D +3%
New Hampshire: D +2.1%
North Carolina: D +1.6%
Arizona: R +1%
Georgia: R +2%
Colorado: R +3.5%
Louisiana: R +4.3%
Kentucky: R +4.5%
Kansas: R +7%
Mississippi: R +7%
South Carolina: R +7%
Alaska: R +7.4%
Texas: R +8%
Arkansas: R +10.3%
Montana: R +13%
West Virginia: R +14%
Wyoming: R +28%
The best-tailored Republican candidates in all states polled so far:
1. Chris Christie favoured in 10 of 32 states (for 136 EVs)
2. Jeb Bush favoured in 6 states (Florida, North Carolina, Arizona, Kentucky (!), Kansas (shared) & West Virginia - for 74 EVs)
3. Rand Paul favoured in 5 states (California, Oregon (shared), Nevada, Montana & Alaska - for 74 EVs)
4. Mike Huckabee favoured in 6 states (Texas (!), Louisiana (!), Oregon (shared), Arkansas, Mississippi & New Hampshire (!) - for 69 EVs)
5. Paul Ryan favoured in 3 states (Wisconsin, Colorado & Kansas - for 25 EVs)
6. Tim Pawlenty favoured in 1 state (Minnesota - for 10 EVs)
7. Marco Rubio favoured in 1 state (South Carolina - for 9 EVs)
8. Ben Carson favoured in 1 state (Connecticut - for 7 EVs)
9. Susana Martinez favoured in 1 state (New Mexico - for 5 EVs)
Current update as of October 1.
Title: Re: 2016 Official Polling Map Thread
Post by: pbrower2a on October 01, 2014, 06:36:30 PM
A poll of registered voters:
50-40 Clinton/Christie
53-32 Clinton/Bush
55-31 Clinton/Paul
http://www.quinnipiac.edu/news-and-events/quinnipiac-university-poll/new-jersey/release-detail?ReleaseID=2087
Dominating.
Hillary Clinton vs. Jeb Bush
()
Hillary Clinton vs. Chris Christie
()
Hillary Clinton vs. Mike Huckabee
()
Hillary Clinton vs. Rand Paul
()
blue, Republican -- red, Democratic
30% -- lead with 40-49% but a margin of 3% or less
40% -- lead with 40-49% but a margin of 4% or more
60% -- lead with 50-54%
70% -- lead with 55-59%
90% -- lead with 60% or more
50-40 Clinton/Christie
53-32 Clinton/Bush
55-31 Clinton/Paul
http://www.quinnipiac.edu/news-and-events/quinnipiac-university-poll/new-jersey/release-detail?ReleaseID=2087
Dominating.
Hillary Clinton vs. Jeb Bush
(
Hillary Clinton vs. Chris Christie
(
Hillary Clinton vs. Mike Huckabee
(
Hillary Clinton vs. Rand Paul
(
blue, Republican -- red, Democratic
30% -- lead with 40-49% but a margin of 3% or less
40% -- lead with 40-49% but a margin of 4% or more
60% -- lead with 50-54%
70% -- lead with 55-59%
90% -- lead with 60% or more
Title: Re: 2016 Official Polling Map Thread
Post by: eric82oslo on October 02, 2014, 04:14:37 PM
Today we got two more state polls, both produced by Gravis Marketing. It's the 15th poll out from Iowa and the 5th 2016 poll from Montana (2 of which were conducted by Gravis, while the 3 others were in the hands of PPP). Both polls show generally bad numbers for Hillary, but Rand Paul is also struggling in Montana compared to the latest PPP poll released from that state.
Here are the new Iowa averages against Madame Clinton:
Chris Christie: D +3.9% (13 polls)
Bobby Jindal: D +4.7% (1 poll)
Rand Paul: D +5.7% (12 polls)
Paul Ryan: D +6% (6 poll, Hillary down 1.2%)
Jeb Bush: D +6.4% (11 polls, Bush up 0.6%)
Marco Rubio: D +7.6% (6 polls)
Scott Walker: D +8.5% (3 polls)
Ted Cruz: D +9.5% (5 polls)
Mike Pence: D +11.8% (1 poll)
In other words, this new poll doesn't change the fundamentals in the great state of Iowa, with Christie still being the GOP chieftain there.
And these are the current match up averages for Hillary in Montana:
Chris Christie: R +11% (2 polls)
Ted Cruz: R +11% (1 poll)
Paul Ryan: R +10.5% (1 poll, down 3.5% for Hillary)
Rand Paul: R +10.5% (2 polls, up 2.5% for Hillary)
Marco Rubio: R +8% (1 poll)
Jeb Bush: R +7.5% (4 polls, down 0.5% for Hillary)
Due to the surprisingly bad numbers for Rand Paul in this poll, he is no longer leading the GOP pack in Montana. Neither are any of the other two polled by Gravis. Instead, there's now a dead heat in Montana by, believe it or not, Chris Christie and Ted Cruz! This is the first time Christie has taken the lead in a new state since many, many, many months ago - probably since before the roll-out of Bridgegate.
So two new polls and we happen to have three new leaders in those two states! Chris Christie loses his lead in Iowa, yet gains a new lead in Montana instead!
Updated maps and other stats are just around the corner (in the next post in fact).
Title: Re: 2016 Official Polling Map Thread
Post by: eric82oslo on October 02, 2014, 04:37:04 PM
So we got two new polls today from Iowa and Montana as my previous post detailed in close. In Iowa the race remains unchanged, while she improves somewhat on the imaginary tailor-made Republican in the hills are alive with the sound of music state of Montana. This actually marks the first time in 183 occations (polls) where Ted Cruz has actually been leading the pack in any single state (see Montana)!
The total number of state polls included below has now reached 183.
The 2016 poll averages for each state - 32 states right now - and the change from the actual 2012 outcomes. Only the Republican candidate with the best statewide polling included.
Alaska: Hillary vs Rand Paul: R +7.4%
+6.6% D improvement
(Updated on September 24, 2014)
Arizona: Hillary vs Bush: R +1%
+8% D improvement
(Updated on March 6, 2014)
Arkansas: Hillary vs Mike Huckabee: R +10.3%
+13.4% D improvement
(Updated on September 24, 2014)
California: Hillary vs Rand Paul: D +9%
+14% R improvement
(Updated on August 1, 2014)
Colorado: Hillary vs Paul Ryan: R +3.5%
+8.9% R improvement
Current Republican gain
(Updated on July 29, 2014)
Connecticut: Hillary vs Ben Carson: D +9%
+8% R improvement
(Updated on August 11, 2014)
Florida: Hillary vs Bush: D +5.3%
+4.4% D improvement
(Updated on September 10, 2014)
Georgia: Hillary vs Christie: R +2%
+6% D improvement
(Updated August 8, 2013)
Iowa: Hillary vs Christie: D +3.9%
+1.9% R improvement
(Updated on October 2, 2014)
Kansas: Hillary vs Bush/Ryan: R +7%
+14.6% D improvement
(Updated on September 17, 2014)
Kentucky: Hillary vs Bush: R +4.5%
+18.2% D improvement
(Updated on August 13, 2014)
Louisiana: Hillary vs Huckabee: R +4.3%
+12.9% D improvement
(Updated on September 30, 2014)
Maine: Hillary vs Christie: D +8%
+7% R improvement
(Updated on November 13, 2013)
Michigan: Hillary vs Christie: D +6.9%
+2.6% R improvement
(Updated on September 9, 2014)
Minnesota: Hillary vs Tim Pawlenty: D +6%
+2% R improvement
(Updated on June 18, 2014)
Mississippi: Hillary vs Huckabee: R +7%
+4.5% D improvement
(Updated on July 20, 2014)
Montana: Hillary vs Christie/Ted Cruz: R +11% (Brian Schweitzer vs Rand Paul: R +8%)
+3% D improvement
(Updated on October 2, 2014)
Nevada: Hillary vs Rand Paul: D +3%
+4% R improvement
(Updated on July 31, 2014)
New Hampshire: Hillary vs Huckabee: D +2.1%
+3.5% R improvement
(Updated on July 17, 2014)
New Jersey: Hillary vs Christie: D +8.4%
+9.4% R improvement
(Updated on October 1, 2014)
New Mexico: Hillary vs Susana Martinez: D +14%
+4% D improvement
(Updated on March 27, 2014)
New York: Hillary vs Christie: D +24.6%
+3.6% R improvement
(Updated on August 21, 2014)
North Carolina: Hillary vs Bush: D +1.6%
+3.6% D improvement
Current Democratic gain
(Updated on September 16, 2014)
Ohio: Hillary vs Christie: D +6.7%
+3.7% D improvement
(Updated on July 31, 2014)
Oregon: Hillary vs Rand Paul/Huckabee: D +12%
Unchanged from 2012
(Updated on May 30, 2014)
Pennsylvania: Hillary vs Christie: D +3.5%
+1.9% R improvement
(Updated on June 5, 2014)
South Carolina: Hillary vs Marco Rubio: R +7%
+3.5% D improvement
(Updated on November 2, 2013)
Texas: Hillary vs Huckabee: R +8%
+8% D improvement
(Updated on April 18, 2014)
Virginia: Hillary vs Christie: D +4.5%
+0.6% D improvement
(Updated on September 25, 2014)
West Virginia: Hillary vs Bush: R +14%
+13% D improvement
(Updated on October 1, 2013)
Wisconsin: Hillary vs Ryan: D +3.7%
+3.2% R improvement
(Updated on September 30, 2014)
Wyoming: Hillary vs Christie: R +28%
+13% D improvement
(Updated on July 23, 2013)
Average all 32 states: Hillary vs Best Republican: D +0.5%
+2.2% D improvement (from Obama 2012) [projecting a 6.1% victory for Hillary]
Giving us this map:
( )
)
Red = Democratic lead/trend
Blue = Republican lead/trend
Green = Tied or no trend
Grey = No polling yet
Green = toss up or less than 0.5% lead
20% shade = 0.6-2% lead
30% shade = 2.1-4% lead
40% shade = 4.1-6% lead
50% shade = 6.1-9% lead
60% shade = 9.1-12% lead
70% shade = 12.1-15% lead
80% shade = 15.1-18% lead
90% shade = Above 18.1% lead
In the count of electoral votes, the current situation looks like this:
Hillary: 268 EVs (in 18 states)
Best/Tailormade Republican: 131 EVs (in 14 states)
Toss-up: None
No polling: 139 EVs (in 18 states + D.C.)
So far, Hillary has captured an impressive 67.2% of all EVs awarded.
This is how the Trendline Map looks so far:
(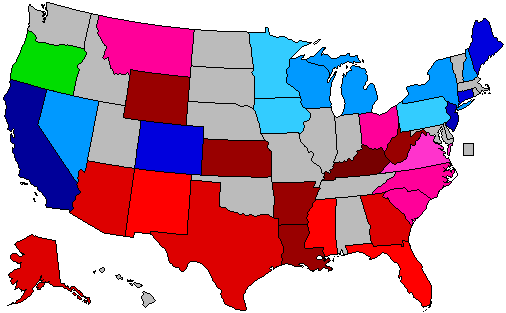 )
)
The states which right now are showing the strongest improvement for the Democratic (Hillary) or the Republican candidate (in 11 out of 32 cases, Christie is that person):
1. Kentucky: D +18.2%
2. Kansas: D +14.6%
3. California: R +14%
4. Arkansas: D +13.4%
5. West Virginia: D +13%
6. Wyoming: D +13%
7. Louisiana: D +12.9%
8. New Jersey: R +9.4%
9. Colorado: R +8.9%
10. Arizona: D +8%
11. Texas: D +8%
12. Connecticut: R +8%
13. Maine: R +7%
14. Alaska: D +6.6%
15. Georgia: D +6%
16. Mississippi: D +4.5%
17. Florida: D +4.4%
All of these changes (in the 17 states above) are statistically significant, though there are HUGE question marks concerning California.
The whole list of states having been polled till now, going from Democratic stronghold to Republican stronghold:
New York: D +24.6%
New Mexico: D +14%
Oregon: D +12%
California: D +9%
Connecticut: D +9%
New Jersey: D +8.4%
Maine: D +8%
Michigan: D +6.9%
Ohio: D +6.7%
Currently estimated/projected national average: D +6.1%
Minnesota: D +6%
Florida: D +5.3%
Virginia: D +4.5%
Iowa: D +3.9%
Wisconsin: D +3.7%
Pennsylvania: D +3.5%
Nevada: D +3%
New Hampshire: D +2.1%
North Carolina: D +1.6%
Arizona: R +1%
Georgia: R +2%
Colorado: R +3.5%
Louisiana: R +4.3%
Kentucky: R +4.5%
Kansas: R +7%
Mississippi: R +7%
South Carolina: R +7%
Alaska: R +7.4%
Texas: R +8%
Arkansas: R +10.3%
Montana: R +11%
West Virginia: R +14%
Wyoming: R +28%
The best-tailored Republican candidates in all states polled so far:
1. Chris Christie favoured in 11 of 32 states (for 139 EVs)
2. Jeb Bush favoured in 6 states (Florida, North Carolina, Arizona, Kentucky (!), Kansas (shared) & West Virginia - for 74 EVs)
3. Rand Paul favoured in 4 states (California, Oregon (shared), Nevada & Alaska - for 71 EVs)
4. Mike Huckabee favoured in 6 states (Texas (!), Louisiana (!), Oregon (shared), Arkansas, Mississippi & New Hampshire (!) - for 69 EVs)
5. Paul Ryan favoured in 3 states (Wisconsin, Colorado & Kansas - for 25 EVs)
6. Tim Pawlenty favoured in 1 state (Minnesota - for 10 EVs)
7. Marco Rubio favoured in 1 state (South Carolina - for 9 EVs)
8. Ben Carson favoured in 1 state (Connecticut - for 7 EVs)
9. Susana Martinez favoured in 1 state (New Mexico - for 5 EVs)
10. Ted Cruz favoured in 1 state (Montana (shared) - for 3 EVs)
Current update as of October 2.
The total number of state polls included below has now reached 183.
The 2016 poll averages for each state - 32 states right now - and the change from the actual 2012 outcomes. Only the Republican candidate with the best statewide polling included.
Alaska: Hillary vs Rand Paul: R +7.4%
+6.6% D improvement
(Updated on September 24, 2014)
Arizona: Hillary vs Bush: R +1%
+8% D improvement
(Updated on March 6, 2014)
Arkansas: Hillary vs Mike Huckabee: R +10.3%
+13.4% D improvement
(Updated on September 24, 2014)
California: Hillary vs Rand Paul: D +9%
+14% R improvement
(Updated on August 1, 2014)
Colorado: Hillary vs Paul Ryan: R +3.5%
+8.9% R improvement
Current Republican gain
(Updated on July 29, 2014)
Connecticut: Hillary vs Ben Carson: D +9%
+8% R improvement
(Updated on August 11, 2014)
Florida: Hillary vs Bush: D +5.3%
+4.4% D improvement
(Updated on September 10, 2014)
Georgia: Hillary vs Christie: R +2%
+6% D improvement
(Updated August 8, 2013)
Iowa: Hillary vs Christie: D +3.9%
+1.9% R improvement
(Updated on October 2, 2014)
Kansas: Hillary vs Bush/Ryan: R +7%
+14.6% D improvement
(Updated on September 17, 2014)
Kentucky: Hillary vs Bush: R +4.5%
+18.2% D improvement
(Updated on August 13, 2014)
Louisiana: Hillary vs Huckabee: R +4.3%
+12.9% D improvement
(Updated on September 30, 2014)
Maine: Hillary vs Christie: D +8%
+7% R improvement
(Updated on November 13, 2013)
Michigan: Hillary vs Christie: D +6.9%
+2.6% R improvement
(Updated on September 9, 2014)
Minnesota: Hillary vs Tim Pawlenty: D +6%
+2% R improvement
(Updated on June 18, 2014)
Mississippi: Hillary vs Huckabee: R +7%
+4.5% D improvement
(Updated on July 20, 2014)
Montana: Hillary vs Christie/Ted Cruz: R +11% (Brian Schweitzer vs Rand Paul: R +8%)
+3% D improvement
(Updated on October 2, 2014)
Nevada: Hillary vs Rand Paul: D +3%
+4% R improvement
(Updated on July 31, 2014)
New Hampshire: Hillary vs Huckabee: D +2.1%
+3.5% R improvement
(Updated on July 17, 2014)
New Jersey: Hillary vs Christie: D +8.4%
+9.4% R improvement
(Updated on October 1, 2014)
New Mexico: Hillary vs Susana Martinez: D +14%
+4% D improvement
(Updated on March 27, 2014)
New York: Hillary vs Christie: D +24.6%
+3.6% R improvement
(Updated on August 21, 2014)
North Carolina: Hillary vs Bush: D +1.6%
+3.6% D improvement
Current Democratic gain
(Updated on September 16, 2014)
Ohio: Hillary vs Christie: D +6.7%
+3.7% D improvement
(Updated on July 31, 2014)
Oregon: Hillary vs Rand Paul/Huckabee: D +12%
Unchanged from 2012
(Updated on May 30, 2014)
Pennsylvania: Hillary vs Christie: D +3.5%
+1.9% R improvement
(Updated on June 5, 2014)
South Carolina: Hillary vs Marco Rubio: R +7%
+3.5% D improvement
(Updated on November 2, 2013)
Texas: Hillary vs Huckabee: R +8%
+8% D improvement
(Updated on April 18, 2014)
Virginia: Hillary vs Christie: D +4.5%
+0.6% D improvement
(Updated on September 25, 2014)
West Virginia: Hillary vs Bush: R +14%
+13% D improvement
(Updated on October 1, 2013)
Wisconsin: Hillary vs Ryan: D +3.7%
+3.2% R improvement
(Updated on September 30, 2014)
Wyoming: Hillary vs Christie: R +28%
+13% D improvement
(Updated on July 23, 2013)
Average all 32 states: Hillary vs Best Republican: D +0.5%
+2.2% D improvement (from Obama 2012) [projecting a 6.1% victory for Hillary]
Giving us this map:
(
Red = Democratic lead/trend
Blue = Republican lead/trend
Green = Tied or no trend
Grey = No polling yet
Green = toss up or less than 0.5% lead
20% shade = 0.6-2% lead
30% shade = 2.1-4% lead
40% shade = 4.1-6% lead
50% shade = 6.1-9% lead
60% shade = 9.1-12% lead
70% shade = 12.1-15% lead
80% shade = 15.1-18% lead
90% shade = Above 18.1% lead
In the count of electoral votes, the current situation looks like this:
Hillary: 268 EVs (in 18 states)
Best/Tailormade Republican: 131 EVs (in 14 states)
Toss-up: None
No polling: 139 EVs (in 18 states + D.C.)
So far, Hillary has captured an impressive 67.2% of all EVs awarded.
This is how the Trendline Map looks so far:
(
The states which right now are showing the strongest improvement for the Democratic (Hillary) or the Republican candidate (in 11 out of 32 cases, Christie is that person):
1. Kentucky: D +18.2%
2. Kansas: D +14.6%
3. California: R +14%
4. Arkansas: D +13.4%
5. West Virginia: D +13%
6. Wyoming: D +13%
7. Louisiana: D +12.9%
8. New Jersey: R +9.4%
9. Colorado: R +8.9%
10. Arizona: D +8%
11. Texas: D +8%
12. Connecticut: R +8%
13. Maine: R +7%
14. Alaska: D +6.6%
15. Georgia: D +6%
16. Mississippi: D +4.5%
17. Florida: D +4.4%
All of these changes (in the 17 states above) are statistically significant, though there are HUGE question marks concerning California.
The whole list of states having been polled till now, going from Democratic stronghold to Republican stronghold:
New York: D +24.6%
New Mexico: D +14%
Oregon: D +12%
California: D +9%
Connecticut: D +9%
New Jersey: D +8.4%
Maine: D +8%
Michigan: D +6.9%
Ohio: D +6.7%
Currently estimated/projected national average: D +6.1%
Minnesota: D +6%
Florida: D +5.3%
Virginia: D +4.5%
Iowa: D +3.9%
Wisconsin: D +3.7%
Pennsylvania: D +3.5%
Nevada: D +3%
New Hampshire: D +2.1%
North Carolina: D +1.6%
Arizona: R +1%
Georgia: R +2%
Colorado: R +3.5%
Louisiana: R +4.3%
Kentucky: R +4.5%
Kansas: R +7%
Mississippi: R +7%
South Carolina: R +7%
Alaska: R +7.4%
Texas: R +8%
Arkansas: R +10.3%
Montana: R +11%
West Virginia: R +14%
Wyoming: R +28%
The best-tailored Republican candidates in all states polled so far:
1. Chris Christie favoured in 11 of 32 states (for 139 EVs)
2. Jeb Bush favoured in 6 states (Florida, North Carolina, Arizona, Kentucky (!), Kansas (shared) & West Virginia - for 74 EVs)
3. Rand Paul favoured in 4 states (California, Oregon (shared), Nevada & Alaska - for 71 EVs)
4. Mike Huckabee favoured in 6 states (Texas (!), Louisiana (!), Oregon (shared), Arkansas, Mississippi & New Hampshire (!) - for 69 EVs)
5. Paul Ryan favoured in 3 states (Wisconsin, Colorado & Kansas - for 25 EVs)
6. Tim Pawlenty favoured in 1 state (Minnesota - for 10 EVs)
7. Marco Rubio favoured in 1 state (South Carolina - for 9 EVs)
8. Ben Carson favoured in 1 state (Connecticut - for 7 EVs)
9. Susana Martinez favoured in 1 state (New Mexico - for 5 EVs)
10. Ted Cruz favoured in 1 state (Montana (shared) - for 3 EVs)
Current update as of October 2.
Title: Re: 2016 Official Polling Map Thread
Post by: IceSpear on October 02, 2014, 06:01:18 PM
The fact that both the California and Iowa numbers are determined solely by Gravis is quite unsettling.
Title: Re: 2016 Official Polling Map Thread
Post by: eric82oslo on October 02, 2014, 06:17:11 PM
The fact that both the California and Iowa numbers are determined solely by Gravis is quite unsettling.
As well as Connecticut and Nevada. :P
Update: Iowa numbers now changed after I realized that there have been "heaps" of match-ups actually including Paul Ryan in the state. Don't know how I managed to overlook that obvious fact.
Title: Re: 2016 Official Polling Map Thread
Post by: pbrower2a on October 03, 2014, 04:11:03 AM
For what it's worth, Gravis, Montana.
Bush (R)- 45%
Clinton (D)- 36%
Paul (R)- 46%
Clinton (D)- 38%
Ryan (R)- 51%
Clinton (D)- 37%
Hillary Clinton vs. Jeb Bush
()
Hillary Clinton vs. Chris Christie
()
Hillary Clinton vs. Mike Huckabee
()
Hillary Clinton vs. Rand Paul
( )
)
blue, Republican -- red, Democratic
30% -- lead with 40-49% but a margin of 3% or less
40% -- lead with 40-49% but a margin of 4% or more
60% -- lead with 50-54%
70% -- lead with 55-59%
90% -- lead with 60% or more
Bush (R)- 45%
Clinton (D)- 36%
Paul (R)- 46%
Clinton (D)- 38%
Ryan (R)- 51%
Clinton (D)- 37%
Hillary Clinton vs. Jeb Bush
(
Hillary Clinton vs. Chris Christie
(
Hillary Clinton vs. Mike Huckabee
(
Hillary Clinton vs. Rand Paul
(
blue, Republican -- red, Democratic
30% -- lead with 40-49% but a margin of 3% or less
40% -- lead with 40-49% but a margin of 4% or more
60% -- lead with 50-54%
70% -- lead with 55-59%
90% -- lead with 60% or more
Title: Re: 2016 Official Polling Map Thread
Post by: eric82oslo on October 04, 2014, 06:14:32 PM
So over the last few days, we've gotten three new polls released by Gravis Marketing. Surely one of the worst, most biased pollsters in the world, but what the heck. It is so lousy due to its reckless sample of the general population. The polls from Montana and Iowa have already been added into the database, so here comes the last poll update from Kansas. And yes, it happens to be another case of Bias with a big, big B. Look at the facts: In this poll, Republicans enjoyed an advantage over Democrats at a shocking 29% difference (54% versus 25%, or 54% versus 46% if we include independents as well)! What was perhaps even more shocking though, were its sample of age and education levels, with two out of three sampled voters being older than 50 and 85% having at least some college education. Enough said, its a long shot (I mean to the moon and back again, if not to another gallazy entirely) from being even remotely scientific. Now, enough ramble. I'm not appointing myself to be judge over polls and pollsters, although ever so often it's a good advice to point out certain details about specific polls in order not to give everyone the wrong impression of where things stand. As 538 pointed out recently, almost every single pollster in the US have a Republican bias, and very many of them a very strong Republican bias. Unsurprisingly, Gravis was amongst the group having very strong Republican bias, yet many more reputable pollsters had as well.
This Kansas poll, the 5th from the state, was the very first one not produced by PPP.
Let me cut down to the mere basics, I present you with the new averages:
Vs Jeb Bush: R +8% (4 polls, Hillary down 1%)
Vs Paul Ryan: R +7% (1 poll)
Vs Rand Paul: R +5.75% (4 polls, Hillary down 1.75%)
Vs Mike Huckabee: R +5% (3 polls)
Vs Marco Rubio: R +5% (1 poll)
Vs Chris Christie: R +4.3% (3 polls)
Vs Ted Cruz: D +1% (2 polls)
So every Republican candidate except for controversial Ted Cruz are still leading Hillary in Kansas, proving that it's still a Clear Republican state, despite the current troubles of Roberts and Brownback. It's no way 54% Republican though, as Gravis claims!
Title: Re: 2016 Official Polling Map Thread
Post by: eric82oslo on October 04, 2014, 06:32:37 PM
Gravis has polled Kansas, which means that Paul Ryan is no longer the king in that state, leaving that spot currently available for Jeb Bush only. Bush goes from +7% to +8% over Hillary in Kansas.
The total number of state polls included below has now reached 184.
The 2016 poll averages for each state - 32 states right now - and the change from the actual 2012 outcomes. Only the Republican candidate with the best statewide polling included.
Alaska: Hillary vs Rand Paul: R +7.4%
+6.6% D improvement
(Updated on September 24, 2014)
Arizona: Hillary vs Bush: R +1%
+8% D improvement
(Updated on March 6, 2014)
Arkansas: Hillary vs Mike Huckabee: R +10.3%
+13.4% D improvement
(Updated on September 24, 2014)
California: Hillary vs Rand Paul: D +9%
+14% R improvement
(Updated on August 1, 2014)
Colorado: Hillary vs Paul Ryan: R +3.5%
+8.9% R improvement
Current Republican gain
(Updated on July 29, 2014)
Connecticut: Hillary vs Ben Carson: D +9%
+8% R improvement
(Updated on August 11, 2014)
Florida: Hillary vs Bush: D +5.3%
+4.4% D improvement
(Updated on September 10, 2014)
Georgia: Hillary vs Christie: R +2%
+6% D improvement
(Updated August 8, 2013)
Iowa: Hillary vs Christie: D +3.9%
+1.9% R improvement
(Updated on October 2, 2014)
Kansas: Hillary vs Bush: R +8%
+13.6% D improvement
(Updated on October 5, 2014)
Kentucky: Hillary vs Bush: R +4.5%
+18.2% D improvement
(Updated on August 13, 2014)
Louisiana: Hillary vs Huckabee: R +4.3%
+12.9% D improvement
(Updated on September 30, 2014)
Maine: Hillary vs Christie: D +8%
+7% R improvement
(Updated on November 13, 2013)
Michigan: Hillary vs Christie: D +6.9%
+2.6% R improvement
(Updated on September 9, 2014)
Minnesota: Hillary vs Tim Pawlenty: D +6%
+2% R improvement
(Updated on June 18, 2014)
Mississippi: Hillary vs Huckabee: R +7%
+4.5% D improvement
(Updated on July 20, 2014)
Montana: Hillary vs Christie/Ted Cruz: R +11% (Brian Schweitzer vs Rand Paul: R +8%)
+3% D improvement
(Updated on October 2, 2014)
Nevada: Hillary vs Rand Paul: D +3%
+4% R improvement
(Updated on July 31, 2014)
New Hampshire: Hillary vs Huckabee: D +2.1%
+3.5% R improvement
(Updated on July 17, 2014)
New Jersey: Hillary vs Christie: D +8.4%
+9.4% R improvement
(Updated on October 1, 2014)
New Mexico: Hillary vs Susana Martinez: D +14%
+4% D improvement
(Updated on March 27, 2014)
New York: Hillary vs Christie: D +24.6%
+3.6% R improvement
(Updated on August 21, 2014)
North Carolina: Hillary vs Bush: D +1.6%
+3.6% D improvement
Current Democratic gain
(Updated on September 16, 2014)
Ohio: Hillary vs Christie: D +6.7%
+3.7% D improvement
(Updated on July 31, 2014)
Oregon: Hillary vs Rand Paul/Huckabee: D +12%
Unchanged from 2012
(Updated on May 30, 2014)
Pennsylvania: Hillary vs Christie: D +3.5%
+1.9% R improvement
(Updated on June 5, 2014)
South Carolina: Hillary vs Marco Rubio: R +7%
+3.5% D improvement
(Updated on November 2, 2013)
Texas: Hillary vs Huckabee: R +8%
+8% D improvement
(Updated on April 18, 2014)
Virginia: Hillary vs Christie: D +4.5%
+0.6% D improvement
(Updated on September 25, 2014)
West Virginia: Hillary vs Bush: R +14%
+13% D improvement
(Updated on October 1, 2013)
Wisconsin: Hillary vs Ryan: D +3.7%
+3.2% R improvement
(Updated on September 30, 2014)
Wyoming: Hillary vs Christie: R +28%
+13% D improvement
(Updated on July 23, 2013)
Average all 32 states: Hillary vs Best Republican: D +0.5%
+2.2% D improvement (from Obama 2012) [projecting a 6.1% victory for Hillary]
Giving us this map:
()
Red = Democratic lead/trend
Blue = Republican lead/trend
Green = Tied or no trend
Grey = No polling yet
Green = toss up or less than 0.5% lead
20% shade = 0.6-2% lead
30% shade = 2.1-4% lead
40% shade = 4.1-6% lead
50% shade = 6.1-9% lead
60% shade = 9.1-12% lead
70% shade = 12.1-15% lead
80% shade = 15.1-18% lead
90% shade = Above 18.1% lead
In the count of electoral votes, the current situation looks like this:
Hillary: 268 EVs (in 18 states)
Best/Tailormade Republican: 131 EVs (in 14 states)
Toss-up: None
No polling: 139 EVs (in 18 states + D.C.)
So far, Hillary has captured an impressive 67.2% of all EVs awarded, against only 32.8% EVs for the tailormade Republican.
This is how the Trendline Map looks so far:
()
The states which right now are showing the strongest improvement for the Democratic (Hillary) or the Republican candidate (in 11 out of 32 cases, Christie is that person):
1. Kentucky: D +18.2%
2. California: R +14%
3. Kansas: D +13.6%
4. Arkansas: D +13.4%
5. West Virginia: D +13%
6. Wyoming: D +13%
7. Louisiana: D +12.9%
8. New Jersey: R +9.4%
9. Colorado: R +8.9%
10. Arizona: D +8%
11. Texas: D +8%
12. Connecticut: R +8%
13. Maine: R +7%
14. Alaska: D +6.6%
15. Georgia: D +6%
16. Mississippi: D +4.5%
17. Florida: D +4.4%
All of these changes (in the 17 states above) are statistically significant, though there are HUGE question marks concerning California.
The whole list of states having been polled till now, going from Democratic stronghold to Republican stronghold:
New York: D +24.6%
New Mexico: D +14%
Oregon: D +12%
California: D +9%
Connecticut: D +9%
New Jersey: D +8.4%
Maine: D +8%
Michigan: D +6.9%
Ohio: D +6.7%
Currently estimated/projected national average: D +6.1%
Minnesota: D +6%
Florida: D +5.3%
Virginia: D +4.5%
Iowa: D +3.9%
Wisconsin: D +3.7%
Pennsylvania: D +3.5%
Nevada: D +3%
New Hampshire: D +2.1%
North Carolina: D +1.6%
Arizona: R +1%
Georgia: R +2%
Colorado: R +3.5%
Louisiana: R +4.3%
Kentucky: R +4.5%
Mississippi: R +7%
South Carolina: R +7%
Alaska: R +7.4%
Texas: R +8%
Kansas: R +8%
Arkansas: R +10.3%
Montana: R +11%
West Virginia: R +14%
Wyoming: R +28%
The best-tailored Republican candidates in all states polled so far:
1. Chris Christie favoured in 11 of 32 states (for 139 EVs)
2. Jeb Bush favoured in 6 states (Florida, North Carolina, Arizona, Kentucky (!), Kansas & West Virginia - for 74 EVs)
3. Rand Paul favoured in 4 states (California, Oregon (shared), Nevada & Alaska - for 71 EVs)
4. Mike Huckabee favoured in 6 states (Texas (!), Louisiana (!), Oregon (shared), Arkansas, Mississippi & New Hampshire (!) - for 69 EVs)
5. Paul Ryan favoured in 2 states (Wisconsin & Colorado - for 19 EVs)
6. Tim Pawlenty favoured in 1 state (Minnesota - for 10 EVs)
7. Marco Rubio favoured in 1 state (South Carolina - for 9 EVs)
8. Ben Carson favoured in 1 state (Connecticut - for 7 EVs)
9. Susana Martinez favoured in 1 state (New Mexico - for 5 EVs)
10. Ted Cruz favoured in 1 state (Montana (shared) - for 3 EVs)
Current update as of October 5.
The total number of state polls included below has now reached 184.
The 2016 poll averages for each state - 32 states right now - and the change from the actual 2012 outcomes. Only the Republican candidate with the best statewide polling included.
Alaska: Hillary vs Rand Paul: R +7.4%
+6.6% D improvement
(Updated on September 24, 2014)
Arizona: Hillary vs Bush: R +1%
+8% D improvement
(Updated on March 6, 2014)
Arkansas: Hillary vs Mike Huckabee: R +10.3%
+13.4% D improvement
(Updated on September 24, 2014)
California: Hillary vs Rand Paul: D +9%
+14% R improvement
(Updated on August 1, 2014)
Colorado: Hillary vs Paul Ryan: R +3.5%
+8.9% R improvement
Current Republican gain
(Updated on July 29, 2014)
Connecticut: Hillary vs Ben Carson: D +9%
+8% R improvement
(Updated on August 11, 2014)
Florida: Hillary vs Bush: D +5.3%
+4.4% D improvement
(Updated on September 10, 2014)
Georgia: Hillary vs Christie: R +2%
+6% D improvement
(Updated August 8, 2013)
Iowa: Hillary vs Christie: D +3.9%
+1.9% R improvement
(Updated on October 2, 2014)
Kansas: Hillary vs Bush: R +8%
+13.6% D improvement
(Updated on October 5, 2014)
Kentucky: Hillary vs Bush: R +4.5%
+18.2% D improvement
(Updated on August 13, 2014)
Louisiana: Hillary vs Huckabee: R +4.3%
+12.9% D improvement
(Updated on September 30, 2014)
Maine: Hillary vs Christie: D +8%
+7% R improvement
(Updated on November 13, 2013)
Michigan: Hillary vs Christie: D +6.9%
+2.6% R improvement
(Updated on September 9, 2014)
Minnesota: Hillary vs Tim Pawlenty: D +6%
+2% R improvement
(Updated on June 18, 2014)
Mississippi: Hillary vs Huckabee: R +7%
+4.5% D improvement
(Updated on July 20, 2014)
Montana: Hillary vs Christie/Ted Cruz: R +11% (Brian Schweitzer vs Rand Paul: R +8%)
+3% D improvement
(Updated on October 2, 2014)
Nevada: Hillary vs Rand Paul: D +3%
+4% R improvement
(Updated on July 31, 2014)
New Hampshire: Hillary vs Huckabee: D +2.1%
+3.5% R improvement
(Updated on July 17, 2014)
New Jersey: Hillary vs Christie: D +8.4%
+9.4% R improvement
(Updated on October 1, 2014)
New Mexico: Hillary vs Susana Martinez: D +14%
+4% D improvement
(Updated on March 27, 2014)
New York: Hillary vs Christie: D +24.6%
+3.6% R improvement
(Updated on August 21, 2014)
North Carolina: Hillary vs Bush: D +1.6%
+3.6% D improvement
Current Democratic gain
(Updated on September 16, 2014)
Ohio: Hillary vs Christie: D +6.7%
+3.7% D improvement
(Updated on July 31, 2014)
Oregon: Hillary vs Rand Paul/Huckabee: D +12%
Unchanged from 2012
(Updated on May 30, 2014)
Pennsylvania: Hillary vs Christie: D +3.5%
+1.9% R improvement
(Updated on June 5, 2014)
South Carolina: Hillary vs Marco Rubio: R +7%
+3.5% D improvement
(Updated on November 2, 2013)
Texas: Hillary vs Huckabee: R +8%
+8% D improvement
(Updated on April 18, 2014)
Virginia: Hillary vs Christie: D +4.5%
+0.6% D improvement
(Updated on September 25, 2014)
West Virginia: Hillary vs Bush: R +14%
+13% D improvement
(Updated on October 1, 2013)
Wisconsin: Hillary vs Ryan: D +3.7%
+3.2% R improvement
(Updated on September 30, 2014)
Wyoming: Hillary vs Christie: R +28%
+13% D improvement
(Updated on July 23, 2013)
Average all 32 states: Hillary vs Best Republican: D +0.5%
+2.2% D improvement (from Obama 2012) [projecting a 6.1% victory for Hillary]
Giving us this map:
(
Red = Democratic lead/trend
Blue = Republican lead/trend
Green = Tied or no trend
Grey = No polling yet
Green = toss up or less than 0.5% lead
20% shade = 0.6-2% lead
30% shade = 2.1-4% lead
40% shade = 4.1-6% lead
50% shade = 6.1-9% lead
60% shade = 9.1-12% lead
70% shade = 12.1-15% lead
80% shade = 15.1-18% lead
90% shade = Above 18.1% lead
In the count of electoral votes, the current situation looks like this:
Hillary: 268 EVs (in 18 states)
Best/Tailormade Republican: 131 EVs (in 14 states)
Toss-up: None
No polling: 139 EVs (in 18 states + D.C.)
So far, Hillary has captured an impressive 67.2% of all EVs awarded, against only 32.8% EVs for the tailormade Republican.
This is how the Trendline Map looks so far:
(
The states which right now are showing the strongest improvement for the Democratic (Hillary) or the Republican candidate (in 11 out of 32 cases, Christie is that person):
1. Kentucky: D +18.2%
2. California: R +14%
3. Kansas: D +13.6%
4. Arkansas: D +13.4%
5. West Virginia: D +13%
6. Wyoming: D +13%
7. Louisiana: D +12.9%
8. New Jersey: R +9.4%
9. Colorado: R +8.9%
10. Arizona: D +8%
11. Texas: D +8%
12. Connecticut: R +8%
13. Maine: R +7%
14. Alaska: D +6.6%
15. Georgia: D +6%
16. Mississippi: D +4.5%
17. Florida: D +4.4%
All of these changes (in the 17 states above) are statistically significant, though there are HUGE question marks concerning California.
The whole list of states having been polled till now, going from Democratic stronghold to Republican stronghold:
New York: D +24.6%
New Mexico: D +14%
Oregon: D +12%
California: D +9%
Connecticut: D +9%
New Jersey: D +8.4%
Maine: D +8%
Michigan: D +6.9%
Ohio: D +6.7%
Currently estimated/projected national average: D +6.1%
Minnesota: D +6%
Florida: D +5.3%
Virginia: D +4.5%
Iowa: D +3.9%
Wisconsin: D +3.7%
Pennsylvania: D +3.5%
Nevada: D +3%
New Hampshire: D +2.1%
North Carolina: D +1.6%
Arizona: R +1%
Georgia: R +2%
Colorado: R +3.5%
Louisiana: R +4.3%
Kentucky: R +4.5%
Mississippi: R +7%
South Carolina: R +7%
Alaska: R +7.4%
Texas: R +8%
Kansas: R +8%
Arkansas: R +10.3%
Montana: R +11%
West Virginia: R +14%
Wyoming: R +28%
The best-tailored Republican candidates in all states polled so far:
1. Chris Christie favoured in 11 of 32 states (for 139 EVs)
2. Jeb Bush favoured in 6 states (Florida, North Carolina, Arizona, Kentucky (!), Kansas & West Virginia - for 74 EVs)
3. Rand Paul favoured in 4 states (California, Oregon (shared), Nevada & Alaska - for 71 EVs)
4. Mike Huckabee favoured in 6 states (Texas (!), Louisiana (!), Oregon (shared), Arkansas, Mississippi & New Hampshire (!) - for 69 EVs)
5. Paul Ryan favoured in 2 states (Wisconsin & Colorado - for 19 EVs)
6. Tim Pawlenty favoured in 1 state (Minnesota - for 10 EVs)
7. Marco Rubio favoured in 1 state (South Carolina - for 9 EVs)
8. Ben Carson favoured in 1 state (Connecticut - for 7 EVs)
9. Susana Martinez favoured in 1 state (New Mexico - for 5 EVs)
10. Ted Cruz favoured in 1 state (Montana (shared) - for 3 EVs)
Current update as of October 5.
Title: Re: 2016 Official Polling Map Thread
Post by: BlueSwan on October 06, 2014, 03:04:26 AM
Awesome work! Keep it up!
Title: Re: 2016 Official Polling Map Thread
Post by: eric82oslo on October 06, 2014, 02:48:25 PM
PPP has polled Connecticut for the 1st time, joining Gravis as the 2nd pollster in the state. Unfortunately, PPP didn't include Ben Carson, who did very well with Gravis. However, there's now only a 1% difference between Carson and Christie in the state, so honestly it doesn't matter all that much. New Connecticut averages:
Vs Ben Carson: D +9%
Vs Christie: D +10%
Vs Bush: D +13%
Vs Rand Paul: D +17% (2 polls, Hillary up 2%)
Vs Huckabee: D +19%
Vs Cruz: D +22%
The total number of state polls included below has now reached 185.
The 2016 poll averages for each state - 32 states right now - and the change from the actual 2012 outcomes. Only the Republican candidate with the best statewide polling included.
Alaska: Hillary vs Rand Paul: R +7.4%
+6.6% D improvement
(Updated on September 24, 2014)
Arizona: Hillary vs Bush: R +1%
+8% D improvement
(Updated on March 6, 2014)
Arkansas: Hillary vs Mike Huckabee: R +10.3%
+13.4% D improvement
(Updated on September 24, 2014)
California: Hillary vs Rand Paul: D +9%
+14% R improvement
(Updated on August 1, 2014)
Colorado: Hillary vs Paul Ryan: R +3.5%
+8.9% R improvement
Current Republican gain
(Updated on July 29, 2014)
Connecticut: Hillary vs Ben Carson: D +9%
+8% R improvement
(Updated on October 6, 2014)
Florida: Hillary vs Bush: D +5.3%
+4.4% D improvement
(Updated on September 10, 2014)
Georgia: Hillary vs Christie: R +2%
+6% D improvement
(Updated August 8, 2013)
Iowa: Hillary vs Christie: D +3.9%
+1.9% R improvement
(Updated on October 2, 2014)
Kansas: Hillary vs Bush: R +8%
+13.6% D improvement
(Updated on October 5, 2014)
Kentucky: Hillary vs Bush: R +4.5%
+18.2% D improvement
(Updated on August 13, 2014)
Louisiana: Hillary vs Huckabee: R +4.3%
+12.9% D improvement
(Updated on September 30, 2014)
Maine: Hillary vs Christie: D +8%
+7% R improvement
(Updated on November 13, 2013)
Michigan: Hillary vs Christie: D +6.9%
+2.6% R improvement
(Updated on September 9, 2014)
Minnesota: Hillary vs Tim Pawlenty: D +6%
+2% R improvement
(Updated on June 18, 2014)
Mississippi: Hillary vs Huckabee: R +7%
+4.5% D improvement
(Updated on July 20, 2014)
Montana: Hillary vs Christie/Ted Cruz: R +11% (Brian Schweitzer vs Rand Paul: R +8%)
+3% D improvement
(Updated on October 2, 2014)
Nevada: Hillary vs Rand Paul: D +3%
+4% R improvement
(Updated on July 31, 2014)
New Hampshire: Hillary vs Huckabee: D +2.1%
+3.5% R improvement
(Updated on July 17, 2014)
New Jersey: Hillary vs Christie: D +8.4%
+9.4% R improvement
(Updated on October 1, 2014)
New Mexico: Hillary vs Susana Martinez: D +14%
+4% D improvement
(Updated on March 27, 2014)
New York: Hillary vs Christie: D +24.6%
+3.6% R improvement
(Updated on August 21, 2014)
North Carolina: Hillary vs Bush: D +1.6%
+3.6% D improvement
Current Democratic gain
(Updated on September 16, 2014)
Ohio: Hillary vs Christie: D +6.7%
+3.7% D improvement
(Updated on July 31, 2014)
Oregon: Hillary vs Rand Paul/Huckabee: D +12%
Unchanged from 2012
(Updated on May 30, 2014)
Pennsylvania: Hillary vs Christie: D +3.5%
+1.9% R improvement
(Updated on June 5, 2014)
South Carolina: Hillary vs Marco Rubio: R +7%
+3.5% D improvement
(Updated on November 2, 2013)
Texas: Hillary vs Huckabee: R +8%
+8% D improvement
(Updated on April 18, 2014)
Virginia: Hillary vs Christie: D +4.5%
+0.6% D improvement
(Updated on September 25, 2014)
West Virginia: Hillary vs Bush: R +14%
+13% D improvement
(Updated on October 1, 2013)
Wisconsin: Hillary vs Ryan: D +3.7%
+3.2% R improvement
(Updated on September 30, 2014)
Wyoming: Hillary vs Christie: R +28%
+13% D improvement
(Updated on July 23, 2013)
Average all 32 states: Hillary vs Best Republican: D +0.5%
+2.2% D improvement (from Obama 2012) [projecting a 6.1% victory for Hillary]
Giving us this map:
()
Red = Democratic lead/trend
Blue = Republican lead/trend
Green = Tied or no trend
Grey = No polling yet
Green = toss up or less than 0.5% lead
20% shade = 0.6-2% lead
30% shade = 2.1-4% lead
40% shade = 4.1-6% lead
50% shade = 6.1-9% lead
60% shade = 9.1-12% lead
70% shade = 12.1-15% lead
80% shade = 15.1-18% lead
90% shade = Above 18.1% lead
In the count of electoral votes, the current situation looks like this:
Hillary: 268 EVs (in 18 states)
Best/Tailormade Republican: 131 EVs (in 14 states)
Toss-up: None
No polling: 139 EVs (in 18 states + D.C.)
So far, Hillary has captured an impressive 67.2% of all EVs awarded, against only 32.8% EVs for the tailormade Republican.
This is how the Trendline Map looks so far:
()
The states which right now are showing the strongest improvement for the Democratic (Hillary) or the Republican candidate (in 11 out of 32 cases, Christie is that person):
1. Kentucky: D +18.2%
2. California: R +14%
3. Kansas: D +13.6%
4. Arkansas: D +13.4%
5. West Virginia: D +13%
6. Wyoming: D +13%
7. Louisiana: D +12.9%
8. New Jersey: R +9.4%
9. Colorado: R +8.9%
10. Arizona: D +8%
11. Texas: D +8%
12. Connecticut: R +8%
13. Maine: R +7%
14. Alaska: D +6.6%
15. Georgia: D +6%
16. Mississippi: D +4.5%
17. Florida: D +4.4%
All of these changes (in the 17 states above) are statistically significant, though there are HUGE question marks concerning California.
The whole list of states having been polled till now, going from Democratic stronghold to Republican stronghold:
New York: D +24.6%
New Mexico: D +14%
Oregon: D +12%
California: D +9%
Connecticut: D +9%
New Jersey: D +8.4%
Maine: D +8%
Michigan: D +6.9%
Ohio: D +6.7%
Currently estimated/projected national average: D +6.1%
Minnesota: D +6%
Florida: D +5.3%
Virginia: D +4.5%
Iowa: D +3.9%
Wisconsin: D +3.7%
Pennsylvania: D +3.5%
Nevada: D +3%
New Hampshire: D +2.1%
North Carolina: D +1.6%
Arizona: R +1%
Georgia: R +2%
Colorado: R +3.5%
Louisiana: R +4.3%
Kentucky: R +4.5%
South Carolina: R +7%
Mississippi: R +7%
Alaska: R +7.4%
Texas: R +8%
Kansas: R +8%
Arkansas: R +10.3%
Montana: R +11%
West Virginia: R +14%
Wyoming: R +28%
The best-tailored Republican candidates in all states polled so far:
1. Chris Christie favoured in 11 of 32 states (for 139 EVs)
2. Jeb Bush favoured in 6 states (Florida, North Carolina, Arizona, Kentucky (!), Kansas & West Virginia - for 74 EVs)
3. Rand Paul favoured in 4 states (California, Oregon (shared), Nevada & Alaska - for 71 EVs)
4. Mike Huckabee favoured in 6 states (Texas (!), Louisiana (!), Oregon (shared), Arkansas, Mississippi & New Hampshire (!) - for 69 EVs)
5. Paul Ryan favoured in 2 states (Wisconsin & Colorado - for 19 EVs)
6. Tim Pawlenty favoured in 1 state (Minnesota - for 10 EVs)
7. Marco Rubio favoured in 1 state (South Carolina - for 9 EVs)
8. Ben Carson favoured in 1 state (Connecticut - for 7 EVs)
9. Susana Martinez favoured in 1 state (New Mexico - for 5 EVs)
10. Ted Cruz favoured in 1 state (Montana (shared) - for 3 EVs)
Current update as of October 6.
Vs Ben Carson: D +9%
Vs Christie: D +10%
Vs Bush: D +13%
Vs Rand Paul: D +17% (2 polls, Hillary up 2%)
Vs Huckabee: D +19%
Vs Cruz: D +22%
The total number of state polls included below has now reached 185.
The 2016 poll averages for each state - 32 states right now - and the change from the actual 2012 outcomes. Only the Republican candidate with the best statewide polling included.
Alaska: Hillary vs Rand Paul: R +7.4%
+6.6% D improvement
(Updated on September 24, 2014)
Arizona: Hillary vs Bush: R +1%
+8% D improvement
(Updated on March 6, 2014)
Arkansas: Hillary vs Mike Huckabee: R +10.3%
+13.4% D improvement
(Updated on September 24, 2014)
California: Hillary vs Rand Paul: D +9%
+14% R improvement
(Updated on August 1, 2014)
Colorado: Hillary vs Paul Ryan: R +3.5%
+8.9% R improvement
Current Republican gain
(Updated on July 29, 2014)
Connecticut: Hillary vs Ben Carson: D +9%
+8% R improvement
(Updated on October 6, 2014)
Florida: Hillary vs Bush: D +5.3%
+4.4% D improvement
(Updated on September 10, 2014)
Georgia: Hillary vs Christie: R +2%
+6% D improvement
(Updated August 8, 2013)
Iowa: Hillary vs Christie: D +3.9%
+1.9% R improvement
(Updated on October 2, 2014)
Kansas: Hillary vs Bush: R +8%
+13.6% D improvement
(Updated on October 5, 2014)
Kentucky: Hillary vs Bush: R +4.5%
+18.2% D improvement
(Updated on August 13, 2014)
Louisiana: Hillary vs Huckabee: R +4.3%
+12.9% D improvement
(Updated on September 30, 2014)
Maine: Hillary vs Christie: D +8%
+7% R improvement
(Updated on November 13, 2013)
Michigan: Hillary vs Christie: D +6.9%
+2.6% R improvement
(Updated on September 9, 2014)
Minnesota: Hillary vs Tim Pawlenty: D +6%
+2% R improvement
(Updated on June 18, 2014)
Mississippi: Hillary vs Huckabee: R +7%
+4.5% D improvement
(Updated on July 20, 2014)
Montana: Hillary vs Christie/Ted Cruz: R +11% (Brian Schweitzer vs Rand Paul: R +8%)
+3% D improvement
(Updated on October 2, 2014)
Nevada: Hillary vs Rand Paul: D +3%
+4% R improvement
(Updated on July 31, 2014)
New Hampshire: Hillary vs Huckabee: D +2.1%
+3.5% R improvement
(Updated on July 17, 2014)
New Jersey: Hillary vs Christie: D +8.4%
+9.4% R improvement
(Updated on October 1, 2014)
New Mexico: Hillary vs Susana Martinez: D +14%
+4% D improvement
(Updated on March 27, 2014)
New York: Hillary vs Christie: D +24.6%
+3.6% R improvement
(Updated on August 21, 2014)
North Carolina: Hillary vs Bush: D +1.6%
+3.6% D improvement
Current Democratic gain
(Updated on September 16, 2014)
Ohio: Hillary vs Christie: D +6.7%
+3.7% D improvement
(Updated on July 31, 2014)
Oregon: Hillary vs Rand Paul/Huckabee: D +12%
Unchanged from 2012
(Updated on May 30, 2014)
Pennsylvania: Hillary vs Christie: D +3.5%
+1.9% R improvement
(Updated on June 5, 2014)
South Carolina: Hillary vs Marco Rubio: R +7%
+3.5% D improvement
(Updated on November 2, 2013)
Texas: Hillary vs Huckabee: R +8%
+8% D improvement
(Updated on April 18, 2014)
Virginia: Hillary vs Christie: D +4.5%
+0.6% D improvement
(Updated on September 25, 2014)
West Virginia: Hillary vs Bush: R +14%
+13% D improvement
(Updated on October 1, 2013)
Wisconsin: Hillary vs Ryan: D +3.7%
+3.2% R improvement
(Updated on September 30, 2014)
Wyoming: Hillary vs Christie: R +28%
+13% D improvement
(Updated on July 23, 2013)
Average all 32 states: Hillary vs Best Republican: D +0.5%
+2.2% D improvement (from Obama 2012) [projecting a 6.1% victory for Hillary]
Giving us this map:
(
Red = Democratic lead/trend
Blue = Republican lead/trend
Green = Tied or no trend
Grey = No polling yet
Green = toss up or less than 0.5% lead
20% shade = 0.6-2% lead
30% shade = 2.1-4% lead
40% shade = 4.1-6% lead
50% shade = 6.1-9% lead
60% shade = 9.1-12% lead
70% shade = 12.1-15% lead
80% shade = 15.1-18% lead
90% shade = Above 18.1% lead
In the count of electoral votes, the current situation looks like this:
Hillary: 268 EVs (in 18 states)
Best/Tailormade Republican: 131 EVs (in 14 states)
Toss-up: None
No polling: 139 EVs (in 18 states + D.C.)
So far, Hillary has captured an impressive 67.2% of all EVs awarded, against only 32.8% EVs for the tailormade Republican.
This is how the Trendline Map looks so far:
(
The states which right now are showing the strongest improvement for the Democratic (Hillary) or the Republican candidate (in 11 out of 32 cases, Christie is that person):
1. Kentucky: D +18.2%
2. California: R +14%
3. Kansas: D +13.6%
4. Arkansas: D +13.4%
5. West Virginia: D +13%
6. Wyoming: D +13%
7. Louisiana: D +12.9%
8. New Jersey: R +9.4%
9. Colorado: R +8.9%
10. Arizona: D +8%
11. Texas: D +8%
12. Connecticut: R +8%
13. Maine: R +7%
14. Alaska: D +6.6%
15. Georgia: D +6%
16. Mississippi: D +4.5%
17. Florida: D +4.4%
All of these changes (in the 17 states above) are statistically significant, though there are HUGE question marks concerning California.
The whole list of states having been polled till now, going from Democratic stronghold to Republican stronghold:
New York: D +24.6%
New Mexico: D +14%
Oregon: D +12%
California: D +9%
Connecticut: D +9%
New Jersey: D +8.4%
Maine: D +8%
Michigan: D +6.9%
Ohio: D +6.7%
Currently estimated/projected national average: D +6.1%
Minnesota: D +6%
Florida: D +5.3%
Virginia: D +4.5%
Iowa: D +3.9%
Wisconsin: D +3.7%
Pennsylvania: D +3.5%
Nevada: D +3%
New Hampshire: D +2.1%
North Carolina: D +1.6%
Arizona: R +1%
Georgia: R +2%
Colorado: R +3.5%
Louisiana: R +4.3%
Kentucky: R +4.5%
South Carolina: R +7%
Mississippi: R +7%
Alaska: R +7.4%
Texas: R +8%
Kansas: R +8%
Arkansas: R +10.3%
Montana: R +11%
West Virginia: R +14%
Wyoming: R +28%
The best-tailored Republican candidates in all states polled so far:
1. Chris Christie favoured in 11 of 32 states (for 139 EVs)
2. Jeb Bush favoured in 6 states (Florida, North Carolina, Arizona, Kentucky (!), Kansas & West Virginia - for 74 EVs)
3. Rand Paul favoured in 4 states (California, Oregon (shared), Nevada & Alaska - for 71 EVs)
4. Mike Huckabee favoured in 6 states (Texas (!), Louisiana (!), Oregon (shared), Arkansas, Mississippi & New Hampshire (!) - for 69 EVs)
5. Paul Ryan favoured in 2 states (Wisconsin & Colorado - for 19 EVs)
6. Tim Pawlenty favoured in 1 state (Minnesota - for 10 EVs)
7. Marco Rubio favoured in 1 state (South Carolina - for 9 EVs)
8. Ben Carson favoured in 1 state (Connecticut - for 7 EVs)
9. Susana Martinez favoured in 1 state (New Mexico - for 5 EVs)
10. Ted Cruz favoured in 1 state (Montana (shared) - for 3 EVs)
Current update as of October 6.
Title: Re: 2016 Official Polling Map Thread
Post by: pbrower2a on October 06, 2014, 09:44:40 PM
Connecticut, PPP. We have little polling for New England. The pattern of 2008 and 2010 suggests that the best that a Republican nominee can hope for in Connecticut is just under 40%.
http://www.publicpolicypolling.com/main/2014/10/malloy-leads-by-8-in-connecticut-governors-race.html
49/39 over Christie (+10)
50/37 over Bush (+13)
53/34 over Huckabee (+19)
54/35 over Paul (+19)
54/32 over Cruz (+22)
Hillary Clinton vs. Jeb Bush
(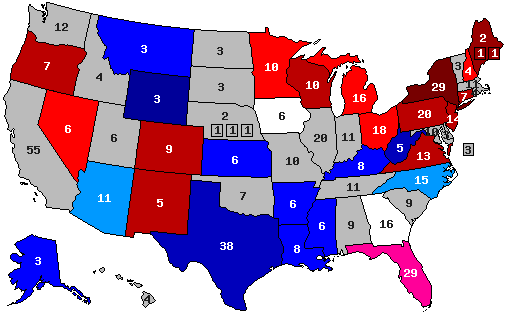 )
)
Hillary Clinton vs. Chris Christie
(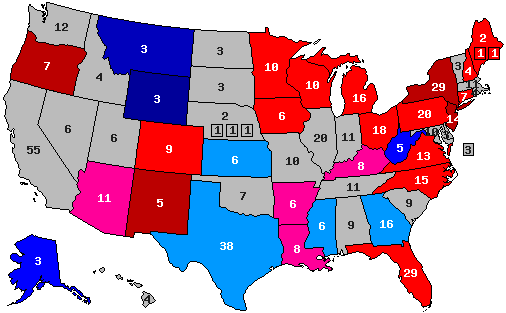 )
)
Hillary Clinton vs. Mike Huckabee
( )
)
Hillary Clinton vs. Rand Paul
(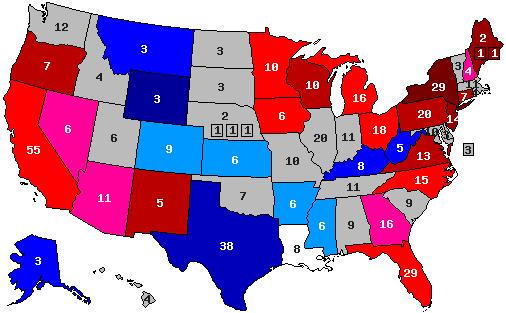 )
)
blue, Republican -- red, Democratic
30% -- lead with 40-49% but a margin of 3% or less
40% -- lead with 40-49% but a margin of 4% or more
60% -- lead with 50-54%
70% -- lead with 55-59%
90% -- lead with 60% or more
http://www.publicpolicypolling.com/main/2014/10/malloy-leads-by-8-in-connecticut-governors-race.html
49/39 over Christie (+10)
50/37 over Bush (+13)
53/34 over Huckabee (+19)
54/35 over Paul (+19)
54/32 over Cruz (+22)
Hillary Clinton vs. Jeb Bush
(
Hillary Clinton vs. Chris Christie
(
Hillary Clinton vs. Mike Huckabee
(
Hillary Clinton vs. Rand Paul
(
blue, Republican -- red, Democratic
30% -- lead with 40-49% but a margin of 3% or less
40% -- lead with 40-49% but a margin of 4% or more
60% -- lead with 50-54%
70% -- lead with 55-59%
90% -- lead with 60% or more
Title: Re: 2016 Official Polling Map Thread
Post by: New_Conservative on October 06, 2014, 09:48:39 PM
I am really not worried about Hilary. These polls are 2 years out and name recognition has a lot to do with her success in the polls. Democrats have to admit that. When was the last time polls were accurate 2 years in advance of a Presidential election?
Title: Re: 2016 Official Polling Map Thread
Post by: pbrower2a on October 06, 2014, 11:11:46 PM
I am really not worried about Hilary. These polls are 2 years out and name recognition has a lot to do with her success in the polls. Democrats have to admit that. When was the last time polls were accurate 2 years in advance of a Presidential election?
Polls cannot predict economic meltdowns, military or diplomatic disasters, bungled responses to natural disasters, personal scandals, or cultural changes to the detriment of the current leader.
I am aware of a projection from 2006 that showed Barack Obama losing in a landslide. Of course, the economy had yet to go into a tailspin and the full nastiness of the Iraq war had yet to show. It also did not show shat sort of campaigner Barack Obama would be.
Title: Re: 2016 Official Polling Map Thread
Post by: eric82oslo on October 07, 2014, 11:50:35 AM
PPP has polled Georgia for the third time over the last 20 months, actually this is the first time the state has been polled for 2016 since August last year, which happens to be 14 months ago. About time for an update in other words. And the race seems to have tilted ever so slightly towards Hillary, in line with continuous demographic changes in this rapidly-urbanizing state. 7 candidates were tested by PPP this time around, including Ted Cruz, Mike Huckabee and home boy Herman Cain, all for the first time. Except for Jeb Bush, they all trailed Madam Clinton. Here are the new match up averages for Georgia as they stand two years (or 25 months) prior to the next presidential election:
Vs Jeb Bush: R +0.5% (2 polls, Hillary down 0.5%, new leader!)
Vs Chris Christie: D +1.5% (2 polls, Hillary up 3.5%, former leader)
Vs Mike Huckabee: D +3% (1 poll)
Vs Marco Rubio: D +3% (1 poll)
Vs Herman Cain: D +3% (1 poll)
Vs Rand Paul: D +4% (2 polls, Hillary down 1%)
Vs Paul Ryan: D +4% (2 polls)
Vs Newt Gingrich: D +5.7% (3 polls, Hillary up 0.2%)
Vs Ted Cruz: D +6% (1 poll)
Vs Sarah Palin: D +13% (1 poll)
This means that Jeb Bush is taking over the hegemony in another state, and once again it's his supposedly strongest competitor, Chris Christie, who is facing the harsh dethroning.
Title: Re: 2016 Official Polling Map Thread
Post by: eric82oslo on October 07, 2014, 12:12:19 PM
With Jeb Bush taking over the leadership position from Chris Christie in the great state (literally 16 EVs strong) of Georgia, Hillary is finally receiving some comforting news on the state level for the upcoming race supposely beginning in just three months from now. With PPP's third poll from Georgia, the state thus moves strongly towards a toss up status, going from R +2% to R +0.5%.
The total number of state polls included below has now reached 186.
The 2016 poll averages for each state - 32 states right now - and the change from the actual 2012 outcomes. Only the Republican candidate with the best statewide polling included.
Alaska: Hillary vs Rand Paul: R +7.4%
+6.6% D improvement
(Updated on September 24, 2014)
Arizona: Hillary vs Bush: R +1%
+8% D improvement
(Updated on March 6, 2014)
Arkansas: Hillary vs Mike Huckabee: R +10.3%
+13.4% D improvement
(Updated on September 24, 2014)
California: Hillary vs Rand Paul: D +9%
+14% R improvement
(Updated on August 1, 2014)
Colorado: Hillary vs Paul Ryan: R +3.5%
+8.9% R improvement
Current Republican gain
(Updated on July 29, 2014)
Connecticut: Hillary vs Ben Carson: D +9%
+8% R improvement
(Updated on October 6, 2014)
Florida: Hillary vs Bush: D +5.3%
+4.4% D improvement
(Updated on September 10, 2014)
Georgia: Hillary vs Bush: R +0.5%
+7.3% D improvement
(Updated October 7, 2013)
Iowa: Hillary vs Christie: D +3.9%
+1.9% R improvement
(Updated on October 2, 2014)
Kansas: Hillary vs Bush: R +8%
+13.6% D improvement
(Updated on October 5, 2014)
Kentucky: Hillary vs Bush: R +4.5%
+18.2% D improvement
(Updated on August 13, 2014)
Louisiana: Hillary vs Huckabee: R +4.3%
+12.9% D improvement
(Updated on September 30, 2014)
Maine: Hillary vs Christie: D +8%
+7% R improvement
(Updated on November 13, 2013)
Michigan: Hillary vs Christie: D +6.9%
+2.6% R improvement
(Updated on September 9, 2014)
Minnesota: Hillary vs Tim Pawlenty: D +6%
+2% R improvement
(Updated on June 18, 2014)
Mississippi: Hillary vs Huckabee: R +7%
+4.5% D improvement
(Updated on July 20, 2014)
Montana: Hillary vs Christie/Ted Cruz: R +11% (Brian Schweitzer vs Rand Paul: R +8%)
+3% D improvement
(Updated on October 2, 2014)
Nevada: Hillary vs Rand Paul: D +3%
+4% R improvement
(Updated on July 31, 2014)
New Hampshire: Hillary vs Huckabee: D +2.1%
+3.5% R improvement
(Updated on July 17, 2014)
New Jersey: Hillary vs Christie: D +8.4%
+9.4% R improvement
(Updated on October 1, 2014)
New Mexico: Hillary vs Susana Martinez: D +14%
+4% D improvement
(Updated on March 27, 2014)
New York: Hillary vs Christie: D +24.6%
+3.6% R improvement
(Updated on August 21, 2014)
North Carolina: Hillary vs Bush: D +1.6%
+3.6% D improvement
Current Democratic gain
(Updated on September 16, 2014)
Ohio: Hillary vs Christie: D +6.7%
+3.7% D improvement
(Updated on July 31, 2014)
Oregon: Hillary vs Rand Paul/Huckabee: D +12%
Unchanged from 2012
(Updated on May 30, 2014)
Pennsylvania: Hillary vs Christie: D +3.5%
+1.9% R improvement
(Updated on June 5, 2014)
South Carolina: Hillary vs Marco Rubio: R +7%
+3.5% D improvement
(Updated on November 2, 2013)
Texas: Hillary vs Huckabee: R +8%
+8% D improvement
(Updated on April 18, 2014)
Virginia: Hillary vs Christie: D +4.5%
+0.6% D improvement
(Updated on September 25, 2014)
West Virginia: Hillary vs Bush: R +14%
+13% D improvement
(Updated on October 1, 2013)
Wisconsin: Hillary vs Ryan: D +3.7%
+3.2% R improvement
(Updated on September 30, 2014)
Wyoming: Hillary vs Christie: R +28%
+13% D improvement
(Updated on July 23, 2013)
Average all 32 states: Hillary vs Best Republican: D +0.6%
+2.2% D improvement (from Obama 2012) [projecting a 6.1% victory for Hillary]
Giving us this map:
( )
)
Red = Democratic lead/trend
Blue = Republican lead/trend
Green = Tied or no trend
Grey = No polling yet
Green = toss up or less than 0.5% lead
20% shade = 0.6-2% lead
30% shade = 2.1-4% lead
40% shade = 4.1-6% lead
50% shade = 6.1-9% lead
60% shade = 9.1-12% lead
70% shade = 12.1-15% lead
80% shade = 15.1-18% lead
90% shade = Above 18.1% lead
In the count of electoral votes, the current situation looks like this:
Hillary: 268 EVs (in 18 states)
Best/Tailormade Republican: 131 EVs (in 14 states)
Toss-up: None
No polling: 139 EVs (in 18 states + D.C.)
So far, Hillary has captured an impressive 67.2% of all EVs awarded, against only 32.8% EVs for the tailormade Republican.
This is how the Trendline Map looks so far:
()
The states which right now are showing the strongest improvement for the Democratic (Hillary) or the Republican candidate (in 10 out of 32 cases, Christie is that person):
1. Kentucky: D +18.2%
2. California: R +14%
3. Kansas: D +13.6%
4. Arkansas: D +13.4%
5. West Virginia: D +13%
6. Wyoming: D +13%
7. Louisiana: D +12.9%
8. New Jersey: R +9.4%
9. Colorado: R +8.9%
10. Arizona: D +8%
11. Texas: D +8%
12. Connecticut: R +8%
13. Georgia: D +7.3%
14. Maine: R +7%
15. Alaska: D +6.6%
16. Mississippi: D +4.5%
17. Florida: D +4.4%
All of these changes (in the 17 states above) are statistically significant, though there are HUGE question marks concerning California.
The whole list of states having been polled till now, going from Democratic stronghold to Republican stronghold:
New York: D +24.6%
New Mexico: D +14%
Oregon: D +12%
California: D +9%
Connecticut: D +9%
New Jersey: D +8.4%
Maine: D +8%
Michigan: D +6.9%
Ohio: D +6.7%
Currently estimated/projected national average: D +6.1%
Minnesota: D +6%
Florida: D +5.3%
Virginia: D +4.5%
Iowa: D +3.9%
Wisconsin: D +3.7%
Pennsylvania: D +3.5%
Nevada: D +3%
New Hampshire: D +2.1%
North Carolina: D +1.6%
Georgia: R +0.5%
Arizona: R +1%
Colorado: R +3.5%
Louisiana: R +4.3%
Kentucky: R +4.5%
South Carolina: R +7%
Mississippi: R +7%
Alaska: R +7.4%
Texas: R +8%
Kansas: R +8%
Arkansas: R +10.3%
Montana: R +11%
West Virginia: R +14%
Wyoming: R +28%
The best-tailored Republican candidates in all states polled so far:
1. Chris Christie favoured in 10 of 32 states (for 123 EVs)
2. Jeb Bush favoured in 6 states (Florida, Georgia (!), North Carolina, Arizona, Kentucky (!), Kansas & West Virginia - for 90 EVs)
3. Rand Paul favoured in 4 states (California, Oregon (shared), Nevada & Alaska - for 71 EVs)
4. Mike Huckabee favoured in 6 states (Texas (!), Louisiana (!), Oregon (shared), Arkansas, Mississippi & New Hampshire (!) - for 69 EVs)
5. Paul Ryan favoured in 2 states (Wisconsin & Colorado - for 19 EVs)
6. Tim Pawlenty favoured in 1 state (Minnesota - for 10 EVs)
7. Marco Rubio favoured in 1 state (South Carolina - for 9 EVs)
8. Ben Carson favoured in 1 state (Connecticut - for 7 EVs)
9. Susana Martinez favoured in 1 state (New Mexico - for 5 EVs)
10. Ted Cruz favoured in 1 state (Montana (shared) - for 3 EVs)
Current update as of October 7.
The total number of state polls included below has now reached 186.
The 2016 poll averages for each state - 32 states right now - and the change from the actual 2012 outcomes. Only the Republican candidate with the best statewide polling included.
Alaska: Hillary vs Rand Paul: R +7.4%
+6.6% D improvement
(Updated on September 24, 2014)
Arizona: Hillary vs Bush: R +1%
+8% D improvement
(Updated on March 6, 2014)
Arkansas: Hillary vs Mike Huckabee: R +10.3%
+13.4% D improvement
(Updated on September 24, 2014)
California: Hillary vs Rand Paul: D +9%
+14% R improvement
(Updated on August 1, 2014)
Colorado: Hillary vs Paul Ryan: R +3.5%
+8.9% R improvement
Current Republican gain
(Updated on July 29, 2014)
Connecticut: Hillary vs Ben Carson: D +9%
+8% R improvement
(Updated on October 6, 2014)
Florida: Hillary vs Bush: D +5.3%
+4.4% D improvement
(Updated on September 10, 2014)
Georgia: Hillary vs Bush: R +0.5%
+7.3% D improvement
(Updated October 7, 2013)
Iowa: Hillary vs Christie: D +3.9%
+1.9% R improvement
(Updated on October 2, 2014)
Kansas: Hillary vs Bush: R +8%
+13.6% D improvement
(Updated on October 5, 2014)
Kentucky: Hillary vs Bush: R +4.5%
+18.2% D improvement
(Updated on August 13, 2014)
Louisiana: Hillary vs Huckabee: R +4.3%
+12.9% D improvement
(Updated on September 30, 2014)
Maine: Hillary vs Christie: D +8%
+7% R improvement
(Updated on November 13, 2013)
Michigan: Hillary vs Christie: D +6.9%
+2.6% R improvement
(Updated on September 9, 2014)
Minnesota: Hillary vs Tim Pawlenty: D +6%
+2% R improvement
(Updated on June 18, 2014)
Mississippi: Hillary vs Huckabee: R +7%
+4.5% D improvement
(Updated on July 20, 2014)
Montana: Hillary vs Christie/Ted Cruz: R +11% (Brian Schweitzer vs Rand Paul: R +8%)
+3% D improvement
(Updated on October 2, 2014)
Nevada: Hillary vs Rand Paul: D +3%
+4% R improvement
(Updated on July 31, 2014)
New Hampshire: Hillary vs Huckabee: D +2.1%
+3.5% R improvement
(Updated on July 17, 2014)
New Jersey: Hillary vs Christie: D +8.4%
+9.4% R improvement
(Updated on October 1, 2014)
New Mexico: Hillary vs Susana Martinez: D +14%
+4% D improvement
(Updated on March 27, 2014)
New York: Hillary vs Christie: D +24.6%
+3.6% R improvement
(Updated on August 21, 2014)
North Carolina: Hillary vs Bush: D +1.6%
+3.6% D improvement
Current Democratic gain
(Updated on September 16, 2014)
Ohio: Hillary vs Christie: D +6.7%
+3.7% D improvement
(Updated on July 31, 2014)
Oregon: Hillary vs Rand Paul/Huckabee: D +12%
Unchanged from 2012
(Updated on May 30, 2014)
Pennsylvania: Hillary vs Christie: D +3.5%
+1.9% R improvement
(Updated on June 5, 2014)
South Carolina: Hillary vs Marco Rubio: R +7%
+3.5% D improvement
(Updated on November 2, 2013)
Texas: Hillary vs Huckabee: R +8%
+8% D improvement
(Updated on April 18, 2014)
Virginia: Hillary vs Christie: D +4.5%
+0.6% D improvement
(Updated on September 25, 2014)
West Virginia: Hillary vs Bush: R +14%
+13% D improvement
(Updated on October 1, 2013)
Wisconsin: Hillary vs Ryan: D +3.7%
+3.2% R improvement
(Updated on September 30, 2014)
Wyoming: Hillary vs Christie: R +28%
+13% D improvement
(Updated on July 23, 2013)
Average all 32 states: Hillary vs Best Republican: D +0.6%
+2.2% D improvement (from Obama 2012) [projecting a 6.1% victory for Hillary]
Giving us this map:
(
Red = Democratic lead/trend
Blue = Republican lead/trend
Green = Tied or no trend
Grey = No polling yet
Green = toss up or less than 0.5% lead
20% shade = 0.6-2% lead
30% shade = 2.1-4% lead
40% shade = 4.1-6% lead
50% shade = 6.1-9% lead
60% shade = 9.1-12% lead
70% shade = 12.1-15% lead
80% shade = 15.1-18% lead
90% shade = Above 18.1% lead
In the count of electoral votes, the current situation looks like this:
Hillary: 268 EVs (in 18 states)
Best/Tailormade Republican: 131 EVs (in 14 states)
Toss-up: None
No polling: 139 EVs (in 18 states + D.C.)
So far, Hillary has captured an impressive 67.2% of all EVs awarded, against only 32.8% EVs for the tailormade Republican.
This is how the Trendline Map looks so far:
(
The states which right now are showing the strongest improvement for the Democratic (Hillary) or the Republican candidate (in 10 out of 32 cases, Christie is that person):
1. Kentucky: D +18.2%
2. California: R +14%
3. Kansas: D +13.6%
4. Arkansas: D +13.4%
5. West Virginia: D +13%
6. Wyoming: D +13%
7. Louisiana: D +12.9%
8. New Jersey: R +9.4%
9. Colorado: R +8.9%
10. Arizona: D +8%
11. Texas: D +8%
12. Connecticut: R +8%
13. Georgia: D +7.3%
14. Maine: R +7%
15. Alaska: D +6.6%
16. Mississippi: D +4.5%
17. Florida: D +4.4%
All of these changes (in the 17 states above) are statistically significant, though there are HUGE question marks concerning California.
The whole list of states having been polled till now, going from Democratic stronghold to Republican stronghold:
New York: D +24.6%
New Mexico: D +14%
Oregon: D +12%
California: D +9%
Connecticut: D +9%
New Jersey: D +8.4%
Maine: D +8%
Michigan: D +6.9%
Ohio: D +6.7%
Currently estimated/projected national average: D +6.1%
Minnesota: D +6%
Florida: D +5.3%
Virginia: D +4.5%
Iowa: D +3.9%
Wisconsin: D +3.7%
Pennsylvania: D +3.5%
Nevada: D +3%
New Hampshire: D +2.1%
North Carolina: D +1.6%
Georgia: R +0.5%
Arizona: R +1%
Colorado: R +3.5%
Louisiana: R +4.3%
Kentucky: R +4.5%
South Carolina: R +7%
Mississippi: R +7%
Alaska: R +7.4%
Texas: R +8%
Kansas: R +8%
Arkansas: R +10.3%
Montana: R +11%
West Virginia: R +14%
Wyoming: R +28%
The best-tailored Republican candidates in all states polled so far:
1. Chris Christie favoured in 10 of 32 states (for 123 EVs)
2. Jeb Bush favoured in 6 states (Florida, Georgia (!), North Carolina, Arizona, Kentucky (!), Kansas & West Virginia - for 90 EVs)
3. Rand Paul favoured in 4 states (California, Oregon (shared), Nevada & Alaska - for 71 EVs)
4. Mike Huckabee favoured in 6 states (Texas (!), Louisiana (!), Oregon (shared), Arkansas, Mississippi & New Hampshire (!) - for 69 EVs)
5. Paul Ryan favoured in 2 states (Wisconsin & Colorado - for 19 EVs)
6. Tim Pawlenty favoured in 1 state (Minnesota - for 10 EVs)
7. Marco Rubio favoured in 1 state (South Carolina - for 9 EVs)
8. Ben Carson favoured in 1 state (Connecticut - for 7 EVs)
9. Susana Martinez favoured in 1 state (New Mexico - for 5 EVs)
10. Ted Cruz favoured in 1 state (Montana (shared) - for 3 EVs)
Current update as of October 7.
Title: Re: 2016 Official Polling Map Thread
Post by: New_Conservative on October 07, 2014, 02:10:47 PM
I am really not worried about Hilary. These polls are 2 years out and name recognition has a lot to do with her success in the polls. Democrats have to admit that. When was the last time polls were accurate 2 years in advance of a Presidential election?
Polls cannot predict economic meltdowns, military or diplomatic disasters, bungled responses to natural disasters, personal scandals, or cultural changes to the detriment of the current leader.
I am aware of a projection from 2006 that showed Barack Obama losing in a landslide. Of course, the economy had yet to go into a tailspin and the full nastiness of the Iraq war had yet to show. It also did not show shat sort of campaigner Barack Obama would be.
The 2006 poll is a prime example of why not to be so confident. Bush was widely unpopular by 2006, and a Democratic wave built in the midterms that year. Obama was also a not a household name, so he was overlooked in polling. And you already said the things that the polls cannot predict that could wrong from now until then, at least we can agree that. It is still interesting to look at though.
Title: Re: 2016 Official Polling Map Thread
Post by: eric82oslo on October 07, 2014, 02:31:49 PM
Updated today, October 7!
To find out which state would be the most likely tipping point state in 2016 based on all the data gathered so far (from 186 individual polls across 32 states), I've worked out this list of states going from likely Democratic to likely Republican (assuming that the non-polled states stay the same as in 2012):
1. D.C. - 3 EVs (still not polled)
2. Hawaii - 7 EVs (accumulated) (still not polled)
3. Vermont - 10 EVs (still not polled)
4. Rhode Island - 14 EVs (still not polled)
5. Maryland - 24 EVs (still not polled)
6. New York - 53 EVs
7. Massachusetts - 64 EVs (still not polled)
8. Delaware - 67 EVs (still not polled)
9. Illinois - 87 EVs (still not polled)
10. Washington - 99 EVs (still not polled)
11. New Mexico - 104 EVs
12. Oregon - 111 EVs
13. California - 166 EVs
14. Connecticut - 173 EVs
15. New Jersey - 187 EVs
16. Maine - 191 EVs
17. Michigan - 207 EVs
18. Ohio - 225 EVs
19. Minnesota - 235 EVs
20. Florida - 264 EVs
21. Virginia - 277 EVs - currently the most likely tipping point state
22. Iowa - 283 EVs
23. Wisconsin - 293 EVs
24. Pennsylvania - 313 EVs
25. Nevada - 319 EVs
26. New Hampshire - 323 EVs
27. North Carolina - 338 EVs
---current red/blue divide---
28. Georgia - 354 EVs
29. Arizona - 365 EVs
30. Colorado - 374 EVs
31. Louisiana - 382 EVs
32. Kentucky - 390 EVs
33. South Carolina - 399 EVs
34. Mississippi - 405 EVs
35. Alaska - 408 EVs
36. Texas - 446 EVs
37. Kansas - 452 EVs
38. Missouri - 462 EVs (still not polled)
39. Indiana - 473 EVs (still not polled)
40. Arkansas - 479 EVs
41. Montana - 482 EVs
42. West Virginia - 487 EVs
43. South Dakota - 490 EVs (still not polled)
44. North Dakota - 493 EVs (still not polled)
45. Tennessee - 504 EVs (still not polled)
46. Nebraska - 509 EVs (still not polled)
47. Alabama - 518 EVs (still not polled)
48. Wyoming - 521 EVs
49. Idaho - 525 EVs (still not polled)
50. Oklahoma - 532 EVs (still not polled)
51. Utah - 538 EVs (still not polled)
Only minor changes since last update two months ago, despite having added about 30 more polls, however we've gotten a new tipping point state! It is now Virginia which tips the election to Hillary and the Democrats, while it was Wisconsin back in August. No new states have been added since August (and none will probably be added until next month either, the earliest). Wisconsin, Florida and Pennsylvania all remain crucial battlegrounds though, competiting for that ultimate tipping point status.
This actually means that she could theoretically win the popular vote by up to 1.6%, yet still lose the Electoral College to a hypothetically tailor-made Republican opponent, that fairytale, fantasy creature. If this holds true until election day, she would actually reverse a trend and precedent set by Obama, where the Democratic ticket has a structural advantage in presidential elections.
Washington, Illinois, Delaware, Missouri, Indiana and Massachusetts would be very interesting to have polled next.
Title: Re: 2016 Official Polling Map Thread
Post by: pbrower2a on October 07, 2014, 07:47:38 PM
Georgia, PPP:
Vs Jeb Bush: 44-45 (R +1%)
Vs Rand Paul: 47-44 (D +3%)
Vs Mike Huckabee: 48-45 (D +3%)
Vs Herman Cain: 48-45 (D +3%)
Vs Chris Christie: 46-41 (D +5%)
Vs Ted Cruz: 47-41 (D +6%)
Vs Newt Gingrich: 49-43 (D +6%)
More details here: http://www.publicpolicypolling.com/main/2014/10/republicans-lead-in-georgia-but-senate-race-close.html#more
Hillary Clinton vs. Jeb Bush
(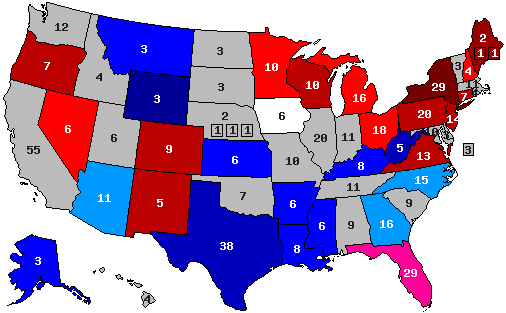 )
)
Hillary Clinton vs. Chris Christie
(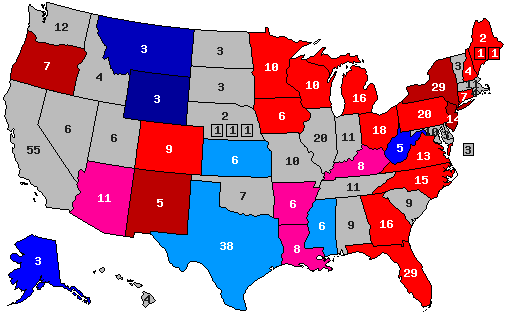 )
)
Hillary Clinton vs. Mike Huckabee
(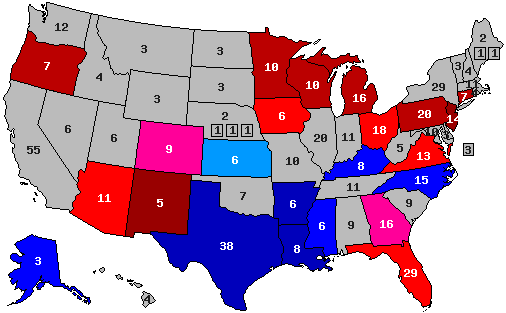 )
)
Hillary Clinton vs. Rand Paul
()
blue, Republican -- red, Democratic
30% -- lead with 40-49% but a margin of 3% or less
40% -- lead with 40-49% but a margin of 4% or more
60% -- lead with 50-54%
70% -- lead with 55-59%
90% -- lead with 60% or more
Vs Jeb Bush: 44-45 (R +1%)
Vs Rand Paul: 47-44 (D +3%)
Vs Mike Huckabee: 48-45 (D +3%)
Vs Herman Cain: 48-45 (D +3%)
Vs Chris Christie: 46-41 (D +5%)
Vs Ted Cruz: 47-41 (D +6%)
Vs Newt Gingrich: 49-43 (D +6%)
More details here: http://www.publicpolicypolling.com/main/2014/10/republicans-lead-in-georgia-but-senate-race-close.html#more
Hillary Clinton vs. Jeb Bush
(
Hillary Clinton vs. Chris Christie
(
Hillary Clinton vs. Mike Huckabee
(
Hillary Clinton vs. Rand Paul
(
blue, Republican -- red, Democratic
30% -- lead with 40-49% but a margin of 3% or less
40% -- lead with 40-49% but a margin of 4% or more
60% -- lead with 50-54%
70% -- lead with 55-59%
90% -- lead with 60% or more
Title: Re: 2016 Official Polling Map Thread
Post by: eric82oslo on October 08, 2014, 03:55:47 PM
PPP will be polling Kansas and Idaho (! for the very first time ever in fact) this weekend. :)
I hope they'll poll South Dakota soon as well.
I hope they'll poll South Dakota soon as well.
Title: Re: 2016 Official Polling Map Thread
Post by: IceSpear on October 08, 2014, 04:23:38 PM
PPP will be polling Kansas and Idaho (! for the very first time ever in fact) this weekend. :)
I hope they'll poll South Dakota soon as well.
I hope they'll poll South Dakota soon as well.
Idaho? ??? Seems like an odd choice when there's less than a month before a major election.
Title: Re: 2016 Official Polling Map Thread
Post by: David Tonight on October 08, 2014, 06:16:33 PM
When the new president gets elected in 2016 what will Obama's next job be? Not that it's too early to ask. ;)
Title: Re: 2016 Official Polling Map Thread
Post by: pbrower2a on October 09, 2014, 03:59:01 PM
When the new president gets elected in 2016 what will Obama's next job be? Not that it's too early to ask. ;)
For Republicans, the safest place for him as an ex-President (short of a grave) will be a seat on the US Supreme Court. Otherwise he is "President Emeritus", wielding political influence for a couple of decades so long as he is healthy. Even with his warts, Richard Nixon did that. He won't be a veritable recluse as Dubya has been, appearing in public only at games of the Texas Rangers with Nolan Ryan at his side.
Title: Re: 2016 Official Polling Map Thread
Post by: eric82oslo on October 12, 2014, 10:29:50 AM
Selzer has polled the 2016 race in Iowa for the first time, and it's also the first poll there to include Mitt Romney, who is shown leading Hillary by a point. Thus he has become the new king of the Iowa hill. Rand Paul improves there as well, while everyone else struggles against Hillary. It's the 16th Iowa poll from any pollster. New averages:
Mitt Romney: R +1% (1 poll)
Chris Christie: D +4.0% (14 polls, up 0.1% for Hillary)
Bobby Jindal: D +4.7% (1 poll)
Paul Ryan: D +5.3% (7 polls, down 0.7% for Hillary)
Rand Paul: D +5.5% (14 polls, down 0.2% for Hillary)
Jeb Bush: D +6.5% (12 polls, up 0.1% for Hillary)
Marco Rubio: D +7.5% (7 polls, up 0.1% for Hillary)
Scott Walker: D +8.5% (3 polls)
Ted Cruz: D +9.6% (6 polls, up 0.1% for Hillary)
Mike Pence: D +11.8% (1 poll)
This means that Romney is now the new leader in Iowa, dethroning Christie from that position.
Title: Re: 2016 Official Polling Map Thread
Post by: eric82oslo on October 12, 2014, 10:31:24 AM
The 16th 2016 poll was just released from Iowa (see my previous post), worsening Hillary's score there by 1% as Romney takes over the lead in the state from Paul Ryan.
The total number of state polls included below has now reached 187.
The 2016 poll averages for each state - 32 states right now - and the change from the actual 2012 outcomes. Only the Republican candidate with the best statewide polling included.
Alaska: Hillary vs Rand Paul: R +7.4%
+6.6% D improvement
(Updated on September 24, 2014)
Arizona: Hillary vs Bush: R +1%
+8% D improvement
(Updated on March 6, 2014)
Arkansas: Hillary vs Mike Huckabee: R +10.3%
+13.4% D improvement
(Updated on September 24, 2014)
California: Hillary vs Rand Paul: D +9%
+14% R improvement
(Updated on August 1, 2014)
Colorado: Hillary vs Paul Ryan: R +3.5%
+8.9% R improvement
Current Republican gain
(Updated on July 29, 2014)
Connecticut: Hillary vs Ben Carson: D +9%
+8% R improvement
(Updated on October 6, 2014)
Florida: Hillary vs Bush: D +5.3%
+4.4% D improvement
(Updated on September 10, 2014)
Georgia: Hillary vs Bush: R +0.5%
+7.3% D improvement
(Updated October 7, 2013)
Iowa: Hillary vs Mitt Romney: R +1%
+6.8% R improvement
Current Republican gain
(Updated on October 12, 2014)
Kansas: Hillary vs Bush: R +8%
+13.6% D improvement
(Updated on October 5, 2014)
Kentucky: Hillary vs Bush: R +4.5%
+18.2% D improvement
(Updated on August 13, 2014)
Louisiana: Hillary vs Huckabee: R +4.3%
+12.9% D improvement
(Updated on September 30, 2014)
Maine: Hillary vs Christie: D +8%
+7% R improvement
(Updated on November 13, 2013)
Michigan: Hillary vs Christie: D +6.9%
+2.6% R improvement
(Updated on September 9, 2014)
Minnesota: Hillary vs Tim Pawlenty: D +6%
+2% R improvement
(Updated on June 18, 2014)
Mississippi: Hillary vs Huckabee: R +7%
+4.5% D improvement
(Updated on July 20, 2014)
Montana: Hillary vs Christie/Ted Cruz: R +11% (Brian Schweitzer vs Rand Paul: R +8%)
+3% D improvement
(Updated on October 2, 2014)
Nevada: Hillary vs Rand Paul: D +3%
+4% R improvement
(Updated on July 31, 2014)
New Hampshire: Hillary vs Huckabee: D +2.1%
+3.5% R improvement
(Updated on July 17, 2014)
New Jersey: Hillary vs Christie: D +8.4%
+9.4% R improvement
(Updated on October 1, 2014)
New Mexico: Hillary vs Susana Martinez: D +14%
+4% D improvement
(Updated on March 27, 2014)
New York: Hillary vs Christie: D +24.6%
+3.6% R improvement
(Updated on August 21, 2014)
North Carolina: Hillary vs Bush: D +1.6%
+3.6% D improvement
Current Democratic gain
(Updated on September 16, 2014)
Ohio: Hillary vs Christie: D +6.7%
+3.7% D improvement
(Updated on July 31, 2014)
Oregon: Hillary vs Rand Paul/Huckabee: D +12%
Unchanged from 2012
(Updated on May 30, 2014)
Pennsylvania: Hillary vs Christie: D +3.5%
+1.9% R improvement
(Updated on June 5, 2014)
South Carolina: Hillary vs Marco Rubio: R +7%
+3.5% D improvement
(Updated on November 2, 2013)
Texas: Hillary vs Huckabee: R +8%
+8% D improvement
(Updated on April 18, 2014)
Virginia: Hillary vs Christie: D +4.5%
+0.6% D improvement
(Updated on September 25, 2014)
West Virginia: Hillary vs Bush: R +14%
+13% D improvement
(Updated on October 1, 2013)
Wisconsin: Hillary vs Ryan: D +3.7%
+3.2% R improvement
(Updated on September 30, 2014)
Wyoming: Hillary vs Christie: R +28%
+13% D improvement
(Updated on July 23, 2013)
Average all 32 states: Hillary vs Best Republican: D +0.4%
+2.1% D improvement (from Obama 2012) [projecting a 5.9% victory for Hillary]
Giving us this map:
( )
)
Red = Democratic lead/trend
Blue = Republican lead/trend
Green = Tied or no trend
Grey = No polling yet
Green = toss up or less than 0.5% lead
20% shade = 0.6-2% lead
30% shade = 2.1-4% lead
40% shade = 4.1-6% lead
50% shade = 6.1-9% lead
60% shade = 9.1-12% lead
70% shade = 12.1-15% lead
80% shade = 15.1-18% lead
90% shade = Above 18.1% lead
In the count of electoral votes, the current situation looks like this:
Hillary: 262 EVs (in 17 states)
Best/Tailormade Republican: 137 EVs (in 15 states)
Toss-up: None
No polling: 139 EVs (in 18 states + D.C.)
So far, Hillary has captured an impressive 65.7% of all EVs awarded, against only 34.3% EVs for the tailormade Republican.
This is how the Trendline Map looks so far:
( )
)
The states which right now are showing the strongest improvement for the Democratic (Hillary) or the Republican candidate (in 9 out of 32 cases, Christie is that person):
1. Kentucky: D +18.2%
2. California: R +14%
3. Kansas: D +13.6%
4. Arkansas: D +13.4%
5. West Virginia: D +13%
6. Wyoming: D +13%
7. Louisiana: D +12.9%
8. New Jersey: R +9.4%
9. Colorado: R +8.9%
10. Arizona: D +8%
11. Texas: D +8%
12. Connecticut: R +8%
13. Georgia: D +7.3%
14. Maine: R +7%
15. Iowa: R +6.8%
16. Alaska: D +6.6%
17. Mississippi: D +4.5%
18. Florida: D +4.4%
All of these changes (in the 18 states above) are statistically significant, though there are HUGE question marks concerning California.
The whole list of states having been polled till now, going from Democratic stronghold to Republican stronghold:
New York: D +24.6%
New Mexico: D +14%
Oregon: D +12%
California: D +9%
Connecticut: D +9%
New Jersey: D +8.4%
Maine: D +8%
Michigan: D +6.9%
Ohio: D +6.7%
Minnesota: D +6%
Currently estimated/projected national average: D +5.9%
Florida: D +5.3%
Virginia: D +4.5%
Wisconsin: D +3.7%
Pennsylvania: D +3.5%
Nevada: D +3%
New Hampshire: D +2.1%
North Carolina: D +1.6%
Georgia: R +0.5%
Iowa: R +1%
Arizona: R +1%
Colorado: R +3.5%
Louisiana: R +4.3%
Kentucky: R +4.5%
South Carolina: R +7%
Mississippi: R +7%
Alaska: R +7.4%
Texas: R +8%
Kansas: R +8%
Arkansas: R +10.3%
Montana: R +11%
West Virginia: R +14%
Wyoming: R +28%
The best-tailored Republican candidates in all states polled so far:
1. Chris Christie favored in 9 of 32 states (for 117 EVs)
2. Jeb Bush favored in 6 states (Florida, Georgia (!), North Carolina, Arizona, Kentucky (!), Kansas & West Virginia - for 90 EVs)
3. Rand Paul favored in 4 states (California, Oregon (shared), Nevada & Alaska - for 71 EVs)
4. Mike Huckabee favored in 6 states (Texas (!), Louisiana (!), Oregon (shared), Arkansas, Mississippi & New Hampshire (!) - for 69 EVs)
5. Paul Ryan favored in 2 states (Wisconsin & Colorado - for 19 EVs)
6. Tim Pawlenty favored in 1 state (Minnesota - for 10 EVs)
7. Marco Rubio favored in 1 state (South Carolina - for 9 EVs)
8. Ben Carson favored in 1 state (Connecticut - for 7 EVs)
9. Mitt Romney favored in 1 state (Iowa (!) - for 6 EVs)
10. Susana Martinez favored in 1 state (New Mexico - for 5 EVs)
11. Ted Cruz favoured in 1 state (Montana (shared) - for 3 EVs)
Current update as of October 12.
The total number of state polls included below has now reached 187.
The 2016 poll averages for each state - 32 states right now - and the change from the actual 2012 outcomes. Only the Republican candidate with the best statewide polling included.
Alaska: Hillary vs Rand Paul: R +7.4%
+6.6% D improvement
(Updated on September 24, 2014)
Arizona: Hillary vs Bush: R +1%
+8% D improvement
(Updated on March 6, 2014)
Arkansas: Hillary vs Mike Huckabee: R +10.3%
+13.4% D improvement
(Updated on September 24, 2014)
California: Hillary vs Rand Paul: D +9%
+14% R improvement
(Updated on August 1, 2014)
Colorado: Hillary vs Paul Ryan: R +3.5%
+8.9% R improvement
Current Republican gain
(Updated on July 29, 2014)
Connecticut: Hillary vs Ben Carson: D +9%
+8% R improvement
(Updated on October 6, 2014)
Florida: Hillary vs Bush: D +5.3%
+4.4% D improvement
(Updated on September 10, 2014)
Georgia: Hillary vs Bush: R +0.5%
+7.3% D improvement
(Updated October 7, 2013)
Iowa: Hillary vs Mitt Romney: R +1%
+6.8% R improvement
Current Republican gain
(Updated on October 12, 2014)
Kansas: Hillary vs Bush: R +8%
+13.6% D improvement
(Updated on October 5, 2014)
Kentucky: Hillary vs Bush: R +4.5%
+18.2% D improvement
(Updated on August 13, 2014)
Louisiana: Hillary vs Huckabee: R +4.3%
+12.9% D improvement
(Updated on September 30, 2014)
Maine: Hillary vs Christie: D +8%
+7% R improvement
(Updated on November 13, 2013)
Michigan: Hillary vs Christie: D +6.9%
+2.6% R improvement
(Updated on September 9, 2014)
Minnesota: Hillary vs Tim Pawlenty: D +6%
+2% R improvement
(Updated on June 18, 2014)
Mississippi: Hillary vs Huckabee: R +7%
+4.5% D improvement
(Updated on July 20, 2014)
Montana: Hillary vs Christie/Ted Cruz: R +11% (Brian Schweitzer vs Rand Paul: R +8%)
+3% D improvement
(Updated on October 2, 2014)
Nevada: Hillary vs Rand Paul: D +3%
+4% R improvement
(Updated on July 31, 2014)
New Hampshire: Hillary vs Huckabee: D +2.1%
+3.5% R improvement
(Updated on July 17, 2014)
New Jersey: Hillary vs Christie: D +8.4%
+9.4% R improvement
(Updated on October 1, 2014)
New Mexico: Hillary vs Susana Martinez: D +14%
+4% D improvement
(Updated on March 27, 2014)
New York: Hillary vs Christie: D +24.6%
+3.6% R improvement
(Updated on August 21, 2014)
North Carolina: Hillary vs Bush: D +1.6%
+3.6% D improvement
Current Democratic gain
(Updated on September 16, 2014)
Ohio: Hillary vs Christie: D +6.7%
+3.7% D improvement
(Updated on July 31, 2014)
Oregon: Hillary vs Rand Paul/Huckabee: D +12%
Unchanged from 2012
(Updated on May 30, 2014)
Pennsylvania: Hillary vs Christie: D +3.5%
+1.9% R improvement
(Updated on June 5, 2014)
South Carolina: Hillary vs Marco Rubio: R +7%
+3.5% D improvement
(Updated on November 2, 2013)
Texas: Hillary vs Huckabee: R +8%
+8% D improvement
(Updated on April 18, 2014)
Virginia: Hillary vs Christie: D +4.5%
+0.6% D improvement
(Updated on September 25, 2014)
West Virginia: Hillary vs Bush: R +14%
+13% D improvement
(Updated on October 1, 2013)
Wisconsin: Hillary vs Ryan: D +3.7%
+3.2% R improvement
(Updated on September 30, 2014)
Wyoming: Hillary vs Christie: R +28%
+13% D improvement
(Updated on July 23, 2013)
Average all 32 states: Hillary vs Best Republican: D +0.4%
+2.1% D improvement (from Obama 2012) [projecting a 5.9% victory for Hillary]
Giving us this map:
(
Red = Democratic lead/trend
Blue = Republican lead/trend
Green = Tied or no trend
Grey = No polling yet
Green = toss up or less than 0.5% lead
20% shade = 0.6-2% lead
30% shade = 2.1-4% lead
40% shade = 4.1-6% lead
50% shade = 6.1-9% lead
60% shade = 9.1-12% lead
70% shade = 12.1-15% lead
80% shade = 15.1-18% lead
90% shade = Above 18.1% lead
In the count of electoral votes, the current situation looks like this:
Hillary: 262 EVs (in 17 states)
Best/Tailormade Republican: 137 EVs (in 15 states)
Toss-up: None
No polling: 139 EVs (in 18 states + D.C.)
So far, Hillary has captured an impressive 65.7% of all EVs awarded, against only 34.3% EVs for the tailormade Republican.
This is how the Trendline Map looks so far:
(
The states which right now are showing the strongest improvement for the Democratic (Hillary) or the Republican candidate (in 9 out of 32 cases, Christie is that person):
1. Kentucky: D +18.2%
2. California: R +14%
3. Kansas: D +13.6%
4. Arkansas: D +13.4%
5. West Virginia: D +13%
6. Wyoming: D +13%
7. Louisiana: D +12.9%
8. New Jersey: R +9.4%
9. Colorado: R +8.9%
10. Arizona: D +8%
11. Texas: D +8%
12. Connecticut: R +8%
13. Georgia: D +7.3%
14. Maine: R +7%
15. Iowa: R +6.8%
16. Alaska: D +6.6%
17. Mississippi: D +4.5%
18. Florida: D +4.4%
All of these changes (in the 18 states above) are statistically significant, though there are HUGE question marks concerning California.
The whole list of states having been polled till now, going from Democratic stronghold to Republican stronghold:
New York: D +24.6%
New Mexico: D +14%
Oregon: D +12%
California: D +9%
Connecticut: D +9%
New Jersey: D +8.4%
Maine: D +8%
Michigan: D +6.9%
Ohio: D +6.7%
Minnesota: D +6%
Currently estimated/projected national average: D +5.9%
Florida: D +5.3%
Virginia: D +4.5%
Wisconsin: D +3.7%
Pennsylvania: D +3.5%
Nevada: D +3%
New Hampshire: D +2.1%
North Carolina: D +1.6%
Georgia: R +0.5%
Iowa: R +1%
Arizona: R +1%
Colorado: R +3.5%
Louisiana: R +4.3%
Kentucky: R +4.5%
South Carolina: R +7%
Mississippi: R +7%
Alaska: R +7.4%
Texas: R +8%
Kansas: R +8%
Arkansas: R +10.3%
Montana: R +11%
West Virginia: R +14%
Wyoming: R +28%
The best-tailored Republican candidates in all states polled so far:
1. Chris Christie favored in 9 of 32 states (for 117 EVs)
2. Jeb Bush favored in 6 states (Florida, Georgia (!), North Carolina, Arizona, Kentucky (!), Kansas & West Virginia - for 90 EVs)
3. Rand Paul favored in 4 states (California, Oregon (shared), Nevada & Alaska - for 71 EVs)
4. Mike Huckabee favored in 6 states (Texas (!), Louisiana (!), Oregon (shared), Arkansas, Mississippi & New Hampshire (!) - for 69 EVs)
5. Paul Ryan favored in 2 states (Wisconsin & Colorado - for 19 EVs)
6. Tim Pawlenty favored in 1 state (Minnesota - for 10 EVs)
7. Marco Rubio favored in 1 state (South Carolina - for 9 EVs)
8. Ben Carson favored in 1 state (Connecticut - for 7 EVs)
9. Mitt Romney favored in 1 state (Iowa (!) - for 6 EVs)
10. Susana Martinez favored in 1 state (New Mexico - for 5 EVs)
11. Ted Cruz favoured in 1 state (Montana (shared) - for 3 EVs)
Current update as of October 12.
Title: Re: 2016 Official Polling Map Thread
Post by: pbrower2a on October 13, 2014, 10:07:20 AM
Iowa, Des Moines Register/Selzer
http://www.bloomberg.com/politics/articles/2014-10-11/bloombergdes-moines-register-iowa-poll-republicans-within-striking-distance-of-hillary-clinton
(against) Ryan 44/43, Paul 44/41, Jeb 46/39, Rubio 46/37, Christie 46/38, Cruz 45/35.
Huckabee not mentioned.
Hillary Clinton vs. Jeb Bush
( )
)
Hillary Clinton vs. Chris Christie
()
Hillary Clinton vs. Mike Huckabee
()
Hillary Clinton vs. Rand Paul
( )
)
blue, Republican -- red, Democratic
30% -- lead with 40-49% but a margin of 3% or less
40% -- lead with 40-49% but a margin of 4% or more
60% -- lead with 50-54%
70% -- lead with 55-59%
90% -- lead with 60% or more
http://www.bloomberg.com/politics/articles/2014-10-11/bloombergdes-moines-register-iowa-poll-republicans-within-striking-distance-of-hillary-clinton
(against) Ryan 44/43, Paul 44/41, Jeb 46/39, Rubio 46/37, Christie 46/38, Cruz 45/35.
Huckabee not mentioned.
Hillary Clinton vs. Jeb Bush
(
Hillary Clinton vs. Chris Christie
(
Hillary Clinton vs. Mike Huckabee
(
Hillary Clinton vs. Rand Paul
(
blue, Republican -- red, Democratic
30% -- lead with 40-49% but a margin of 3% or less
40% -- lead with 40-49% but a margin of 4% or more
60% -- lead with 50-54%
70% -- lead with 55-59%
90% -- lead with 60% or more
Title: Re: 2016 Official Polling Map Thread
Post by: pbrower2a on October 13, 2014, 10:14:10 AM
Here's my projection of the 2016 election based upon what I see in Hillary Clinton against the main four potential nominees in current polls. I pay no attention to Ted Cruz, Mario Rubio, or Scott Walker, as they lose by ludicrous margins in all but sure-R states.
Georgia is potential big trouble for the GOP in 2016, and although it is in the same category it looks far worse for Republicans as a whole. Connecticut now has polls for more than one choice, and what I suspect to be so there looks realized.
Add the latest Iowa poll.
(
Legitimate swing states:
white -- mixed results or any tie
pink -- D lead in all 4 current polls, but swing states in 2008 and 2012
pale blue -- R lead in all current polls, all but one of them under 4%
Fringe swing states:
medium red -- D lead by at least 4% (but under 50%) in all but at most one poll but not swing states in 2008 or 2012
medium blue -- R lead by at least 4% (but under 50%) in all but at most one poll but not swing states in 2008 or 2012
Non-swing states
dark red -- D lead with at least 50% in at least two polls
dark blue -- R lead with at least 50% in at least two polls
Gray -- no polling
Now, based on how states did in 2008 and 2012 and how analogous states do, I fill in the rest:
(
Legitimate swing states:
white -- mixed results or any tie 60
pink -- D lead in all 4 current polls, but swing states in 2008 and 2012, or a split 81
pale blue -- R lead in all current polls, all but one of them under 4% 14
Fringe swing states:
medium red -- D lead by at least 4% (but under 50%) in all but at most one poll but not swing states in 2008 or 2012 50
medium blue -- R lead by at least 4% (but under 50%) in all but at most one poll but not swing states in 2008 or 2012 76
Non-swing states
dark red -- D lead with at least 50% in at least two polls 199
dark blue -- R lead with at least 50% in at least two polls 32
Gray -- I have no idea (no suitable analogues) 12
I see America much less polarized now than it was in 2008 or 2012.
Title: Re: 2016 Official Polling Map Thread
Post by: pbrower2a on October 13, 2014, 10:21:15 AM
Florida. University poll.
http://polls.saintleo.edu/hillary-clinton-continues-to-maintain-lead-in-2016-field/
Clinton 49
Christie 34
Clinton 53
Bush 33
Clinton 53
Rubio 30
Clinton 54
Paul 30
Clinton 54
Cruz 27
....This suggests the strongest electoral performance by any Democratic nominee in Florida since the 1940s.
Hillary Clinton vs. Jeb Bush
( )
)
Hillary Clinton vs. Chris Christie
()
Hillary Clinton vs. Mike Huckabee
()
Hillary Clinton vs. Rand Paul
( )
)
blue, Republican -- red, Democratic
30% -- lead with 40-49% but a margin of 3% or less
40% -- lead with 40-49% but a margin of 4% or more
60% -- lead with 50-54%
70% -- lead with 55-59%
90% -- lead with 60% or more
http://polls.saintleo.edu/hillary-clinton-continues-to-maintain-lead-in-2016-field/
Clinton 49
Christie 34
Clinton 53
Bush 33
Clinton 53
Rubio 30
Clinton 54
Paul 30
Clinton 54
Cruz 27
....This suggests the strongest electoral performance by any Democratic nominee in Florida since the 1940s.
Hillary Clinton vs. Jeb Bush
(
Hillary Clinton vs. Chris Christie
(
Hillary Clinton vs. Mike Huckabee
(
Hillary Clinton vs. Rand Paul
(
blue, Republican -- red, Democratic
30% -- lead with 40-49% but a margin of 3% or less
40% -- lead with 40-49% but a margin of 4% or more
60% -- lead with 50-54%
70% -- lead with 55-59%
90% -- lead with 60% or more
Title: Re: 2016 Official Polling Map Thread
Post by: eric82oslo on October 13, 2014, 03:46:26 PM
With Saint Leo University's second 2016 poll of Florida, which also happens to be the 20th poll of the state from any pollster, here are the new averages in match ups including Hillary Clinton:
Vs Jeb Bush: D +6.3% (15 polls, Hillary up 1%!)
Vs Mitt Romney: D +7% (1 poll)
Vs Rick Perry: D +10% (1 poll)
Vs Marco Rubio: D +10.5% (16 polls, Hillary up 0.8%)
Vs Paul Ryan: D +11.2% (6 polls)
Vs Mike Huckabee: D +11.3% (3 polls)
Vs Chris Christie: D +12.0% (9 polls, Hillary up 0.4%)
Vs Rand Paul: D +12.5% (10 polls, Hillary up 1.3%!)
Vs Ted Cruz: D +18.7% (7 polls, Hillary up 1.4%!)
Even with this Hillary boomblaster of a poll added to the database, Jeb Bush continues to rule mightily over his kingdom of talentless knights. Even a poll that show him 20% down on Hillary, can't take away all of his glory in this beloved state of his.
We also got the 6th Kansas poll on 2016 today, which was also the 5th one from PPP alone. New Clinton averages here:
Vs Jeb Bush: R +8.6% (5 polls, Hillary down 0.6%)
Vs Paul Ryan: R +7% (1 poll)
Vs Rand Paul: R +5.6% (5 polls, Hillary up 0.15%)
Vs Mike Huckabee: R +5.25% (4 polls, Hillary down 0.25%)
Vs Marco Rubio: R +5% (1 poll)
Vs Chris Christie: R +4.25% (4 polls, unchanged)
Vs Ted Cruz: R +0.33% (3 polls, Hillary down 1.33%)
So to sum it up, Jeb Bush still has a sizable lead over his competitors in Kansas, just like this latest PPP poll strongly suggested.
Title: Re: 2016 Official Polling Map Thread
Post by: eric82oslo on October 13, 2014, 03:54:59 PM
As Saint Leo University, that Catholic institution which happens to be the oldest university in the state of eternal summer, released yet another Florida poll with truely stunning numbers for Clinton, the number of Florida polls entering the database has now reached 20.
Finally, we got the 6th 2016 poll till date from Kansas. It showed improving numbers for Jeb Bush. See previous post for more details on both polls.
The total number of state polls included below has now reached 189.
The 2016 poll averages for each state - 32 states right now - and the change from the actual 2012 outcomes. Only the Republican candidate with the best statewide polling included.
Alaska: Hillary vs Rand Paul: R +7.4%
+6.6% D improvement
(Updated on September 24, 2014)
Arizona: Hillary vs Bush: R +1%
+8% D improvement
(Updated on March 6, 2014)
Arkansas: Hillary vs Mike Huckabee: R +10.3%
+13.4% D improvement
(Updated on September 24, 2014)
California: Hillary vs Rand Paul: D +9%
+14% R improvement
(Updated on August 1, 2014)
Colorado: Hillary vs Paul Ryan: R +3.5%
+8.9% R improvement
Current Republican gain
(Updated on July 29, 2014)
Connecticut: Hillary vs Ben Carson: D +9%
+8% R improvement
(Updated on October 6, 2014)
Florida: Hillary vs Bush: D +6.3%
+5.4% D improvement
(Updated on October 13, 2014)
Georgia: Hillary vs Bush: R +0.5%
+7.3% D improvement
(Updated October 7, 2013)
Iowa: Hillary vs Mitt Romney: R +1%
+6.8% R improvement
Current Republican gain
(Updated on October 12, 2014)
Kansas: Hillary vs Bush: R +8.6%
+13.0% D improvement
(Updated on October 13, 2014)
Kentucky: Hillary vs Bush: R +4.5%
+18.2% D improvement
(Updated on August 13, 2014)
Louisiana: Hillary vs Huckabee: R +4.3%
+12.9% D improvement
(Updated on September 30, 2014)
Maine: Hillary vs Christie: D +8%
+7% R improvement
(Updated on November 13, 2013)
Michigan: Hillary vs Christie: D +6.9%
+2.6% R improvement
(Updated on September 9, 2014)
Minnesota: Hillary vs Tim Pawlenty: D +6%
+2% R improvement
(Updated on June 18, 2014)
Mississippi: Hillary vs Huckabee: R +7%
+4.5% D improvement
(Updated on July 20, 2014)
Montana: Hillary vs Christie/Ted Cruz: R +11% (Brian Schweitzer vs Rand Paul: R +8%)
+3% D improvement
(Updated on October 2, 2014)
Nevada: Hillary vs Rand Paul: D +3%
+4% R improvement
(Updated on July 31, 2014)
New Hampshire: Hillary vs Huckabee: D +2.1%
+3.5% R improvement
(Updated on July 17, 2014)
New Jersey: Hillary vs Christie: D +8.4%
+9.4% R improvement
(Updated on October 1, 2014)
New Mexico: Hillary vs Susana Martinez: D +14%
+4% D improvement
(Updated on March 27, 2014)
New York: Hillary vs Christie: D +24.6%
+3.6% R improvement
(Updated on August 21, 2014)
North Carolina: Hillary vs Bush: D +1.6%
+3.6% D improvement
Current Democratic gain
(Updated on September 16, 2014)
Ohio: Hillary vs Christie: D +6.7%
+3.7% D improvement
(Updated on July 31, 2014)
Oregon: Hillary vs Rand Paul/Huckabee: D +12%
Unchanged from 2012
(Updated on May 30, 2014)
Pennsylvania: Hillary vs Christie: D +3.5%
+1.9% R improvement
(Updated on June 5, 2014)
South Carolina: Hillary vs Marco Rubio: R +7%
+3.5% D improvement
(Updated on November 2, 2013)
Texas: Hillary vs Huckabee: R +8%
+8% D improvement
(Updated on April 18, 2014)
Virginia: Hillary vs Christie: D +4.5%
+0.6% D improvement
(Updated on September 25, 2014)
West Virginia: Hillary vs Bush: R +14%
+13% D improvement
(Updated on October 1, 2013)
Wisconsin: Hillary vs Ryan: D +3.7%
+3.2% R improvement
(Updated on September 30, 2014)
Wyoming: Hillary vs Christie: R +28%
+13% D improvement
(Updated on July 23, 2013)
Average all 32 states: Hillary vs Best Republican: D +0.4%
+2.1% D improvement (from Obama 2012) [projecting a 5.95% victory for Hillary]
Giving us this map:
( )
)
Red = Democratic lead/trend
Blue = Republican lead/trend
Green = Tied or no trend
Grey = No polling yet
Green = toss up or less than 0.5% lead
20% shade = 0.6-2% lead
30% shade = 2.1-4% lead
40% shade = 4.1-6% lead
50% shade = 6.1-9% lead
60% shade = 9.1-12% lead
70% shade = 12.1-15% lead
80% shade = 15.1-18% lead
90% shade = Above 18.1% lead
In the count of electoral votes, the current situation looks like this:
Hillary: 262 EVs (in 17 states)
Best/Tailormade Republican: 137 EVs (in 15 states)
Toss-up: None
No polling: 139 EVs (in 18 states + D.C.)
So far, Hillary has captured an impressive 65.7% of all EVs awarded, against only 34.3% EVs for the tailormade Republican.
This is how the Trendline Map looks so far:
()
The states which right now are showing the strongest improvement for the Democratic (Hillary) or the Republican candidate (in 9 out of 32 cases, Christie is that person):
1. Kentucky: D +18.2%
2. California: R +14%
3. Arkansas: D +13.4%
4. Kansas: D +13.0%
5. West Virginia: D +13%
6. Wyoming: D +13%
7. Louisiana: D +12.9%
8. New Jersey: R +9.4%
9. Colorado: R +8.9%
10. Arizona: D +8%
11. Texas: D +8%
12. Connecticut: R +8%
13. Georgia: D +7.3%
14. Maine: R +7%
15. Iowa: R +6.8%
16. Alaska: D +6.6%
17. Florida: D +5.4%
18. Mississippi: D +4.5%
All of these changes (in the 18 states above) are statistically significant, though there are HUGE question marks concerning California.
The whole list of states having been polled till now, going from Democratic stronghold to Republican stronghold:
New York: D +24.6%
New Mexico: D +14%
Oregon: D +12%
California: D +9%
Connecticut: D +9%
New Jersey: D +8.4%
Maine: D +8%
Michigan: D +6.9%
Ohio: D +6.7%
Florida: D +6.3%
Minnesota: D +6%
Currently estimated/projected national average: D +5.95%
Virginia: D +4.5%
Wisconsin: D +3.7%
Pennsylvania: D +3.5%
Nevada: D +3%
New Hampshire: D +2.1%
North Carolina: D +1.6%
Georgia: R +0.5%
Iowa: R +1%
Arizona: R +1%
Colorado: R +3.5%
Louisiana: R +4.3%
Kentucky: R +4.5%
South Carolina: R +7%
Mississippi: R +7%
Alaska: R +7.4%
Texas: R +8%
Kansas: R +8.6%
Arkansas: R +10.3%
Montana: R +11%
West Virginia: R +14%
Wyoming: R +28%
The best-tailored Republican candidates in all states polled so far:
1. Chris Christie favored in 9 of 32 states (for 117 EVs)
2. Jeb Bush favored in 6 states (Florida, Georgia (!), North Carolina, Arizona, Kentucky (!), Kansas & West Virginia - for 90 EVs)
3. Rand Paul favored in 4 states (California, Oregon (shared), Nevada & Alaska - for 71 EVs)
4. Mike Huckabee favored in 6 states (Texas (!), Louisiana (!), Oregon (shared), Arkansas, Mississippi & New Hampshire (!) - for 69 EVs)
5. Paul Ryan favored in 2 states (Wisconsin & Colorado - for 19 EVs)
6. Tim Pawlenty favored in 1 state (Minnesota - for 10 EVs)
7. Marco Rubio favored in 1 state (South Carolina - for 9 EVs)
8. Ben Carson favored in 1 state (Connecticut - for 7 EVs)
9. Mitt Romney favored in 1 state (Iowa (!) - for 6 EVs)
10. Susana Martinez favored in 1 state (New Mexico - for 5 EVs)
11. Ted Cruz favored in 1 state (Montana (shared) - for 3 EVs)
Current update as of October 13.
Finally, we got the 6th 2016 poll till date from Kansas. It showed improving numbers for Jeb Bush. See previous post for more details on both polls.
The total number of state polls included below has now reached 189.
The 2016 poll averages for each state - 32 states right now - and the change from the actual 2012 outcomes. Only the Republican candidate with the best statewide polling included.
Alaska: Hillary vs Rand Paul: R +7.4%
+6.6% D improvement
(Updated on September 24, 2014)
Arizona: Hillary vs Bush: R +1%
+8% D improvement
(Updated on March 6, 2014)
Arkansas: Hillary vs Mike Huckabee: R +10.3%
+13.4% D improvement
(Updated on September 24, 2014)
California: Hillary vs Rand Paul: D +9%
+14% R improvement
(Updated on August 1, 2014)
Colorado: Hillary vs Paul Ryan: R +3.5%
+8.9% R improvement
Current Republican gain
(Updated on July 29, 2014)
Connecticut: Hillary vs Ben Carson: D +9%
+8% R improvement
(Updated on October 6, 2014)
Florida: Hillary vs Bush: D +6.3%
+5.4% D improvement
(Updated on October 13, 2014)
Georgia: Hillary vs Bush: R +0.5%
+7.3% D improvement
(Updated October 7, 2013)
Iowa: Hillary vs Mitt Romney: R +1%
+6.8% R improvement
Current Republican gain
(Updated on October 12, 2014)
Kansas: Hillary vs Bush: R +8.6%
+13.0% D improvement
(Updated on October 13, 2014)
Kentucky: Hillary vs Bush: R +4.5%
+18.2% D improvement
(Updated on August 13, 2014)
Louisiana: Hillary vs Huckabee: R +4.3%
+12.9% D improvement
(Updated on September 30, 2014)
Maine: Hillary vs Christie: D +8%
+7% R improvement
(Updated on November 13, 2013)
Michigan: Hillary vs Christie: D +6.9%
+2.6% R improvement
(Updated on September 9, 2014)
Minnesota: Hillary vs Tim Pawlenty: D +6%
+2% R improvement
(Updated on June 18, 2014)
Mississippi: Hillary vs Huckabee: R +7%
+4.5% D improvement
(Updated on July 20, 2014)
Montana: Hillary vs Christie/Ted Cruz: R +11% (Brian Schweitzer vs Rand Paul: R +8%)
+3% D improvement
(Updated on October 2, 2014)
Nevada: Hillary vs Rand Paul: D +3%
+4% R improvement
(Updated on July 31, 2014)
New Hampshire: Hillary vs Huckabee: D +2.1%
+3.5% R improvement
(Updated on July 17, 2014)
New Jersey: Hillary vs Christie: D +8.4%
+9.4% R improvement
(Updated on October 1, 2014)
New Mexico: Hillary vs Susana Martinez: D +14%
+4% D improvement
(Updated on March 27, 2014)
New York: Hillary vs Christie: D +24.6%
+3.6% R improvement
(Updated on August 21, 2014)
North Carolina: Hillary vs Bush: D +1.6%
+3.6% D improvement
Current Democratic gain
(Updated on September 16, 2014)
Ohio: Hillary vs Christie: D +6.7%
+3.7% D improvement
(Updated on July 31, 2014)
Oregon: Hillary vs Rand Paul/Huckabee: D +12%
Unchanged from 2012
(Updated on May 30, 2014)
Pennsylvania: Hillary vs Christie: D +3.5%
+1.9% R improvement
(Updated on June 5, 2014)
South Carolina: Hillary vs Marco Rubio: R +7%
+3.5% D improvement
(Updated on November 2, 2013)
Texas: Hillary vs Huckabee: R +8%
+8% D improvement
(Updated on April 18, 2014)
Virginia: Hillary vs Christie: D +4.5%
+0.6% D improvement
(Updated on September 25, 2014)
West Virginia: Hillary vs Bush: R +14%
+13% D improvement
(Updated on October 1, 2013)
Wisconsin: Hillary vs Ryan: D +3.7%
+3.2% R improvement
(Updated on September 30, 2014)
Wyoming: Hillary vs Christie: R +28%
+13% D improvement
(Updated on July 23, 2013)
Average all 32 states: Hillary vs Best Republican: D +0.4%
+2.1% D improvement (from Obama 2012) [projecting a 5.95% victory for Hillary]
Giving us this map:
(
Red = Democratic lead/trend
Blue = Republican lead/trend
Green = Tied or no trend
Grey = No polling yet
Green = toss up or less than 0.5% lead
20% shade = 0.6-2% lead
30% shade = 2.1-4% lead
40% shade = 4.1-6% lead
50% shade = 6.1-9% lead
60% shade = 9.1-12% lead
70% shade = 12.1-15% lead
80% shade = 15.1-18% lead
90% shade = Above 18.1% lead
In the count of electoral votes, the current situation looks like this:
Hillary: 262 EVs (in 17 states)
Best/Tailormade Republican: 137 EVs (in 15 states)
Toss-up: None
No polling: 139 EVs (in 18 states + D.C.)
So far, Hillary has captured an impressive 65.7% of all EVs awarded, against only 34.3% EVs for the tailormade Republican.
This is how the Trendline Map looks so far:
(
The states which right now are showing the strongest improvement for the Democratic (Hillary) or the Republican candidate (in 9 out of 32 cases, Christie is that person):
1. Kentucky: D +18.2%
2. California: R +14%
3. Arkansas: D +13.4%
4. Kansas: D +13.0%
5. West Virginia: D +13%
6. Wyoming: D +13%
7. Louisiana: D +12.9%
8. New Jersey: R +9.4%
9. Colorado: R +8.9%
10. Arizona: D +8%
11. Texas: D +8%
12. Connecticut: R +8%
13. Georgia: D +7.3%
14. Maine: R +7%
15. Iowa: R +6.8%
16. Alaska: D +6.6%
17. Florida: D +5.4%
18. Mississippi: D +4.5%
All of these changes (in the 18 states above) are statistically significant, though there are HUGE question marks concerning California.
The whole list of states having been polled till now, going from Democratic stronghold to Republican stronghold:
New York: D +24.6%
New Mexico: D +14%
Oregon: D +12%
California: D +9%
Connecticut: D +9%
New Jersey: D +8.4%
Maine: D +8%
Michigan: D +6.9%
Ohio: D +6.7%
Florida: D +6.3%
Minnesota: D +6%
Currently estimated/projected national average: D +5.95%
Virginia: D +4.5%
Wisconsin: D +3.7%
Pennsylvania: D +3.5%
Nevada: D +3%
New Hampshire: D +2.1%
North Carolina: D +1.6%
Georgia: R +0.5%
Iowa: R +1%
Arizona: R +1%
Colorado: R +3.5%
Louisiana: R +4.3%
Kentucky: R +4.5%
South Carolina: R +7%
Mississippi: R +7%
Alaska: R +7.4%
Texas: R +8%
Kansas: R +8.6%
Arkansas: R +10.3%
Montana: R +11%
West Virginia: R +14%
Wyoming: R +28%
The best-tailored Republican candidates in all states polled so far:
1. Chris Christie favored in 9 of 32 states (for 117 EVs)
2. Jeb Bush favored in 6 states (Florida, Georgia (!), North Carolina, Arizona, Kentucky (!), Kansas & West Virginia - for 90 EVs)
3. Rand Paul favored in 4 states (California, Oregon (shared), Nevada & Alaska - for 71 EVs)
4. Mike Huckabee favored in 6 states (Texas (!), Louisiana (!), Oregon (shared), Arkansas, Mississippi & New Hampshire (!) - for 69 EVs)
5. Paul Ryan favored in 2 states (Wisconsin & Colorado - for 19 EVs)
6. Tim Pawlenty favored in 1 state (Minnesota - for 10 EVs)
7. Marco Rubio favored in 1 state (South Carolina - for 9 EVs)
8. Ben Carson favored in 1 state (Connecticut - for 7 EVs)
9. Mitt Romney favored in 1 state (Iowa (!) - for 6 EVs)
10. Susana Martinez favored in 1 state (New Mexico - for 5 EVs)
11. Ted Cruz favored in 1 state (Montana (shared) - for 3 EVs)
Current update as of October 13.
Title: Re: 2016 Official Polling Map Thread
Post by: pbrower2a on October 13, 2014, 10:22:18 PM
Kansas, PPP. All against Hillary Clinton.
Vs Ted Cruz: 41-44 (R +3%)
Vs Chris Christie: 38-42 (R +4%)
Vs Rand Paul: 40-45 (R +5%)
Vs Mike Huckabee: 41-47 (R +6%)
Vs Jeb Bush: 37-48 (R +11%)
http://www.publicpolicypolling.com/main/2014/10/key-races-tighten-in-kansas.html#more
For a state that Republican nominees usually win by 60-40 margins, this is weak.
Hillary Clinton vs. Jeb Bush
()
Hillary Clinton vs. Chris Christie
( )
)
Hillary Clinton vs. Mike Huckabee
( )
)
Hillary Clinton vs. Rand Paul
( )
)
blue, Republican -- red, Democratic
30% -- lead with 40-49% but a margin of 3% or less
40% -- lead with 40-49% but a margin of 4% or more
60% -- lead with 50-54%
70% -- lead with 55-59%
90% -- lead with 60% or more
Vs Ted Cruz: 41-44 (R +3%)
Vs Chris Christie: 38-42 (R +4%)
Vs Rand Paul: 40-45 (R +5%)
Vs Mike Huckabee: 41-47 (R +6%)
Vs Jeb Bush: 37-48 (R +11%)
http://www.publicpolicypolling.com/main/2014/10/key-races-tighten-in-kansas.html#more
For a state that Republican nominees usually win by 60-40 margins, this is weak.
Hillary Clinton vs. Jeb Bush
(
Hillary Clinton vs. Chris Christie
(
Hillary Clinton vs. Mike Huckabee
(
Hillary Clinton vs. Rand Paul
(
blue, Republican -- red, Democratic
30% -- lead with 40-49% but a margin of 3% or less
40% -- lead with 40-49% but a margin of 4% or more
60% -- lead with 50-54%
70% -- lead with 55-59%
90% -- lead with 60% or more
Title: Re: 2016 Official Polling Map Thread
Post by: eric82oslo on October 14, 2014, 11:51:08 AM
PPP has released two new polls today. The very first 2016 poll from Maryland, as well as another poll from Kentucky, where favourite son Rand Paul was pitched against Warren and Clinton. This happens to be the 7th 2016 poll from Kentucky. Here are the new Kentucky averages against Clinton:
Vs Jeb Bush: R +4.5% (2 polls)
Vs Mike Huckabee: R +3%
Vs Rand Paul: R +2.9% (7 polls, Hillary down 0.1%)
Vs Chris Christie: R +0.5% (2 polls)
Vs Ted Cruz: D +4% (2 polls)
Vs Marco Rubio: D +7% (2 polls)
Basically an unchanged race in Kentucky for now.
Also there was a Gravis poll from New Mexico released a few days ago showing Rand Paul and Jeb Bush with fairly strong numbers. Together with a previous PPP poll, we now have two 2016 polls from this Latino state with a capital D. And it seems we have a two or three horse race there as well, for now, as these averages will show:
Vs Susana Martinez: D +14%
Vs Rand Paul: D +14% (2 polls, Hillary down 1%)
Vs Jeb Bush: D +15% (2 polls, Hillary down 1%)
Vs Ted Cruz: D +17% (1 poll)
Vs Chris Christie: D +18% (1 poll)
Vs Mike Huckabee: D +21% (1 poll)
For the Maryland poll, check out my next, fully updated database post.
Title: Re: 2016 Official Polling Map Thread
Post by: eric82oslo on October 14, 2014, 11:52:24 AM
We finally have a new state to add, Maryland, the 33rd one, which has been polled by Gravis. :) Hillary leads Bush & Rand Paul by 17% there, but Paul Ryan by "only" 15%. Gravis also polled Kentucky, where the race remains unchanged. Finally Gravis has polled New Mexico, where Martinez & Paul now share the top spot.
The total number of state polls included below has now reached 192.
The 2016 poll averages for each state - 33 states right now - and the change from the actual 2012 outcomes. Only the Republican candidate with the best statewide polling included.
Alaska: Hillary vs Rand Paul: R +7.4%
+6.6% D improvement
(Updated on September 24, 2014)
Arizona: Hillary vs Bush: R +1%
+8% D improvement
(Updated on March 6, 2014)
Arkansas: Hillary vs Mike Huckabee: R +10.3%
+13.4% D improvement
(Updated on September 24, 2014)
California: Hillary vs Rand Paul: D +9%
+14% R improvement
(Updated on August 1, 2014)
Colorado: Hillary vs Paul Ryan: R +3.5%
+8.9% R improvement
Current Republican gain
(Updated on July 29, 2014)
Connecticut: Hillary vs Ben Carson: D +9%
+8% R improvement
(Updated on October 6, 2014)
Florida: Hillary vs Bush: D +6.3%
+5.4% D improvement
(Updated on October 13, 2014)
Georgia: Hillary vs Bush: R +0.5%
+7.3% D improvement
(Updated October 7, 2013)
Iowa: Hillary vs Mitt Romney: R +1%
+6.8% R improvement
Current Republican gain
(Updated on October 12, 2014)
Kansas: Hillary vs Bush: R +8.6%
+13.0% D improvement
(Updated on October 13, 2014)
Kentucky: Hillary vs Bush: R +4.5%
+18.2% D improvement
(Updated on August 13, 2014)
Louisiana: Hillary vs Huckabee: R +4.3%
+12.9% D improvement
(Updated on September 30, 2014)
Maine: Hillary vs Christie: D +8%
+7% R improvement
(Updated on November 13, 2013)
NEW! Maryland: Hillary vs Ryan: D +15%
+11% R improvement
(Updated on October 14, 2014)
Michigan: Hillary vs Christie: D +6.9%
+2.6% R improvement
(Updated on September 9, 2014)
Minnesota: Hillary vs Tim Pawlenty: D +6%
+2% R improvement
(Updated on June 18, 2014)
Mississippi: Hillary vs Huckabee: R +7%
+4.5% D improvement
(Updated on July 20, 2014)
Montana: Hillary vs Christie/Ted Cruz: R +11% (Brian Schweitzer vs Rand Paul: R +8%)
+3% D improvement
(Updated on October 2, 2014)
Nevada: Hillary vs Rand Paul: D +3%
+4% R improvement
(Updated on July 31, 2014)
New Hampshire: Hillary vs Huckabee: D +2.1%
+3.5% R improvement
(Updated on July 17, 2014)
New Jersey: Hillary vs Christie: D +8.4%
+9.4% R improvement
(Updated on October 1, 2014)
New Mexico: Hillary vs Susana Martinez/Rand Paul: D +14%
+4% D improvement
(Updated on October 14, 2014)
New York: Hillary vs Christie: D +24.6%
+3.6% R improvement
(Updated on August 21, 2014)
North Carolina: Hillary vs Bush: D +1.6%
+3.6% D improvement
Current Democratic gain
(Updated on September 16, 2014)
Ohio: Hillary vs Christie: D +6.7%
+3.7% D improvement
(Updated on July 31, 2014)
Oregon: Hillary vs Rand Paul/Huckabee: D +12%
Unchanged from 2012
(Updated on May 30, 2014)
Pennsylvania: Hillary vs Christie: D +3.5%
+1.9% R improvement
(Updated on June 5, 2014)
South Carolina: Hillary vs Marco Rubio: R +7%
+3.5% D improvement
(Updated on November 2, 2013)
Texas: Hillary vs Huckabee: R +8%
+8% D improvement
(Updated on April 18, 2014)
Virginia: Hillary vs Christie: D +4.5%
+0.6% D improvement
(Updated on September 25, 2014)
West Virginia: Hillary vs Bush: R +14%
+13% D improvement
(Updated on October 1, 2013)
Wisconsin: Hillary vs Ryan: D +3.7%
+3.2% R improvement
(Updated on September 30, 2014)
Wyoming: Hillary vs Christie: R +28%
+13% D improvement
(Updated on July 23, 2013)
Average all 33 states: Hillary vs Best Republican: D +0.85%
+1.7% D improvement (from Obama 2012) [projecting a 5.6% victory for Hillary]
Giving us this map:
( )
)
Red = Democratic lead/trend
Blue = Republican lead/trend
Green = Tied or no trend
Grey = No polling yet
Green = toss up or less than 0.5% lead
20% shade = 0.6-2% lead
30% shade = 2.1-4% lead
40% shade = 4.1-6% lead
50% shade = 6.1-9% lead
60% shade = 9.1-12% lead
70% shade = 12.1-15% lead
80% shade = 15.1-18% lead
90% shade = Above 18.1% lead
In the count of electoral votes, the current situation looks like this:
Hillary: 272 EVs (in 18 states)
Best/Tailormade Republican: 137 EVs (in 15 states)
Toss-up: None
No polling: 129 EVs (in 17 states + D.C.)
So far, Hillary has captured an impressive 66.5% of all EVs awarded, against only 33.5% EVs for the tailormade Republican.
This is how the Trendline Map looks so far:
( )
)
The states which right now are showing the strongest improvement for the Democratic (Hillary) or the Republican candidate (in 9 out of 33 cases, Christie is that person):
1. Kentucky: D +18.2%
2. California: R +14%
3. Arkansas: D +13.4%
4. Kansas: D +13.0%
5. West Virginia: D +13%
6. Wyoming: D +13%
7. Louisiana: D +12.9%
8. Maryland: R +11%
9. New Jersey: R +9.4%
10. Colorado: R +8.9%
11. Arizona: D +8%
12. Texas: D +8%
13. Connecticut: R +8%
14. Georgia: D +7.3%
15. Maine: R +7%
16. Iowa: R +6.8%
17. Alaska: D +6.6%
18. Florida: D +5.4%
19. Mississippi: D +4.5%
All changes should be statistically significant.
The whole list of states having been polled till now, going from Democratic stronghold to Republican stronghold:
New York: D +24.6%
Maryland: D +15%
New Mexico: D +14%
Oregon: D +12%
California: D +9%
Connecticut: D +9%
New Jersey: D +8.4%
Maine: D +8%
Michigan: D +6.9%
Ohio: D +6.7%
Florida: D +6.3%
Minnesota: D +6%
Currently estimated/projected national average: D +5.6%
Virginia: D +4.5%
Wisconsin: D +3.7%
Pennsylvania: D +3.5%
Nevada: D +3%
New Hampshire: D +2.1%
North Carolina: D +1.6%
Georgia: R +0.5%
Iowa: R +1%
Arizona: R +1%
Colorado: R +3.5%
Louisiana: R +4.3%
Kentucky: R +4.5%
South Carolina: R +7%
Mississippi: R +7%
Alaska: R +7.4%
Texas: R +8%
Kansas: R +8.6%
Arkansas: R +10.3%
Montana: R +11%
West Virginia: R +14%
Wyoming: R +28%
The best-tailored Republican candidates in all states polled so far:
1. Chris Christie favored in 9 of 33 states (for 117 EVs)
2. Jeb Bush favored in 6 states (Florida, Georgia (!), North Carolina, Arizona, Kentucky (!), Kansas & West Virginia - for 90 EVs)
3. Rand Paul favored in 5 states (California, Oregon (shared), Nevada, New Mexico & Alaska - for 76 EVs)
4. Mike Huckabee favored in 6 states (Texas (!), Louisiana (!), Oregon (shared), Arkansas, Mississippi & New Hampshire (!) - for 69 EVs)
5. Paul Ryan favored in 3 states (Wisconsin, Maryland & Colorado - for 29 EVs)
6. Tim Pawlenty favored in 1 state (Minnesota - for 10 EVs)
7. Marco Rubio favored in 1 state (South Carolina - for 9 EVs)
8. Ben Carson favored in 1 state (Connecticut - for 7 EVs)
9. Mitt Romney favored in 1 state (Iowa (!) - for 6 EVs)
10. Susana Martinez favored in 1 state (New Mexico - for 5 EVs)
11. Ted Cruz favored in 1 state (Montana (shared) - for 3 EVs)
Current update as of October 14.
The total number of state polls included below has now reached 192.
The 2016 poll averages for each state - 33 states right now - and the change from the actual 2012 outcomes. Only the Republican candidate with the best statewide polling included.
Alaska: Hillary vs Rand Paul: R +7.4%
+6.6% D improvement
(Updated on September 24, 2014)
Arizona: Hillary vs Bush: R +1%
+8% D improvement
(Updated on March 6, 2014)
Arkansas: Hillary vs Mike Huckabee: R +10.3%
+13.4% D improvement
(Updated on September 24, 2014)
California: Hillary vs Rand Paul: D +9%
+14% R improvement
(Updated on August 1, 2014)
Colorado: Hillary vs Paul Ryan: R +3.5%
+8.9% R improvement
Current Republican gain
(Updated on July 29, 2014)
Connecticut: Hillary vs Ben Carson: D +9%
+8% R improvement
(Updated on October 6, 2014)
Florida: Hillary vs Bush: D +6.3%
+5.4% D improvement
(Updated on October 13, 2014)
Georgia: Hillary vs Bush: R +0.5%
+7.3% D improvement
(Updated October 7, 2013)
Iowa: Hillary vs Mitt Romney: R +1%
+6.8% R improvement
Current Republican gain
(Updated on October 12, 2014)
Kansas: Hillary vs Bush: R +8.6%
+13.0% D improvement
(Updated on October 13, 2014)
Kentucky: Hillary vs Bush: R +4.5%
+18.2% D improvement
(Updated on August 13, 2014)
Louisiana: Hillary vs Huckabee: R +4.3%
+12.9% D improvement
(Updated on September 30, 2014)
Maine: Hillary vs Christie: D +8%
+7% R improvement
(Updated on November 13, 2013)
NEW! Maryland: Hillary vs Ryan: D +15%
+11% R improvement
(Updated on October 14, 2014)
Michigan: Hillary vs Christie: D +6.9%
+2.6% R improvement
(Updated on September 9, 2014)
Minnesota: Hillary vs Tim Pawlenty: D +6%
+2% R improvement
(Updated on June 18, 2014)
Mississippi: Hillary vs Huckabee: R +7%
+4.5% D improvement
(Updated on July 20, 2014)
Montana: Hillary vs Christie/Ted Cruz: R +11% (Brian Schweitzer vs Rand Paul: R +8%)
+3% D improvement
(Updated on October 2, 2014)
Nevada: Hillary vs Rand Paul: D +3%
+4% R improvement
(Updated on July 31, 2014)
New Hampshire: Hillary vs Huckabee: D +2.1%
+3.5% R improvement
(Updated on July 17, 2014)
New Jersey: Hillary vs Christie: D +8.4%
+9.4% R improvement
(Updated on October 1, 2014)
New Mexico: Hillary vs Susana Martinez/Rand Paul: D +14%
+4% D improvement
(Updated on October 14, 2014)
New York: Hillary vs Christie: D +24.6%
+3.6% R improvement
(Updated on August 21, 2014)
North Carolina: Hillary vs Bush: D +1.6%
+3.6% D improvement
Current Democratic gain
(Updated on September 16, 2014)
Ohio: Hillary vs Christie: D +6.7%
+3.7% D improvement
(Updated on July 31, 2014)
Oregon: Hillary vs Rand Paul/Huckabee: D +12%
Unchanged from 2012
(Updated on May 30, 2014)
Pennsylvania: Hillary vs Christie: D +3.5%
+1.9% R improvement
(Updated on June 5, 2014)
South Carolina: Hillary vs Marco Rubio: R +7%
+3.5% D improvement
(Updated on November 2, 2013)
Texas: Hillary vs Huckabee: R +8%
+8% D improvement
(Updated on April 18, 2014)
Virginia: Hillary vs Christie: D +4.5%
+0.6% D improvement
(Updated on September 25, 2014)
West Virginia: Hillary vs Bush: R +14%
+13% D improvement
(Updated on October 1, 2013)
Wisconsin: Hillary vs Ryan: D +3.7%
+3.2% R improvement
(Updated on September 30, 2014)
Wyoming: Hillary vs Christie: R +28%
+13% D improvement
(Updated on July 23, 2013)
Average all 33 states: Hillary vs Best Republican: D +0.85%
+1.7% D improvement (from Obama 2012) [projecting a 5.6% victory for Hillary]
Giving us this map:
(
Red = Democratic lead/trend
Blue = Republican lead/trend
Green = Tied or no trend
Grey = No polling yet
Green = toss up or less than 0.5% lead
20% shade = 0.6-2% lead
30% shade = 2.1-4% lead
40% shade = 4.1-6% lead
50% shade = 6.1-9% lead
60% shade = 9.1-12% lead
70% shade = 12.1-15% lead
80% shade = 15.1-18% lead
90% shade = Above 18.1% lead
In the count of electoral votes, the current situation looks like this:
Hillary: 272 EVs (in 18 states)
Best/Tailormade Republican: 137 EVs (in 15 states)
Toss-up: None
No polling: 129 EVs (in 17 states + D.C.)
So far, Hillary has captured an impressive 66.5% of all EVs awarded, against only 33.5% EVs for the tailormade Republican.
This is how the Trendline Map looks so far:
(
The states which right now are showing the strongest improvement for the Democratic (Hillary) or the Republican candidate (in 9 out of 33 cases, Christie is that person):
1. Kentucky: D +18.2%
2. California: R +14%
3. Arkansas: D +13.4%
4. Kansas: D +13.0%
5. West Virginia: D +13%
6. Wyoming: D +13%
7. Louisiana: D +12.9%
8. Maryland: R +11%
9. New Jersey: R +9.4%
10. Colorado: R +8.9%
11. Arizona: D +8%
12. Texas: D +8%
13. Connecticut: R +8%
14. Georgia: D +7.3%
15. Maine: R +7%
16. Iowa: R +6.8%
17. Alaska: D +6.6%
18. Florida: D +5.4%
19. Mississippi: D +4.5%
All changes should be statistically significant.
The whole list of states having been polled till now, going from Democratic stronghold to Republican stronghold:
New York: D +24.6%
Maryland: D +15%
New Mexico: D +14%
Oregon: D +12%
California: D +9%
Connecticut: D +9%
New Jersey: D +8.4%
Maine: D +8%
Michigan: D +6.9%
Ohio: D +6.7%
Florida: D +6.3%
Minnesota: D +6%
Currently estimated/projected national average: D +5.6%
Virginia: D +4.5%
Wisconsin: D +3.7%
Pennsylvania: D +3.5%
Nevada: D +3%
New Hampshire: D +2.1%
North Carolina: D +1.6%
Georgia: R +0.5%
Iowa: R +1%
Arizona: R +1%
Colorado: R +3.5%
Louisiana: R +4.3%
Kentucky: R +4.5%
South Carolina: R +7%
Mississippi: R +7%
Alaska: R +7.4%
Texas: R +8%
Kansas: R +8.6%
Arkansas: R +10.3%
Montana: R +11%
West Virginia: R +14%
Wyoming: R +28%
The best-tailored Republican candidates in all states polled so far:
1. Chris Christie favored in 9 of 33 states (for 117 EVs)
2. Jeb Bush favored in 6 states (Florida, Georgia (!), North Carolina, Arizona, Kentucky (!), Kansas & West Virginia - for 90 EVs)
3. Rand Paul favored in 5 states (California, Oregon (shared), Nevada, New Mexico & Alaska - for 76 EVs)
4. Mike Huckabee favored in 6 states (Texas (!), Louisiana (!), Oregon (shared), Arkansas, Mississippi & New Hampshire (!) - for 69 EVs)
5. Paul Ryan favored in 3 states (Wisconsin, Maryland & Colorado - for 29 EVs)
6. Tim Pawlenty favored in 1 state (Minnesota - for 10 EVs)
7. Marco Rubio favored in 1 state (South Carolina - for 9 EVs)
8. Ben Carson favored in 1 state (Connecticut - for 7 EVs)
9. Mitt Romney favored in 1 state (Iowa (!) - for 6 EVs)
10. Susana Martinez favored in 1 state (New Mexico - for 5 EVs)
11. Ted Cruz favored in 1 state (Montana (shared) - for 3 EVs)
Current update as of October 14.
Title: Re: 2016 Official Polling Map Thread
Post by: eric82oslo on October 14, 2014, 02:55:08 PM
We have our 4th poll added for the day, including the 2nd entirely new state - this time - Idaho! 8) So far, Hillary does much better there than Obama in 2012, yet still trailing everyone of the 5 GOPers tested, at worst by a margin of 19% against Rand Paul.
The total number of state polls included below has now reached 193.
The 2016 poll averages for each state - 34 states right now - and the change from the actual 2012 outcomes. Only the Republican candidate with the best statewide polling included.
Alaska: Hillary vs Rand Paul: R +7.4%
+6.6% D improvement
(Updated on September 24, 2014)
Arizona: Hillary vs Bush: R +1%
+8% D improvement
(Updated on March 6, 2014)
Arkansas: Hillary vs Mike Huckabee: R +10.3%
+13.4% D improvement
(Updated on September 24, 2014)
California: Hillary vs Rand Paul: D +9%
+14% R improvement
(Updated on August 1, 2014)
Colorado: Hillary vs Paul Ryan: R +3.5%
+8.9% R improvement
Current Republican gain
(Updated on July 29, 2014)
Connecticut: Hillary vs Ben Carson: D +9%
+8% R improvement
(Updated on October 6, 2014)
Florida: Hillary vs Bush: D +6.3%
+5.4% D improvement
(Updated on October 13, 2014)
Georgia: Hillary vs Bush: R +0.5%
+7.3% D improvement
(Updated October 7, 2013)
NEW! Idaho: Hillary vs Rand Paul: R +19%
+13% D improvement
(Updated October 14, 2014)
Iowa: Hillary vs Mitt Romney: R +1%
+6.8% R improvement
Current Republican gain
(Updated on October 12, 2014)
Kansas: Hillary vs Bush: R +8.6%
+13.0% D improvement
(Updated on October 13, 2014)
Kentucky: Hillary vs Bush: R +4.5%
+18.2% D improvement
(Updated on August 13, 2014)
Louisiana: Hillary vs Huckabee: R +4.3%
+12.9% D improvement
(Updated on September 30, 2014)
Maine: Hillary vs Christie: D +8%
+7% R improvement
(Updated on November 13, 2013)
NEW! Maryland: Hillary vs Ryan: D +15%
+11% R improvement
(Updated on October 14, 2014)
Michigan: Hillary vs Christie: D +6.9%
+2.6% R improvement
(Updated on September 9, 2014)
Minnesota: Hillary vs Tim Pawlenty: D +6%
+2% R improvement
(Updated on June 18, 2014)
Mississippi: Hillary vs Huckabee: R +7%
+4.5% D improvement
(Updated on July 20, 2014)
Montana: Hillary vs Christie/Ted Cruz: R +11% (Brian Schweitzer vs Rand Paul: R +8%)
+3% D improvement
(Updated on October 2, 2014)
Nevada: Hillary vs Rand Paul: D +3%
+4% R improvement
(Updated on July 31, 2014)
New Hampshire: Hillary vs Huckabee: D +2.1%
+3.5% R improvement
(Updated on July 17, 2014)
New Jersey: Hillary vs Christie: D +8.4%
+9.4% R improvement
(Updated on October 1, 2014)
New Mexico: Hillary vs Susana Martinez/Rand Paul: D +14%
+4% D improvement
(Updated on October 14, 2014)
New York: Hillary vs Christie: D +24.6%
+3.6% R improvement
(Updated on August 21, 2014)
North Carolina: Hillary vs Bush: D +1.6%
+3.6% D improvement
Current Democratic gain
(Updated on September 16, 2014)
Ohio: Hillary vs Christie: D +6.7%
+3.7% D improvement
(Updated on July 31, 2014)
Oregon: Hillary vs Rand Paul/Huckabee: D +12%
Unchanged from 2012
(Updated on May 30, 2014)
Pennsylvania: Hillary vs Christie: D +3.5%
+1.9% R improvement
(Updated on June 5, 2014)
South Carolina: Hillary vs Marco Rubio: R +7%
+3.5% D improvement
(Updated on November 2, 2013)
Texas: Hillary vs Huckabee: R +8%
+8% D improvement
(Updated on April 18, 2014)
Virginia: Hillary vs Christie: D +4.5%
+0.6% D improvement
(Updated on September 25, 2014)
West Virginia: Hillary vs Bush: R +14%
+13% D improvement
(Updated on October 1, 2013)
Wisconsin: Hillary vs Ryan: D +3.7%
+3.2% R improvement
(Updated on September 30, 2014)
Wyoming: Hillary vs Christie: R +28%
+13% D improvement
(Updated on July 23, 2013)
Average all 34 states: Hillary vs Best Republican: D +0.3%
+2.0% D improvement (from Obama 2012) [projecting a 5.9% victory for Hillary]
Giving us this map:
( )
)
Red = Democratic lead/trend
Blue = Republican lead/trend
Green = Tied or no trend
Grey = No polling yet
Green = toss up or less than 0.5% lead
20% shade = 0.6-2% lead
30% shade = 2.1-4% lead
40% shade = 4.1-6% lead
50% shade = 6.1-9% lead
60% shade = 9.1-12% lead
70% shade = 12.1-15% lead
80% shade = 15.1-18% lead
90% shade = Above 18.1% lead
In the count of electoral votes, the current situation looks like this:
Hillary: 272 EVs (in 18 states)
Best/Tailormade Republican: 141 EVs (in 16 states)
Toss-up: None
No polling: 125 EVs (in 16 states + D.C.)
So far, Hillary has captured 65.9% of all EVs awarded, against only 34.1% EVs for the tailormade Republican.
This is how the Trendline Map looks so far:
( )
)
The states which right now are showing the strongest improvement for the Democratic (Hillary) or the Republican candidate:
1. Kentucky: D +18.2%
2. California: R +14%
3. Arkansas: D +13.4%
4. Kansas: D +13.0%
5. West Virginia: D +13%
6. Idaho: D +13%
7. Wyoming: D +13%
8. Louisiana: D +12.9%
9. Maryland: R +11%
10. New Jersey: R +9.4%
11. Colorado: R +8.9%
12. Arizona: D +8%
13. Texas: D +8%
14. Connecticut: R +8%
15. Georgia: D +7.3%
16. Maine: R +7%
17. Iowa: R +6.8%
18. Alaska: D +6.6%
19. Florida: D +5.4%
20. Mississippi: D +4.5%
The whole list of states having been polled till now, going from Democratic stronghold to Republican stronghold:
New York: D +24.6%
Maryland: D +15%
New Mexico: D +14%
Oregon: D +12%
California: D +9%
Connecticut: D +9%
New Jersey: D +8.4%
Maine: D +8%
Michigan: D +6.9%
Ohio: D +6.7%
Florida: D +6.3%
Minnesota: D +6%
Currently estimated/projected national average: D +5.9%
Virginia: D +4.5%
Wisconsin: D +3.7%
Pennsylvania: D +3.5%
Nevada: D +3%
New Hampshire: D +2.1%
North Carolina: D +1.6%
Georgia: R +0.5%
Iowa: R +1%
Arizona: R +1%
Colorado: R +3.5%
Louisiana: R +4.3%
Kentucky: R +4.5%
South Carolina: R +7%
Mississippi: R +7%
Alaska: R +7.4%
Texas: R +8%
Kansas: R +8.6%
Arkansas: R +10.3%
Montana: R +11%
West Virginia: R +14%
Idaho: R +19%
Wyoming: R +28%
The best-tailored Republican candidates in all states polled so far:
1. Chris Christie favored in 9 of 34 states (for 117 EVs)
2. Jeb Bush favored in 6 states (Florida, Georgia (!), North Carolina, Arizona, Kentucky (!), Kansas & West Virginia - for 90 EVs)
3. Rand Paul favored in 6 states (California, Oregon (shared), Nevada, New Mexico (!) (shared), Idaho & Alaska - for 80 EVs)
4. Mike Huckabee favored in 6 states (Texas (!), Louisiana (!), Oregon (shared), Arkansas, Mississippi & New Hampshire (!) - for 69 EVs)
5. Paul Ryan favored in 3 states (Wisconsin, Maryland & Colorado - for 29 EVs)
6. Tim Pawlenty favored in 1 state (Minnesota - for 10 EVs)
7. Marco Rubio favored in 1 state (South Carolina - for 9 EVs)
8. Ben Carson favored in 1 state (Connecticut - for 7 EVs)
9. Mitt Romney favored in 1 state (Iowa (!) - for 6 EVs)
10. Susana Martinez favored in 1 state (New Mexico (shared) - for 5 EVs)
11. Ted Cruz favored in 1 state (Montana (shared) - for 3 EVs)
Current update as of October 14.
The total number of state polls included below has now reached 193.
The 2016 poll averages for each state - 34 states right now - and the change from the actual 2012 outcomes. Only the Republican candidate with the best statewide polling included.
Alaska: Hillary vs Rand Paul: R +7.4%
+6.6% D improvement
(Updated on September 24, 2014)
Arizona: Hillary vs Bush: R +1%
+8% D improvement
(Updated on March 6, 2014)
Arkansas: Hillary vs Mike Huckabee: R +10.3%
+13.4% D improvement
(Updated on September 24, 2014)
California: Hillary vs Rand Paul: D +9%
+14% R improvement
(Updated on August 1, 2014)
Colorado: Hillary vs Paul Ryan: R +3.5%
+8.9% R improvement
Current Republican gain
(Updated on July 29, 2014)
Connecticut: Hillary vs Ben Carson: D +9%
+8% R improvement
(Updated on October 6, 2014)
Florida: Hillary vs Bush: D +6.3%
+5.4% D improvement
(Updated on October 13, 2014)
Georgia: Hillary vs Bush: R +0.5%
+7.3% D improvement
(Updated October 7, 2013)
NEW! Idaho: Hillary vs Rand Paul: R +19%
+13% D improvement
(Updated October 14, 2014)
Iowa: Hillary vs Mitt Romney: R +1%
+6.8% R improvement
Current Republican gain
(Updated on October 12, 2014)
Kansas: Hillary vs Bush: R +8.6%
+13.0% D improvement
(Updated on October 13, 2014)
Kentucky: Hillary vs Bush: R +4.5%
+18.2% D improvement
(Updated on August 13, 2014)
Louisiana: Hillary vs Huckabee: R +4.3%
+12.9% D improvement
(Updated on September 30, 2014)
Maine: Hillary vs Christie: D +8%
+7% R improvement
(Updated on November 13, 2013)
NEW! Maryland: Hillary vs Ryan: D +15%
+11% R improvement
(Updated on October 14, 2014)
Michigan: Hillary vs Christie: D +6.9%
+2.6% R improvement
(Updated on September 9, 2014)
Minnesota: Hillary vs Tim Pawlenty: D +6%
+2% R improvement
(Updated on June 18, 2014)
Mississippi: Hillary vs Huckabee: R +7%
+4.5% D improvement
(Updated on July 20, 2014)
Montana: Hillary vs Christie/Ted Cruz: R +11% (Brian Schweitzer vs Rand Paul: R +8%)
+3% D improvement
(Updated on October 2, 2014)
Nevada: Hillary vs Rand Paul: D +3%
+4% R improvement
(Updated on July 31, 2014)
New Hampshire: Hillary vs Huckabee: D +2.1%
+3.5% R improvement
(Updated on July 17, 2014)
New Jersey: Hillary vs Christie: D +8.4%
+9.4% R improvement
(Updated on October 1, 2014)
New Mexico: Hillary vs Susana Martinez/Rand Paul: D +14%
+4% D improvement
(Updated on October 14, 2014)
New York: Hillary vs Christie: D +24.6%
+3.6% R improvement
(Updated on August 21, 2014)
North Carolina: Hillary vs Bush: D +1.6%
+3.6% D improvement
Current Democratic gain
(Updated on September 16, 2014)
Ohio: Hillary vs Christie: D +6.7%
+3.7% D improvement
(Updated on July 31, 2014)
Oregon: Hillary vs Rand Paul/Huckabee: D +12%
Unchanged from 2012
(Updated on May 30, 2014)
Pennsylvania: Hillary vs Christie: D +3.5%
+1.9% R improvement
(Updated on June 5, 2014)
South Carolina: Hillary vs Marco Rubio: R +7%
+3.5% D improvement
(Updated on November 2, 2013)
Texas: Hillary vs Huckabee: R +8%
+8% D improvement
(Updated on April 18, 2014)
Virginia: Hillary vs Christie: D +4.5%
+0.6% D improvement
(Updated on September 25, 2014)
West Virginia: Hillary vs Bush: R +14%
+13% D improvement
(Updated on October 1, 2013)
Wisconsin: Hillary vs Ryan: D +3.7%
+3.2% R improvement
(Updated on September 30, 2014)
Wyoming: Hillary vs Christie: R +28%
+13% D improvement
(Updated on July 23, 2013)
Average all 34 states: Hillary vs Best Republican: D +0.3%
+2.0% D improvement (from Obama 2012) [projecting a 5.9% victory for Hillary]
Giving us this map:
(
Red = Democratic lead/trend
Blue = Republican lead/trend
Green = Tied or no trend
Grey = No polling yet
Green = toss up or less than 0.5% lead
20% shade = 0.6-2% lead
30% shade = 2.1-4% lead
40% shade = 4.1-6% lead
50% shade = 6.1-9% lead
60% shade = 9.1-12% lead
70% shade = 12.1-15% lead
80% shade = 15.1-18% lead
90% shade = Above 18.1% lead
In the count of electoral votes, the current situation looks like this:
Hillary: 272 EVs (in 18 states)
Best/Tailormade Republican: 141 EVs (in 16 states)
Toss-up: None
No polling: 125 EVs (in 16 states + D.C.)
So far, Hillary has captured 65.9% of all EVs awarded, against only 34.1% EVs for the tailormade Republican.
This is how the Trendline Map looks so far:
(
The states which right now are showing the strongest improvement for the Democratic (Hillary) or the Republican candidate:
1. Kentucky: D +18.2%
2. California: R +14%
3. Arkansas: D +13.4%
4. Kansas: D +13.0%
5. West Virginia: D +13%
6. Idaho: D +13%
7. Wyoming: D +13%
8. Louisiana: D +12.9%
9. Maryland: R +11%
10. New Jersey: R +9.4%
11. Colorado: R +8.9%
12. Arizona: D +8%
13. Texas: D +8%
14. Connecticut: R +8%
15. Georgia: D +7.3%
16. Maine: R +7%
17. Iowa: R +6.8%
18. Alaska: D +6.6%
19. Florida: D +5.4%
20. Mississippi: D +4.5%
The whole list of states having been polled till now, going from Democratic stronghold to Republican stronghold:
New York: D +24.6%
Maryland: D +15%
New Mexico: D +14%
Oregon: D +12%
California: D +9%
Connecticut: D +9%
New Jersey: D +8.4%
Maine: D +8%
Michigan: D +6.9%
Ohio: D +6.7%
Florida: D +6.3%
Minnesota: D +6%
Currently estimated/projected national average: D +5.9%
Virginia: D +4.5%
Wisconsin: D +3.7%
Pennsylvania: D +3.5%
Nevada: D +3%
New Hampshire: D +2.1%
North Carolina: D +1.6%
Georgia: R +0.5%
Iowa: R +1%
Arizona: R +1%
Colorado: R +3.5%
Louisiana: R +4.3%
Kentucky: R +4.5%
South Carolina: R +7%
Mississippi: R +7%
Alaska: R +7.4%
Texas: R +8%
Kansas: R +8.6%
Arkansas: R +10.3%
Montana: R +11%
West Virginia: R +14%
Idaho: R +19%
Wyoming: R +28%
The best-tailored Republican candidates in all states polled so far:
1. Chris Christie favored in 9 of 34 states (for 117 EVs)
2. Jeb Bush favored in 6 states (Florida, Georgia (!), North Carolina, Arizona, Kentucky (!), Kansas & West Virginia - for 90 EVs)
3. Rand Paul favored in 6 states (California, Oregon (shared), Nevada, New Mexico (!) (shared), Idaho & Alaska - for 80 EVs)
4. Mike Huckabee favored in 6 states (Texas (!), Louisiana (!), Oregon (shared), Arkansas, Mississippi & New Hampshire (!) - for 69 EVs)
5. Paul Ryan favored in 3 states (Wisconsin, Maryland & Colorado - for 29 EVs)
6. Tim Pawlenty favored in 1 state (Minnesota - for 10 EVs)
7. Marco Rubio favored in 1 state (South Carolina - for 9 EVs)
8. Ben Carson favored in 1 state (Connecticut - for 7 EVs)
9. Mitt Romney favored in 1 state (Iowa (!) - for 6 EVs)
10. Susana Martinez favored in 1 state (New Mexico (shared) - for 5 EVs)
11. Ted Cruz favored in 1 state (Montana (shared) - for 3 EVs)
Current update as of October 14.
Title: Re: 2016 Official Polling Map Thread
Post by: pbrower2a on October 14, 2014, 03:11:49 PM
Gravis, Maryland
Hillary...
Vs Paul Ryan: 51-36 (D +15%)
Vs Rand Paul: 51-34 (D +17%)
Vs Jeb Bush: 52-35 (D +17%)
http://gravismarketing.com/polling-and-market-research/current-maryland-polling
No surprise there!
New Mexico, also from Gravis:
http://gravismarketing.com/polling-and-market-research/current-new-mexico-polling/
Match ups:
Hillary vs Rand Paul: 49-36 (D +13%)
Hillary vs Jeb Bush: 50-36 (D +14%)
Kentucky, Gravis (with only one relevant matchup)
http://gravismarketing.com/polling-and-market-research/october-kentucky-polling-of-likely-voters/
It features only two 2016 match-ups:
Rand Paul vs Hillary Clinton: 48-45 (R +3%)
Rand Paul vs Elizabeth Warren: 49-36 (R +13%)
Idaho, PPP:
Vs Chris Christie: 33-44 (R +11%)
Vs Ted Cruz: 34-50 (R +16%)
Vs Jeb Bush: 33-50 (R +17%)
Vs Mike Huckabee: 34-52 (R +18%)
Vs Rand Paul: 33-52 (R +19%)
More here: http://www.publicpolicypolling.com/main/2014/10/idaho-governors-race-close-but-otter-has-room-to-grow.html
Hillary Clinton vs. Jeb Bush
(
Hillary Clinton vs. Chris Christie
(
Hillary Clinton vs. Mike Huckabee
(
Hillary Clinton vs. Rand Paul
(
blue, Republican -- red, Democratic
30% -- lead with 40-49% but a margin of 3% or less
40% -- lead with 40-49% but a margin of 4% or more
60% -- lead with 50-54%
70% -- lead with 55-59%
90% -- lead with 60% or more
Title: Re: 2016 Official Polling Map Thread
Post by: Mehmentum on October 14, 2014, 03:18:22 PM
Its telling that the Hillary vs. Best Republican map is roughly equivalent to Obama's 2012 win. Not only that, but there is no 'best' Republican who does this well in every state. All the candidates have strengths and weaknesses and fall short of this ideal scenario.
Title: Re: 2016 Official Polling Map Thread
Post by: pbrower2a on October 14, 2014, 03:20:20 PM
Here's my projection of the 2016 election based upon what I see in Hillary Clinton against the main four potential nominees in current polls. I pay no attention to Ted Cruz, Mario Rubio, or Scott Walker, as they lose by ludicrous margins in all but sure-R states.
As if Maryland (which has not voted for a Republican nominee for President since the 1950s aside from two 49-state blowouts) offers any mystery on how it will go in 2016... It has been polled on the 2016 election for the first time.
Idaho apparently will vote for any Republican who does not pose the overt danger of provoking thermonuclear war, although that was very close in 1964.
(
Legitimate swing states:
white -- mixed results or any tie
pink -- D lead in all 4 current polls, but swing states in 2008 and 2012
pale blue -- R lead in all current polls, all but one of them under 4%
Fringe swing states:
medium red -- D lead by at least 4% (but under 50%) in all but at most one poll but not swing states in 2008 or 2012
medium blue -- R lead by at least 4% (but under 50%) in all but at most one poll but not swing states in 2008 or 2012
Non-swing states
dark red -- D lead with at least 50% in at least two polls
dark blue -- R lead with at least 50% in at least two polls
Gray -- no polling
Now, based on how states did in 2008 and 2012 and how analogous states do, I fill in the rest:
(
Legitimate swing states:
white -- mixed results or any tie 60
pink -- D lead in all 4 current polls, but swing states in 2008 and 2012, or a split 81
pale blue -- R lead in all current polls, all but one of them under 4% 14
Fringe swing states:
medium red -- D lead by at least 4% (but under 50%) in all but at most one poll but not swing states in 2008 or 2012 50
medium blue -- R lead by at least 4% (but under 50%) in all but at most one poll but not swing states in 2008 or 2012 76
Non-swing states
dark red -- D lead with at least 50% in at least two polls 199
dark blue -- R lead with at least 50% in at least two polls 32
Gray -- I have no idea (no suitable analogues) 12
I see America much less polarized now than it was in 2008 or 2012.
Title: Re: 2016 Official Polling Map Thread
Post by: eric82oslo on October 14, 2014, 03:21:12 PM
With two new states polled for the very first time just today - Maryland and Idaho - I figured it would be time to update this ranking of states once more. :) There have also been released 7 more polls since my last update.
To find out which state would be the most likely tipping point state in 2016 based on all the data gathered so far (from 193 individual polls across 34 states), I've worked out this list of states going from likely Democratic to likely Republican (assuming that the non-polled states stay the same as in 2012):
1. D.C. - 3 EVs (still not polled)
2. Hawaii - 7 EVs (accumulated) (still not polled)
3. Vermont - 10 EVs (still not polled)
4. Rhode Island - 14 EVs (still not polled)
5. New York - 43 EVs
6. Massachusetts - 54 EVs (still not polled)
7. Delaware - 57 EVs (still not polled)
8. Illinois - 77 EVs (still not polled)
9. Maryland - 87 EVs
10. Washington - 99 EVs (still not polled)
11. New Mexico - 104 EVs
12. Oregon - 111 EVs
13. California - 166 EVs
14. Connecticut - 173 EVs
15. New Jersey - 187 EVs
16. Maine - 191 EVs
17. Michigan - 207 EVs
18. Ohio - 225 EVs
19. Florida - 254 EVs
20. Minnesota - 264 EVs
21. Virginia - 277 EVs - currently the most likely tipping point state
22. Wisconsin - 287 EVs
23. Pennsylvania - 307 EVs
24. Nevada - 313 EVs
25. New Hampshire - 317 EVs
26. North Carolina - 332 EVs
---current red/blue divide---
27. Georgia - 348 EVs
28. Iowa - 354 EVs
29. Arizona - 365 EVs
30. Colorado - 374 EVs
31. Louisiana - 382 EVs
32. Kentucky - 390 EVs
33. South Carolina - 399 EVs
34. Mississippi - 405 EVs
35. Alaska - 408 EVs
36. Texas - 446 EVs
37. Kansas - 452 EVs
38. Missouri - 462 EVs (still not polled)
39. Indiana - 473 EVs (still not polled)
40. Arkansas - 479 EVs
41. Montana - 482 EVs
42. West Virginia - 487 EVs
43. South Dakota - 490 EVs (still not polled)
44. Idaho - 494 EVs
45. North Dakota - 497 EVs (still not polled)
46. Tennessee - 508 EVs (still not polled)
47. Nebraska - 513 EVs (still not polled)
48. Alabama - 522 EVs (still not polled)
49. Wyoming - 525 EVs
50. Oklahoma - 532 EVs (still not polled)
51. Utah - 538 EVs (still not polled)
Not the really big changes since the last update, although both Maryland and Idaho moved considerably towards the center. Virginia remains the tipping point state for now, although at least 7 more states come really close as well (Wisconsin, Pennsylvania, Nevada, Minnesota, Florida, Ohio & Michigan).
Updated today, October 14!
Title: Re: 2016 Official Polling Map Thread
Post by: pbrower2a on October 14, 2014, 03:27:29 PM
Its telling that the Hillary vs. Best Republican map is roughly equivalent to Obama's 2012 win. Not only that, but there is no 'best' Republican who does this well in every state. All the candidates have strengths and weaknesses and fall short of this ideal scenario.
There just isn't much wiggle room for any Republican. I find it hard to believe that Hillary could do better than any Democratic nominee in Florida since FDR in 1944, and I can't imagine it as anything other than a swing state in 2016.
Title: Re: 2016 Official Polling Map Thread
Post by: Person Man on October 27, 2014, 08:56:10 PM
What's interesting is that though Bush seems to be able to compete with Hillary, he seems to negate all of Hillary's weaknesses.
Title: Re: 2016 Official Polling Map Thread
Post by: Mehmentum on October 30, 2014, 10:27:34 PM
What's interesting is that though Bush seems to be able to compete with Hillary, he seems to negate all of Hillary's weaknesses.
Title: Re: 2016 Official Polling Map Thread
Post by: pbrower2a on November 01, 2014, 01:20:43 PM
Hillary 47 Kasich 43
Hillary 48 Bush 38
Hillary 46 Christie 39
Hillary 49 Perry 39
Hillary 49 Paul 40
http://www.foxnews.com/politics/interactive/2014/10/31/fox-news-poll-ohio-governors-race/
Hillary Clinton vs. Jeb Bush
(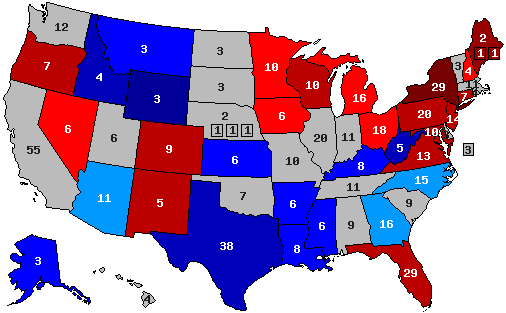 )
)
Hillary Clinton vs. Chris Christie
(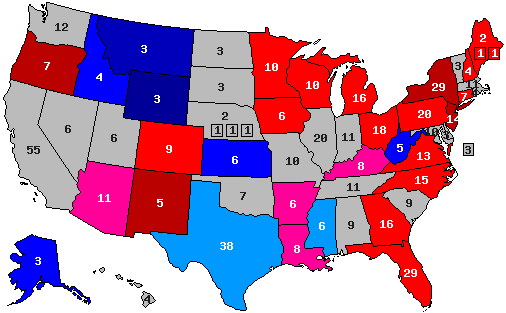 )
)
Hillary Clinton vs. Mike Huckabee
( )
)
Hillary Clinton vs. Rand Paul
( )
)
blue, Republican -- red, Democratic
30% -- lead with 40-49% but a margin of 3% or less
40% -- lead with 40-49% but a margin of 4% or more
60% -- lead with 50-54%
70% -- lead with 55-59%
90% -- lead with 60% or more
No change to the general projection, although these decisive leads would be a disaster for the GOP. Out of politeness at this stage I keep showing Ohio as a legitimate swing state.
Hillary 48 Bush 38
Hillary 46 Christie 39
Hillary 49 Perry 39
Hillary 49 Paul 40
http://www.foxnews.com/politics/interactive/2014/10/31/fox-news-poll-ohio-governors-race/
Hillary Clinton vs. Jeb Bush
(
Hillary Clinton vs. Chris Christie
(
Hillary Clinton vs. Mike Huckabee
(
Hillary Clinton vs. Rand Paul
(
blue, Republican -- red, Democratic
30% -- lead with 40-49% but a margin of 3% or less
40% -- lead with 40-49% but a margin of 4% or more
60% -- lead with 50-54%
70% -- lead with 55-59%
90% -- lead with 60% or more
No change to the general projection, although these decisive leads would be a disaster for the GOP. Out of politeness at this stage I keep showing Ohio as a legitimate swing state.
Title: Re: 2016 Official Polling Map Thread
Post by: Person Man on November 15, 2014, 08:54:49 PM
It looks like mainstream Republicans do worse against Hillary, not better.
Title: Re: 2016 Official Polling Map Thread
Post by: pbrower2a on November 16, 2014, 06:25:19 AM
It looks like mainstream Republicans do worse against Hillary, not better.
Define "mainstream". The GOP has gone from center-right conservatism (Nixon era) to full-bore support of a plutocratic oligarchy. It has become largely the political arm of the powerful Koch family, and it reflects one of the most reactionary currents in the free world.
Title: Re: 2016 Official Polling Map Thread
Post by: Person Man on November 17, 2014, 03:57:37 PM
Well, by mainstream, I mean "balanced", establishment conservatives and neoconservatives, not paleos like Paul or fundies like Huckabee.
Title: Re: 2016 Official Polling Map Thread
Post by: Lief 🗽 on November 17, 2014, 08:17:17 PM
That's mostly because you have teabaggers who say they're undecided in Clinton v. mainstream Republican matchups, I would guess. They'll come home by election day.
Title: Re: 2016 Official Polling Map Thread
Post by: Mehmentum on November 17, 2014, 08:26:37 PM
That's mostly because you have teabaggers who say they're undecided in Clinton v. mainstream Republican matchups, I would guess. They'll come home by election day.
Title: Re: 2016 Official Polling Map Thread
Post by: Person Man on November 18, 2014, 02:47:34 PM
That's mostly because you have teabaggers who say they're undecided in Clinton v. mainstream Republican matchups, I would guess. They'll come home by election day.
Title: Re: 2016 Official Polling Map Thread
Post by: pbrower2a on November 24, 2014, 11:53:31 AM
First post-election poll in 2014:
http://www.businessweek.com/pdfs/bloomberg-saint-anselm-purple-NH-survey-Q1-to-Q9-11-2014.pdf
Bloomberg is about as reputable a journalistic source as there is, and Hillary Clinton shows no sign of taking a hit from the GOP wave. Republicans will need a similar wave to win the Presidency or to hold the US Senate.
Hillary Clinton vs. Jeb Bush
()
Hillary Clinton vs. Chris Christie
()
Hillary Clinton vs. Mike Huckabee
(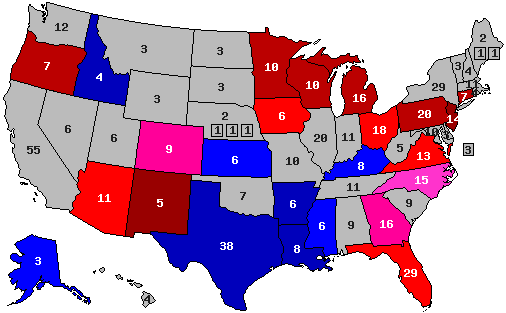 )
)
Hillary Clinton vs. Rand Paul
(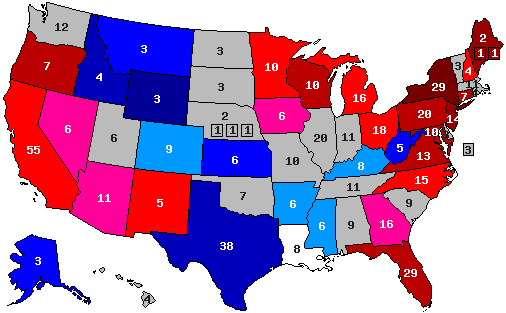 )
)
blue, Republican -- red, Democratic
30% -- lead with 40-49% but a margin of 3% or less
40% -- lead with 40-49% but a margin of 4% or more
60% -- lead with 50-54%
70% -- lead with 55-59%
90% -- lead with 60% or more
No change to the general projection, although these decisive leads would be a disaster for the GOP. Out of politeness at this stage I keep showing Ohio as a legitimate swing state.
Quote
46-45 Hillary/Romney
47-39 Hillary/Bush
48-41 Hillary/Paul
The Bloomberg Politics/St. Anselm New Hampshire poll was conducted Nov. 12-18 and surveyed a base sample of 500 likely 2016 general election voters with a margin of error of plus or minus 4.4 percentage points, as well as 407 likely Republican presidential primary voters and 404 likely Democratic presidential primary voters, each with a margin of error of plus or minus 4.4 percentage points.
http://www.businessweek.com/pdfs/bloomberg-saint-anselm-purple-NH-survey-Q1-to-Q9-11-2014.pdf
Bloomberg is about as reputable a journalistic source as there is, and Hillary Clinton shows no sign of taking a hit from the GOP wave. Republicans will need a similar wave to win the Presidency or to hold the US Senate.
Hillary Clinton vs. Jeb Bush
(
Hillary Clinton vs. Chris Christie
(
Hillary Clinton vs. Mike Huckabee
(
Hillary Clinton vs. Rand Paul
(
blue, Republican -- red, Democratic
30% -- lead with 40-49% but a margin of 3% or less
40% -- lead with 40-49% but a margin of 4% or more
60% -- lead with 50-54%
70% -- lead with 55-59%
90% -- lead with 60% or more
No change to the general projection, although these decisive leads would be a disaster for the GOP. Out of politeness at this stage I keep showing Ohio as a legitimate swing state.
Title: Re: 2016 Official Polling Map Thread
Post by: pbrower2a on December 11, 2014, 01:21:43 PM
PPP, North Carolina:
Clinton- 46%
Bush- 46%
Clinton- 44%
Carson- 44%
Clinton- 44%
Christie- 42%
Clinton- 46%
Huckabee- 44%
Quinnipiac, New Jersey:
50-39 Hillary/Christie
52-35 Hillary/Romney
53-31 Hillary/Bush
55-31 Hillary/Paul
Favorables:
58-35 Hillary
45-47 Christie
25-32 Paul
25-35 Bush
36-48 Romney
Obama approval:
46-50 disapprove
From December 3 - 8, Quinnipiac University surveyed 1,340 registered voters, with a margin of error of +/- 2.7 percentage points. Live interviewers call land lines and cell phones.
http://www.quinnipiac.edu/news-and-events/quinnipiac-university-poll/new-jersey/release-detail?ReleaseID=2118
Hillary Clinton vs. Jeb Bush
(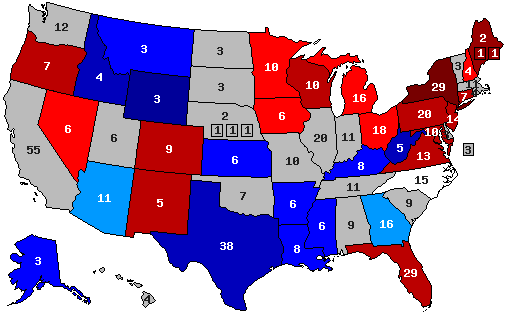 )
)
Hillary Clinton vs. Chris Christie
(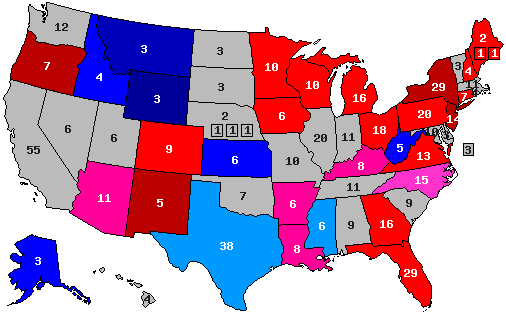 )
)
Hillary Clinton vs. Mike Huckabee
()
Hillary Clinton vs. Rand Paul
()
blue, Republican -- red, Democratic
30% -- lead with 40-49% but a margin of 3% or less
40% -- lead with 40-49% but a margin of 4% or more
60% -- lead with 50-54%
70% -- lead with 55-59%
90% -- lead with 60% or more
No change to the general projection, although these decisive leads would be a disaster for the GOP. Out of politeness at this stage I keep showing Ohio as a legitimate swing state.
Clinton- 46%
Bush- 46%
Clinton- 44%
Carson- 44%
Clinton- 44%
Christie- 42%
Clinton- 46%
Huckabee- 44%
Quinnipiac, New Jersey:
50-39 Hillary/Christie
52-35 Hillary/Romney
53-31 Hillary/Bush
55-31 Hillary/Paul
Favorables:
58-35 Hillary
45-47 Christie
25-32 Paul
25-35 Bush
36-48 Romney
Obama approval:
46-50 disapprove
From December 3 - 8, Quinnipiac University surveyed 1,340 registered voters, with a margin of error of +/- 2.7 percentage points. Live interviewers call land lines and cell phones.
http://www.quinnipiac.edu/news-and-events/quinnipiac-university-poll/new-jersey/release-detail?ReleaseID=2118
Hillary Clinton vs. Jeb Bush
(
Hillary Clinton vs. Chris Christie
(
Hillary Clinton vs. Mike Huckabee
(
Hillary Clinton vs. Rand Paul
(
blue, Republican -- red, Democratic
30% -- lead with 40-49% but a margin of 3% or less
40% -- lead with 40-49% but a margin of 4% or more
60% -- lead with 50-54%
70% -- lead with 55-59%
90% -- lead with 60% or more
No change to the general projection, although these decisive leads would be a disaster for the GOP. Out of politeness at this stage I keep showing Ohio as a legitimate swing state.
Title: Re: 2016 Official Polling Map Thread
Post by: IceSpear on December 11, 2014, 04:21:28 PM
It's actually Clinton 46, Huckabee 44.
Title: Re: 2016 Official Polling Map Thread
Post by: pbrower2a on December 11, 2014, 09:01:28 PM
It's actually Clinton 46, Huckabee 44.
Map changed accordingly. Thank you.
North Carolina is an absolute must-win for the GOP in 2016 for both the Presidency and the Senate.
Title: Re: 2016 Official Polling Map Thread
Post by: pbrower2a on December 23, 2014, 06:00:17 PM
New York, Quinnipiac, yawn. Fourth state since the 2014 election.
Former Secretary of State Hillary Clinton and Gov. Cuomo both top leading Republican contenders in New York State in an early look at the 2016 presidential campaign. Clinton is up:
60 - 29 percent over former Florida Gov. Jeb Bush;
61 - 26 percent over U.S. Sen. Rand Paul of Kentucky;
57 - 31 percent over New Jersey Gov. Christopher Christie.
Clinton's leads range from 14 to 24 percentage points among men and 36 to 44 percentage points among women.
Cuomo tops leading Republicans by smaller margins:
51 - 31 percent over Jeb Bush;
56 - 28 percent over Paul;
49 - 35 percent over Christie.
Hillary Clinton vs. Jeb Bush
()
Hillary Clinton vs. Chris Christie
(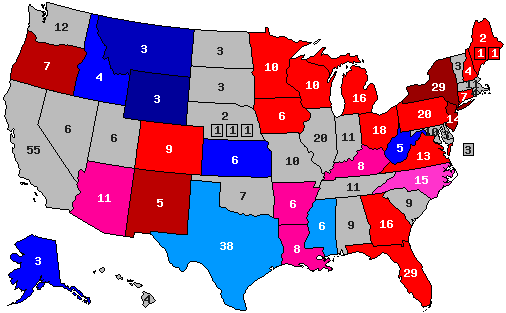 )
)
Hillary Clinton vs. Mike Huckabee
()
Hillary Clinton vs. Rand Paul
()
blue, Republican -- red, Democratic
30% -- lead with 40-49% but a margin of 3% or less
40% -- lead with 40-49% but a margin of 4% or more
60% -- lead with 50-54%
70% -- lead with 55-59%
90% -- lead with 60% or more
No change to the general projection, although these decisive leads would be a disaster for the GOP. Out of politeness at this stage I keep showing Ohio as a legitimate swing state.
Former Secretary of State Hillary Clinton and Gov. Cuomo both top leading Republican contenders in New York State in an early look at the 2016 presidential campaign. Clinton is up:
60 - 29 percent over former Florida Gov. Jeb Bush;
61 - 26 percent over U.S. Sen. Rand Paul of Kentucky;
57 - 31 percent over New Jersey Gov. Christopher Christie.
Clinton's leads range from 14 to 24 percentage points among men and 36 to 44 percentage points among women.
Cuomo tops leading Republicans by smaller margins:
51 - 31 percent over Jeb Bush;
56 - 28 percent over Paul;
49 - 35 percent over Christie.
Hillary Clinton vs. Jeb Bush
(
Hillary Clinton vs. Chris Christie
(
Hillary Clinton vs. Mike Huckabee
(
Hillary Clinton vs. Rand Paul
(
blue, Republican -- red, Democratic
30% -- lead with 40-49% but a margin of 3% or less
40% -- lead with 40-49% but a margin of 4% or more
60% -- lead with 50-54%
70% -- lead with 55-59%
90% -- lead with 60% or more
No change to the general projection, although these decisive leads would be a disaster for the GOP. Out of politeness at this stage I keep showing Ohio as a legitimate swing state.
Title: Re: 2016 Official Polling Map Thread
Post by: pbrower2a on January 14, 2015, 01:29:17 AM
PPP will be polling the state in which Erie is in the northwestern corner (so written so that I can avoid excessive alliteration).
Yes, it's Pennsylvania. Plenty to poll. First of 2015, fifth state after the 2014 election.
http://www.publicpolicypolling.com/main/2015/01/pennsylvania-question-suggestions.html#comments
Yes, it's Pennsylvania. Plenty to poll. First of 2015, fifth state after the 2014 election.
http://www.publicpolicypolling.com/main/2015/01/pennsylvania-question-suggestions.html#comments
Title: Re: 2016 Official Polling Map Thread
Post by: pbrower2a on January 14, 2015, 01:46:29 AM
I am bringing back this material on a State that rarely gets polled -- Indiana:
Indiana usually says something; it is about 10% more R than the rest of America in almost every Presidential election. Barack Obama campaigned heavily in Indiana and sank vast resources into the state to win it in 2008 and did not do so in 2012. He lost it by 10% in 2012 -- which should be a huge disappointment. Right?
Year margin
2012 10R
2008 1D
2004 21R
2000 16R
1996 6R*
1992 6R*
1988 20R
1984 24R
1980 18R*
1976 8R
1972 33R
1968 12R*
1964 12D
1960 10R
1956 20R
1952 17R
1948 1R
1944 7R
1940 1R
*Independent or third-party nominee may have had an effect. Bold is for the Democratic nominee winning the state. Bold indicates that the Democratic nominee won the state. Dark shades indicate electoral blowouts. Red -- the Democrat won the Presidential election in electoral and popular votes. Blue -- the Republican won the Presidential election in electoral and popular votes. Purple -- split on electoral and popular votes.
Wrong. Barack Obama campaigned extensively in Indiana in 2008 and won it -- and was effective enough in winning a raft of states that neither Gore nor Kerry won. He stayed out of Indiana in 2012 and lost it because he needed a laser focus on a small number of states that could decide the election. If he was going to win Indiana he was going to win Ohio anyway, but Ohio was easier for him to win against an opponent who could have overpowered him with campaign funds.
Indiana has gone for the Republican nominee for President in 18 of the last 20 chances. This goes back to two elections involving FDR. Democratic nominees have won the popular vote 9 times and the Presidency 8 times -- and Republican nominees have won the popular vote 11 times and the Presidency 12 times.
The Republicans seem unable to win the Presidency if the Democrat loses the state by less than 11%. If Indiana votes by more than 11% for the Republican, then the Republican wins at the least the Electoral College (which is everything).
If you see the Republican nominee winning Indiana early in 2016 on Election Day but by a comparatively-small margin (let us say 7%), then it will be a bad night for the GOP.
Title: Re: 2016 Official Polling Map Thread
Post by: pbrower2a on January 22, 2015, 01:41:16 PM
Pennsylvania, PPP. If Hillary Clinton is the nominee, then the road to a Republican Presidency is not the Pennsylvania Turnpike. Romney could win against Biden or Warren, though.
Clinton -49%
Christie- 39%
Clinton- 49%
Bush- 38%
Clinton- 51%
Carson- 37%
Clinton- 51%
Huckabee- 39%
Clinton- 50%
Paul- 39%
Clinton- 50%
Romney- 40%
Clinton- 52%
Santorum- 36%
Romney- 43%
Biden- 41%
Romney- 44%
Warren- 36%
http://www.publicpolicypolling.com/pdf/PPP_Release_122925.pdf
Hillary Clinton vs. Jeb Bush
()
Hillary Clinton vs. Chris Christie
()
Hillary Clinton vs. Mike Huckabee
()
Hillary Clinton vs. Rand Paul
()
blue, Republican -- red, Democratic
30% -- lead with 40-49% but a margin of 3% or less
40% -- lead with 40-49% but a margin of 4% or more
60% -- lead with 50-54%
70% -- lead with 55-59%
90% -- lead with 60% or more
No change to the general projection, although these decisive leads would be a disaster for the GOP. Out of politeness at this stage I keep showing Ohio as a legitimate swing state.
[/quote]
Clinton -49%
Christie- 39%
Clinton- 49%
Bush- 38%
Clinton- 51%
Carson- 37%
Clinton- 51%
Huckabee- 39%
Clinton- 50%
Paul- 39%
Clinton- 50%
Romney- 40%
Clinton- 52%
Santorum- 36%
Romney- 43%
Biden- 41%
Romney- 44%
Warren- 36%
http://www.publicpolicypolling.com/pdf/PPP_Release_122925.pdf
Hillary Clinton vs. Jeb Bush
(
Hillary Clinton vs. Chris Christie
(
Hillary Clinton vs. Mike Huckabee
(
Hillary Clinton vs. Rand Paul
(
blue, Republican -- red, Democratic
30% -- lead with 40-49% but a margin of 3% or less
40% -- lead with 40-49% but a margin of 4% or more
60% -- lead with 50-54%
70% -- lead with 55-59%
90% -- lead with 60% or more
No change to the general projection, although these decisive leads would be a disaster for the GOP. Out of politeness at this stage I keep showing Ohio as a legitimate swing state.
[/quote]
Title: Re: 2016 Official Polling Map Thread
Post by: pbrower2a on January 22, 2015, 04:36:36 PM
Using only polls following the 2014 election, and I add Mitt Romney with the expectation that someone will drop out of consideration.
Hillary Clinton vs. Jeb Bush
(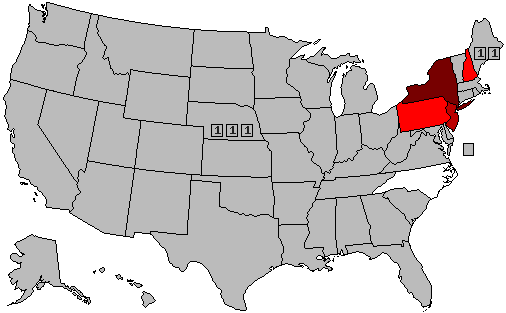 )
)
Hillary Clinton vs. Chris Christie
(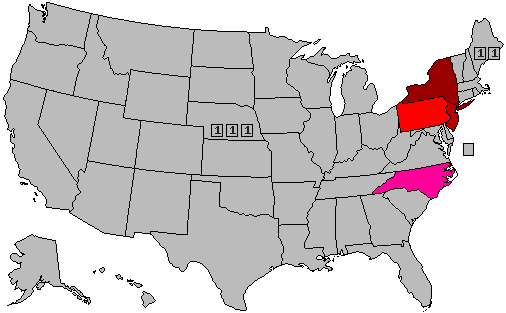 )
)
Hillary Clinton vs. Mike Huckabee
(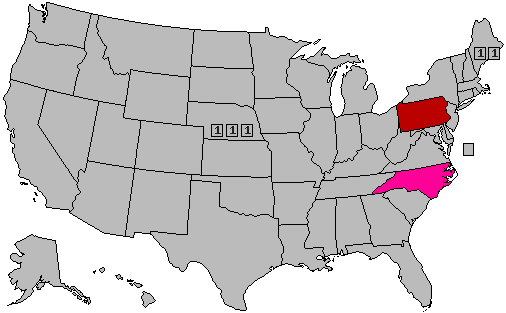 )
)
Hillary Clinton vs. Rand Paul
(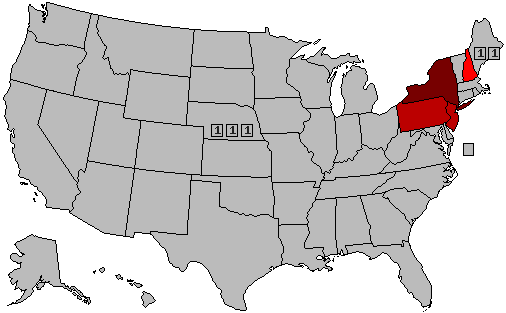 )
)
Hillary Clinton vs. Mitt Romney
(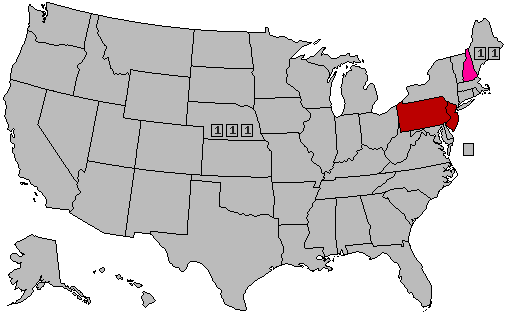 )
)
30% -- lead with 40-49% but a margin of 3% or less
40% -- lead with 40-49% but a margin of 4% or more
60% -- lead with 50-54%
70% -- lead with 55-59%
90% -- lead with 60% or more
Hillary Clinton vs. Jeb Bush
(
Hillary Clinton vs. Chris Christie
(
Hillary Clinton vs. Mike Huckabee
(
Hillary Clinton vs. Rand Paul
(
Hillary Clinton vs. Mitt Romney
(
30% -- lead with 40-49% but a margin of 3% or less
40% -- lead with 40-49% but a margin of 4% or more
60% -- lead with 50-54%
70% -- lead with 55-59%
90% -- lead with 60% or more
Title: Re: 2016 Official Polling Map Thread
Post by: pbrower2a on January 22, 2015, 04:42:13 PM
Q, New Jersey. This supplants a post-election poll.
http://www.quinnipiac.edu/news-and-events/quinnipiac-university-poll/new-jersey/release-detail?ReleaseID=2127
Clinton 52%
Christie 39%
Clinton 53%
Bush 37%
Clinton 54%
Paul 35%
Clinton 56%
Huckabee 33%
Clinton 53%
Romney 38%
Hillary Clinton vs. Jeb Bush
()
Hillary Clinton vs. Chris Christie
()
Hillary Clinton vs. Mike Huckabee
(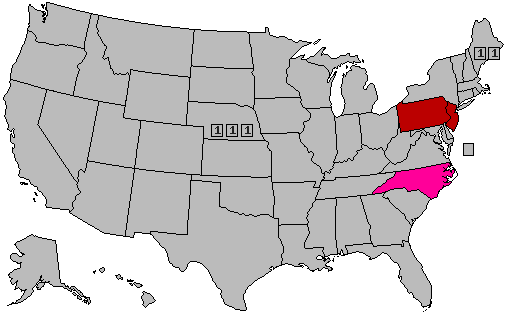 )
)
Hillary Clinton vs. Rand Paul
()
Hillary Clinton vs. Mitt Romney
()
30% -- lead with 40-49% but a margin of 3% or less
40% -- lead with 40-49% but a margin of 4% or more
60% -- lead with 50-54%
70% -- lead with 55-59%
90% -- lead with 60% or more
http://www.quinnipiac.edu/news-and-events/quinnipiac-university-poll/new-jersey/release-detail?ReleaseID=2127
Clinton 52%
Christie 39%
Clinton 53%
Bush 37%
Clinton 54%
Paul 35%
Clinton 56%
Huckabee 33%
Clinton 53%
Romney 38%
Hillary Clinton vs. Jeb Bush
(
Hillary Clinton vs. Chris Christie
(
Hillary Clinton vs. Mike Huckabee
(
Hillary Clinton vs. Rand Paul
(
Hillary Clinton vs. Mitt Romney
(
30% -- lead with 40-49% but a margin of 3% or less
40% -- lead with 40-49% but a margin of 4% or more
60% -- lead with 50-54%
70% -- lead with 55-59%
90% -- lead with 60% or more
Title: Re: 2016 Official Polling Map Thread
Post by: Mehmentum on January 22, 2015, 04:45:35 PM
I suspect that Chris Christie will be the one being dropped.
Title: Re: 2016 Official Polling Map Thread
Post by: pbrower2a on January 22, 2015, 10:28:42 PM
I suspect that Chris Christie will be the one being dropped.
There was supposed to be a meeting between Jeb Bush and Mitt Romney.
Title: Re: 2016 Official Polling Map Thread
Post by: pbrower2a on January 24, 2015, 11:30:56 PM
Polls that I would most like to see (and figure are likely to be shown):
1. Florida. We can decide once and for all whether Marco Rubio has any relevancy to the Presidential campaign.
2. Ohio. Has voted right in every Presidential election since 1960.
3. Colorado. Terribly ambiguous in 2014.
4. Wisconsin. Is Scott Walker a genuine possibility?
5. Nevada. Is Harry Reid holding his ground politically?
6. Georgia. A campaign-killer for any Republican who loses this state -- and there is an obvious choice to challenge Isakson.
7. Missouri. We can see whether Hillary Clinton can win back some Clinton-but-not-Obama voters there. It has potentially a weak Senate incumbent. Surprisingly similar to Georgia in its voting habits, but six fewer electoral votes than Georgia.
8. New Hampshire. How well is Kelly Ayotte doing in a D-leaning state? If she loses her seat, then the Democrats are nearly sure to end up with an effective majority in the Senate because the Vice-President will be the President of the Senate and have the deciding vote.
9. Virginia. No Sen ate seat, but very close to being the tipping-point state for the Presidency.
10. Indiana. Lots of luck on getting a reliable Indiana poll. If Indiana is a 10-point or less loss for the Democratic Presidential nominee, then the Democrat wins.
Tie for 11 -- and highly contingent -- Arizona (in case the health of John McCain goes bad) or Iowa (likewise for Chuck Grassley).
Title: Re: 2016 Official Polling Map Thread
Post by: pbrower2a on January 29, 2015, 06:09:04 PM
PPP will have a poll of North Carolina this weekend. North Carolina has been an interesting state for the last six years. We might get to add a couple spots on the map. I might have been interested in something else this week... but don't worry. We will have a near surfeit of Presidential polls soon enough.
Title: Re: 2016 Official Polling Map Thread
Post by: pbrower2a on January 30, 2015, 12:47:28 PM
Mitt Romney has said that he is dropping out of consideration. One of his key campaign strategists went to Jeb Bush, which so suggested.
Hillary Clinton vs. Jeb Bush
()
Hillary Clinton vs. Chris Christie
()
Hillary Clinton vs. Mike Huckabee
()
Hillary Clinton vs. Rand Paul
()
Hillary Clinton vs. mystery meat
(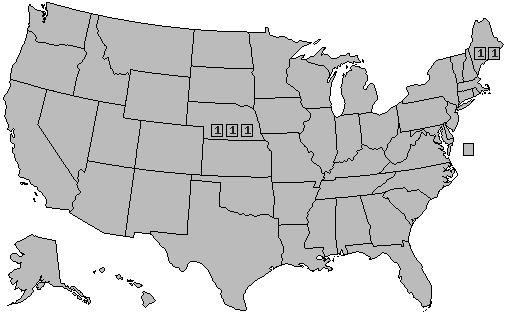 )
)
30% -- lead with 40-49% but a margin of 3% or less
40% -- lead with 40-49% but a margin of 4% or more
60% -- lead with 50-54%
70% -- lead with 55-59%
90% -- lead with 60% or more
(Scott "I will give liberals cause to emigrate" Walker reached 11% in a nationwide primary poll by PPP... so he could replace "mystery meat").
Hillary Clinton vs. Jeb Bush
(
Hillary Clinton vs. Chris Christie
(
Hillary Clinton vs. Mike Huckabee
(
Hillary Clinton vs. Rand Paul
(
Hillary Clinton vs. mystery meat
(
30% -- lead with 40-49% but a margin of 3% or less
40% -- lead with 40-49% but a margin of 4% or more
60% -- lead with 50-54%
70% -- lead with 55-59%
90% -- lead with 60% or more
(Scott "I will give liberals cause to emigrate" Walker reached 11% in a nationwide primary poll by PPP... so he could replace "mystery meat").
Title: Re: 2016 Official Polling Map Thread
Post by: pbrower2a on February 03, 2015, 12:25:10 AM
This is from April 2014 (PPP)
Q7 If the candidates for President next time were
Democrat Hillary Clinton and Republican Scott
Walker, who would you vote for?
Hillary Clinton.................................................. 51%
Scott Walker ................................................... 44%
Not sure .......................................................... 6%
Hillary Clinton vs. Scott Walker
(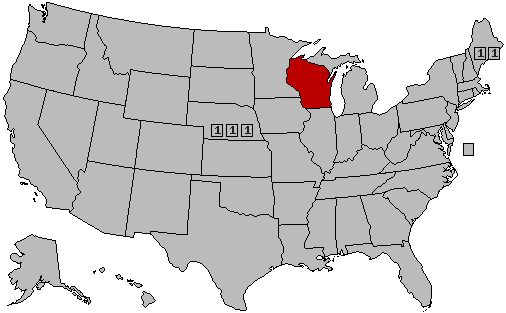 )
)
30% -- lead with 40-49% but a margin of 3% or less
40% -- lead with 40-49% but a margin of 4% or more
60% -- lead with 50-54%
70% -- lead with 55-59%
90% -- lead with 60% or more
(Scott "I will give liberals cause to emigrate" Walker reached 11% in a nationwide primary poll by PPP... so he could replace "mystery meat").
Q7 If the candidates for President next time were
Democrat Hillary Clinton and Republican Scott
Walker, who would you vote for?
Hillary Clinton.................................................. 51%
Scott Walker ................................................... 44%
Not sure .......................................................... 6%
Hillary Clinton vs. Scott Walker
(
30% -- lead with 40-49% but a margin of 3% or less
40% -- lead with 40-49% but a margin of 4% or more
60% -- lead with 50-54%
70% -- lead with 55-59%
90% -- lead with 60% or more
(Scott "I will give liberals cause to emigrate" Walker reached 11% in a nationwide primary poll by PPP... so he could replace "mystery meat").
Title: Re: 2016 Official Polling Map Thread
Post by: pbrower2a on February 03, 2015, 07:50:44 AM
Quinnipiac -- three electorally big states (FL, OH, PA). This corroborates PPP in the Keystone State and offers valuable information on two states not polled after Election 2014.
Republicans FLOP against Clinton... get it? I wouldn't use that acronym except with this combination of states.
http://www.quinnipiac.edu/news-and-events/quinnipiac-university-poll/2016-presidential-swing-state-polls/release-detail?ReleaseID=2130
Florida
Clinton 51%
Christie 33%
Clinton 44%
Bush 43%
Clinton 50%
Paul 38%
Clinton 51%
Huckabee 34%
Clinton 50%
Romney 37%
Clinton 49%
Rubio 39%
Ohio
Clinton 47%
Christie 33%
Clinton 47%
Bush 36%
Clinton 48%
Paul 36%
Clinton 49%
Huckabee 34%
Clinton 49%
Romney 37%
Clinton 44%
Kasich 43%
Pennsylvania
Clinton 50%
Christie 39%
Clinton 50%
Bush 35%
Clinton 53%
Paul 34%
Clinton 54%
Huckabee 34%
Clinton 53%
Romney 36%
Clinton 54%
Santorum 34%
...I'm showing Mitt Romney because he may have had indications that he was going to do this badly in Florida, Ohio, and Pennsylvania. If he did, then we have some possible insight on why he dropped out of contention.
Hillary Clinton vs. Jeb Bush
(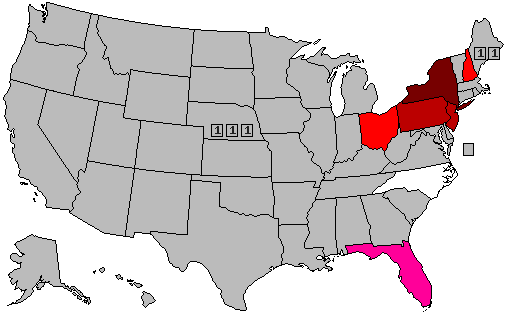 )
)
Hillary Clinton vs. Chris Christie
(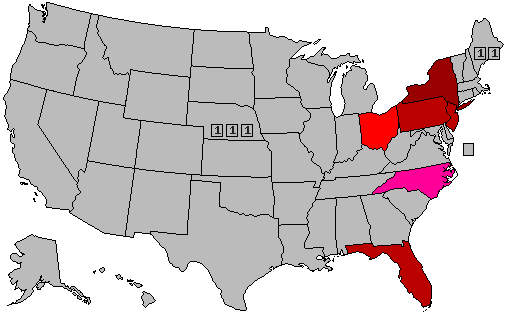 )
)
Hillary Clinton vs. Mike Huckabee
(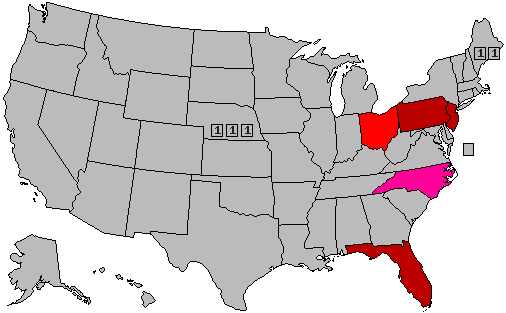 )
)
Hillary Clinton vs. Rand Paul
(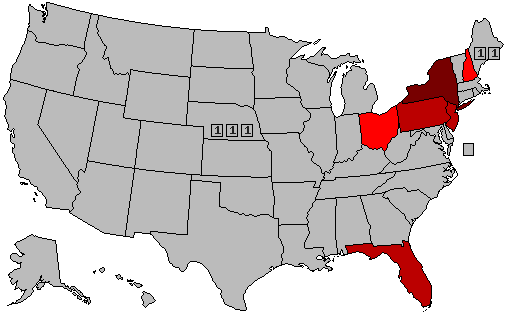 )
)
Hillary Clinton vs. Mitt Romney
(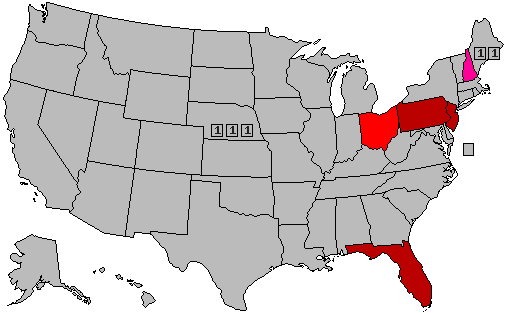 )
)
30% -- lead with 40-49% but a margin of 3% or less
40% -- lead with 40-49% but a margin of 4% or more
60% -- lead with 50-54%
70% -- lead with 55-59%
90% -- lead with 60% or more
Republicans FLOP against Clinton... get it? I wouldn't use that acronym except with this combination of states.
http://www.quinnipiac.edu/news-and-events/quinnipiac-university-poll/2016-presidential-swing-state-polls/release-detail?ReleaseID=2130
Florida
Clinton 51%
Christie 33%
Clinton 44%
Bush 43%
Clinton 50%
Paul 38%
Clinton 51%
Huckabee 34%
Clinton 50%
Romney 37%
Clinton 49%
Rubio 39%
Ohio
Clinton 47%
Christie 33%
Clinton 47%
Bush 36%
Clinton 48%
Paul 36%
Clinton 49%
Huckabee 34%
Clinton 49%
Romney 37%
Clinton 44%
Kasich 43%
Pennsylvania
Clinton 50%
Christie 39%
Clinton 50%
Bush 35%
Clinton 53%
Paul 34%
Clinton 54%
Huckabee 34%
Clinton 53%
Romney 36%
Clinton 54%
Santorum 34%
...I'm showing Mitt Romney because he may have had indications that he was going to do this badly in Florida, Ohio, and Pennsylvania. If he did, then we have some possible insight on why he dropped out of contention.
Hillary Clinton vs. Jeb Bush
(
Hillary Clinton vs. Chris Christie
(
Hillary Clinton vs. Mike Huckabee
(
Hillary Clinton vs. Rand Paul
(
Hillary Clinton vs. Mitt Romney
(
30% -- lead with 40-49% but a margin of 3% or less
40% -- lead with 40-49% but a margin of 4% or more
60% -- lead with 50-54%
70% -- lead with 55-59%
90% -- lead with 60% or more
Title: Re: 2016 Official Polling Map Thread
Post by: pbrower2a on February 03, 2015, 07:55:03 AM
This is telling about Mitt Romney (from Q):
14. Is your opinion of Mitt Romney favorable, unfavorable or haven't you heard enough about him?
FL OH PA
Favorable 40% 37% 39%
Unfavorable 46 48 50
Hvn't hrd enough 12 12 10
REFUSED 3 2 2
A 36-36 split on favorability involving Marco Rubio in Florida suggests that he would be vulnerable in a bid for re-election to the US Senate.
Title: Re: 2016 Official Polling Map Thread
Post by: pbrower2a on February 04, 2015, 12:37:22 PM
PPP, North Carolina
Hillary Clinton.................................................. 44%
Jeb Bush......................................................... 44%
Hillary Clinton.................................................. 45%
Ben Carson..................................................... 45%
Hillary Clinton.................................................. 46%
Scott Walker ................................................... 44%
Hillary Clinton.................................................. 44%
Mitt Romney.................................................... 45%
Joe Biden........................................................ 41%
Mitt Romney.................................................... 48%
Elizabeth Warren ............................................ 39%
Mitt Romney.................................................... 47%
Hillary Clinton vs. Jeb Bush
(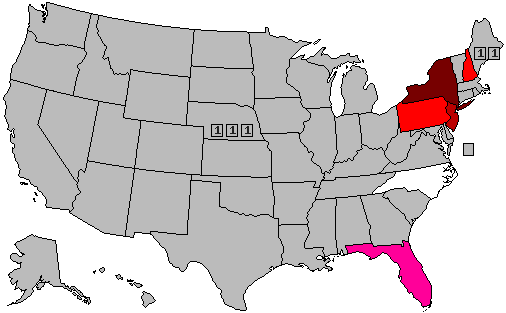 )
)
Hillary Clinton vs. Chris Christie
(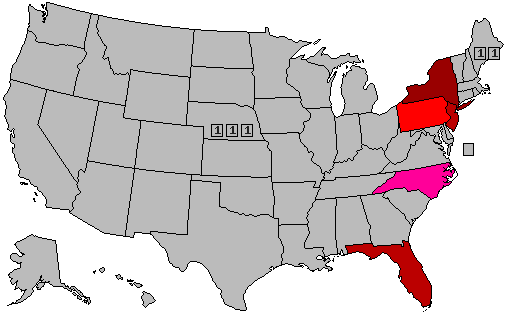 )
)
Hillary Clinton vs. Mike Huckabee
(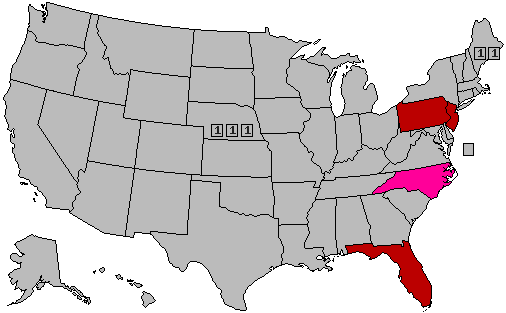 )
)
Hillary Clinton vs. Rand Paul
(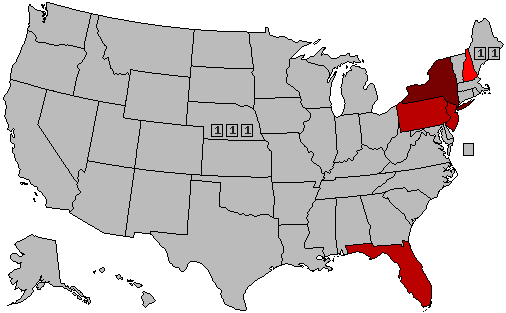 )
)
Hillary Clinton vs. Scott Walker
(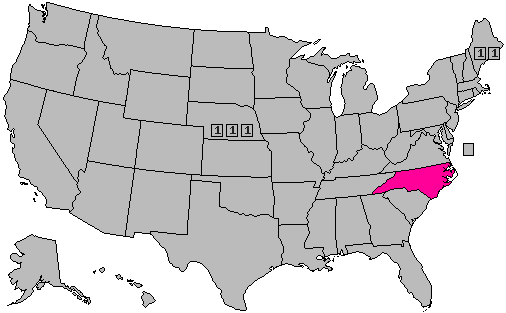 )
)
30% -- lead with 40-49% but a margin of 3% or less
40% -- lead with 40-49% but a margin of 4% or more
60% -- lead with 50-54%
70% -- lead with 55-59%
90% -- lead with 60% or more
(Scott "I will give liberals cause to emigrate" Walker reached 11% in a nationwide primary poll by PPP... so he could replace "mystery meat").
...No more "mystery meat".
Hillary Clinton.................................................. 44%
Jeb Bush......................................................... 44%
Hillary Clinton.................................................. 45%
Ben Carson..................................................... 45%
Hillary Clinton.................................................. 46%
Scott Walker ................................................... 44%
Hillary Clinton.................................................. 44%
Mitt Romney.................................................... 45%
Joe Biden........................................................ 41%
Mitt Romney.................................................... 48%
Elizabeth Warren ............................................ 39%
Mitt Romney.................................................... 47%
Hillary Clinton vs. Jeb Bush
(
Hillary Clinton vs. Chris Christie
(
Hillary Clinton vs. Mike Huckabee
(
Hillary Clinton vs. Rand Paul
(
Hillary Clinton vs. Scott Walker
(
30% -- lead with 40-49% but a margin of 3% or less
40% -- lead with 40-49% but a margin of 4% or more
60% -- lead with 50-54%
70% -- lead with 55-59%
90% -- lead with 60% or more
...No more "mystery meat".
Title: Re: 2016 Official Polling Map Thread
Post by: pbrower2a on February 04, 2015, 01:58:11 PM
Surprise! Romney would have edged Clinton in North Carolina.
Hillary Clinton vs. Mitt Romney
(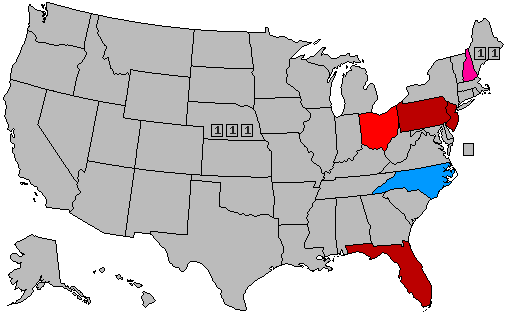 )
)
30% -- lead with 40-49% but a margin of 3% or less
40% -- lead with 40-49% but a margin of 4% or more
60% -- lead with 50-54%
70% -- lead with 55-59%
90% -- lead with 60% or more
Hillary Clinton vs. Mitt Romney
(
30% -- lead with 40-49% but a margin of 3% or less
40% -- lead with 40-49% but a margin of 4% or more
60% -- lead with 50-54%
70% -- lead with 55-59%
90% -- lead with 60% or more
Title: Re: 2016 Official Polling Map Thread
Post by: pbrower2a on February 11, 2015, 02:03:56 AM
Granite State/University of New Hampshire/WMUR-TV
Republicans would love to get at least one state in New England. Democrats haven't won the Presidency without New Hampshire since 1976.
Clinton 51% - Bush 39%
Clinton 50% - Paul 40%
No, they can expect to win nothing to the north and east of the Potomac.
http://cola.unh.edu/sites/cola.unh.edu/files/research_publications/gsp2015_winter_preselect020915.pdf
Hillary Clinton vs. Jeb Bush
( )
)
Hillary Clinton vs. Chris Christie
()
Hillary Clinton vs. Mike Huckabee
()
Hillary Clinton vs. Rand Paul
(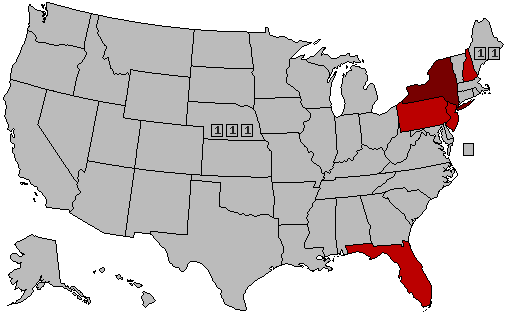 )
)
Hillary Clinton vs. Scott Walker
()
30% -- lead with 40-49% but a margin of 3% or less
40% -- lead with 40-49% but a margin of 4% or more
60% -- lead with 50-54%
70% -- lead with 55-59%
90% -- lead with 60% or more
Republicans would love to get at least one state in New England. Democrats haven't won the Presidency without New Hampshire since 1976.
Clinton 51% - Bush 39%
Clinton 50% - Paul 40%
No, they can expect to win nothing to the north and east of the Potomac.
http://cola.unh.edu/sites/cola.unh.edu/files/research_publications/gsp2015_winter_preselect020915.pdf
Hillary Clinton vs. Jeb Bush
(
Hillary Clinton vs. Chris Christie
(
Hillary Clinton vs. Mike Huckabee
(
Hillary Clinton vs. Rand Paul
(
Hillary Clinton vs. Scott Walker
(
30% -- lead with 40-49% but a margin of 3% or less
40% -- lead with 40-49% but a margin of 4% or more
60% -- lead with 50-54%
70% -- lead with 55-59%
90% -- lead with 60% or more
Title: Re: 2016 Official Polling Map Thread
Post by: pbrower2a on February 12, 2015, 01:13:04 PM
New Hampshire:
()
The average with a the Granite State/U-New Hampshire/WMUR-TV poll involving Rand Paul comes out to 49. Add Walker, though, in a state with a few similarities to his own state.
Hillary Clinton vs. Jeb Bush
(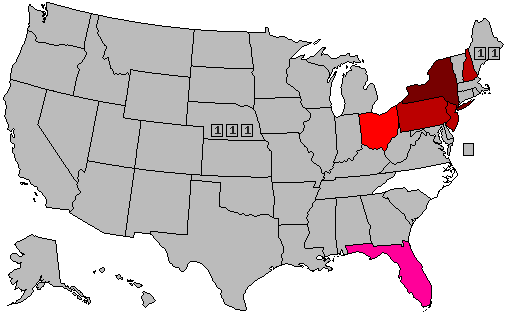 )
)
Hillary Clinton vs. Chris Christie
(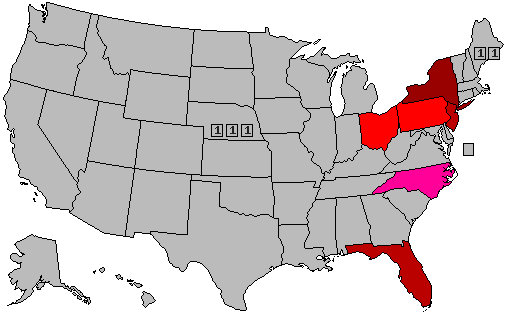 )
)
Hillary Clinton vs. Mike Huckabee
()
Hillary Clinton vs. Rand Paul
()
Hillary Clinton vs. Scott Walker
(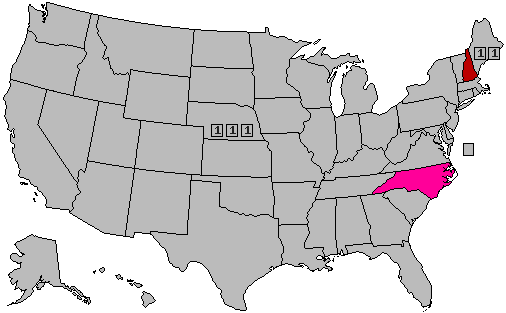 )
)
30% -- lead with 40-49% but a margin of 3% or less
40% -- lead with 40-49% but a margin of 4% or more
60% -- lead with 50-54%
70% -- lead with 55-59%
90% -- lead with 60% or more
()
The average with a the Granite State/U-New Hampshire/WMUR-TV poll involving Rand Paul comes out to 49. Add Walker, though, in a state with a few similarities to his own state.
Hillary Clinton vs. Jeb Bush
(
Hillary Clinton vs. Chris Christie
(
Hillary Clinton vs. Mike Huckabee
(
Hillary Clinton vs. Rand Paul
(
Hillary Clinton vs. Scott Walker
(
30% -- lead with 40-49% but a margin of 3% or less
40% -- lead with 40-49% but a margin of 4% or more
60% -- lead with 50-54%
70% -- lead with 55-59%
90% -- lead with 60% or more
Title: Re: 2016 Official Polling Map Thread
Post by: pbrower2a on February 12, 2015, 04:09:30 PM
Virginia, college poll. Eighth state polled, and critical for 2016.
Republicans would surely like to believe that Virginia will come back to its senses, and that the two Obama wins are simply blips in the state's historical pattern of voting Republican except in Democratic blowouts between 1952 and 2004.
48-43 Clinton vs. Bush
49-42 Clinton vs. Christie
51-42 Clinton vs. Rubio
52-42 Clinton vs. Huckabee
52-42 Clinton vs. Paul
http://cnu.edu/cpp/pdf/Feb%2012%202015%20Report.pdf
Virginia now probably leans Democratic.
Hillary Clinton vs. Jeb Bush
(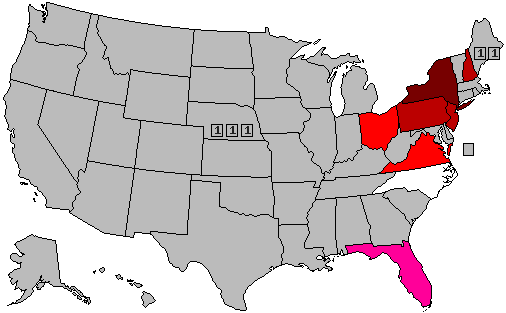 )
)
Hillary Clinton vs. Chris Christie
( )
)
Hillary Clinton vs. Mike Huckabee
(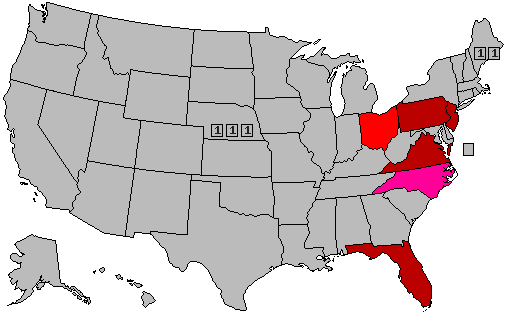 )
)
Hillary Clinton vs. Rand Paul
(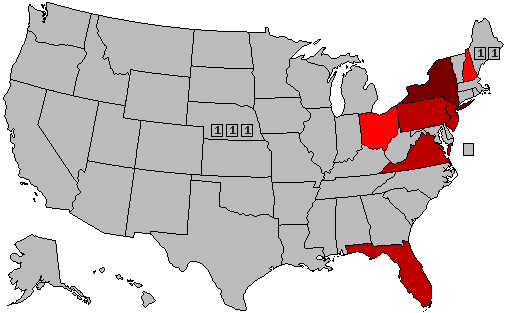 )
)
Hillary Clinton vs. Scott Walker
()
30% -- lead with 40-49% but a margin of 3% or less
40% -- lead with 40-49% but a margin of 4% or more
60% -- lead with 50-54%
70% -- lead with 55-59%
90% -- lead with 60% or more
Republicans would surely like to believe that Virginia will come back to its senses, and that the two Obama wins are simply blips in the state's historical pattern of voting Republican except in Democratic blowouts between 1952 and 2004.
48-43 Clinton vs. Bush
49-42 Clinton vs. Christie
51-42 Clinton vs. Rubio
52-42 Clinton vs. Huckabee
52-42 Clinton vs. Paul
http://cnu.edu/cpp/pdf/Feb%2012%202015%20Report.pdf
Virginia now probably leans Democratic.
Hillary Clinton vs. Jeb Bush
(
Hillary Clinton vs. Chris Christie
(
Hillary Clinton vs. Mike Huckabee
(
Hillary Clinton vs. Rand Paul
(
Hillary Clinton vs. Scott Walker
(
30% -- lead with 40-49% but a margin of 3% or less
40% -- lead with 40-49% but a margin of 4% or more
60% -- lead with 50-54%
70% -- lead with 55-59%
90% -- lead with 60% or more
Title: Re: 2016 Official Polling Map Thread
Post by: pbrower2a on February 12, 2015, 04:22:20 PM
States that I would like to see polled:
Arizona
Colorado
Georgia
Illinois (Senate seat -- Chicago media, this is yours!)
Indiana (lots of luck!)
Kentucky (possible Presidential nominee)
Iowa
Missouri
Oregon (Governor in trouble)
Wisconsin (Senate seat, possible GOP Presidential nominee)
PPP does South Carolina this weekend. What state will Quinnipiac poll this weekend?
So far the Presidential election of 2016 is beginning to look much like the elections of 2008 and 2012. The surprise so far is that three successive Presidential elections could be similar.
...It is remarkable so far that we have no poll of a state west of the Appalachians (southeastern Ohio is Appalachian). But even with a 'mere' eight states one sees a pattern -- that against Hillary Clinton the Republican nominee for President will have a difficult time winning four states (Florida, North Carolina, Ohio, and Virginia) that no Republican pol can reasonably win the Presidency without. If on Election night any one of these is called for Hillary Clinton, then the Republican nominee might as well have ready what is usually the finest speech possible -- the concession speech -- available. If any such state is called for Hillary Clinton before 11PM EST, then her supporters can simply await the calling of the states on the West Coast. If the states of the West Coast have just been called for her, then it is only a matter of time before one of these four states runs out of votes to count.
Two states that must be close if the Republicans are to win the Presidency -- New Hampshire and Pennsylvania -- aren't close. Republican nominees can win without both (Dubya in 2004).
Democrats other than Hillary Clinton are so far weak in their appeals to America as a whole. Joe Biden has had his chances, and his only remaining chance to be President is if something happens to...
PPP does South Carolina this weekend. South Carolina is fairly similar to the Deep South in politics -- much more than Georgia. I predict nothing about South Carolina except that if it is at all close, my prediction that the Presidential election of 2016 will look much like those of 2008 and 2012 will be void.
Title: Re: 2016 Official Polling Map Thread
Post by: pbrower2a on February 13, 2015, 12:28:21 AM
South Carolina and Georgia both are in the deep south...
Southern Georgia is as Deep South as Mississippi. Georgia has Atlanta, which includes a huge part of the state's population and has more in common with Cleveland than with southern Georgia.
Georgia votes more like Missouri in Presidential elections than like Alabama, at least in recent years.
Title: Re: 2016 Official Polling Map Thread
Post by: pbrower2a on February 15, 2015, 11:08:51 AM
Marist -- IA, NH, SC.
First poll west of the Mississippi, and if you don't like the Marist poll of SC, then there will be one by PPP which will likely have more binary choices.
Marist poll of Iowa:
http://newscms.nbcnews.com/sites/newscms/files/iowa_february_2015_annotated_questionnaire_nbc_news-marist_poll.pdf
Clinton 48%
Bush 40%
Clinton 49%
Walker 38%
Marist poll of NH:
http://newscms.nbcnews.com/sites/newscms/files/new_hampshire_february_2015_annotated_questionnaire_nbc_news-marist_poll.pdf
Clinton 48%
Bush 42%
Clinton 49%
Walker 42%
Marist poll of SC:
http://newscms.nbcnews.com/sites/newscms/files/south_carolina_february_2015_annotated_questionnaire_nbc_news-marist_poll.pdf
Bush 48%
Clinton 45%
Clinton 46%
Walker 46%
Hillary Clinton vs. Jeb Bush
( )
)
Hillary Clinton vs. Chris Christie
()
Hillary Clinton vs. Mike Huckabee
()
Hillary Clinton vs. Rand Paul
()
Hillary Clinton vs. Scott Walker
(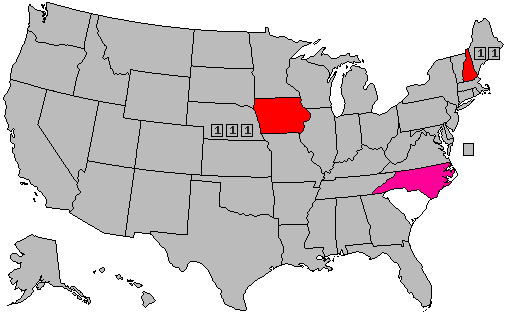 )
)
30% -- lead with 40-49% but a margin of 3% or less
40% -- lead with 40-49% but a margin of 4% or more
60% -- lead with 50-54%
70% -- lead with 55-59%
90% -- lead with 60% or more
First poll west of the Mississippi, and if you don't like the Marist poll of SC, then there will be one by PPP which will likely have more binary choices.
Marist poll of Iowa:
http://newscms.nbcnews.com/sites/newscms/files/iowa_february_2015_annotated_questionnaire_nbc_news-marist_poll.pdf
Clinton 48%
Bush 40%
Clinton 49%
Walker 38%
Marist poll of NH:
http://newscms.nbcnews.com/sites/newscms/files/new_hampshire_february_2015_annotated_questionnaire_nbc_news-marist_poll.pdf
Clinton 48%
Bush 42%
Clinton 49%
Walker 42%
Marist poll of SC:
http://newscms.nbcnews.com/sites/newscms/files/south_carolina_february_2015_annotated_questionnaire_nbc_news-marist_poll.pdf
Bush 48%
Clinton 45%
Clinton 46%
Walker 46%
Hillary Clinton vs. Jeb Bush
(
Hillary Clinton vs. Chris Christie
(
Hillary Clinton vs. Mike Huckabee
(
Hillary Clinton vs. Rand Paul
(
Hillary Clinton vs. Scott Walker
(
30% -- lead with 40-49% but a margin of 3% or less
40% -- lead with 40-49% but a margin of 4% or more
60% -- lead with 50-54%
70% -- lead with 55-59%
90% -- lead with 60% or more
Title: Re: 2016 Official Polling Map Thread
Post by: pbrower2a on February 15, 2015, 11:29:53 AM
The big one is Iowa. Just about any Republican nominee is going to win South Carolina. Of course, that South Carolina is so close suggests that Georgia is in play... but I will not call tht until I see it.
With the poll of Iowa I can predict that not only would Hillary Clinton win Iowa; she would also win Minnesota easily and Wisconsin. Iowa is politically similar to Wisconsin; sure, they voted on opposite sides in 2004, but both by razor-sharp margins.
Scott Walker fares no better than Jeb Bush in Iowa, so any spillover of Walker support from Wisconsin (where he would be a Favorite Son) is weak.
The only state that either Bush or Walker has a strong chance of winning north of the Ohio and of the Potomac is Indiana.
Title: Re: 2016 Official Polling Map Thread
Post by: pbrower2a on February 17, 2015, 10:18:12 AM
New Jersey -- Rutgers/Eagleton. Most significantly this is the fifth state since November 2014 in which Scott Walker has been polled. This may not be the most reliable pollster, but anyone who now or still sees New Jersey in play for any Republican nominee for President in 2016 lives in a fantasy world.
58-35 Clinton/Christie
58-32 Clinton/Bush
60-29 Clinton/Walker
http://eagletonpoll.rutgers.edu/rep-clinton2016-feb2015
I wouldn't make much of the shade difference between Walker and either Bush or Christie as it reflects a difference of only 2% -- but Scott Walker is not bringing fresh energy to the Republican chances of winning the Presidency in 2016.
Hillary Clinton vs. Jeb Bush
(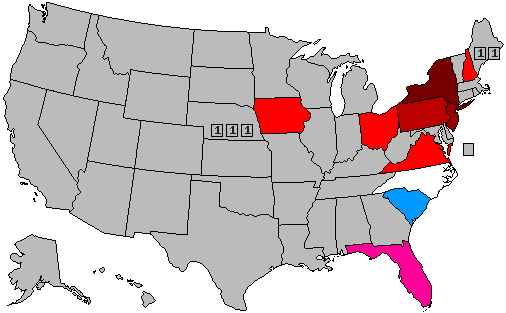 )
)
Hillary Clinton vs. Chris Christie
(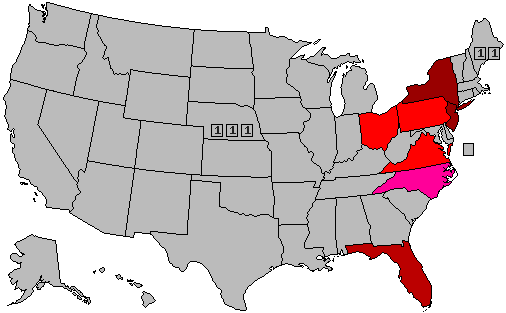 )
)
Hillary Clinton vs. Mike Huckabee
()
Hillary Clinton vs. Rand Paul
()
Hillary Clinton vs. Scott Walker
(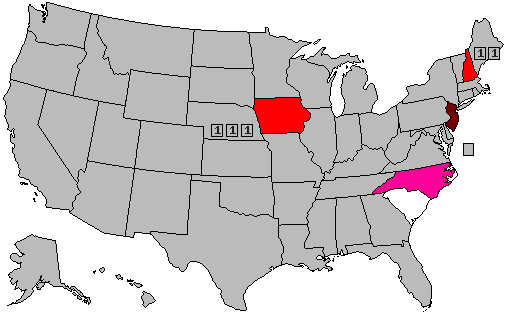 )
)
30% -- lead with 40-49% but a margin of 3% or less
40% -- lead with 40-49% but a margin of 4% or more
60% -- lead with 50-54%
70% -- lead with 55-59%
90% -- lead with 60% or more
58-35 Clinton/Christie
58-32 Clinton/Bush
60-29 Clinton/Walker
http://eagletonpoll.rutgers.edu/rep-clinton2016-feb2015
I wouldn't make much of the shade difference between Walker and either Bush or Christie as it reflects a difference of only 2% -- but Scott Walker is not bringing fresh energy to the Republican chances of winning the Presidency in 2016.
Hillary Clinton vs. Jeb Bush
(
Hillary Clinton vs. Chris Christie
(
Hillary Clinton vs. Mike Huckabee
(
Hillary Clinton vs. Rand Paul
(
Hillary Clinton vs. Scott Walker
(
30% -- lead with 40-49% but a margin of 3% or less
40% -- lead with 40-49% but a margin of 4% or more
60% -- lead with 50-54%
70% -- lead with 55-59%
90% -- lead with 60% or more
Title: Re: 2016 Official Polling Map Thread
Post by: pbrower2a on February 18, 2015, 12:27:50 AM
Q, 6AM: Virginia, Iowa, and Colorado. We shall see how good the Marist poll is for Iowa and the college poll is for Virginia.
Quinnipiac polls CO, IA, and VA:
http://www.quinnipiac.edu/news-and-events/quinnipiac-university-poll/2016-presidential-swing-state-polls/release-detail?ReleaseID=2149
Colorado
Clinton 43%
Paul 41%
Clinton 43%
Christie 34%
Clinton 44%
Bush 36%
Clinton 42%
Walker 40%
Clinton 44%
Huckabee 39%
Iowa
Clinton 45%
Huckabee 38%
Clinton 45%
Paul 37%
Clinton 44%
Christie 34%
Clinton 45%
Bush 35%
Clinton 45%
Walker 35%
Virginia
Bush 42%
Clinton 42%
Clinton 44%
Paul 42%
Clinton 44%
Huckabee 41%
Clinton 44%
Christie 39%
Clinton 45%
Walker 40%
(I have averages for Virginia).
Eleven states now.
Hillary Clinton vs. Jeb Bush
( )
)
Hillary Clinton vs. Chris Christie
(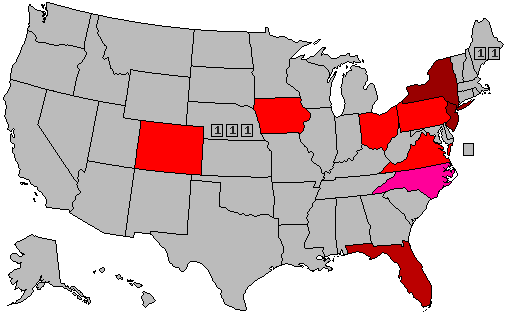 )
)
Hillary Clinton vs. Mike Huckabee
(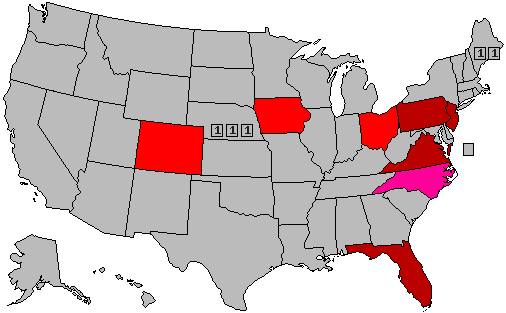 )
)
Hillary Clinton vs. Rand Paul
(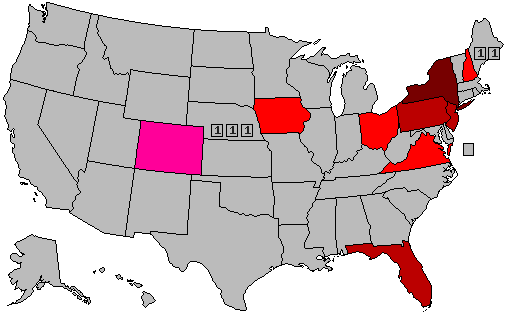 )
)
Hillary Clinton vs. Scott Walker
(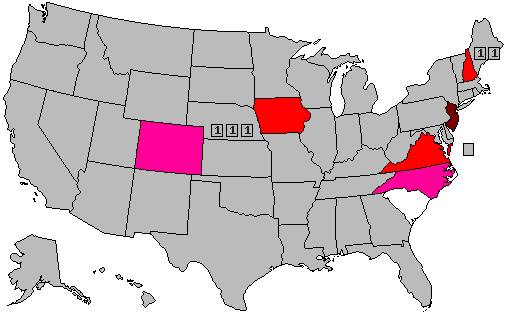 )
)
30% -- lead with 40-49% but a margin of 3% or less
40% -- lead with 40-49% but a margin of 4% or more
60% -- lead with 50-54%
70% -- lead with 55-59%
90% -- lead with 60% or more
Quinnipiac polls CO, IA, and VA:
http://www.quinnipiac.edu/news-and-events/quinnipiac-university-poll/2016-presidential-swing-state-polls/release-detail?ReleaseID=2149
Colorado
Clinton 43%
Paul 41%
Clinton 43%
Christie 34%
Clinton 44%
Bush 36%
Clinton 42%
Walker 40%
Clinton 44%
Huckabee 39%
Iowa
Clinton 45%
Huckabee 38%
Clinton 45%
Paul 37%
Clinton 44%
Christie 34%
Clinton 45%
Bush 35%
Clinton 45%
Walker 35%
Virginia
Bush 42%
Clinton 42%
Clinton 44%
Paul 42%
Clinton 44%
Huckabee 41%
Clinton 44%
Christie 39%
Clinton 45%
Walker 40%
(I have averages for Virginia).
Eleven states now.
Hillary Clinton vs. Jeb Bush
(
Hillary Clinton vs. Chris Christie
(
Hillary Clinton vs. Mike Huckabee
(
Hillary Clinton vs. Rand Paul
(
Hillary Clinton vs. Scott Walker
(
30% -- lead with 40-49% but a margin of 3% or less
40% -- lead with 40-49% but a margin of 4% or more
60% -- lead with 50-54%
70% -- lead with 55-59%
90% -- lead with 60% or more
Title: Re: 2016 Official Polling Map Thread
Post by: pbrower2a on February 18, 2015, 12:11:32 PM
We have eleven states polled, seven of them legitimate swing states. (NJ, NY, PA, and SC are not).
States that I would like to see polled:
Arizona
Arkansas (Huckabee vs. Hillary Clinton)
Georgia
Illinois (Senate seat)
Kansas (is the GOP in disarray there?)
Missouri
Nevada
Oregon (aftermath of Kitzhaber trouble)
Wisconsin (Walker, Senate seat)
States that I would like to see polled:
Arizona
Arkansas (Huckabee vs. Hillary Clinton)
Georgia
Illinois (Senate seat)
Kansas (is the GOP in disarray there?)
Missouri
Nevada
Oregon (aftermath of Kitzhaber trouble)
Wisconsin (Walker, Senate seat)
Title: Re: 2016 Official Polling Map Thread
Post by: pbrower2a on February 18, 2015, 04:05:46 PM
Arkansas (Huckabee vs. Hillary Clinton)
Kansas (is the GOP in disarray there?)
Kansas (is the GOP in disarray there?)
Arkansas: Huckabee would win decisively
Kansas: No, the GOP is NOT in disarray there. National politics ≠ state politics
Huckabee would win Arkansas. Everybody else?
Kansas -- 2014 suggests trouble.
Title: Re: 2016 Official Polling Map Thread
Post by: pbrower2a on February 18, 2015, 09:05:22 PM
Best case based on current polling for Bush and Walker (Christie, Paul, and Huckabee -- you don't want to see it if you are one of their supporters):
(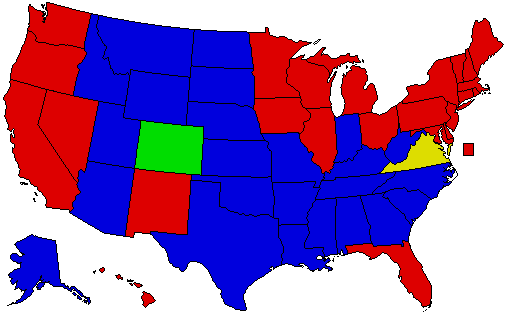 )
)
Hillary Clinton red plus green -- against Jeb Bush blue plus yellow
Hillary Clinton red plus yellow -- against Scott Walker blue plus green
(
Hillary Clinton red plus green -- against Jeb Bush blue plus yellow
Hillary Clinton red plus yellow -- against Scott Walker blue plus green
Title: Re: 2016 Official Polling Map Thread
Post by: pbrower2a on February 19, 2015, 10:41:55 AM
Hillary Clinton.................................................. 42%
Jeb Bush......................................................... 49%
Hillary Clinton.................................................. 41%
Chris Christie .................................................. 43%
Hillary Clinton.................................................. 41%
Mike Huckabee ............................................... 49%
Hillary Clinton.................................................. 43%
Rand Paul ....................................................... 45%
Hillary Clinton.................................................. 42%
Scott Walker ................................................... 46%
I'm averaging the polls with those by Marist for her against Bush and Walker... Hillary Clinton will not win South Carolina. Those involving her against Christie, Huckabee, and Paul are obviously not averages. Weaknesses of Christie and Paul in South Carolina show how weak those two are in the South. Christie is as much a d@mnyankee as Obama, and Paul is too much of a libertarian for the authoritarian White South to win by Reagan-like margins.
Hillary Clinton vs. Jeb Bush
(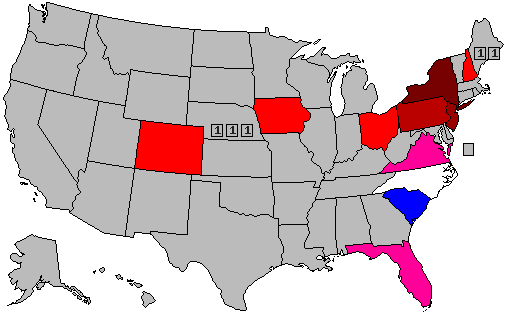 )
)
Hillary Clinton vs. Chris Christie
(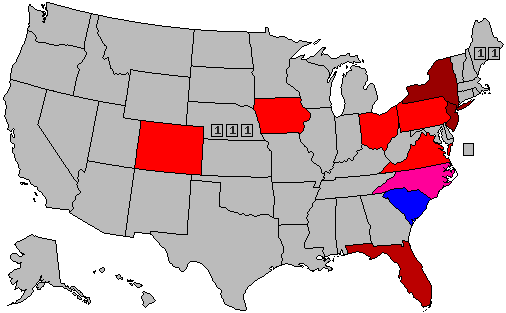 )
)
Hillary Clinton vs. Mike Huckabee
(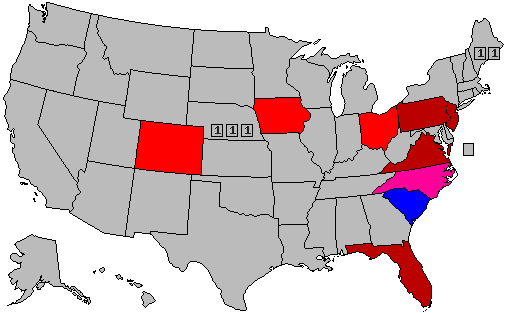 )
)
Hillary Clinton vs. Rand Paul
(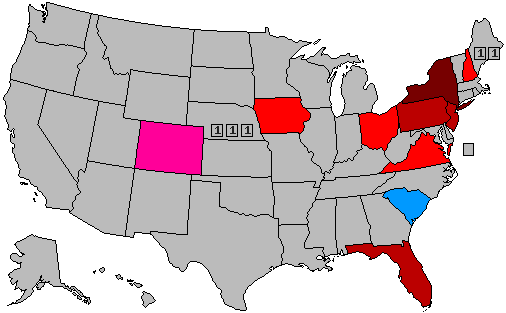 )
)
Hillary Clinton vs. Scott Walker
(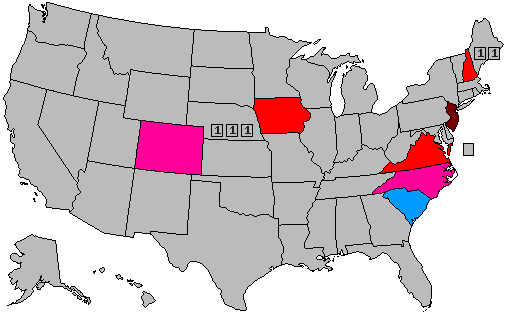 )
)
30% -- lead with 40-49% but a margin of 3% or less
40% -- lead with 40-49% but a margin of 4% or more
60% -- lead with 50-54%
70% -- lead with 55-59%
90% -- lead with 60% or more
Jeb Bush......................................................... 49%
Hillary Clinton.................................................. 41%
Chris Christie .................................................. 43%
Hillary Clinton.................................................. 41%
Mike Huckabee ............................................... 49%
Hillary Clinton.................................................. 43%
Rand Paul ....................................................... 45%
Hillary Clinton.................................................. 42%
Scott Walker ................................................... 46%
I'm averaging the polls with those by Marist for her against Bush and Walker... Hillary Clinton will not win South Carolina. Those involving her against Christie, Huckabee, and Paul are obviously not averages. Weaknesses of Christie and Paul in South Carolina show how weak those two are in the South. Christie is as much a d@mnyankee as Obama, and Paul is too much of a libertarian for the authoritarian White South to win by Reagan-like margins.
Hillary Clinton vs. Jeb Bush
(
Hillary Clinton vs. Chris Christie
(
Hillary Clinton vs. Mike Huckabee
(
Hillary Clinton vs. Rand Paul
(
Hillary Clinton vs. Scott Walker
(
30% -- lead with 40-49% but a margin of 3% or less
40% -- lead with 40-49% but a margin of 4% or more
60% -- lead with 50-54%
70% -- lead with 55-59%
90% -- lead with 60% or more
Title: Re: 2016 Official Polling Map Thread
Post by: MT Treasurer on February 19, 2015, 10:44:21 AM
The first blue state is appearing on the map...Every beginning is difficult. :)
Title: Re: 2016 Official Polling Map Thread
Post by: Tender Branson on February 19, 2015, 10:44:32 AM
FL would actually be Bush+2 if you would include the Mason-Dixon poll.
Title: Re: 2016 Official Polling Map Thread
Post by: pbrower2a on February 19, 2015, 10:52:01 AM
The first blue state is appearing on the map...Every beginning is difficult. :)
Selection bias in favor of "battleground" states... and the fact that most of them lean Clinton. I expect at most one poll from Alabama, Texas, or Wyoming. I don't expect to see much polling from Minnesota, Rhode Island, or Vermont either.
Title: Re: 2016 Official Polling Map Thread
Post by: pbrower2a on February 19, 2015, 08:02:59 PM
Iowa, Gravis... not that it is a reliable pollster.
44-39 Clinton/Paul
45-40 Clinton/Huckabee
47-41 Clinton/Walker
43-37 Clinton/Bush
45-35 Clinton/Christie
http://gravismarketing.com/uncategorized/iowa-poll-walker-garners-24-of-gop-support-paul-clinton-beats-walker-others-head-to-head
It wouldn't change the map anyway.
44-39 Clinton/Paul
45-40 Clinton/Huckabee
47-41 Clinton/Walker
43-37 Clinton/Bush
45-35 Clinton/Christie
http://gravismarketing.com/uncategorized/iowa-poll-walker-garners-24-of-gop-support-paul-clinton-beats-walker-others-head-to-head
It wouldn't change the map anyway.
Title: Re: 2016 Official Polling Map Thread
Post by: pbrower2a on February 21, 2015, 11:19:41 AM
Nearly one fourth of all states polled.
Missouri, by someone whom I do not know:
https://20poundsofheadlines.wordpress.com/2015/02/20/poll-hillary-trails-3-gop-contenders-in-missouri/
You can trust that there will be more polls.
Hillary Clinton vs. Jeb Bush
(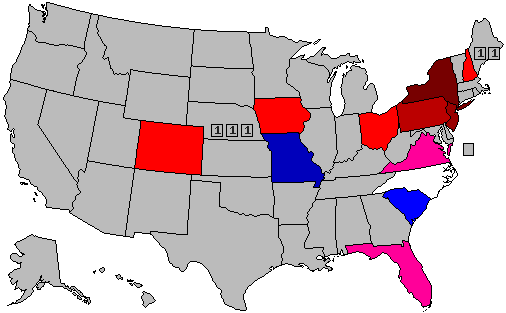 )
)
Hillary Clinton vs. Chris Christie
()
Hillary Clinton vs. Mike Huckabee
()
Hillary Clinton vs. Rand Paul
(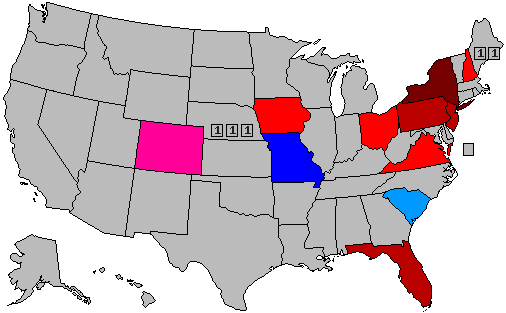 )
)
Hillary Clinton vs. Scott Walker
(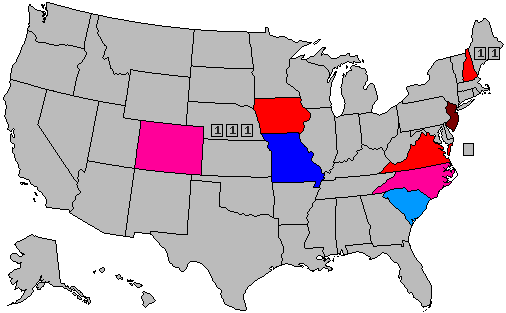 )
)
30% -- lead with 40-49% but a margin of 3% or less
40% -- lead with 40-49% but a margin of 4% or more
60% -- lead with 50-54%
70% -- lead with 55-59%
90% -- lead with 60% or more
Missouri, by someone whom I do not know:
Quote
The likely Democratic presidential nominee in 2016 would face a hard time in Missouri with three top GOP contenders, according to a new survey.
A Remington Research Poll shows former Secretary of State, Democrat Hillary Clinton, losing to Jeb Bush, or Scott Walker or Rand Paul in head-to-head match ups with likely Missouri voters.
957 likely voters were questioned with a margin of error of 3.2%
The question: if the election were held today, who would you vote vote?
Here are the match ups:
Jeb Bush 50%
Hillary Clinton 40%
Undecided 10%
Scott Walker 48%
Hillary Clinton 40%
Undecided 9%
Rand Paul 47%
Hillary Clinton 42%
Undecided 11%
https://20poundsofheadlines.wordpress.com/2015/02/20/poll-hillary-trails-3-gop-contenders-in-missouri/
You can trust that there will be more polls.
Hillary Clinton vs. Jeb Bush
(
Hillary Clinton vs. Chris Christie
(
Hillary Clinton vs. Mike Huckabee
(
Hillary Clinton vs. Rand Paul
(
Hillary Clinton vs. Scott Walker
(
30% -- lead with 40-49% but a margin of 3% or less
40% -- lead with 40-49% but a margin of 4% or more
60% -- lead with 50-54%
70% -- lead with 55-59%
90% -- lead with 60% or more
Title: Re: 2016 Official Polling Map Thread
Post by: MT Treasurer on February 21, 2015, 11:26:19 AM
It seems as if the Romney states will remain in the GOP column in 2016 barring a blowout.
Title: Re: 2016 Official Polling Map Thread
Post by: pbrower2a on February 21, 2015, 11:39:07 AM
It seems as if the Romney states will remain in the GOP column in 2016 barring a blowout.
Basically, with the possible exceptions of Arizona and Georgia, the states that have not voted for Obama in 2008 are Safe R. That obviously will not be enough to allow a Republican 'recovery' of the Presidency.
Title: Re: 2016 Official Polling Map Thread
Post by: pbrower2a on February 21, 2015, 01:30:04 PM
(
Yellow -- too close to call
Gray -- no cause to call
NE-02 is 'no cause to call'.
Title: Re: 2016 Official Polling Map Thread
Post by: pbrower2a on February 25, 2015, 12:13:06 AM
North Carolina (registered voters):
Adults:
46-38 Clinton/Bush
Registered voters:
46-40 Clinton/Bush
...
The live-caller, dual frame (landline and cell phone) survey of 867 residents of which, 773 said they were registered to vote was conducted Feb. 16-20, 2015. They survey had a margin of error of 3.33 percentage points for all respondents and 3.52 percentage points for registered voters.
http://www.elon.edu/e-net/Article/109015
[/quote]
Pennsylvania (adults):
Clinton 49
Bush 32
Clinton 50
Christie 31
Clinton 50
Romney 29
http://www.mcall.com/mc-acrobat-morning-call-poll-politics-20150219-acrobat.html
Title: Re: 2016 Official Polling Map Thread
Post by: pbrower2a on February 25, 2015, 12:16:14 AM
Elon, North Carolina. PPP will almost certainly supplant this one. I'm not using the 'adult' poll from Pennsylvania.
Hillary Clinton vs. Jeb Bush
(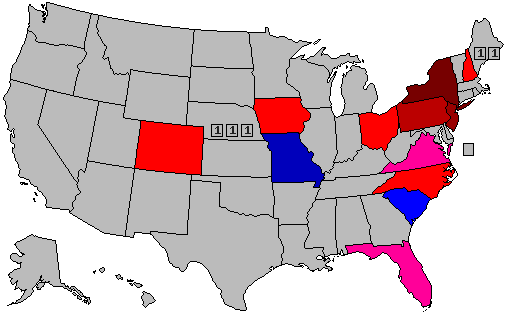 )
)
Hillary Clinton vs. Chris Christie
()
Hillary Clinton vs. Mike Huckabee
()
Hillary Clinton vs. Rand Paul
()
Hillary Clinton vs. Scott Walker
()
30% -- lead with 40-49% but a margin of 3% or less
40% -- lead with 40-49% but a margin of 4% or more
60% -- lead with 50-54%
70% -- lead with 55-59%
90% -- lead with 60% or more
[/quote]
Hillary Clinton vs. Jeb Bush
(
Hillary Clinton vs. Chris Christie
(
Hillary Clinton vs. Mike Huckabee
(
Hillary Clinton vs. Rand Paul
(
Hillary Clinton vs. Scott Walker
(
30% -- lead with 40-49% but a margin of 3% or less
40% -- lead with 40-49% but a margin of 4% or more
60% -- lead with 50-54%
70% -- lead with 55-59%
90% -- lead with 60% or more
[/quote]
Title: Re: 2016 Official Polling Map Thread
Post by: pbrower2a on February 27, 2015, 09:45:06 AM
Gravis (through Breitbart) -- Nevada
This comes from Gravis, through very right-wing Breitbart. Considering the source, it suggests that Nevada is at best (for Republicans) on the fringe of contention in 2016, and that there is little wiggle room for any Republican nominee against Hillary Clinton. The Gravis poll of Iowa was close to that of less-derided polls, so maybe this one is valid.
http://www.breitbart.com/big-government/2015/02/26/first-look-scott-walker-leads-in-nevada-poll-jeb-performs-worst-against-hillary/
Clinton 49%
Walker 43%
Clinton 49%
Paul 42%
Clinton 47%
Christie 38%
Clinton 50%
Bush 37%
Hillary Clinton vs. Jeb Bush
(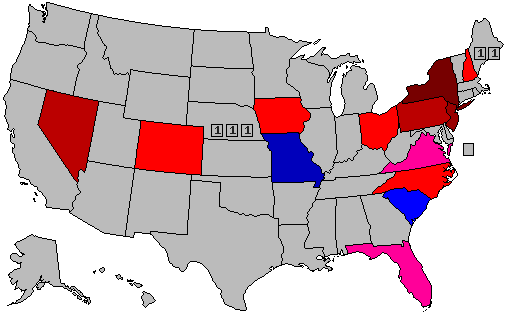 )
)
Hillary Clinton vs. Chris Christie
(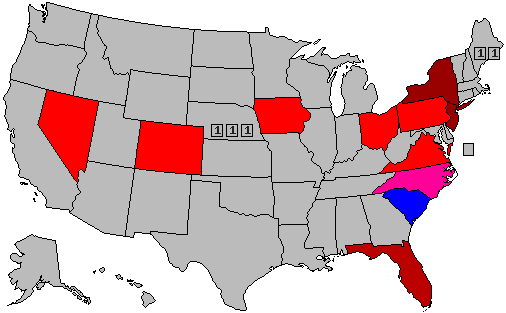 )
)
Hillary Clinton vs. Mike Huckabee
()
Hillary Clinton vs. Rand Paul
(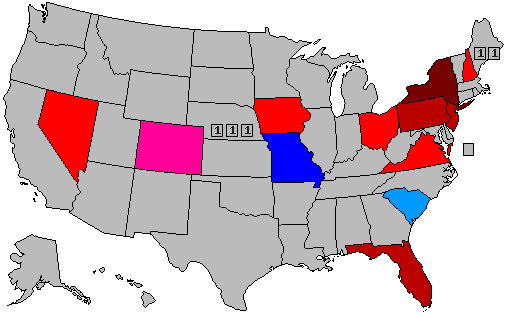 )
)
Hillary Clinton vs. Scott Walker
(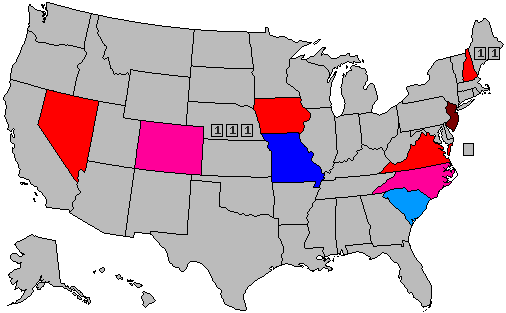 )
)
30% -- lead with 40-49% but a margin of 3% or less
40% -- lead with 40-49% but a margin of 4% or more
60% -- lead with 50-54%
70% -- lead with 55-59%
90% -- lead with 60% or more
This comes from Gravis, through very right-wing Breitbart. Considering the source, it suggests that Nevada is at best (for Republicans) on the fringe of contention in 2016, and that there is little wiggle room for any Republican nominee against Hillary Clinton. The Gravis poll of Iowa was close to that of less-derided polls, so maybe this one is valid.
http://www.breitbart.com/big-government/2015/02/26/first-look-scott-walker-leads-in-nevada-poll-jeb-performs-worst-against-hillary/
Clinton 49%
Walker 43%
Clinton 49%
Paul 42%
Clinton 47%
Christie 38%
Clinton 50%
Bush 37%
Hillary Clinton vs. Jeb Bush
(
Hillary Clinton vs. Chris Christie
(
Hillary Clinton vs. Mike Huckabee
(
Hillary Clinton vs. Rand Paul
(
Hillary Clinton vs. Scott Walker
(
30% -- lead with 40-49% but a margin of 3% or less
40% -- lead with 40-49% but a margin of 4% or more
60% -- lead with 50-54%
70% -- lead with 55-59%
90% -- lead with 60% or more
Title: Re: 2016 Official Polling Map Thread
Post by: pbrower2a on March 03, 2015, 11:03:15 AM
States that I would like to see polled:
Illinois (Senate race)
Wisconsin (Walker's state and a Senate race)
Indiana (lots of luck!)
Arizona
Georgia
Arkansas
Missouri (someone credible)
Kentucky (Paul's home state, gubernatorial contest)
Kansas
Illinois (Senate race)
Wisconsin (Walker's state and a Senate race)
Indiana (lots of luck!)
Arizona
Georgia
Arkansas
Missouri (someone credible)
Kentucky (Paul's home state, gubernatorial contest)
Kansas
Title: Re: 2016 Official Polling Map Thread
Post by: pbrower2a on March 04, 2015, 04:05:19 PM
Clinton 46%
Bush 42%
Clinton 45%
Christie 42%
Clinton 46%
Huckabee 46%
Clinton 46%
Paul 43%
Clinton 45%
Walker 43%
http://www.publicpolicypolling.com/pdf/2015/PPP_Release_NC_30415.pdf
Elon looks good.
Hillary Clinton vs. Jeb Bush
()
Hillary Clinton vs. Chris Christie
()
Hillary Clinton vs. Mike Huckabee
(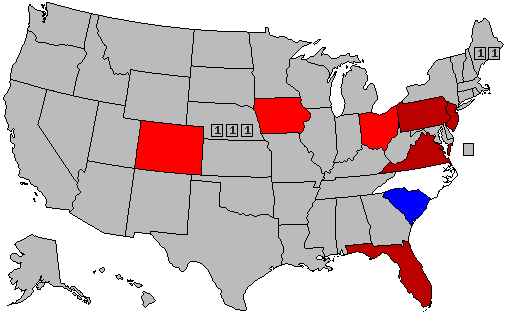 )
)
Hillary Clinton vs. Rand Paul
(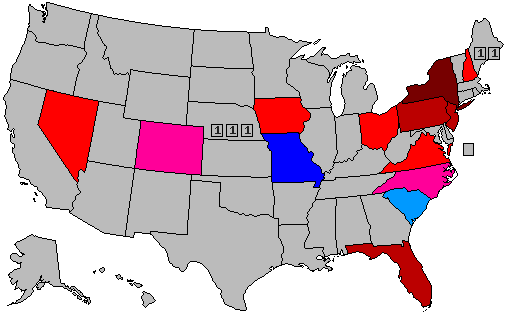 )
)
Hillary Clinton vs. Scott Walker
()
30% -- lead with 40-49% but a margin of 3% or less
40% -- lead with 40-49% but a margin of 4% or more
60% -- lead with 50-54%
70% -- lead with 55-59%
90% -- lead with 60% or more
Bush 42%
Clinton 45%
Christie 42%
Clinton 46%
Huckabee 46%
Clinton 46%
Paul 43%
Clinton 45%
Walker 43%
http://www.publicpolicypolling.com/pdf/2015/PPP_Release_NC_30415.pdf
Elon looks good.
Hillary Clinton vs. Jeb Bush
(
Hillary Clinton vs. Chris Christie
(
Hillary Clinton vs. Mike Huckabee
(
Hillary Clinton vs. Rand Paul
(
Hillary Clinton vs. Scott Walker
(
30% -- lead with 40-49% but a margin of 3% or less
40% -- lead with 40-49% but a margin of 4% or more
60% -- lead with 50-54%
70% -- lead with 55-59%
90% -- lead with 60% or more
Title: Re: 2016 Official Polling Map Thread
Post by: pbrower2a on March 05, 2015, 08:11:11 PM
March 2-3, 2015
Survey of 946 registered voters (most questions are about the US Senate):
Ohio, PPP:
Clinton 45 - Bush 40
Clinton 49 - Walker 41
http://www.publicpolicypolling.com/main/2015/01/OhioResults1.pdf
Hillary Clinton vs. Jeb Bush
()
Hillary Clinton vs. Chris Christie
()
Hillary Clinton vs. Mike Huckabee
()
Hillary Clinton vs. Rand Paul
()
Hillary Clinton vs. Scott Walker
(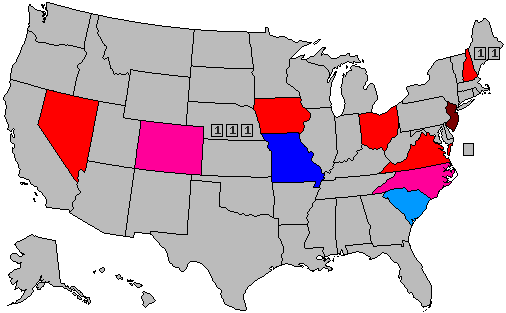 )
)
30% -- lead with 40-49% but a margin of 3% or less
40% -- lead with 40-49% but a margin of 4% or more
60% -- lead with 50-54%
70% -- lead with 55-59%
90% -- lead with 60% or more
[/quote]
Survey of 946 registered voters (most questions are about the US Senate):
Ohio, PPP:
Clinton 45 - Bush 40
Clinton 49 - Walker 41
http://www.publicpolicypolling.com/main/2015/01/OhioResults1.pdf
Hillary Clinton vs. Jeb Bush
(
Hillary Clinton vs. Chris Christie
(
Hillary Clinton vs. Mike Huckabee
(
Hillary Clinton vs. Rand Paul
(
Hillary Clinton vs. Scott Walker
(
30% -- lead with 40-49% but a margin of 3% or less
40% -- lead with 40-49% but a margin of 4% or more
60% -- lead with 50-54%
70% -- lead with 55-59%
90% -- lead with 60% or more
[/quote]
Title: Re: 2016 Official Polling Map Thread
Post by: pbrower2a on March 10, 2015, 11:32:49 AM
PPP, Wisconsin:
The state in which Scott Walker is Governor does not really like him (approval 43%, disapproval 52%), and against Hillary Clinton he is down 52-43%. Against other Republicans she is close to 50% and ahead by at least 6%.
Scott Walker does not have a favorite-son advantage over other Republicans in Wisconsin. Wisconsin is now at most on the fringe of contention for Republicans for President. Rand Paul and Mike Huckabee do better against Hillary than Bush or Christie (alleged Establishment candidates).
Indeed, both Joe Biden and Elizabeth Warren would hold leads, if within the margin of error, against Scott Walker in Wisconsin. If Walker is going to lose Wisconsin 53-47, then the only Rust Belt state that he can win is Indiana. Just look at the Ohio polls.
Wisconsin is split on the Right-to-Work legislation that the Wisconsin State legislature passed and Scott Walker signed by a 44-42 margin.
http://www.publicpolicypolling.com/pdf/2015/PPP_Release_WI_31015.pdf
Hillary Clinton vs. Jeb Bush
(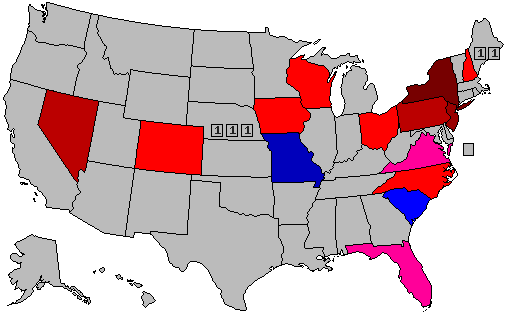 )
)
Hillary Clinton vs. Chris Christie
(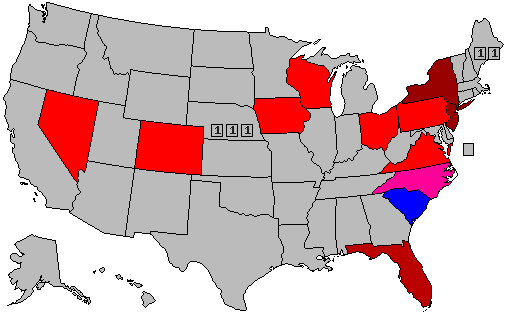 )
)
Hillary Clinton vs. Mike Huckabee
( )
)
Hillary Clinton vs. Rand Paul
(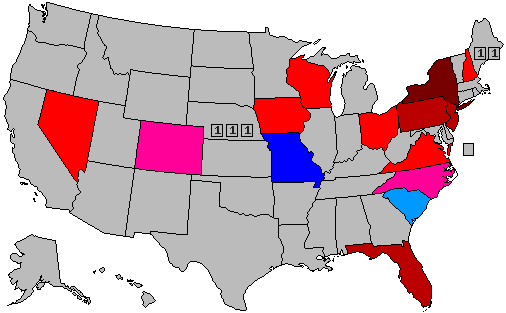 )
)
Hillary Clinton vs. Scott Walker
(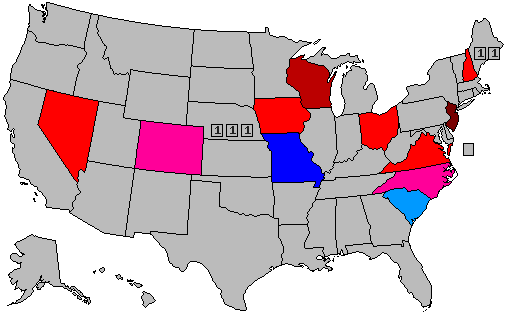 )
)
30% -- lead with 40-49% but a margin of 3% or less
40% -- lead with 40-49% but a margin of 4% or more
60% -- lead with 50-54%
70% -- lead with 55-59%
90% -- lead with 60% or more
The state in which Scott Walker is Governor does not really like him (approval 43%, disapproval 52%), and against Hillary Clinton he is down 52-43%. Against other Republicans she is close to 50% and ahead by at least 6%.
Scott Walker does not have a favorite-son advantage over other Republicans in Wisconsin. Wisconsin is now at most on the fringe of contention for Republicans for President. Rand Paul and Mike Huckabee do better against Hillary than Bush or Christie (alleged Establishment candidates).
Indeed, both Joe Biden and Elizabeth Warren would hold leads, if within the margin of error, against Scott Walker in Wisconsin. If Walker is going to lose Wisconsin 53-47, then the only Rust Belt state that he can win is Indiana. Just look at the Ohio polls.
Wisconsin is split on the Right-to-Work legislation that the Wisconsin State legislature passed and Scott Walker signed by a 44-42 margin.
http://www.publicpolicypolling.com/pdf/2015/PPP_Release_WI_31015.pdf
Hillary Clinton vs. Jeb Bush
(
Hillary Clinton vs. Chris Christie
(
Hillary Clinton vs. Mike Huckabee
(
Hillary Clinton vs. Rand Paul
(
Hillary Clinton vs. Scott Walker
(
30% -- lead with 40-49% but a margin of 3% or less
40% -- lead with 40-49% but a margin of 4% or more
60% -- lead with 50-54%
70% -- lead with 55-59%
90% -- lead with 60% or more
Title: Re: 2016 Official Polling Map Thread
Post by: pbrower2a on March 10, 2015, 12:56:34 PM
PPP, Wisconsin:
The state in which Scott Walker is Governor does not really like him (approval 43%, disapproval 52%), and against Hillary Clinton he is down 52-43%. Against other Republicans she is close to 50% and ahead by at least 6%.
Scott Walker does not have a favorite-son advantage over other Republicans in Wisconsin. Wisconsin is now at most on the fringe of contention for Republicans for President. Rand Paul and Mike Huckabee do better against Hillary than Bush or Christie (alleged Establishment candidates).
Indeed, both Joe Biden and Elizabeth Walker would hold leads, if within the margin of error, against Scott Walker in Wisconsin. If Walker is going to lose Wisconsin 53-47, then the only Rust Belt state that he can win is Indiana. Just look at the Ohio polls.
Wisconsin is split on the Right-to-Work legislation that the Wisconsin State legislature passed and Scott Walker signed by a 44-42 margin.
I guess you were VERY excited about that WI poll.
I was. I also corrected the error. Thank you.
Title: Re: 2016 Official Polling Map Thread
Post by: Senator Cris on March 10, 2015, 01:07:32 PM
It's curious that you included the PPP poll for OH Dems in your map and you have not included the Mason Dixon poll of Florida because it showed Bush up 5 against Clinton.
Title: Re: 2016 Official Polling Map Thread
Post by: IceSpear on March 10, 2015, 02:56:51 PM
It's curious that you included the PPP poll for OH Dems in your map and you have not included the Mason Dixon poll of Florida because it showed Bush up 5 against Clinton.
The real offense is including Gravis. If we're going to include...them, then yeah, Mason Dixon should be included as well.
Title: Re: 2016 Official Polling Map Thread
Post by: pbrower2a on March 10, 2015, 03:44:44 PM
It's curious that you included the PPP poll for OH Dems in your map and you have not included the Mason Dixon poll of Florida because it showed Bush up 5 against Clinton.
The real offense is including Gravis. If we're going to include...them, then yeah, Mason Dixon should be included as well.
The Gravis poll that I used was for Nevada, a State rarely polled. I was not going to use it... except that it concurred with an Iowa poll that seemed right. The Gravis poll of Nevada came from right-wing Breitbart, so if it saw Hillary as a sure thing in Nevada despite its editors wishing otherwise, it was likely good.
Ordinarily I avoid Gravis.
Title: Re: 2016 Official Polling Map Thread
Post by: pbrower2a on March 12, 2015, 08:00:32 AM
Connecticut, Quinnipiac. Forty years ago one might have expected Connecticut, one of the richest states in the Union, to side with the more wealth-friendly Party for President. Of course, that was when Carter was running for President, and he won the Presidency despite losing Connecticut.
Oh, how times have changed!
Clinton 52%
Christie 34%
Clinton 54%
Paul 32%
Clinton 56%
Huckabee 31%
Clinton 52%
Bush 34%
Clinton 53%
Rubio 34%
Clinton 53%
Walker 33%
Clinton 55%
Cruz 30%
http://www.quinnipiac.edu/news-and-events/quinnipiac-university-poll/connecticut/release-detail?ReleaseID=2175
Hillary Clinton vs. Jeb Bush
( )
)
Hillary Clinton vs. Chris Christie
( )
)
Hillary Clinton vs. Mike Huckabee
(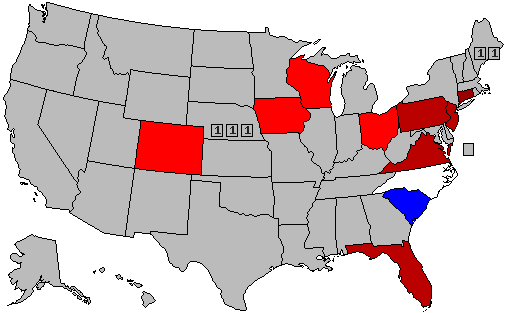 )
)
Hillary Clinton vs. Rand Paul
( )
)
Hillary Clinton vs. Scott Walker
(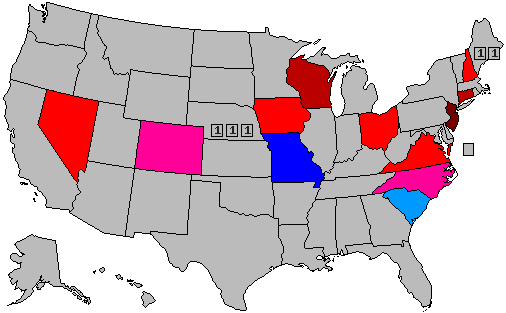 )
)
30% -- lead with 40-49% but a margin of 3% or less
40% -- lead with 40-49% but a margin of 4% or more
60% -- lead with 50-54%
70% -- lead with 55-59%
90% -- lead with 60% or more
Oh, how times have changed!
Clinton 52%
Christie 34%
Clinton 54%
Paul 32%
Clinton 56%
Huckabee 31%
Clinton 52%
Bush 34%
Clinton 53%
Rubio 34%
Clinton 53%
Walker 33%
Clinton 55%
Cruz 30%
http://www.quinnipiac.edu/news-and-events/quinnipiac-university-poll/connecticut/release-detail?ReleaseID=2175
Hillary Clinton vs. Jeb Bush
(
Hillary Clinton vs. Chris Christie
(
Hillary Clinton vs. Mike Huckabee
(
Hillary Clinton vs. Rand Paul
(
Hillary Clinton vs. Scott Walker
(
30% -- lead with 40-49% but a margin of 3% or less
40% -- lead with 40-49% but a margin of 4% or more
60% -- lead with 50-54%
70% -- lead with 55-59%
90% -- lead with 60% or more
Title: Re: 2016 Official Polling Map Thread
Post by: pbrower2a on March 19, 2015, 02:44:28 PM
CNN/ORC national poll:
http://i2.cdn.turner.com/cnn/2015/images/03/17/poll.2016.pdf
Clinton 55%
Bush 40%
Clinton 55%
Christie 40%
Clinton 55%
Rubio 42%
Clinton 55%
Huckabee 41%
Clinton 54%
Paul 43%
Clinton 56%
Carson 40%
Clinton 55%
Walker 40%
With the caveat that this is an adult poll... If those who respond to such a poll who do not subsequently vote are Democrats, then we can lop about 2% from the Clinton numbers, but those for Republicans -- all Republicans -- are very bad.
There aren't many undecided in these polls, and with Hillary getting favored by 55% or so, even if all of the undecided are R-leaning that still puts Hillary Clinton at 55-45 or so.
This is inconsistent with the polls shown in the thread so far. Most of the polling on this map is by PPP or Quinnipiac, both of which tend to get slightly R-friendly results. Most of the polls are of states that Obama won twice, and Hillary Clinton has shown herself winning just about all those states. But not that big.
The only state that has a poll by a pollster that I have ever heard of in which Obama lost twice is South Carolina, and that one looks much closer. I can hardly imagine Hillary gaining enough support on the West Coast exclusively to win California 75-25.
We may see polls of Georgia, Arizona, and Texas soon enough to tell us..
The last time we had a 54-46 split of the Presidential vote, the results looked thus:
()
No, I don't have the color-scheme inverted; that was 1988, and the elder Bush won.
Title: Re: 2016 Official Polling Map Thread
Post by: pbrower2a on March 23, 2015, 01:42:26 PM
Quinnipiac poll of New York:
http://www.quinnipiac.edu/news-and-events/quinnipiac-university-poll/new-york-state/release-detail?ReleaseID=2179
Clinton 54%
Christie 34%
Clinton 59%
Paul 31%
Clinton 58%
Huckabee 29%
Clinton 58%
Bush 30%
Clinton 58%
Rubio 31%
Clinton 58%
Walker 31%
Clinton 60%
Cruz 27%
Clinton 55%
Pataki 34%
If you want a good mystery set in New York on the night of the 2016 general election, your best hope will be that Turner Classic Movies will be playing the great Hitchcock masterpiece Rear Window. It won't be the Empire State's 38 electoral votes.
Hillary Clinton vs. Jeb Bush
(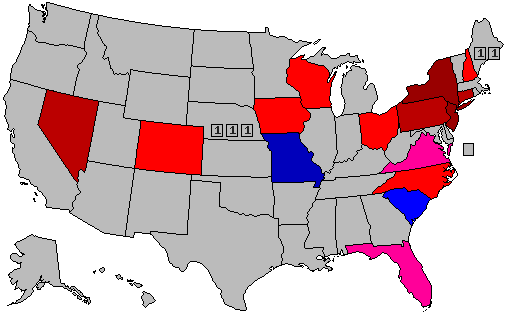 )
)
Hillary Clinton vs. Chris Christie
( )
)
Hillary Clinton vs. Mike Huckabee
(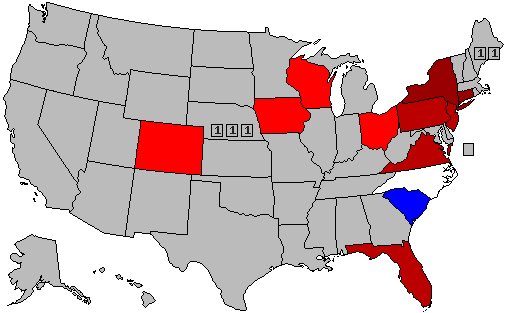 )
)
Hillary Clinton vs. Rand Paul
(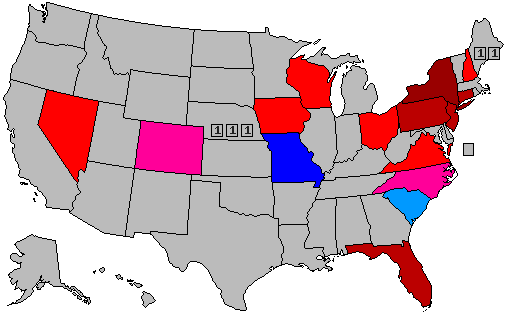 )
)
Hillary Clinton vs. Scott Walker
(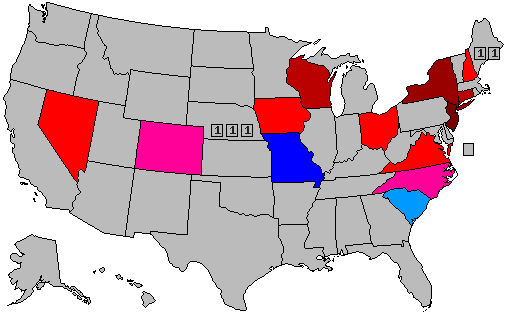 )
)
30% -- lead with 40-49% but a margin of 3% or less
40% -- lead with 40-49% but a margin of 4% or more
60% -- lead with 50-54%
70% -- lead with 55-59%
90% -- lead with 60% or more
http://www.quinnipiac.edu/news-and-events/quinnipiac-university-poll/new-york-state/release-detail?ReleaseID=2179
Clinton 54%
Christie 34%
Clinton 59%
Paul 31%
Clinton 58%
Huckabee 29%
Clinton 58%
Bush 30%
Clinton 58%
Rubio 31%
Clinton 58%
Walker 31%
Clinton 60%
Cruz 27%
Clinton 55%
Pataki 34%
If you want a good mystery set in New York on the night of the 2016 general election, your best hope will be that Turner Classic Movies will be playing the great Hitchcock masterpiece Rear Window. It won't be the Empire State's 38 electoral votes.
Hillary Clinton vs. Jeb Bush
(
Hillary Clinton vs. Chris Christie
(
Hillary Clinton vs. Mike Huckabee
(
Hillary Clinton vs. Rand Paul
(
Hillary Clinton vs. Scott Walker
(
30% -- lead with 40-49% but a margin of 3% or less
40% -- lead with 40-49% but a margin of 4% or more
60% -- lead with 50-54%
70% -- lead with 55-59%
90% -- lead with 60% or more
Title: Re: 2016 Official Polling Map Thread
Post by: pbrower2a on March 23, 2015, 03:45:30 PM
PPP will have a poll out for Florida in a couple of days.
We should soon discover whether there is any Great Right Hope for the next President.
We should soon discover whether there is any Great Right Hope for the next President.
Title: Re: 2016 Official Polling Map Thread
Post by: pbrower2a on March 24, 2015, 10:41:52 AM
PPP, Florida:
Clinton 47 - Bush 44
Clinton 49 - Christie 41
Clinton 49 - Huckabee 44
Clinton 46 - Paul 42
Clinton 49 - Walker 41
http://www.publicpolicypolling.com/pdf/2015/PPP_Release_FL_32415.pdf
We get to add Scott Walker to the mix. Some of the commanding leads that Hillary had in the last poll seem to be cut a bit. Approval for President Obama is back to 45%, so he is no longer a drag on a campaign for a Democrat.
Biden ties Walker; Warren barely edges Walker.
Hillary Clinton vs. Jeb Bush
()
Hillary Clinton vs. Chris Christie
( )
)
Hillary Clinton vs. Mike Huckabee
(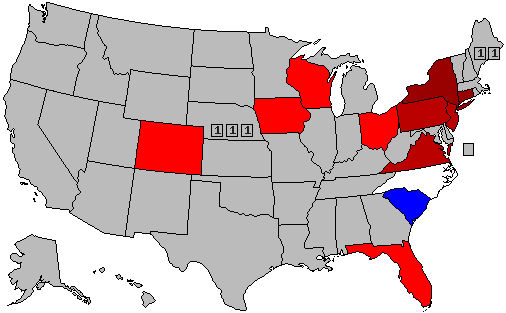 )
)
Hillary Clinton vs. Rand Paul
(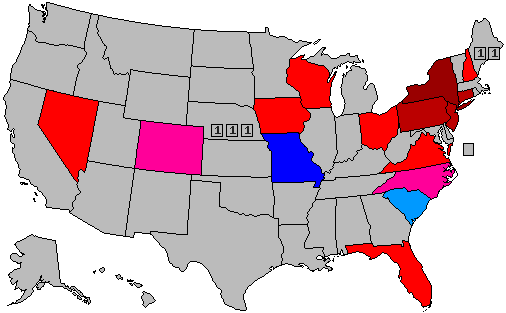 )
)
Hillary Clinton vs. Scott Walker
(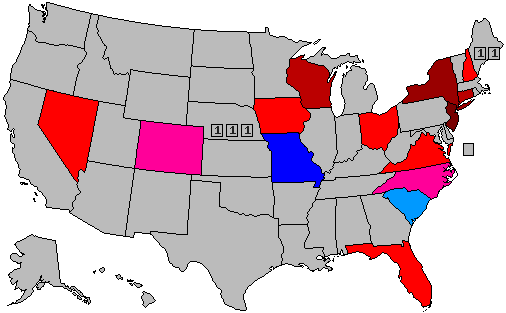 )
)
30% -- lead with 40-49% but a margin of 3% or less
40% -- lead with 40-49% but a margin of 4% or more
60% -- lead with 50-54%
70% -- lead with 55-59%
90% -- lead with 60% or more
Clinton 47 - Bush 44
Clinton 49 - Christie 41
Clinton 49 - Huckabee 44
Clinton 46 - Paul 42
Clinton 49 - Walker 41
http://www.publicpolicypolling.com/pdf/2015/PPP_Release_FL_32415.pdf
We get to add Scott Walker to the mix. Some of the commanding leads that Hillary had in the last poll seem to be cut a bit. Approval for President Obama is back to 45%, so he is no longer a drag on a campaign for a Democrat.
Biden ties Walker; Warren barely edges Walker.
Hillary Clinton vs. Jeb Bush
(
Hillary Clinton vs. Chris Christie
(
Hillary Clinton vs. Mike Huckabee
(
Hillary Clinton vs. Rand Paul
(
Hillary Clinton vs. Scott Walker
(
30% -- lead with 40-49% but a margin of 3% or less
40% -- lead with 40-49% but a margin of 4% or more
60% -- lead with 50-54%
70% -- lead with 55-59%
90% -- lead with 60% or more
Title: Re: 2016 Official Polling Map Thread
Post by: pbrower2a on March 24, 2015, 05:47:35 PM
First, the good news for Republicans: Any Republican nominee for President is going to win a gigantic swath of territory, and it will have a dominating appearance on the electoral map.
Now for the bad news: it's Montana, which has only three electoral votes to offer.
49-35 Bush/Clinton
48-38 Paul/Clinton
49-37 Walker/Clinton
50-33 Christie/Clinton
50-33 Huckabee/Clinton
http://gravismarketing.com/polling-and-market-research/current-montana-polling-2/
Not my favorite pollster, but it could be the last poll that I see of Montana for a while.
Hillary Clinton vs. Jeb Bush
(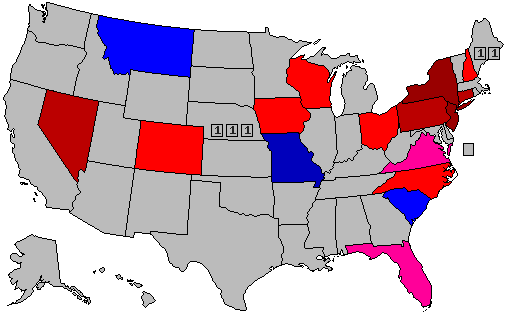 )
)
Hillary Clinton vs. Chris Christie
(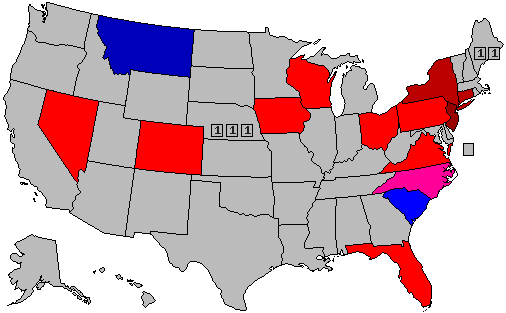 )
)
Hillary Clinton vs. Mike Huckabee
(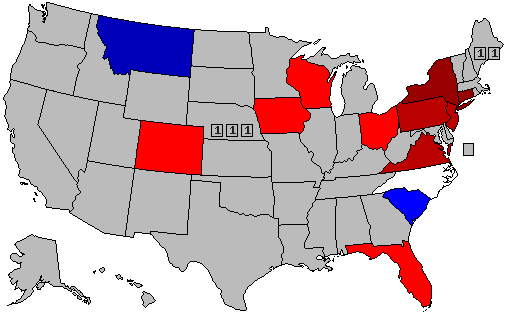 )
)
Hillary Clinton vs. Rand Paul
(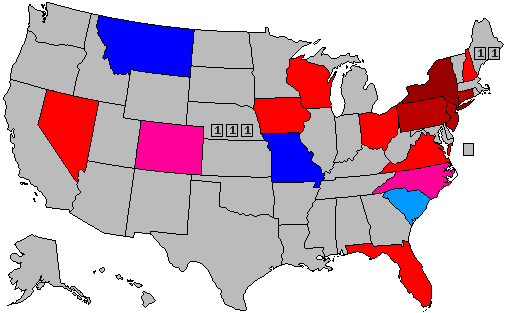 )
)
Hillary Clinton vs. Scott Walker
( )
)
30% -- lead with 40-49% but a margin of 3% or less
40% -- lead with 40-49% but a margin of 4% or more
60% -- lead with 50-54%
70% -- lead with 55-59%
90% -- lead with 60% or more
Now for the bad news: it's Montana, which has only three electoral votes to offer.
49-35 Bush/Clinton
48-38 Paul/Clinton
49-37 Walker/Clinton
50-33 Christie/Clinton
50-33 Huckabee/Clinton
http://gravismarketing.com/polling-and-market-research/current-montana-polling-2/
Not my favorite pollster, but it could be the last poll that I see of Montana for a while.
Hillary Clinton vs. Jeb Bush
(
Hillary Clinton vs. Chris Christie
(
Hillary Clinton vs. Mike Huckabee
(
Hillary Clinton vs. Rand Paul
(
Hillary Clinton vs. Scott Walker
(
30% -- lead with 40-49% but a margin of 3% or less
40% -- lead with 40-49% but a margin of 4% or more
60% -- lead with 50-54%
70% -- lead with 55-59%
90% -- lead with 60% or more
Title: Re: 2016 Official Polling Map Thread
Post by: pbrower2a on March 25, 2015, 09:14:09 AM
You don't make maps with Rubio?
I don't make them with Carson, Cruz, Giuliani, Palin, or Ryan either. Or on the other side Biden or Warren.
Rubio showed himself as a marginal pol. He could have trouble getting re-elected in the Senate. His approval rating is 45% in Florida.
Title: Re: 2016 Official Polling Map Thread
Post by: pbrower2a on March 25, 2015, 06:59:08 PM
Emerson College poll of Massachusetts:
http://www.argojournal.com/2015/03/poll-watch-emerson-college_0.html
Clinton 58%
Walker 38%
Clinton 59%
Bush 38%
Clinton 61%
Paul 36%
Poll by some college that I know little about... No surprise here. it's Massachusetts. Adults, so not as good as 'likely' or 'registered' voters.
Hillary Clinton vs. Jeb Bush
( )
)
Hillary Clinton vs. Chris Christie
()
Hillary Clinton vs. Mike Huckabee
()
Hillary Clinton vs. Rand Paul
(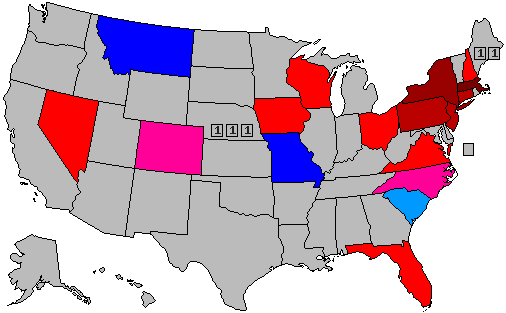 )
)
Hillary Clinton vs. Scott Walker
(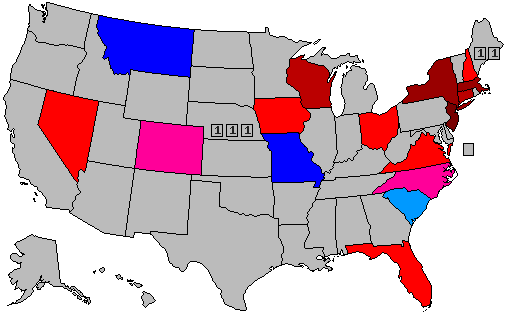 )
)
30% -- lead with 40-49% but a margin of 3% or less
40% -- lead with 40-49% but a margin of 4% or more
60% -- lead with 50-54%
70% -- lead with 55-59%
90% -- lead with 60% or more
http://www.argojournal.com/2015/03/poll-watch-emerson-college_0.html
Clinton 58%
Walker 38%
Clinton 59%
Bush 38%
Clinton 61%
Paul 36%
Poll by some college that I know little about... No surprise here. it's Massachusetts. Adults, so not as good as 'likely' or 'registered' voters.
Hillary Clinton vs. Jeb Bush
(
Hillary Clinton vs. Chris Christie
(
Hillary Clinton vs. Mike Huckabee
(
Hillary Clinton vs. Rand Paul
(
Hillary Clinton vs. Scott Walker
(
30% -- lead with 40-49% but a margin of 3% or less
40% -- lead with 40-49% but a margin of 4% or more
60% -- lead with 50-54%
70% -- lead with 55-59%
90% -- lead with 60% or more
Title: Re: 2016 Official Polling Map Thread
Post by: pbrower2a on March 26, 2015, 09:32:14 PM
St. Leo College, Florida
http://polls.saintleo.edu/clintons-numbers-slip-but-she-maintains-frontrunner-position/
Clinton 47
Bush 44
Clinton 50
Rubio 42
Clinton 51
Christie 37
Clinton 52
Paul 38
Clinton 51
Walker 35
I'm not going to change or even the recent PPP poll to accommodate this one. Really, this one looks better for Hillary Clinton than do the PPP polls.
Needless to say, if polls consistently show bare to solid wins for Hillary Clinton in Florida, then ... how do I adapt the bromide about being up to one's eyeballs with alligators in the swamp?
Hillary Clinton vs. Jeb Bush
()
Hillary Clinton vs. Chris Christie
()
Hillary Clinton vs. Mike Huckabee
()
Hillary Clinton vs. Rand Paul
()
Hillary Clinton vs. Scott Walker
()
30% -- lead with 40-49% but a margin of 3% or less
40% -- lead with 40-49% but a margin of 4% or more
60% -- lead with 50-54%
70% -- lead with 55-59%
90% -- lead with 60% or more
[/quote]
http://polls.saintleo.edu/clintons-numbers-slip-but-she-maintains-frontrunner-position/
Clinton 47
Bush 44
Clinton 50
Rubio 42
Clinton 51
Christie 37
Clinton 52
Paul 38
Clinton 51
Walker 35
I'm not going to change or even the recent PPP poll to accommodate this one. Really, this one looks better for Hillary Clinton than do the PPP polls.
Needless to say, if polls consistently show bare to solid wins for Hillary Clinton in Florida, then ... how do I adapt the bromide about being up to one's eyeballs with alligators in the swamp?
Hillary Clinton vs. Jeb Bush
(
Hillary Clinton vs. Chris Christie
(
Hillary Clinton vs. Mike Huckabee
(
Hillary Clinton vs. Rand Paul
(
Hillary Clinton vs. Scott Walker
(
30% -- lead with 40-49% but a margin of 3% or less
40% -- lead with 40-49% but a margin of 4% or more
60% -- lead with 50-54%
70% -- lead with 55-59%
90% -- lead with 60% or more
[/quote]
Title: Re: 2016 Official Polling Map Thread
Post by: IceSpear on March 27, 2015, 03:13:53 AM
Out of boredom I made a Hillary vs. Cruz map with the polls listed on Wikipedia. Too bad his chances are so low, because it's quite beautiful.
(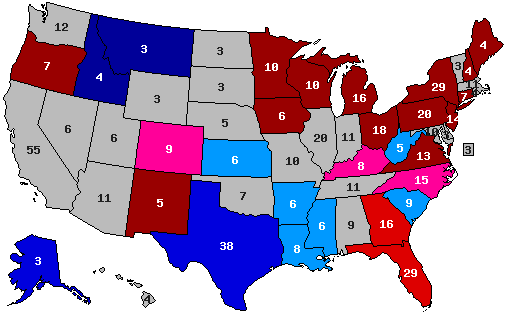 )
)
Slight = 1-5 point lead
Lean = 5-10 point lead
Solid = 10+ point lead
(
Slight = 1-5 point lead
Lean = 5-10 point lead
Solid = 10+ point lead
Title: Re: 2016 Official Polling Map Thread
Post by: Ebsy on March 27, 2015, 09:43:26 AM
Slight lead for Clinton in Kentucky? I doubt that would hold, but Ted Cruz having to campaign in Kentucky would be hilarious indeed.
Title: Re: 2016 Official Polling Map Thread
Post by: pbrower2a on March 27, 2015, 10:26:39 AM
For now I do not take Ted Cruz seriously. He has yet to align a part of the GOP base as have others. He would be at most someone whom Republicans would settle on if their favorites (probably Bush, Huckabee, and Walker) would falter and Christie loses the apparent ability to win moderate Democratic voters. "Bomb Teheran now!" might attract the warmonger faction of the GOP, but it would scare about everyone else into something safer.
He could lose almost as badly as Goldwater in 1964 except for the huge difference in electoral votes between Arizona in 1964 (only five) and Texas (38).
He could lose almost as badly as Goldwater in 1964 except for the huge difference in electoral votes between Arizona in 1964 (only five) and Texas (38).
Title: Re: 2016 Official Polling Map Thread
Post by: pbrower2a on March 29, 2015, 08:09:09 PM
St. Leo College, Florida
http://polls.saintleo.edu/clintons-numbers-slip-but-she-maintains-frontrunner-position/
Clinton 47
Bush 44
Clinton 50
Rubio 42
Clinton 51
Christie 37
Clinton 52
Paul 38
Clinton 51
Walker 35
I'm not going to change or even the recent PPP poll to accommodate this one. Really, this one looks better for Hillary Clinton than do the PPP polls.
Needless to say, if polls consistently show bare to solid wins for Hillary Clinton in Florida, then ... how do I adapt the bromide about being up to one's eyeballs with alligators in the swamp?
Hillary Clinton vs. Jeb Bush
()
Hillary Clinton vs. Chris Christie
()
Hillary Clinton vs. Mike Huckabee
()
Hillary Clinton vs. Rand Paul
()
Hillary Clinton vs. Scott Walker
()
30% -- lead with 40-49% but a margin of 3% or less
40% -- lead with 40-49% but a margin of 4% or more
60% -- lead with 50-54%
70% -- lead with 55-59%
90% -- lead with 60% or more
http://polls.saintleo.edu/clintons-numbers-slip-but-she-maintains-frontrunner-position/
Clinton 47
Bush 44
Clinton 50
Rubio 42
Clinton 51
Christie 37
Clinton 52
Paul 38
Clinton 51
Walker 35
I'm not going to change or even the recent PPP poll to accommodate this one. Really, this one looks better for Hillary Clinton than do the PPP polls.
Needless to say, if polls consistently show bare to solid wins for Hillary Clinton in Florida, then ... how do I adapt the bromide about being up to one's eyeballs with alligators in the swamp?
Hillary Clinton vs. Jeb Bush
(
Hillary Clinton vs. Chris Christie
(
Hillary Clinton vs. Mike Huckabee
(
Hillary Clinton vs. Rand Paul
(
Hillary Clinton vs. Scott Walker
(
30% -- lead with 40-49% but a margin of 3% or less
40% -- lead with 40-49% but a margin of 4% or more
60% -- lead with 50-54%
70% -- lead with 55-59%
90% -- lead with 60% or more
Title: Re: 2016 Official Polling Map Thread
Post by: pbrower2a on March 31, 2015, 02:50:34 PM
Quinnipiac, gold mine (FL, OH, PA)
Florida
Bush: 45%
Clinton: 42%
Rubio: 44%
Clinton: 46%
Paul: 43%
Clinton: 46%
Christie: 39%
Clinton: 44%
Huckabee: 40%
Clinton: 48%
Walker: 40%
Clinton: 46%
Cruz: 39%
Clinton: 48%
Ohio
Clinton: 46%
Paul: 41%
Clinton: 47%
Bush: 38%
Clinton: 45%
Christie: 39%
Clinton: 49%
Huckabee: 39%
Clinton: 47%
Rubio: 38%
Clinton: 49%
Walker: 38%
Clinton: 48%
Cruz: 38%
Pennsylvania
Paul: 45%
Clinton: 44%
Christie: 40%
Clinton: 45%
Bush: 40%
Clinton: 46%
Huckabee: 41%
Clinton: 47%
Rubio: 42%
Clinton: 46%
Walker: 41%
Clinton: 46%
Cruz: 39%
Clinton: 48%
http://www.quinnipiac.edu/images/polling/sw/ps03312015_sgt63kd.pdf
I find the idea of Rand Paul being ahead of Hillary Clinton in Pennsylvania... a bit suspect.
Hillary Clinton vs. Jeb Bush
(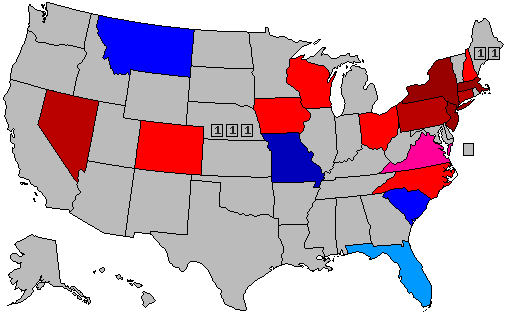 )
)
Hillary Clinton vs. Chris Christie
()
Hillary Clinton vs. Mike Huckabee
()
Hillary Clinton vs. Rand Paul
(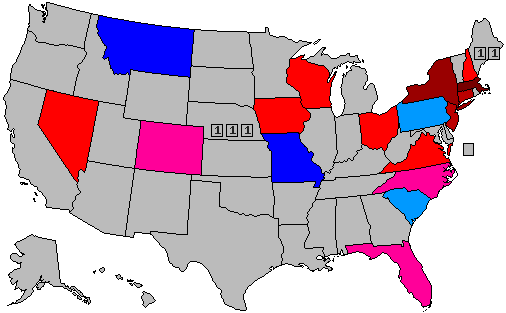 )
)
Hillary Clinton vs. Scott Walker
(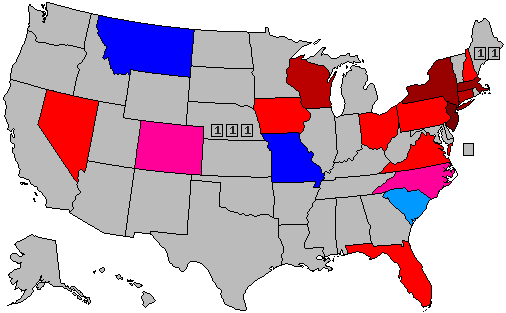 )
)
30% -- lead with 40-49% but a margin of 3% or less
40% -- lead with 40-49% but a margin of 4% or more
60% -- lead with 50-54%
70% -- lead with 55-59%
90% -- lead with 60% or more
Florida
Bush: 45%
Clinton: 42%
Rubio: 44%
Clinton: 46%
Paul: 43%
Clinton: 46%
Christie: 39%
Clinton: 44%
Huckabee: 40%
Clinton: 48%
Walker: 40%
Clinton: 46%
Cruz: 39%
Clinton: 48%
Ohio
Clinton: 46%
Paul: 41%
Clinton: 47%
Bush: 38%
Clinton: 45%
Christie: 39%
Clinton: 49%
Huckabee: 39%
Clinton: 47%
Rubio: 38%
Clinton: 49%
Walker: 38%
Clinton: 48%
Cruz: 38%
Pennsylvania
Paul: 45%
Clinton: 44%
Christie: 40%
Clinton: 45%
Bush: 40%
Clinton: 46%
Huckabee: 41%
Clinton: 47%
Rubio: 42%
Clinton: 46%
Walker: 41%
Clinton: 46%
Cruz: 39%
Clinton: 48%
http://www.quinnipiac.edu/images/polling/sw/ps03312015_sgt63kd.pdf
I find the idea of Rand Paul being ahead of Hillary Clinton in Pennsylvania... a bit suspect.
Hillary Clinton vs. Jeb Bush
(
Hillary Clinton vs. Chris Christie
(
Hillary Clinton vs. Mike Huckabee
(
Hillary Clinton vs. Rand Paul
(
Hillary Clinton vs. Scott Walker
(
30% -- lead with 40-49% but a margin of 3% or less
40% -- lead with 40-49% but a margin of 4% or more
60% -- lead with 50-54%
70% -- lead with 55-59%
90% -- lead with 60% or more
Title: Re: 2016 Official Polling Map Thread
Post by: pbrower2a on March 31, 2015, 02:55:52 PM
Nevada, Gravis:
President:
Hillary/Bush: 48/38
Hillary/Paul: 50/42
Hillary/Christie. 48/38
Hillary/Walker: 49/41
Hillary/Sandoval: 46/45
https://strehlspresidentialelection2016.wordpress.com/
Hillary Clinton vs. Jeb Bush
()
Hillary Clinton vs. Chris Christie
()
Hillary Clinton vs. Mike Huckabee
()
Hillary Clinton vs. Rand Paul
(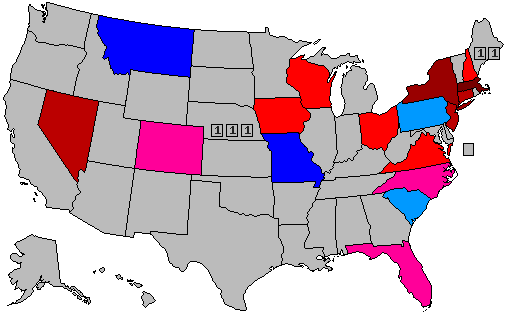 )
)
Hillary Clinton vs. Scott Walker
()
30% -- lead with 40-49% but a margin of 3% or less
40% -- lead with 40-49% but a margin of 4% or more
60% -- lead with 50-54%
70% -- lead with 55-59%
90% -- lead with 60% or more
President:
Hillary/Bush: 48/38
Hillary/Paul: 50/42
Hillary/Christie. 48/38
Hillary/Walker: 49/41
Hillary/Sandoval: 46/45
https://strehlspresidentialelection2016.wordpress.com/
Hillary Clinton vs. Jeb Bush
(
Hillary Clinton vs. Chris Christie
(
Hillary Clinton vs. Mike Huckabee
(
Hillary Clinton vs. Rand Paul
(
Hillary Clinton vs. Scott Walker
(
30% -- lead with 40-49% but a margin of 3% or less
40% -- lead with 40-49% but a margin of 4% or more
60% -- lead with 50-54%
70% -- lead with 55-59%
90% -- lead with 60% or more
Title: Re: 2016 Official Polling Map Thread
Post by: pbrower2a on April 09, 2015, 10:04:13 AM
Quinnipiac, CO/IA/VA
Colorado
Paul 44%
Clinton 41%
Clinton 41%
Christie 39%
Clinton 41%
Bush 38%
Walker 42%
Clinton 41%
Clinton 41%
Huckabee 41%
Iowa
Paul 43%
Clinton 42%
Clinton 41%
Christie 39%
Clinton 41%
Bush 40%
Clinton 44%
Walker 40%
Clinton 42%
Huckabee 42%
Virginia
Clinton 47%
Paul 43%
Clinton 46%
Christie 40%
Clinton 47%
Bush 40%
Clinton 47%
Walker 40%
Clinton 48%
Huckabee 40%
(Really, polls with nobody getting 45% are practically useless as predictors).
http://www.quinnipiac.edu/news-and-events/quinnipiac-university-poll/2016-presidential-swing-state-polls/release-detail?ReleaseID=2184
Hillary Clinton vs. Jeb Bush
(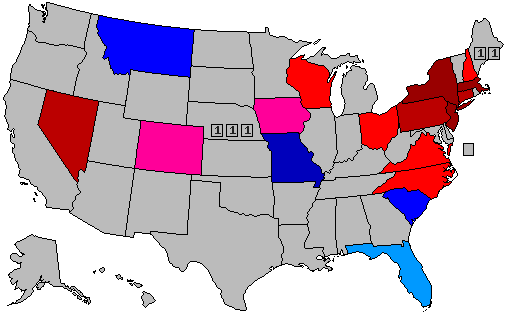 )
)
Hillary Clinton vs. Chris Christie
(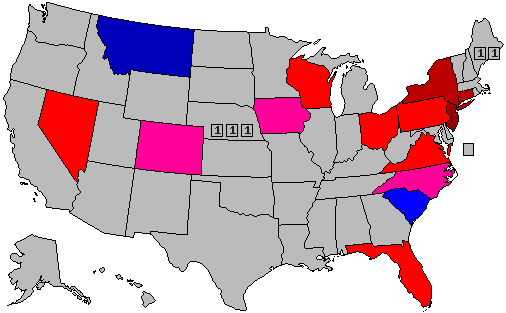 )
)
Hillary Clinton vs. Mike Huckabee
(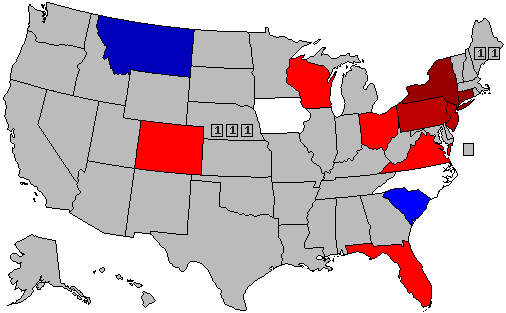 )
)
Hillary Clinton vs. Rand Paul
(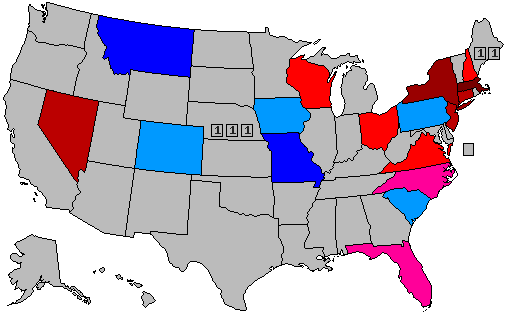 )
)
Hillary Clinton vs. Scott Walker
( )
)
30% -- lead with 40-49% but a margin of 3% or less
40% -- lead with 40-49% but a margin of 4% or more
60% -- lead with 50-54%
70% -- lead with 55-59%
90% -- lead with 60% or more
Colorado
Paul 44%
Clinton 41%
Clinton 41%
Christie 39%
Clinton 41%
Bush 38%
Walker 42%
Clinton 41%
Clinton 41%
Huckabee 41%
Iowa
Paul 43%
Clinton 42%
Clinton 41%
Christie 39%
Clinton 41%
Bush 40%
Clinton 44%
Walker 40%
Clinton 42%
Huckabee 42%
Virginia
Clinton 47%
Paul 43%
Clinton 46%
Christie 40%
Clinton 47%
Bush 40%
Clinton 47%
Walker 40%
Clinton 48%
Huckabee 40%
(Really, polls with nobody getting 45% are practically useless as predictors).
http://www.quinnipiac.edu/news-and-events/quinnipiac-university-poll/2016-presidential-swing-state-polls/release-detail?ReleaseID=2184
Hillary Clinton vs. Jeb Bush
(
Hillary Clinton vs. Chris Christie
(
Hillary Clinton vs. Mike Huckabee
(
Hillary Clinton vs. Rand Paul
(
Hillary Clinton vs. Scott Walker
(
30% -- lead with 40-49% but a margin of 3% or less
40% -- lead with 40-49% but a margin of 4% or more
60% -- lead with 50-54%
70% -- lead with 55-59%
90% -- lead with 60% or more
Title: Re: 2016 Official Polling Map Thread
Post by: pbrower2a on April 09, 2015, 02:40:05 PM
Rand Paul must be the Flavor of the Month.
Title: Re: 2016 Official Polling Map Thread
Post by: Senator Cris on April 09, 2015, 03:10:54 PM
Based on pbrower's maps, this is the EV count:
Clinton 162
Bush 51
Not Polled 325
Clinton 176
Christie 12
Not Polled 350
Clinton 149
Huckabee 12
Tie 21
Not Polled 356
Clinton 156
Paul 57
Not Polled 325
Clinton 182
Walker 31
Not Polled 325
Clinton 162
Bush 51
Not Polled 325
Clinton 176
Christie 12
Not Polled 350
Clinton 149
Huckabee 12
Tie 21
Not Polled 356
Clinton 156
Paul 57
Not Polled 325
Clinton 182
Walker 31
Not Polled 325
Title: Re: 2016 Official Polling Map Thread
Post by: pbrower2a on April 10, 2015, 08:12:39 AM
States (and DC) not polled include:
California 55
Delaware 3
District of Columbia 3
Hawaii 4
Illinois 20
Maine 4
Maryland 10
Michigan 16
Minnesota 10
New Mexico 5
Oregon 8
Rhode Island 4
Vermont 3
Washington 10
That's 157 electoral votes there, and I have yet to see anyone telling me how Republicans can expect to pick up any of them. None of them offered much mystery on how they would go in 2008 or 2012. The only way in which the climate of the Presidential race of 2016 could be different from that of 2012 is that racial animus is unlikely to play a factor in 2016. That would hurt the Republicans in states that could vote for Bill Clinton but not Hillary Clinton.
Title: Re: 2016 Official Polling Map Thread
Post by: pbrower2a on April 10, 2015, 02:19:31 PM
PPP, North Carolina. We are going to know every gust of the political winds in North Carolina from now until November 2016. This weekend, PPP polls New Hampshire.
Huckabee: 48%
Clinton: 43%
Walker: 46%
Clinton: 43%
Cruz: 45%
Clinton: 45%
Paul: 45%
Clinton: 45%
Bush: 44%
Clinton: 45%
Christie: 41%
Clinton: 43%
http://www.publicpolicypolling.com/pdf/2015/PPP_Release_NC_41015.pdf
Hillary Clinton vs. Jeb Bush
(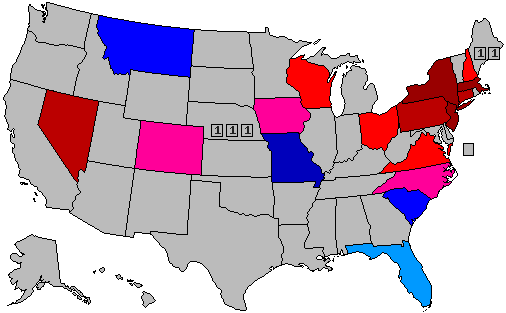 )
)
Hillary Clinton vs. Chris Christie
(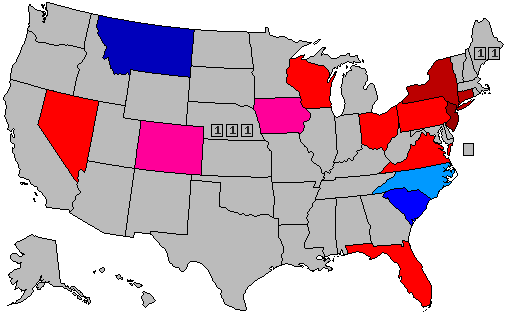 )
)
Hillary Clinton vs. Mike Huckabee
(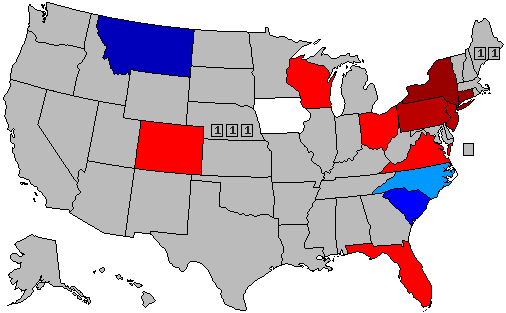 )
)
Hillary Clinton vs. Rand Paul
(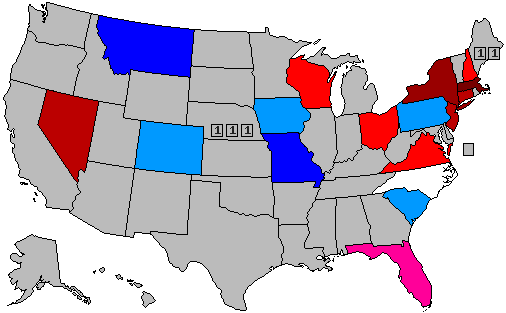 )
)
Hillary Clinton vs. Scott Walker
(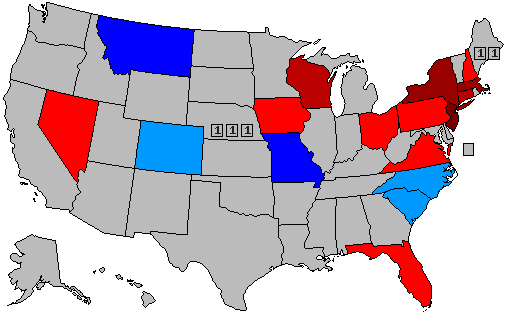 )
)
30% -- lead with 40-49% but a margin of 3% or less
40% -- lead with 40-49% but a margin of 4% or more
60% -- lead with 50-54%
70% -- lead with 55-59%
90% -- lead with 60% or more
Huckabee: 48%
Clinton: 43%
Walker: 46%
Clinton: 43%
Cruz: 45%
Clinton: 45%
Paul: 45%
Clinton: 45%
Bush: 44%
Clinton: 45%
Christie: 41%
Clinton: 43%
http://www.publicpolicypolling.com/pdf/2015/PPP_Release_NC_41015.pdf
Hillary Clinton vs. Jeb Bush
(
Hillary Clinton vs. Chris Christie
(
Hillary Clinton vs. Mike Huckabee
(
Hillary Clinton vs. Rand Paul
(
Hillary Clinton vs. Scott Walker
(
30% -- lead with 40-49% but a margin of 3% or less
40% -- lead with 40-49% but a margin of 4% or more
60% -- lead with 50-54%
70% -- lead with 55-59%
90% -- lead with 60% or more
Title: Re: 2016 Official Polling Map Thread
Post by: pbrower2a on April 10, 2015, 02:51:52 PM
We may be missing this. Any intelligent discussion of the 2016 Presidential election begins with this undeniable reality. Assuming that there will be no blowout victory for anyone (which would make for a numbing discussion)...
A composite of Presidential elections, 1992-2012:
(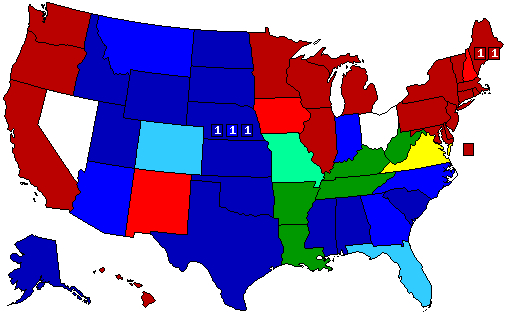 )
)
Deep red -- Democrats win every Presidential race.
Medium red -- Democrats win all but one Presidential race.
White -- always went with the winner
Pale blue -- went for the winner in all election, but in that exception went for the Republican
Yellow -- twice Democratic, but seeming to now drift Democratic
Green -- twice Democratic but seeming to drift Republican (Missouri in a light shade because Obama was close in 2008, others deep green)
Medium blue -- Republicans win all but one Presidential race.
Deep blue --Republicans win every Presidential race.
NE-02 is the middle box in Nebraska even if the district is Greater Omaha.
... Any information from before 1992 is irrelevant to current reality because the electoral results of 1980, 1984, and 1988 were blowouts and 1976 was so strangely different from any electoral map in the 1992 or later. Anyone who predicts that a state in deep (or even medium) red or deep (or even medium) blue is going to vote differently from how it has voted in the last six elections has some explaining to do. (Counter-intuitive reality exists, but it usually shows its truthfulness in ways that make it undeniable -- like West Virginia going to Bush in a close election in 2000 or Virginia going for Obama in what long looked like a close election in 2008. How California or Texas voted in 1976 or earlier no longer matters. States in pale shades or white can be understood as swing states in anything near a 50-50 election.
No state is in pink, so 'reasonable swing states' according to state voting patterns of the last twenty years suggest that
CO FL MO NV OH VA
are the real swing states.
If you see something out of recent norms happening in Arizona or Iowa, then you can add those. I would be tempted to replace MO with NC based on 2012 based on performance in 2008 and 2012 -- but that is a quibble in a rigid system. You might make an argument that some Democrat is a better match for states in green or that Virginia has gone Democratic twice only because of Obama and will not do so again. You can argue such and still be wrong, but you might have a reason. Polls will prove your contention or disprove it.
But if you say something like "Kansas must be getting sick of Republican pols", "the fast-growing Hispanic population dooms the Republicans in Arizona", "economic distress in the Rust Belt will cause blue-collar workers to abandon the Union Bosses for free-market solutions", or "Scott Walker is sure to win Wisconsin as a favorite son" you have some explaining to do and a need for evidence to support your position. Polls will be adequate.
A composite of Presidential elections, 1992-2012:
(
Deep red -- Democrats win every Presidential race.
Medium red -- Democrats win all but one Presidential race.
White -- always went with the winner
Pale blue -- went for the winner in all election, but in that exception went for the Republican
Yellow -- twice Democratic, but seeming to now drift Democratic
Green -- twice Democratic but seeming to drift Republican (Missouri in a light shade because Obama was close in 2008, others deep green)
Medium blue -- Republicans win all but one Presidential race.
Deep blue --Republicans win every Presidential race.
NE-02 is the middle box in Nebraska even if the district is Greater Omaha.
... Any information from before 1992 is irrelevant to current reality because the electoral results of 1980, 1984, and 1988 were blowouts and 1976 was so strangely different from any electoral map in the 1992 or later. Anyone who predicts that a state in deep (or even medium) red or deep (or even medium) blue is going to vote differently from how it has voted in the last six elections has some explaining to do. (Counter-intuitive reality exists, but it usually shows its truthfulness in ways that make it undeniable -- like West Virginia going to Bush in a close election in 2000 or Virginia going for Obama in what long looked like a close election in 2008. How California or Texas voted in 1976 or earlier no longer matters. States in pale shades or white can be understood as swing states in anything near a 50-50 election.
No state is in pink, so 'reasonable swing states' according to state voting patterns of the last twenty years suggest that
CO FL MO NV OH VA
are the real swing states.
If you see something out of recent norms happening in Arizona or Iowa, then you can add those. I would be tempted to replace MO with NC based on 2012 based on performance in 2008 and 2012 -- but that is a quibble in a rigid system. You might make an argument that some Democrat is a better match for states in green or that Virginia has gone Democratic twice only because of Obama and will not do so again. You can argue such and still be wrong, but you might have a reason. Polls will prove your contention or disprove it.
But if you say something like "Kansas must be getting sick of Republican pols", "the fast-growing Hispanic population dooms the Republicans in Arizona", "economic distress in the Rust Belt will cause blue-collar workers to abandon the Union Bosses for free-market solutions", or "Scott Walker is sure to win Wisconsin as a favorite son" you have some explaining to do and a need for evidence to support your position. Polls will be adequate.
Title: Re: 2016 Official Polling Map Thread
Post by: Ebsy on April 13, 2015, 12:13:55 PM
Oh, btw: CA has already been polled by Gravis. Paul leads Warren and is close to Clinton! Please include this poll...
Title: Re: 2016 Official Polling Map Thread
Post by: pbrower2a on April 14, 2015, 12:36:02 PM
California, Emerson College.
Likely a junk poll, but we don't see much from California. The interpretation is even worse. It comes through the San Diego CBS station with no warranty:
http://www.cbs8.com/story/28796548/emerson-college-poll-california-may-be-in-play-for-2016-presidential-race-harris-leads-in-us-senate-race-71-support-water-use-restrictions
We don't see many polls of California, but for now this is what we have. California media will pay attention to at the least the Senate race.
Hillary Clinton vs. Jeb Bush
( )
)
Hillary Clinton vs. Chris Christie
()
Hillary Clinton vs. Mike Huckabee
()
Hillary Clinton vs. Rand Paul
()
Hillary Clinton vs. Scott Walker
( )
)
30% -- lead with 40-49% but a margin of 3% or less
40% -- lead with 40-49% but a margin of 4% or more
60% -- lead with 50-54%
70% -- lead with 55-59%
90% -- lead with 60% or more
Likely a junk poll, but we don't see much from California. The interpretation is even worse. It comes through the San Diego CBS station with no warranty:
Quote
Hillary Clinton holds a commanding 46-point lead over Senator Elizabeth Warren, her nearest potential rival for the Democratic nomination. However, in head-to-head matchups with the top two GOP contenders, Jeb Bush and Scott Walker, Clinton's 53% to 47% edge is within the poll's margin of error of +/- 3.2%.
http://www.cbs8.com/story/28796548/emerson-college-poll-california-may-be-in-play-for-2016-presidential-race-harris-leads-in-us-senate-race-71-support-water-use-restrictions
We don't see many polls of California, but for now this is what we have. California media will pay attention to at the least the Senate race.
Hillary Clinton vs. Jeb Bush
(
Hillary Clinton vs. Chris Christie
(
Hillary Clinton vs. Mike Huckabee
(
Hillary Clinton vs. Rand Paul
(
Hillary Clinton vs. Scott Walker
(
30% -- lead with 40-49% but a margin of 3% or less
40% -- lead with 40-49% but a margin of 4% or more
60% -- lead with 50-54%
70% -- lead with 55-59%
90% -- lead with 60% or more
Title: Re: 2016 Official Polling Map Thread
Post by: pbrower2a on April 16, 2015, 07:50:48 PM
Marquette University, Wisconsin:
https://law.marquette.edu/poll/2015/04/16/marquette-law-school-poll-finds-walker-job-approval-down/
Hillary Clinton vs. Jeb Bush
()
Hillary Clinton vs. Chris Christie
()
Hillary Clinton vs. Mike Huckabee
()
Hillary Clinton vs. Rand Paul
()
Hillary Clinton vs. Scott Walker
()
30% -- lead with 40-49% but a margin of 3% or less
40% -- lead with 40-49% but a margin of 4% or more
60% -- lead with 50-54%
70% -- lead with 55-59%
90% -- lead with 60% or more
Quote
Clinton leads five potential Republican opponents in hypothetical 2016 matchups among registered voters. Clinton leads Paul 49-41, leads Bush 49-38, leads Walker 52-40, leads Rubio 50-38 and leads Cruz 52-36.
https://law.marquette.edu/poll/2015/04/16/marquette-law-school-poll-finds-walker-job-approval-down/
Hillary Clinton vs. Jeb Bush
(
Hillary Clinton vs. Chris Christie
(
Hillary Clinton vs. Mike Huckabee
(
Hillary Clinton vs. Rand Paul
(
Hillary Clinton vs. Scott Walker
(
30% -- lead with 40-49% but a margin of 3% or less
40% -- lead with 40-49% but a margin of 4% or more
60% -- lead with 50-54%
70% -- lead with 55-59%
90% -- lead with 60% or more
Title: Re: 2016 Official Polling Map Thread
Post by: pbrower2a on April 20, 2015, 09:00:43 AM
New Jersey, Quinnipiac.
Clinton (D)........ 51%
Christie (R)....... 36%
Clinton (D)....... 54%
Paul (R)........... 34%
Clinton (D)....... 56%
Huckabee (R)... 30%
Clinton (D)....... 53%
Bush (R).......... 33%
Clinton (D)........ 54%
Rubio (R).......... 34%
Clinton (D)....... 54%
Walker (R)....... 32%
Clinton (D)....... 58%
Cruz (R)........... 30%
http://www.quinnipiac.edu/images/polling/nj/nj04202015_Ngf735bu.pdf
Effectively no change. New Jersey will not be competitive in 2016.
Hillary Clinton vs. Jeb Bush
(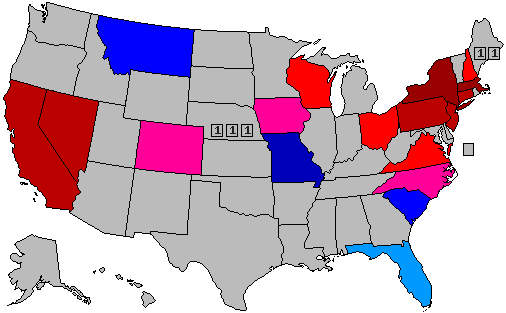 )
)
Hillary Clinton vs. Chris Christie
()
Hillary Clinton vs. Mike Huckabee
( )
)
Hillary Clinton vs. Rand Paul
()
Hillary Clinton vs. Scott Walker
(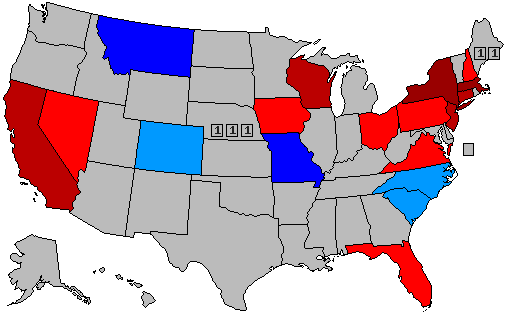 )
)
30% -- lead with 40-49% but a margin of 3% or less
40% -- lead with 40-49% but a margin of 4% or more
60% -- lead with 50-54%
70% -- lead with 55-59%
90% -- lead with 60% or more
Clinton (D)........ 51%
Christie (R)....... 36%
Clinton (D)....... 54%
Paul (R)........... 34%
Clinton (D)....... 56%
Huckabee (R)... 30%
Clinton (D)....... 53%
Bush (R).......... 33%
Clinton (D)........ 54%
Rubio (R).......... 34%
Clinton (D)....... 54%
Walker (R)....... 32%
Clinton (D)....... 58%
Cruz (R)........... 30%
http://www.quinnipiac.edu/images/polling/nj/nj04202015_Ngf735bu.pdf
Effectively no change. New Jersey will not be competitive in 2016.
Hillary Clinton vs. Jeb Bush
(
Hillary Clinton vs. Chris Christie
(
Hillary Clinton vs. Mike Huckabee
(
Hillary Clinton vs. Rand Paul
(
Hillary Clinton vs. Scott Walker
(
30% -- lead with 40-49% but a margin of 3% or less
40% -- lead with 40-49% but a margin of 4% or more
60% -- lead with 50-54%
70% -- lead with 55-59%
90% -- lead with 60% or more
Title: Re: 2016 Official Polling Map Thread
Post by: pbrower2a on April 20, 2015, 03:07:30 PM
http://www.argojournal.com/2015/03/poll-watch-emerson-college_0.html
Clinton 58%
Walker 38%
Clinton 59%
Bush 38%
Clinton 61%
Paul 36%
No change.
Hillary Clinton vs. Jeb Bush
()
Hillary Clinton vs. Chris Christie
()
Hillary Clinton vs. Mike Huckabee
()
Hillary Clinton vs. Rand Paul
()
Hillary Clinton vs. Scott Walker
()
30% -- lead with 40-49% but a margin of 3% or less
40% -- lead with 40-49% but a margin of 4% or more
60% -- lead with 50-54%
70% -- lead with 55-59%
90% -- lead with 60% or more
[/quote]
Clinton 58%
Walker 38%
Clinton 59%
Bush 38%
Clinton 61%
Paul 36%
No change.
Hillary Clinton vs. Jeb Bush
(
Hillary Clinton vs. Chris Christie
(
Hillary Clinton vs. Mike Huckabee
(
Hillary Clinton vs. Rand Paul
(
Hillary Clinton vs. Scott Walker
(
30% -- lead with 40-49% but a margin of 3% or less
40% -- lead with 40-49% but a margin of 4% or more
60% -- lead with 50-54%
70% -- lead with 55-59%
90% -- lead with 60% or more
[/quote]
Title: Re: 2016 Official Polling Map Thread
Post by: Mr. Morden on April 20, 2015, 05:52:44 PM
http://www.argojournal.com/2015/03/poll-watch-emerson-college_0.html
Clinton 58%
Walker 38%
Clinton 59%
Bush 38%
Clinton 61%
Paul 36%
No change.
Clinton 58%
Walker 38%
Clinton 59%
Bush 38%
Clinton 61%
Paul 36%
No change.
That's true. This poll hasn't changed in the past month, since the first time you added it:
Emerson College poll of Massachusetts:
http://www.argojournal.com/2015/03/poll-watch-emerson-college_0.html
Clinton 58%
Walker 38%
Clinton 59%
Bush 38%
Clinton 61%
Paul 36%
http://www.argojournal.com/2015/03/poll-watch-emerson-college_0.html
Clinton 58%
Walker 38%
Clinton 59%
Bush 38%
Clinton 61%
Paul 36%
Title: Re: 2016 Official Polling Map Thread
Post by: pbrower2a on April 20, 2015, 08:45:50 PM
http://www.argojournal.com/2015/03/poll-watch-emerson-college_0.html
Clinton 58%
Walker 38%
Clinton 59%
Bush 38%
Clinton 61%
Paul 36%
No change.
Clinton 58%
Walker 38%
Clinton 59%
Bush 38%
Clinton 61%
Paul 36%
No change.
That's true. This poll hasn't changed in the past month, since the first time you added it:
Emerson College poll of Massachusetts:
http://www.argojournal.com/2015/03/poll-watch-emerson-college_0.html
Clinton 58%
Walker 38%
Clinton 59%
Bush 38%
Clinton 61%
Paul 36%
http://www.argojournal.com/2015/03/poll-watch-emerson-college_0.html
Clinton 58%
Walker 38%
Clinton 59%
Bush 38%
Clinton 61%
Paul 36%
Whoops!
Title: Re: 2016 Official Polling Map Thread
Post by: pbrower2a on April 21, 2015, 12:17:12 PM
New Hampshire, PPP:
PPP's new New Hampshire poll finds Hillary Clinton with commanding leads over the entire Republican field in the state- she is up by anywhere from 9 to 15 points against the nine GOP contenders we tested her against. The hopefuls who come closest to Clinton are Rand Paul and Scott Walker, each of whom trail by 9 at 49/40. The ones who do the worst are Chris Christie (51/36) and Ted Cruz (52/37) who each have 15 point deficits. In between are Marco Rubio who trails by 12 at 50/38, and Jeb Bush (49/36), Ben Carson (51/38), Mike Huckabee (51/38), and Rick Perry (also 51/38) who all trail by 13 points.
http://www.publicpolicypolling.com/pdf/2015/PPP_Release_NH_42115.pdf
Comments:
1. New Hampshire looks at most on the fringe of competitiveness in the 2016 election.
2. Is New Hampshire more D than Pennsylvania? The poll in which Rand Paul is ahead of Hillary Clinton (barely) looks specious. He must have been the Flavor of the Month.
3. Does anyone still think that Mike Huckabee is anything more than a regional candidate?
Hillary Clinton vs. Jeb Bush
()
Hillary Clinton vs. Chris Christie
(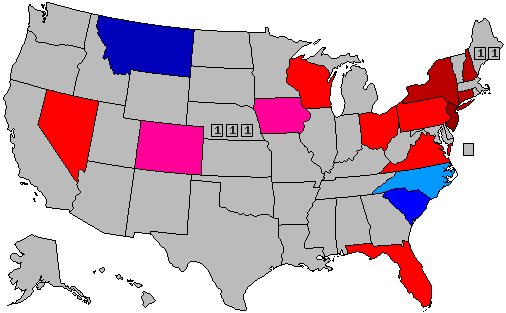 )
)
Hillary Clinton vs. Mike Huckabee
(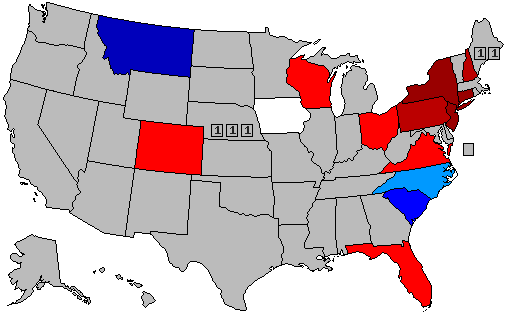 )
)
Hillary Clinton vs. Rand Paul
()
Hillary Clinton vs. Scott Walker
()
30% -- lead with 40-49% but a margin of 3% or less
40% -- lead with 40-49% but a margin of 4% or more
60% -- lead with 50-54%
70% -- lead with 55-59%
90% -- lead with 60% or more
PPP's new New Hampshire poll finds Hillary Clinton with commanding leads over the entire Republican field in the state- she is up by anywhere from 9 to 15 points against the nine GOP contenders we tested her against. The hopefuls who come closest to Clinton are Rand Paul and Scott Walker, each of whom trail by 9 at 49/40. The ones who do the worst are Chris Christie (51/36) and Ted Cruz (52/37) who each have 15 point deficits. In between are Marco Rubio who trails by 12 at 50/38, and Jeb Bush (49/36), Ben Carson (51/38), Mike Huckabee (51/38), and Rick Perry (also 51/38) who all trail by 13 points.
http://www.publicpolicypolling.com/pdf/2015/PPP_Release_NH_42115.pdf
Comments:
1. New Hampshire looks at most on the fringe of competitiveness in the 2016 election.
2. Is New Hampshire more D than Pennsylvania? The poll in which Rand Paul is ahead of Hillary Clinton (barely) looks specious. He must have been the Flavor of the Month.
3. Does anyone still think that Mike Huckabee is anything more than a regional candidate?
Hillary Clinton vs. Jeb Bush
(
Hillary Clinton vs. Chris Christie
(
Hillary Clinton vs. Mike Huckabee
(
Hillary Clinton vs. Rand Paul
(
Hillary Clinton vs. Scott Walker
(
30% -- lead with 40-49% but a margin of 3% or less
40% -- lead with 40-49% but a margin of 4% or more
60% -- lead with 50-54%
70% -- lead with 55-59%
90% -- lead with 60% or more
Title: Re: 2016 Official Polling Map Thread
Post by: pbrower2a on April 21, 2015, 12:23:23 PM
43-40 Rice/Clinton
44-43 Clinton/Paul
44-43 Clinton/Huckabee
43-40 Clinton/Bush
45-42 Clinton/Rubio
42-39 Clinton/Christie
46-41 Clinton/Walker
47-40 Clinton/Cruz
44-37 Clinton/Fiorina
45-37 Clinton/Carson
http://gravismarketing.com/polling-and-market-research/iowa-poll-bush-leads-crowded-gop-field-rice-beats-clinton-head-to-head-43-to-40/
Hillary Clinton vs. Jeb Bush
()
Hillary Clinton vs. Chris Christie
(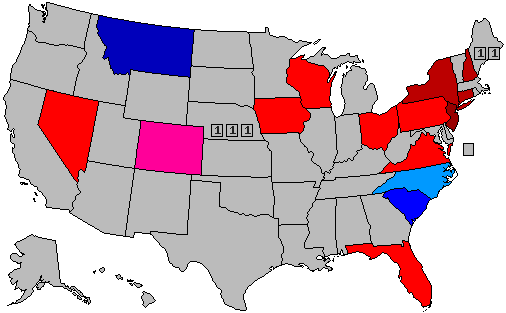 )
)
Hillary Clinton vs. Mike Huckabee
( )
)
Hillary Clinton vs. Rand Paul
(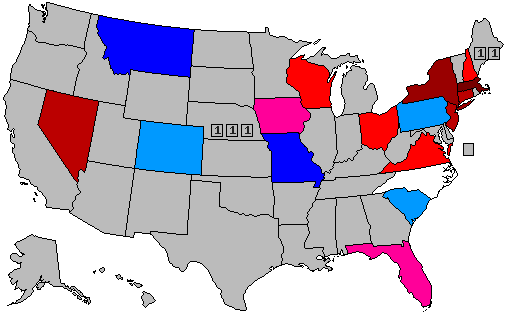 )
)
Hillary Clinton vs. Scott Walker
()
30% -- lead with 40-49% but a margin of 3% or less
40% -- lead with 40-49% but a margin of 4% or more
60% -- lead with 50-54%
70% -- lead with 55-59%
90% -- lead with 60% or more
44-43 Clinton/Paul
44-43 Clinton/Huckabee
43-40 Clinton/Bush
45-42 Clinton/Rubio
42-39 Clinton/Christie
46-41 Clinton/Walker
47-40 Clinton/Cruz
44-37 Clinton/Fiorina
45-37 Clinton/Carson
http://gravismarketing.com/polling-and-market-research/iowa-poll-bush-leads-crowded-gop-field-rice-beats-clinton-head-to-head-43-to-40/
Hillary Clinton vs. Jeb Bush
(
Hillary Clinton vs. Chris Christie
(
Hillary Clinton vs. Mike Huckabee
(
Hillary Clinton vs. Rand Paul
(
Hillary Clinton vs. Scott Walker
(
30% -- lead with 40-49% but a margin of 3% or less
40% -- lead with 40-49% but a margin of 4% or more
60% -- lead with 50-54%
70% -- lead with 55-59%
90% -- lead with 60% or more
Title: Re: 2016 Official Polling Map Thread
Post by: pbrower2a on April 21, 2015, 02:14:15 PM
Will you make Clinton vs. Rubio maps, too?
Whom do you suggest that I drop? I'm thinking of dropping Christie.
I am tempted to do so if Marco Rubio abandons all efforts to hold his Senate seat.
Title: Re: 2016 Official Polling Map Thread
Post by: Flake on April 21, 2015, 02:15:41 PM
Will you make Clinton vs. Rubio maps, too?
Whom do you suggest that I drop? I'm thinking of dropping Christie.
I am tempted to do so if Marco Rubio abandons all efforts to hold his Senate seat.
Yes, drop Christie.
Title: Re: 2016 Official Polling Map Thread
Post by: pbrower2a on April 21, 2015, 07:41:06 PM
Rubio it is. Farewell, Christie!
Hillary Clinton vs. Jeb Bush
()
Hillary Clinton vs. Mike Huckabee
()
Hillary Clinton vs. Rand Paul
()
Hillary Clinton vs. Marco Rubio
(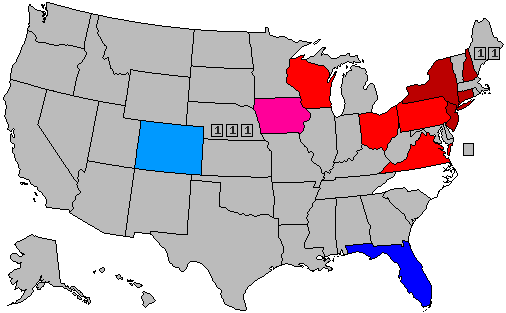 )
)
Hillary Clinton vs. Scott Walker
()
30% -- lead with 40-49% but a margin of 3% or less
40% -- lead with 40-49% but a margin of 4% or more
60% -- lead with 50-54%
70% -- lead with 55-59%
90% -- lead with 60% or more
Hillary Clinton vs. Jeb Bush
(
Hillary Clinton vs. Mike Huckabee
(
Hillary Clinton vs. Rand Paul
(
Hillary Clinton vs. Marco Rubio
(
Hillary Clinton vs. Scott Walker
(
30% -- lead with 40-49% but a margin of 3% or less
40% -- lead with 40-49% but a margin of 4% or more
60% -- lead with 50-54%
70% -- lead with 55-59%
90% -- lead with 60% or more
Title: Re: 2016 Official Polling Map Thread
Post by: pbrower2a on April 21, 2015, 11:02:28 PM
Why do we have no credible polls on Arizona, Georgia, or Missouri?
Title: Re: 2016 Official Polling Map Thread
Post by: Ebsy on April 21, 2015, 11:17:06 PM
Why do we have no credible polls on Arizona, Georgia, or Missouri?
Title: Re: 2016 Official Polling Map Thread
Post by: pbrower2a on April 24, 2015, 01:25:58 PM
I'd like to see these polled:
AK (does Begich have a chance should Murkowski be primaried, or would he be wise to go for the House?)
AZ (is John McCain vulnerable?)
AR (are the Bill Clinton-but not Obama states really lost forever to the Democrats?)
GA (whatever happened to a once-moderate state?)
IL (does Mark Kirk have some survival skills as a Senator?)
IN (lots of luck!)
KS (is discontent brewing with the GOP in Kansas as there seemed to be last year?)
MI (there used to be lots of crappy polls -- but no Senate race)
MN (Klobuchar in case something happens to Hillary Clinton?)
MO (once and for all -- is it at all a bellwether state)?
NE-02 (split between 2008 and 2012)
OR (new Governor)
TX (with a huge grain of salt -- the state is tough to poll)
UT (acceptance of SSM)
Title: Re: 2016 Official Polling Map Thread
Post by: pbrower2a on April 27, 2015, 08:14:41 AM
54-34 Clinton/Christie
55-32 Clinton/Bush
59-30 Clinton/Rubio
58-29 Clinton/Paul
59-26 Clinton/Cruz
https://www.siena.edu/news-events/article/voters-dont-think-new-laws-will-reduce-corruption-say-cuomo-was-right-to-no
Hillary Clinton vs. Jeb Bush
()
Hillary Clinton vs. Mike Huckabee
()
Hillary Clinton vs. Rand Paul
()
Hillary Clinton vs. Marco Rubio
(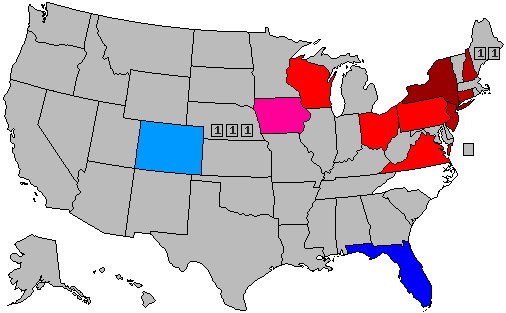 )
)
Hillary Clinton vs. Scott Walker
()
30% -- lead with 40-49% but a margin of 3% or less
40% -- lead with 40-49% but a margin of 4% or more
60% -- lead with 50-54%
70% -- lead with 55-59%
90% -- lead with 60% or more
55-32 Clinton/Bush
59-30 Clinton/Rubio
58-29 Clinton/Paul
59-26 Clinton/Cruz
https://www.siena.edu/news-events/article/voters-dont-think-new-laws-will-reduce-corruption-say-cuomo-was-right-to-no
Hillary Clinton vs. Jeb Bush
(
Hillary Clinton vs. Mike Huckabee
(
Hillary Clinton vs. Rand Paul
(
Hillary Clinton vs. Marco Rubio
(
Hillary Clinton vs. Scott Walker
(
30% -- lead with 40-49% but a margin of 3% or less
40% -- lead with 40-49% but a margin of 4% or more
60% -- lead with 50-54%
70% -- lead with 55-59%
90% -- lead with 60% or more
Title: Re: 2016 Official Polling Map Thread
Post by: pbrower2a on April 27, 2015, 08:20:32 AM
Virginia, Christopher Newport University (never heard of them)
48-46 Bush/Clinton (Feb. poll: 48-43 Clinton)
47-45 Clinton/Christie (Feb. poll: 49-42 Clinton)
49-47 Clinton/Paul (Feb. poll: 52-42 Clinton)
49-46 Clinton/Huckabee (Feb. poll: 52-42 Clinton)
49-45 Clinton/Rubio (Feb. poll: 51-42 Clinton)
49-44 Clinton/Cruz (Feb. poll: not polled)
48-43 Clinton/Walker (Feb. poll: not polled)
How the survey was conducted:
The results of this poll are based on 658
interviews of registered Virginia voters,
including 388 on landline and 270 on cell phone,
conducted April 13-24, 2015. Percentages may
not equal 100 due to rounding. The margin of
error for the whole survey is +/- 4.6% at the 95%
level of confidence. All error margins have been
adjusted to account for the surveys design
effect, which is 1.47 in this survey. The design
effect is a factor representing the surveys
deviation from a simple random sample, and
takes into account decreases in precision due to
sample design and weighting procedures. In
addition to sampling error, the other potential
sources of error include non-response, question
wording, and interviewer error. The response
rate (AAPOR RRI Standard Definition) for the
survey was 19%. Five callbacks were employed
in the fielding process. Live calling was
conducted by trained interviewers at the Wason
Center for Public Policy Survey Research Lab at
Christopher Newport University. The data
reported here are weighted using an iterative
weighting process on sex, age, race and region of
residence to reflect as closely as possible the
demographic composition of registered voters in
Virginia. The survey was designed by Dr.
Quentin Kidd of the Wason Center for Public
Policy at Christopher Newport University.
http://cnu.edu/cpp/pdf/April%2027%202015%20Report%20Final.pdf
Hillary Clinton vs. Jeb Bush
(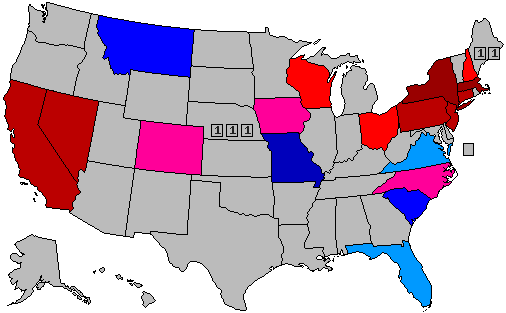 )
)
Hillary Clinton vs. Mike Huckabee
(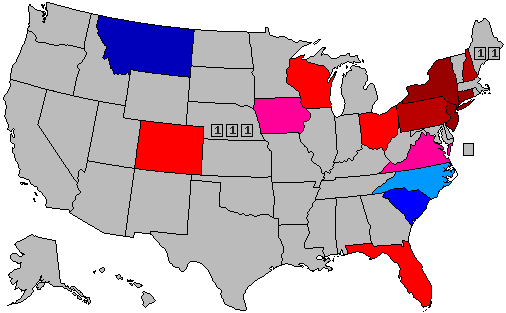 )
)
Hillary Clinton vs. Rand Paul
( )
)
Hillary Clinton vs. Marco Rubio
()
Hillary Clinton vs. Scott Walker
()
30% -- lead with 40-49% but a margin of 3% or less
40% -- lead with 40-49% but a margin of 4% or more
60% -- lead with 50-54%
70% -- lead with 55-59%
90% -- lead with 60% or more
48-46 Bush/Clinton (Feb. poll: 48-43 Clinton)
47-45 Clinton/Christie (Feb. poll: 49-42 Clinton)
49-47 Clinton/Paul (Feb. poll: 52-42 Clinton)
49-46 Clinton/Huckabee (Feb. poll: 52-42 Clinton)
49-45 Clinton/Rubio (Feb. poll: 51-42 Clinton)
49-44 Clinton/Cruz (Feb. poll: not polled)
48-43 Clinton/Walker (Feb. poll: not polled)
How the survey was conducted:
The results of this poll are based on 658
interviews of registered Virginia voters,
including 388 on landline and 270 on cell phone,
conducted April 13-24, 2015. Percentages may
not equal 100 due to rounding. The margin of
error for the whole survey is +/- 4.6% at the 95%
level of confidence. All error margins have been
adjusted to account for the surveys design
effect, which is 1.47 in this survey. The design
effect is a factor representing the surveys
deviation from a simple random sample, and
takes into account decreases in precision due to
sample design and weighting procedures. In
addition to sampling error, the other potential
sources of error include non-response, question
wording, and interviewer error. The response
rate (AAPOR RRI Standard Definition) for the
survey was 19%. Five callbacks were employed
in the fielding process. Live calling was
conducted by trained interviewers at the Wason
Center for Public Policy Survey Research Lab at
Christopher Newport University. The data
reported here are weighted using an iterative
weighting process on sex, age, race and region of
residence to reflect as closely as possible the
demographic composition of registered voters in
Virginia. The survey was designed by Dr.
Quentin Kidd of the Wason Center for Public
Policy at Christopher Newport University.
http://cnu.edu/cpp/pdf/April%2027%202015%20Report%20Final.pdf
Hillary Clinton vs. Jeb Bush
(
Hillary Clinton vs. Mike Huckabee
(
Hillary Clinton vs. Rand Paul
(
Hillary Clinton vs. Marco Rubio
(
Hillary Clinton vs. Scott Walker
(
30% -- lead with 40-49% but a margin of 3% or less
40% -- lead with 40-49% but a margin of 4% or more
60% -- lead with 50-54%
70% -- lead with 55-59%
90% -- lead with 60% or more
Title: Re: 2016 Official Polling Map Thread
Post by: Mr. Illini on April 27, 2015, 01:16:22 PM
Illinois is always grossly underpolled
Title: Re: 2016 Official Polling Map Thread
Post by: pbrower2a on April 27, 2015, 02:16:24 PM
When Rick Snyder announces that he is running for President, then Michigan will be polled.
Title: Re: 2016 Official Polling Map Thread
Post by: pbrower2a on April 29, 2015, 07:04:55 AM
PPP, Iowa
Clinton 45% Bush 42%
Clinton 48% Carson 41%
Clinton 45% Christie 40%
Clinton 49% Cruz 42%
Clinton 46% Huckabee 44%
Clinton 45% Paul 43%
Clinton 48% Perry 41%
Clinton 46% Rubio 44%
Clinton 48% Walker 41%
http://www.publicpolicypolling.com/main/2015/05/clinton-leads-gop-field-in-iowa-walker-leads-other-dems.html
Hillary Clinton vs. Jeb Bush
()
Hillary Clinton vs. Mike Huckabee
(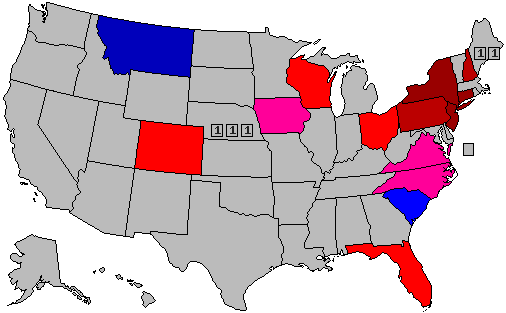 )
)
Hillary Clinton vs. Rand Paul
(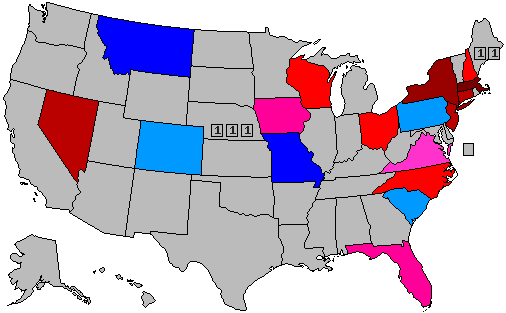 )
)
Hillary Clinton vs. Marco Rubio
(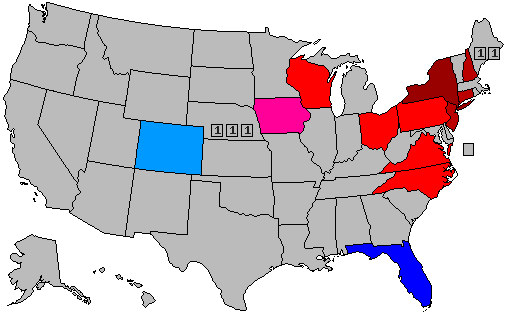 )
)
Hillary Clinton vs. Scott Walker
(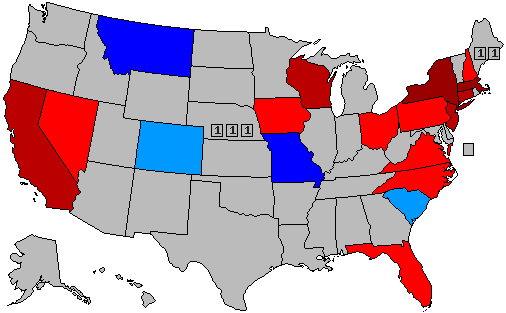 )
)
30% -- lead with 40-49% but a margin of 3% or less
40% -- lead with 40-49% but a margin of 4% or more
60% -- lead with 50-54%
70% -- lead with 55-59%
90% -- lead with 60% or more
Clinton 45% Bush 42%
Clinton 48% Carson 41%
Clinton 45% Christie 40%
Clinton 49% Cruz 42%
Clinton 46% Huckabee 44%
Clinton 45% Paul 43%
Clinton 48% Perry 41%
Clinton 46% Rubio 44%
Clinton 48% Walker 41%
http://www.publicpolicypolling.com/main/2015/05/clinton-leads-gop-field-in-iowa-walker-leads-other-dems.html
Hillary Clinton vs. Jeb Bush
(
Hillary Clinton vs. Mike Huckabee
(
Hillary Clinton vs. Rand Paul
(
Hillary Clinton vs. Marco Rubio
(
Hillary Clinton vs. Scott Walker
(
30% -- lead with 40-49% but a margin of 3% or less
40% -- lead with 40-49% but a margin of 4% or more
60% -- lead with 50-54%
70% -- lead with 55-59%
90% -- lead with 60% or more
Title: Re: 2016 Official Polling Map Thread
Post by: IceSpear on April 29, 2015, 12:16:30 PM
Seeing VA as R and NC as D on the Jeb Bush map is amusing.
Also, you messed up with Walker in NC.
Also, you messed up with Walker in NC.
Title: Re: 2016 Official Polling Map Thread
Post by: Ebsy on April 29, 2015, 01:01:31 PM
Also, you messed up with Walker in NC.
Title: Re: 2016 Official Polling Map Thread
Post by: pbrower2a on April 29, 2015, 01:05:18 PM
Also, you messed up with Walker in NC.
Corrected.
Title: Re: 2016 Official Polling Map Thread
Post by: mds32 on April 30, 2015, 07:46:12 PM
Also Marco Rubio leads in Montana
Title: Re: 2016 Official Polling Map Thread
Post by: pbrower2a on April 30, 2015, 11:16:11 PM
Also Marco Rubio leads in Montana
The Gravis poll that I used did not show a Clinton-Rubio matchup. Rubio would probably lead in Montana... and he would probably be behind in Nevada.
I do not deal in 'probably' on these maps.
Title: Re: 2016 Official Polling Map Thread
Post by: pbrower2a on May 01, 2015, 12:03:36 PM
By mistake I posted the Iowa poll over a Survey USA poll of North Carolina. Here's what I accidentally excised, and it is back for your view.
1070 November 2016 Likely Voters:
45-43 Clinton/Bush
47-43 Clinton/Paul
46-41 Clinton/Rubio
47-42 Clinton/Cruz
48-39 Clinton/Walker
44-42 Clinton/"some other Republican"
...
Filtering: SurveyUSA interviewed 1,275 North Carolina adults 4/22/15 through 4/27/15. Of them, 1,123 were registered to vote. Of the registered voters, 1,070 were identified by SurveyUSA as being likely to vote in the November 2016 election for President. Research conducted using blended sample, mixed mode. Respondents reachable on a home telephone were interviewed on their home telephone in the recorded voice of a professional announcer. Respondents not reachable on a home telephone were shown a questionnaire on their smartphone, tablet or other electronic device.
http://www.surveyusa.com/client/PollReport.aspx?g=e12280bf-3fbd-4bb8-876a-b484c2a95cb4
...I am treating Mike Huckabee as "some other Republican".
1070 November 2016 Likely Voters:
45-43 Clinton/Bush
47-43 Clinton/Paul
46-41 Clinton/Rubio
47-42 Clinton/Cruz
48-39 Clinton/Walker
44-42 Clinton/"some other Republican"
...
Quote
Filtering: SurveyUSA interviewed 1,275 North Carolina adults 4/22/15 through 4/27/15. Of them, 1,123 were registered to vote. Of the registered voters, 1,070 were identified by SurveyUSA as being likely to vote in the November 2016 election for President. Research conducted using blended sample, mixed mode. Respondents reachable on a home telephone were interviewed on their home telephone in the recorded voice of a professional announcer. Respondents not reachable on a home telephone were shown a questionnaire on their smartphone, tablet or other electronic device.
http://www.surveyusa.com/client/PollReport.aspx?g=e12280bf-3fbd-4bb8-876a-b484c2a95cb4
...I am treating Mike Huckabee as "some other Republican".
Title: Re: 2016 Official Polling Map Thread
Post by: pbrower2a on May 06, 2015, 03:30:26 PM
PPP. Arizona.
Chris Christie .................................................. 46%
Hillary Clinton.................................................. 39%
Rand Paul ....................................................... 45%
Hillary Clinton.................................................. 40%
Mike Huckabee ............................................... 44%
Hillary Clinton.................................................. 41%
Marco Rubio ................................................... 43%
Hillary Clinton.................................................. 41%
Scott Walker ................................................... 44%
Hillary Clinton.................................................. 43%
Ted Cruz ......................................................... 44%
Hillary Clinton.................................................. 43%
Hillary Clinton.................................................. 41%
Jeb Bush......................................................... 41%
Hillary Clinton.................................................. 42%
Ben Carson..................................................... 42%
Hillary Clinton.................................................. 44%
Rick Perry ....................................................... 41%
http://www.publicpolicypolling.com/main/2015/05/clinton-close-to-most-republicans-in-arizona.html
Republicans will need to defend Arizona just to protect a Senate seat. So far Arizona looks like a possible swing state in 2016.
If Hillary Clinton is winning a blowout she may be helping a Democratic nominee for the Senate with appearances... and that could be enough to flip Arizona. Demographics could start to hurt Republicans in Arizona. as they did in Colorado and Nevada in 2008 and 2012.
Hillary Clinton vs. Jeb Bush
( )
)
Hillary Clinton vs. Mike Huckabee
(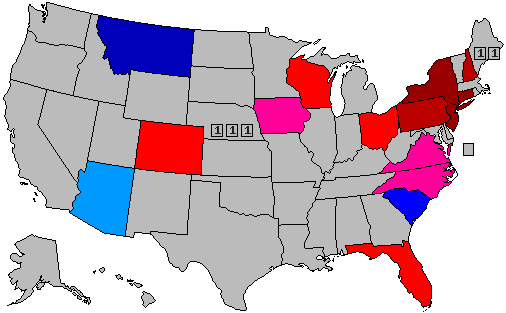 )
)
Hillary Clinton vs. Rand Paul
(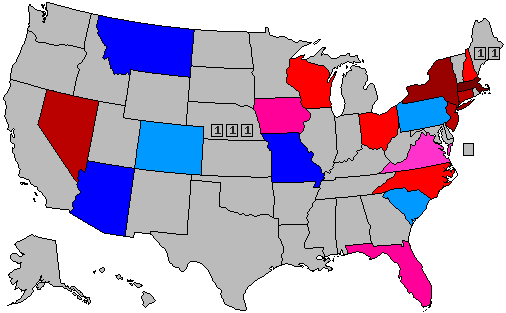 )
)
Hillary Clinton vs. Marco Rubio
( )
)
Hillary Clinton vs. Scott Walker
(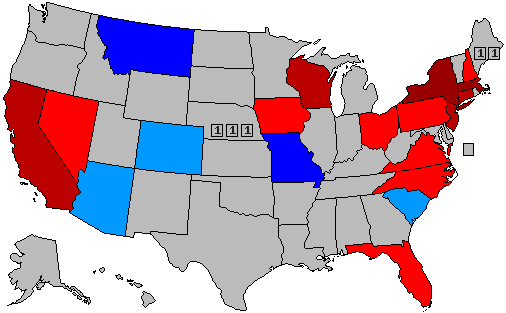 )
)
30% -- lead with 40-49% but a margin of 3% or less
40% -- lead with 40-49% but a margin of 4% or more
60% -- lead with 50-54%
70% -- lead with 55-59%
90% -- lead with 60% or more
Chris Christie .................................................. 46%
Hillary Clinton.................................................. 39%
Rand Paul ....................................................... 45%
Hillary Clinton.................................................. 40%
Mike Huckabee ............................................... 44%
Hillary Clinton.................................................. 41%
Marco Rubio ................................................... 43%
Hillary Clinton.................................................. 41%
Scott Walker ................................................... 44%
Hillary Clinton.................................................. 43%
Ted Cruz ......................................................... 44%
Hillary Clinton.................................................. 43%
Hillary Clinton.................................................. 41%
Jeb Bush......................................................... 41%
Hillary Clinton.................................................. 42%
Ben Carson..................................................... 42%
Hillary Clinton.................................................. 44%
Rick Perry ....................................................... 41%
http://www.publicpolicypolling.com/main/2015/05/clinton-close-to-most-republicans-in-arizona.html
Republicans will need to defend Arizona just to protect a Senate seat. So far Arizona looks like a possible swing state in 2016.
If Hillary Clinton is winning a blowout she may be helping a Democratic nominee for the Senate with appearances... and that could be enough to flip Arizona. Demographics could start to hurt Republicans in Arizona. as they did in Colorado and Nevada in 2008 and 2012.
Hillary Clinton vs. Jeb Bush
(
Hillary Clinton vs. Mike Huckabee
(
Hillary Clinton vs. Rand Paul
(
Hillary Clinton vs. Marco Rubio
(
Hillary Clinton vs. Scott Walker
(
30% -- lead with 40-49% but a margin of 3% or less
40% -- lead with 40-49% but a margin of 4% or more
60% -- lead with 50-54%
70% -- lead with 55-59%
90% -- lead with 60% or more
Title: Re: 2016 Official Polling Map Thread
Post by: pbrower2a on May 07, 2015, 01:28:24 PM
Arizona suggests that any gains that Hillary Clinton has gotten are in states that did not go for Barack Obama. Of course that is only one state; I would like to see Georgia and Missouri as well.
Title: Re: 2016 Official Polling Map Thread
Post by: pbrower2a on May 08, 2015, 09:13:00 AM
Before anyone asks me why I am not using the UNH-WMUR poll for New Hampshire -- the sample is R+5. New Hampshire was D+1 in 2014. It might be appropriate for the caucuses; I expect heavy R participation in the caucuses and light D participation in the caucuses. The big one? The general election? That's the one I have my focus on.
Title: Re: 2016 Official Polling Map Thread
Post by: Mr. Morden on May 08, 2015, 11:36:55 AM
It might be appropriate for the caucuses; I expect heavy R participation in the caucuses and light D participation in the caucuses.
I expect zero participation in the caucuses, since New Hampshire doesn't hold caucuses.
Title: Re: 2016 Official Polling Map Thread
Post by: Tender Branson on May 08, 2015, 11:43:37 AM
Before anyone asks me why I am not using the UNH-WMUR poll for New Hampshire -- the sample is R+5. New Hampshire was D+1 in 2014. It might be appropriate for the caucuses; I expect heavy R participation in the caucuses and light D participation in the caucuses. The big one? The general election? That's the one I have my focus on.
You are not using the NH poll because it shows Republicans ahead, that's the only reason.
First Mason-Dixon, now this ...
I may as well lock this thread or delete it if you are not using all polls.
Title: Re: 2016 Official Polling Map Thread
Post by: pbrower2a on May 08, 2015, 11:48:19 AM
Before anyone asks me why I am not using the UNH-WMUR poll for New Hampshire -- the sample is R+5. New Hampshire was D+1 in 2014. It might be appropriate for the caucuses; I expect heavy R participation in the caucuses and light D participation in the caucuses. The big one? The general election? That's the one I have my focus on.
You are not using the NH poll because it shows Republicans ahead, that's the only reason.
First Mason-Dixon, now this ...
I may as well lock this thread or delete it if you are not using all polls.
It also showed Barack Obama with a 34% approval rating, which is inconsistent with the President being in the high 40s nationwide.
A caucus vote is not relevant to November 2016. The general electorate vote of 2016 will be very different from the primary of caucus vote in any state. My desire is to use polls to predict the general election.
I'm paying no attention to caucuses and primaries.
Title: Re: 2016 Official Polling Map Thread
Post by: Tender Branson on May 08, 2015, 11:51:04 AM
Before anyone asks me why I am not using the UNH-WMUR poll for New Hampshire -- the sample is R+5. New Hampshire was D+1 in 2014. It might be appropriate for the caucuses; I expect heavy R participation in the caucuses and light D participation in the caucuses. The big one? The general election? That's the one I have my focus on.
You are not using the NH poll because it shows Republicans ahead, that's the only reason.
First Mason-Dixon, now this ...
I may as well lock this thread or delete it if you are not using all polls.
A caucus vote is not relevant to November 2016. The general electorate vote of 2016 will be very different from the primary of caucus vote in any state.
What are you talking about ?
This was a poll of GE voters in NH, not "caucus" voters.
Title: Re: 2016 Official Polling Map Thread
Post by: Mr. Morden on May 08, 2015, 11:58:29 AM
Before anyone asks me why I am not using the UNH-WMUR poll for New Hampshire -- the sample is R+5. New Hampshire was D+1 in 2014. It might be appropriate for the caucuses; I expect heavy R participation in the caucuses and light D participation in the caucuses. The big one? The general election? That's the one I have my focus on.
You are not using the NH poll because it shows Republicans ahead, that's the only reason.
First Mason-Dixon, now this ...
I may as well lock this thread or delete it if you are not using all polls.
A caucus vote is not relevant to November 2016. The general electorate vote of 2016 will be very different from the primary of caucus vote in any state.
What are you talking about ?
This was a poll of GE voters in NH, not "caucus" voters.
Not to mention, as I said, there is no caucus in NH. I don't know what pbrower is on about.
Title: Re: 2016 Official Polling Map Thread
Post by: pbrower2a on May 08, 2015, 12:05:55 PM
Sorry -- first primary in the US election. My goof.
Here's the poll, and see why I discount it:
http://cola.unh.edu/sites/cola.unh.edu/files/research_publications/gsp2015_spring_presgen050715.pdf
Granite State Poll Methodology
It's about the primary election -- not the general election! Hillary Clinton is practically a foregone conclusion in the Democratic primary; the Republicans look to have plenty of choices.
Does anyone think that the New Hampshire general election is going to go 42% Republican, 37% Democratic?
New Hampshire is close to a 50-50 split in most statewide elections.
Here's the poll, and see why I discount it:
http://cola.unh.edu/sites/cola.unh.edu/files/research_publications/gsp2015_spring_presgen050715.pdf
Granite State Poll Methodology
Quote
These findings are based on the latest WMUR Granite State Poll, conducted by the University of New Hampshire Survey Center. Seven hundred and six (706) randomly selected New Hampshire adults were interviewed by landline and cellular telephone between April 24 and May 3, 2015. The margin of sampling error is +/-3.7 percent. Included were two hundred
ninety-three (293) likely 2016 Republican Primary voters (MSE = +/-5.7), two hundred twenty-nine (229) likely 2016 Democratic Primary voters (MSE = +/- 6.5), and six hundred and twenty-seven (627) likely 2016 presidential election voters
ninety-three (293) likely 2016 Republican Primary voters (MSE = +/-5.7), two hundred twenty-nine (229) likely 2016 Democratic Primary voters (MSE = +/- 6.5), and six hundred and twenty-seven (627) likely 2016 presidential election voters
It's about the primary election -- not the general election! Hillary Clinton is practically a foregone conclusion in the Democratic primary; the Republicans look to have plenty of choices.
Does anyone think that the New Hampshire general election is going to go 42% Republican, 37% Democratic?
New Hampshire is close to a 50-50 split in most statewide elections.
Title: Re: 2016 Official Polling Map Thread
Post by: Mr. Morden on May 08, 2015, 05:54:44 PM
Quote
These findings are based on the latest WMUR Granite State Poll, conducted by the University of New Hampshire Survey Center. Seven hundred and six (706) randomly selected New Hampshire adults were interviewed by landline and cellular telephone between April 24 and May 3, 2015. The margin of sampling error is +/-3.7 percent. Included were two hundred
ninety-three (293) likely 2016 Republican Primary voters (MSE = +/-5.7), two hundred twenty-nine (229) likely 2016 Democratic Primary voters (MSE = +/- 6.5), and six hundred and twenty-seven (627) likely 2016 presidential election voters
ninety-three (293) likely 2016 Republican Primary voters (MSE = +/-5.7), two hundred twenty-nine (229) likely 2016 Democratic Primary voters (MSE = +/- 6.5), and six hundred and twenty-seven (627) likely 2016 presidential election voters
It's about the primary election -- not the general election! Hillary Clinton is practically a foregone conclusion in the Democratic primary; the Republicans look to have plenty of choices.
Does anyone think that the New Hampshire general election is going to go 42% Republican, 37% Democratic?
No, you don't understand how polling works. This is like the third time I've explained this on this board in the past week. You can't say 229/627 = 37%, so they're making this sample 37% Democratic, because like every pollster they use weighting. They're sampling an excess number of Democratic voters and an excess number of Republican voters (because they're simultaneously doing a primary polling question, and then weighting them a certain way in the GE matchup questions to match what they consider "likely GE voters". Half the polls you post here are doing the same thing (though most of them are weighting to registered voters). Their actual partisan breakdown, when they do weighting, is on page 6 of the writeup:
undeclared 45%
Republican 30%
Democrats 25%
You might also consider that too Republican-heavy, but have you actually been scrutinizing all of the partisan breakdowns for all the other polls you've been posting here, or did you just pick this one to toss out on these grounds, because you don't like the result?
Title: Re: 2016 Official Polling Map Thread
Post by: pbrower2a on May 08, 2015, 06:24:51 PM
I saw no indication of weighting on partisan identity. Other things -- but not partisan identity. Yes, it is possible to get a statewide prediction for a state that splits nearly 50-50 even if one has a 6-1 edge in polling numbers for one party.
I also saw the approval rating for President Obama. No way is his approval rating in the mid-thirties in New Hampshire when it is in the high forties nationwide.
PPP commonly asks how people voted in the previous Presidential election. Thus if one sees a split of 49 Romney-47 Obama in Michigan in 2012, one must see that poll with some suspicion.
Title: Re: 2016 Official Polling Map Thread
Post by: Mr. Morden on May 08, 2015, 07:19:38 PM
I saw no indication of weighting on partisan identity. Other things -- but not partisan identity. Yes, it is possible to get a statewide prediction for a state that splits nearly 50-50 even if one has a 6-1 edge in polling numbers for one party.
Page 6 of the poll, from the PDF you posted:
Party Registration
144 Democrat 25%
260 Undeclared 45%
170 Republican 30%
Party Identification
249 Democrat 40%
102 Independent 17%
266 Republican 43%
This is different from the 229 Democratic primary voters and 293 Republican primary voters you mentioned, because they're weighting differently for the two primary polling subsamples that they did, whereas the numbers that I just listed above are the general election sample. Lots of pollsters conduct primary and general election polling in the same poll, and you've never had a problem with it before, so I don't see what the issue is.
Title: Re: 2016 Official Polling Map Thread
Post by: pbrower2a on May 09, 2015, 12:17:36 PM
First Michigan poll, this one by a Republican-leaning poster. So far I see only one usable bit of information, but this tweet gives us a taste of what is to come:
This is the first poll involving the 2016 Presidential election in Michigan.
I'm watching for more.
Hillary Clinton vs. Jeb Bush
(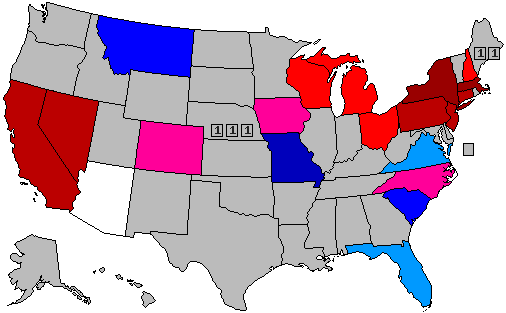 )
)
Hillary Clinton vs. Mike Huckabee
()
Hillary Clinton vs. Rand Paul
()
Hillary Clinton vs. Marco Rubio
()
Hillary Clinton vs. Scott Walker
()
30% -- lead with 40-49% but a margin of 3% or less
40% -- lead with 40-49% but a margin of 4% or more
60% -- lead with 50-54%
70% -- lead with 55-59%
90% -- lead with 60% or more
[/quote]
Quote
MRG Survey: Clinton has a 45% to 40% lead over Gov. Snyder, and a 47% to 38% lead over Bush
This is the first poll involving the 2016 Presidential election in Michigan.
I'm watching for more.
Hillary Clinton vs. Jeb Bush
(
Hillary Clinton vs. Mike Huckabee
(
Hillary Clinton vs. Rand Paul
(
Hillary Clinton vs. Marco Rubio
(
Hillary Clinton vs. Scott Walker
(
30% -- lead with 40-49% but a margin of 3% or less
40% -- lead with 40-49% but a margin of 4% or more
60% -- lead with 50-54%
70% -- lead with 55-59%
90% -- lead with 60% or more
[/quote]
Title: Re: 2016 Official Polling Map Thread
Post by: pbrower2a on May 10, 2015, 11:11:51 AM
Bloomberg/St. Anselm's College
Clinton 44, Bush 42
Clinton 44, Rubio 42
Clinton 46, Paul 43
Clinton 46, Walker 40
http://images.businessweek.com/cms/2015-05-08/150510_methodology_final_31343.pdf
New Hampshire is a legitimate swing state. -- if one speaks of NH primary voters.
Hillary Clinton vs. Jeb Bush
(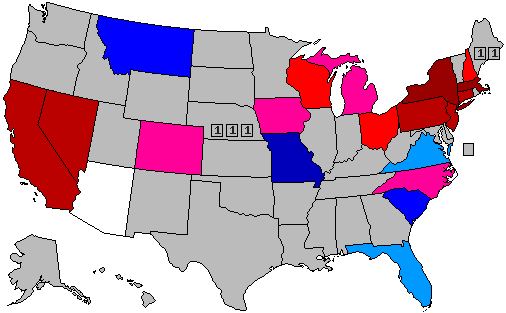 )
)
Hillary Clinton vs. Mike Huckabee
()
Hillary Clinton vs. Rand Paul
()
Hillary Clinton vs. Marco Rubio
(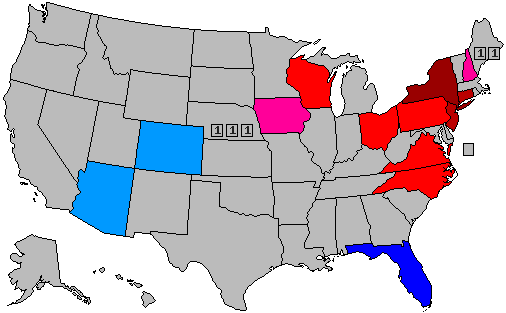 )
)
Hillary Clinton vs. Scott Walker
()
30% -- lead with 40-49% but a margin of 3% or less
40% -- lead with 40-49% but a margin of 4% or more
60% -- lead with 50-54%
70% -- lead with 55-59%
90% -- lead with 60% or more
[/quote]
[/quote]
Clinton 44, Bush 42
Clinton 44, Rubio 42
Clinton 46, Paul 43
Clinton 46, Walker 40
http://images.businessweek.com/cms/2015-05-08/150510_methodology_final_31343.pdf
New Hampshire is a legitimate swing state. -- if one speaks of NH primary voters.
Hillary Clinton vs. Jeb Bush
(
Hillary Clinton vs. Mike Huckabee
(
Hillary Clinton vs. Rand Paul
(
Hillary Clinton vs. Marco Rubio
(
Hillary Clinton vs. Scott Walker
(
30% -- lead with 40-49% but a margin of 3% or less
40% -- lead with 40-49% but a margin of 4% or more
60% -- lead with 50-54%
70% -- lead with 55-59%
90% -- lead with 60% or more
[/quote]
[/quote]
Title: Re: 2016 Official Polling Map Thread
Post by: pbrower2a on May 11, 2015, 05:59:01 PM
New Poll: New Jersey President by Monmouth University on 2015-05-03
Summary: D: 53%, R: 30%, U: 9%
Hillary Clinton vs. Jeb Bush
()
Hillary Clinton vs. Mike Huckabee
()
Hillary Clinton vs. Rand Paul
()
Hillary Clinton vs. Marco Rubio
()
Hillary Clinton vs. Scott Walker
()
30% -- lead with 40-49% but a margin of 3% or less
40% -- lead with 40-49% but a margin of 4% or more
60% -- lead with 50-54%
70% -- lead with 55-59%
90% -- lead with 60% or more
Summary: D: 53%, R: 30%, U: 9%
Hillary Clinton vs. Jeb Bush
(
Hillary Clinton vs. Mike Huckabee
(
Hillary Clinton vs. Rand Paul
(
Hillary Clinton vs. Marco Rubio
(
Hillary Clinton vs. Scott Walker
(
30% -- lead with 40-49% but a margin of 3% or less
40% -- lead with 40-49% but a margin of 4% or more
60% -- lead with 50-54%
70% -- lead with 55-59%
90% -- lead with 60% or more
Title: Re: 2016 Official Polling Map Thread
Post by: pbrower2a on May 13, 2015, 08:10:28 PM
WHAS-TV, ABC-11, Louisville -- Paul vs. Clinton
Asked of 2104 registered voters
45% Rand Paul (R)
45% Hillary Clinton (D)
11% Undecided
(error due to rounding)
...Rand Paul leads all other Republicans for the Primary race.
Is the thrill gone?
Hillary Clinton vs. Jeb Bush
()
Hillary Clinton vs. Mike Huckabee
()
Hillary Clinton vs. Rand Paul
(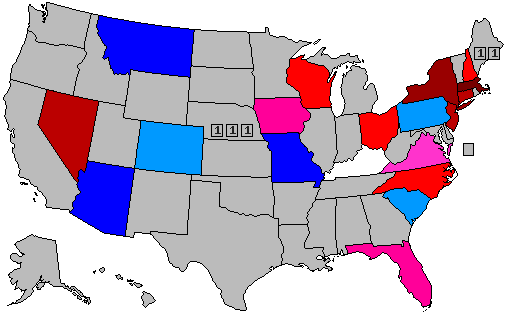 )
)
Hillary Clinton vs. Marco Rubio
()
Hillary Clinton vs. Scott Walker
()
30% -- lead with 40-49% but a margin of 3% or less
40% -- lead with 40-49% but a margin of 4% or more
60% -- lead with 50-54%
70% -- lead with 55-59%
90% -- lead with 60% or more
Asked of 2104 registered voters
45% Rand Paul (R)
45% Hillary Clinton (D)
11% Undecided
(error due to rounding)
...Rand Paul leads all other Republicans for the Primary race.
Is the thrill gone?
Hillary Clinton vs. Jeb Bush
(
Hillary Clinton vs. Mike Huckabee
(
Hillary Clinton vs. Rand Paul
(
Hillary Clinton vs. Marco Rubio
(
Hillary Clinton vs. Scott Walker
(
30% -- lead with 40-49% but a margin of 3% or less
40% -- lead with 40-49% but a margin of 4% or more
60% -- lead with 50-54%
70% -- lead with 55-59%
90% -- lead with 60% or more
Title: Re: 2016 Official Polling Map Thread
Post by: EliteLX on May 20, 2015, 07:49:14 PM
Interesting, I'm expecting a LOT of this to change from this early on.
Thanks for the maps.
Thanks for the maps.
Title: Re: 2016 Official Polling Map Thread
Post by: pbrower2a on May 20, 2015, 08:22:08 PM
Interesting, I'm expecting a LOT of this to change from this early on.
Thanks for the maps.
Thanks for the maps.
You are welcome.
I have at least four maps of electoral match-ups that will not happen. Just think of how entertaining a Barack Obama-Sarah Palin contest would have been. She was not up to the task of offering a coherent alternative to Barack Obama... and the maps for those match-ups so showed.
In view of the contest among Republicans we may see one candidate seeming to have a good chance and then going into the pack.
So far I see a pattern of Hillary Clinton winning practically everything that Barack Obama won in 2012, only to make the states that Obama got clobbered in in 2012 much closer.
...PPP willl have match-ups for Washington State in the next couple of days. There was a poll today of some elections in Louisiana -- but nothing involving any matchup for any Republican against Hillary Clinton in Louisiana.
Title: Re: 2016 Official Polling Map Thread
Post by: pbrower2a on May 21, 2015, 11:46:28 AM
Washington (state), PPP
http://www.publicpolicypolling.com/main/2015/05/clinton-up-big-in-washington.html
Clinton 48
Bush 37
Clinton 49
Carson 39
Clinton 49
Christie 34
Clinton 50
Huckabee 37
Clinton 50
Cruz 38
Clinton 50
Paul 38
Clinton 50
Perry 37
Clinton 49
Rubio 39
Clinton 49
Walker 38
Close to the magic '50' already if not already there. Not competitive. This may be the last poll that we see of Washington state for a very long time. No Republican seems to have a real chance.
Hillary Clinton vs. Jeb Bush
(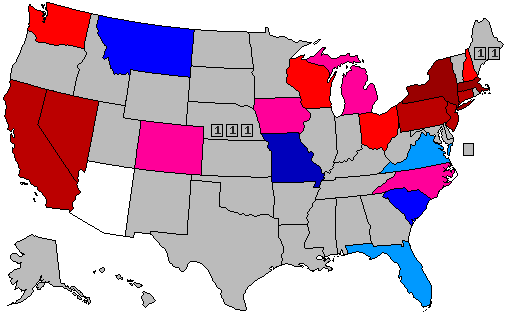 )
)
Hillary Clinton vs. Mike Huckabee
(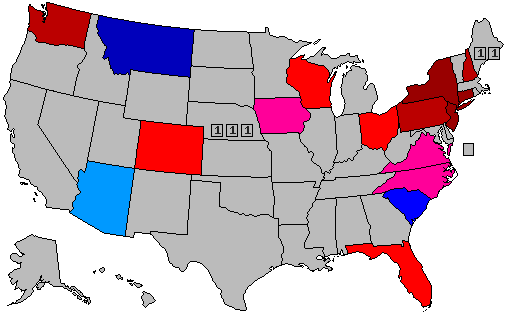 )
)
Hillary Clinton vs. Rand Paul
(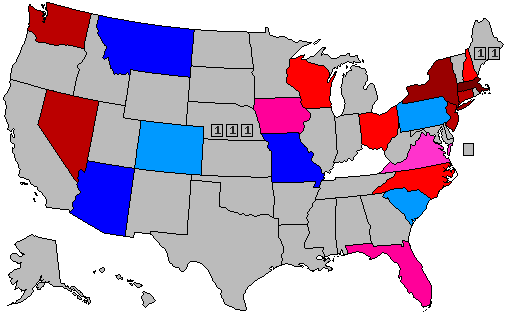 )
)
Hillary Clinton vs. Marco Rubio
(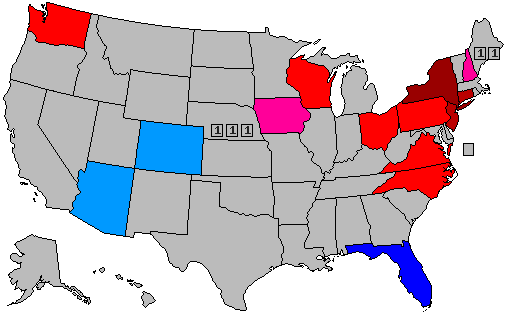 )
)
Hillary Clinton vs. Scott Walker
(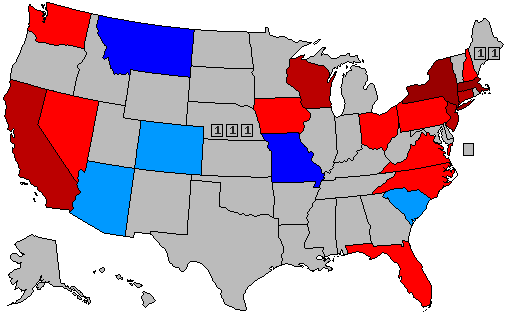 )
)
30% -- lead with 40-49% but a margin of 3% or less
40% -- lead with 40-49% but a margin of 4% or more
60% -- lead with 50-54%
70% -- lead with 55-59%
90% -- lead with 60% or more
[/quote]
http://www.publicpolicypolling.com/main/2015/05/clinton-up-big-in-washington.html
Clinton 48
Bush 37
Clinton 49
Carson 39
Clinton 49
Christie 34
Clinton 50
Huckabee 37
Clinton 50
Cruz 38
Clinton 50
Paul 38
Clinton 50
Perry 37
Clinton 49
Rubio 39
Clinton 49
Walker 38
Close to the magic '50' already if not already there. Not competitive. This may be the last poll that we see of Washington state for a very long time. No Republican seems to have a real chance.
Hillary Clinton vs. Jeb Bush
(
Hillary Clinton vs. Mike Huckabee
(
Hillary Clinton vs. Rand Paul
(
Hillary Clinton vs. Marco Rubio
(
Hillary Clinton vs. Scott Walker
(
30% -- lead with 40-49% but a margin of 3% or less
40% -- lead with 40-49% but a margin of 4% or more
60% -- lead with 50-54%
70% -- lead with 55-59%
90% -- lead with 60% or more
[/quote]
Title: Re: 2016 Official Polling Map Thread
Post by: pbrower2a on May 21, 2015, 11:25:18 PM
I'm surprised -- nothing from Quinny-pie this week?
Title: Re: 2016 Official Polling Map Thread
Post by: pbrower2a on May 22, 2015, 09:52:57 PM
Field Poll, California.
http://www.field.com/fieldpollonline/subscribers/Rls2506.pdf
Clinton 53
Rubio 32
Clinton 52
Bush 31
Clinton 54
Walker 30
April 23-May 16, 2015, Sample of 801 registered voters.
Hillary Clinton vs. Jeb Bush
()
Hillary Clinton vs. Mike Huckabee
()
Hillary Clinton vs. Rand Paul
()
Hillary Clinton vs. Marco Rubio
(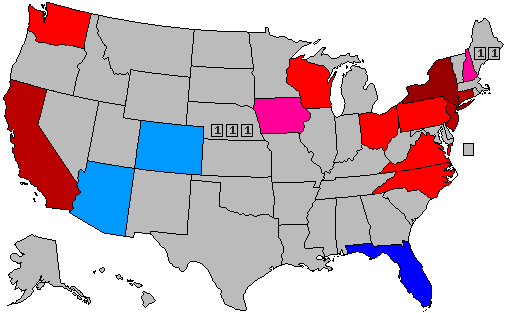 )
)
Hillary Clinton vs. Scott Walker
()
30% -- lead with 40-49% but a margin of 3% or less
40% -- lead with 40-49% but a margin of 4% or more
60% -- lead with 50-54%
70% -- lead with 55-59%
90% -- lead with 60% or more
http://www.field.com/fieldpollonline/subscribers/Rls2506.pdf
Clinton 53
Rubio 32
Clinton 52
Bush 31
Clinton 54
Walker 30
April 23-May 16, 2015, Sample of 801 registered voters.
Hillary Clinton vs. Jeb Bush
(
Hillary Clinton vs. Mike Huckabee
(
Hillary Clinton vs. Rand Paul
(
Hillary Clinton vs. Marco Rubio
(
Hillary Clinton vs. Scott Walker
(
30% -- lead with 40-49% but a margin of 3% or less
40% -- lead with 40-49% but a margin of 4% or more
60% -- lead with 50-54%
70% -- lead with 55-59%
90% -- lead with 60% or more
Title: Re: 2016 Official Polling Map Thread
Post by: pbrower2a on May 28, 2015, 07:44:05 AM
National poll, Quinnipiac
In a general election matchup, Clinton gets 46 percent of American voters to 42 percent for Paul and 45 percent of voters to 41 percent for Rubio. She leads other top Republicans:
46 - 37 percent over Christie;
47 - 40 percent over Huckabee;
47 - 37 percent over Bush;
46 - 38 percent over Walker;
48 - 37 percent over Cruz;
50 - 32 percent over Trump.
http://www.quinnipiac.edu/news-and-events/quinnipiac-university-poll/national/release-detail?ReleaseID=2228
Title: Re: 2016 Official Polling Map Thread
Post by: pbrower2a on May 28, 2015, 02:58:29 PM
Hillary Clinton.................................................. 46%
Marco Rubio ................................................... 45%
Hillary Clinton.................................................. 46%
Rand Paul ....................................................... 43%
Hillary Clinton.................................................. 45%
Scott Walker ................................................... 41%
Hillary Clinton.................................................. 47%
Mike Huckabee ............................................... 42%
Hillary Clinton.................................................. 46%
Chris Christie .................................................. 41%
Hillary Clinton.................................................. 48%
Ben Carson..................................................... 42%
Hillary Clinton.................................................. 49%
Rick Santorum................................................ 42%
Hillary Clinton.................................................. 49%
Ted Cruz ......................................................... 41%
Hillary Clinton.................................................. 49%
Jeb Bush......................................................... 38%
http://www.publicpolicypolling.com/pdf/2015/PPP_Release_PA_52815.pdf
Hillary Clinton vs. Jeb Bush
( )
)
Hillary Clinton vs. Mike Huckabee
(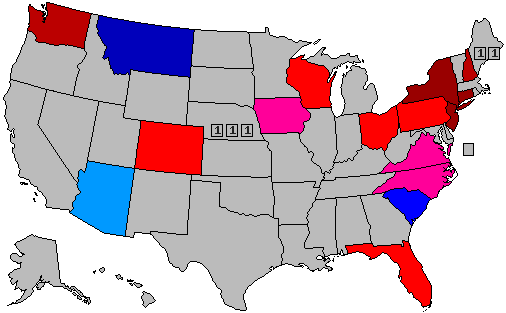 )
)
Hillary Clinton vs. Rand Paul
( )
)
Hillary Clinton vs. Marco Rubio
(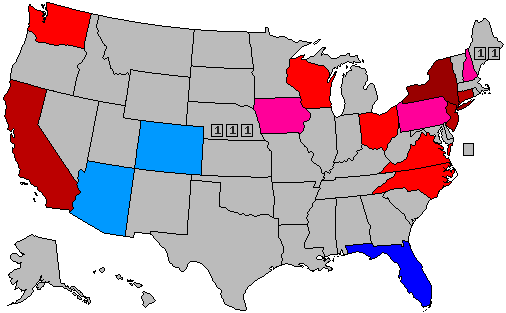 )
)
Hillary Clinton vs. Scott Walker
()
30% -- lead with 40-49% but a margin of 3% or less
40% -- lead with 40-49% but a margin of 4% or more
60% -- lead with 50-54%
70% -- lead with 55-59%
90% -- lead with 60% or more
Marco Rubio ................................................... 45%
Hillary Clinton.................................................. 46%
Rand Paul ....................................................... 43%
Hillary Clinton.................................................. 45%
Scott Walker ................................................... 41%
Hillary Clinton.................................................. 47%
Mike Huckabee ............................................... 42%
Hillary Clinton.................................................. 46%
Chris Christie .................................................. 41%
Hillary Clinton.................................................. 48%
Ben Carson..................................................... 42%
Hillary Clinton.................................................. 49%
Rick Santorum................................................ 42%
Hillary Clinton.................................................. 49%
Ted Cruz ......................................................... 41%
Hillary Clinton.................................................. 49%
Jeb Bush......................................................... 38%
http://www.publicpolicypolling.com/pdf/2015/PPP_Release_PA_52815.pdf
Hillary Clinton vs. Jeb Bush
(
Hillary Clinton vs. Mike Huckabee
(
Hillary Clinton vs. Rand Paul
(
Hillary Clinton vs. Marco Rubio
(
Hillary Clinton vs. Scott Walker
(
30% -- lead with 40-49% but a margin of 3% or less
40% -- lead with 40-49% but a margin of 4% or more
60% -- lead with 50-54%
70% -- lead with 55-59%
90% -- lead with 60% or more
Title: Re: 2016 Official Polling Map Thread
Post by: pbrower2a on June 04, 2015, 03:19:59 PM
North Carolina, PPP:
Clinton 47, Bush 40
Clinton 46, Carson 44
Clinton 45, Walker 45
Clinton 44, Paul 44
Clinton 45, Rubio 44
Clinton 46, Huckabee 44
Clinton 46, Fiorina 40
Clinton 49, Cruz 42
Clinton 43, Christie 40
http://www.publicpolicypolling.com/pdf/2015/PPP_Release_NC_60415.pdf
Hillary Clinton can afford to lose North Carolina; no Republican can afford to lose North Carolina.
Hillary Clinton vs. Jeb Bush
( )
)
Hillary Clinton vs. Mike Huckabee
()
Hillary Clinton vs. Rand Paul
(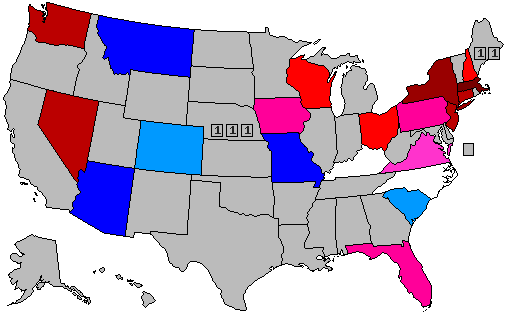 )
)
Hillary Clinton vs. Marco Rubio
(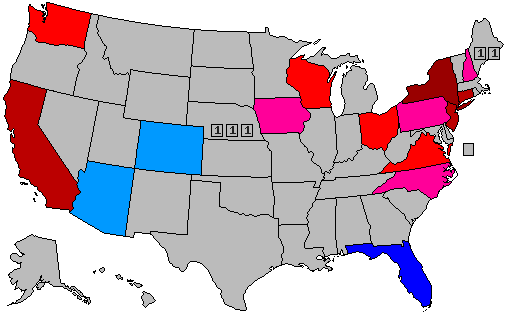 )
)
Hillary Clinton vs. Scott Walker
( )
)
30% -- lead with 40-49% but a margin of 3% or less
40% -- lead with 40-49% but a margin of 4% or more
60% -- lead with 50-54%
70% -- lead with 55-59%
90% -- lead with 60% or more
[/quote]
Clinton 47, Bush 40
Clinton 46, Carson 44
Clinton 45, Walker 45
Clinton 44, Paul 44
Clinton 45, Rubio 44
Clinton 46, Huckabee 44
Clinton 46, Fiorina 40
Clinton 49, Cruz 42
Clinton 43, Christie 40
http://www.publicpolicypolling.com/pdf/2015/PPP_Release_NC_60415.pdf
Hillary Clinton can afford to lose North Carolina; no Republican can afford to lose North Carolina.
Hillary Clinton vs. Jeb Bush
(
Hillary Clinton vs. Mike Huckabee
(
Hillary Clinton vs. Rand Paul
(
Hillary Clinton vs. Marco Rubio
(
Hillary Clinton vs. Scott Walker
(
30% -- lead with 40-49% but a margin of 3% or less
40% -- lead with 40-49% but a margin of 4% or more
60% -- lead with 50-54%
70% -- lead with 55-59%
90% -- lead with 60% or more
[/quote]
Title: Re: 2016 Official Polling Map Thread
Post by: pbrower2a on June 10, 2015, 12:03:58 PM
New PPP polls in Ohio. Hillary Clinton seems to be slipping a bit from last time.
Clinton 45 - Bush 43
Clinton 44 - Carson 43
Clinton 44 - Christie 41
Clinton 45 - Huckabee 42
Clinton 40 - Kasich 47
Clinton 41 - Paul 44
Clinton 44 - Rubio 44
Clinton 44 - Walker 43
http://www.publicpolicypolling.com/pdf/2015/PPP_Release_OH_61015.pdf
Hillary Clinton can afford to lose Ohio; no Republican can afford to lose Ohio.
Hillary Clinton vs. Jeb Bush
(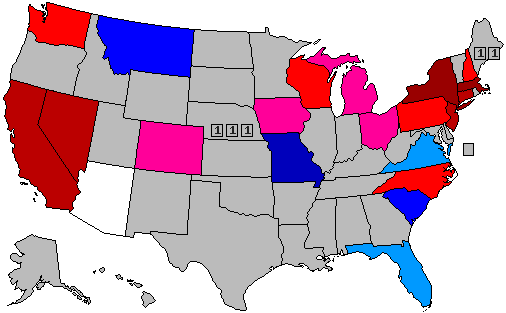 )
)
Hillary Clinton vs. Mike Huckabee
(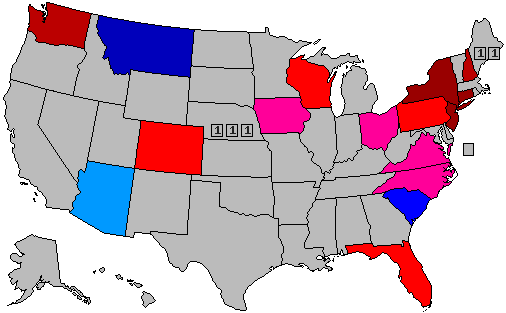 )
)
Hillary Clinton vs. Rand Paul
(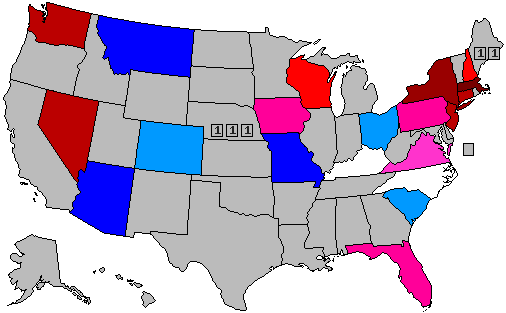 )
)
Hillary Clinton vs. Marco Rubio
(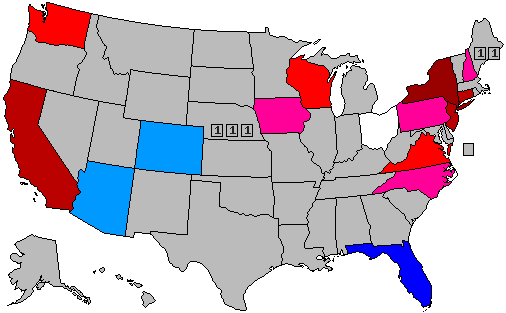 )
)
Hillary Clinton vs. Scott Walker
(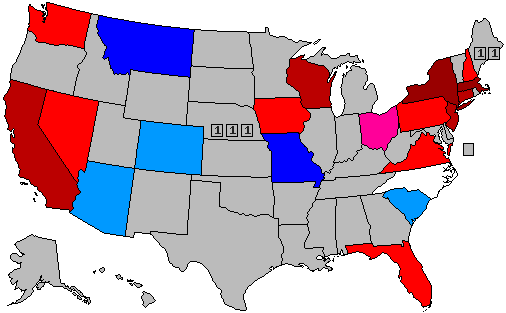 )
)
30% -- lead with 40-49% but a margin of 3% or less
40% -- lead with 40-49% but a margin of 4% or more
60% -- lead with 50-54%
70% -- lead with 55-59%
90% -- lead with 60% or more
Clinton 45 - Bush 43
Clinton 44 - Carson 43
Clinton 44 - Christie 41
Clinton 45 - Huckabee 42
Clinton 40 - Kasich 47
Clinton 41 - Paul 44
Clinton 44 - Rubio 44
Clinton 44 - Walker 43
http://www.publicpolicypolling.com/pdf/2015/PPP_Release_OH_61015.pdf
Hillary Clinton can afford to lose Ohio; no Republican can afford to lose Ohio.
Hillary Clinton vs. Jeb Bush
(
Hillary Clinton vs. Mike Huckabee
(
Hillary Clinton vs. Rand Paul
(
Hillary Clinton vs. Marco Rubio
(
Hillary Clinton vs. Scott Walker
(
30% -- lead with 40-49% but a margin of 3% or less
40% -- lead with 40-49% but a margin of 4% or more
60% -- lead with 50-54%
70% -- lead with 55-59%
90% -- lead with 60% or more
Title: Re: 2016 Official Polling Map Thread
Post by: eric82oslo on June 10, 2015, 07:38:09 PM
According to your maps pbrower, the Republicans who are doing the best so far are:
1) Rubio
2) Rand Paul
3) Bush (thanks to Florida)
4) Walker
5) Huckabee (by far the worst)
1) Rubio
2) Rand Paul
3) Bush (thanks to Florida)
4) Walker
5) Huckabee (by far the worst)
Title: Re: 2016 Official Polling Map Thread
Post by: pbrower2a on June 14, 2015, 11:04:42 AM
Jeb, and his alleged advantage in Florida:
http://www.bloomberg.com/politics/articles/2015-06-14/favorite-son-or-total-stranger-nearly-three-quarters-of-florida-s-voters-have-never-seen-jeb-bush-on-a-ballot
Quote
Jeb Bushs big political credential, and his presumed strength in the presidential campaign hell launch on Monday, is the broad appeal he demonstrated over two terms as Florida governordoubly important given the critical role Floridas primary will play in winnowing the GOP field. Bush handily won his last race, in 2002, by drawing support from Republicans and Democrats with what even his opponents describe as a unique personal connection to Florida voters. Its very hard to unify the state as a political figure, Steve Schale, a Democratic operative who ran Obamas Florida campaign in 2008, recently told New York. But you can do it as a personality.
Bush did it. But he may not be nearly as strong in Florida as his reputation suggests. A Bloomberg Politics study conducted with University of Florida political scientist Daniel A. Smith found that nearly three-quarters of Floridas 12.9 million currently registered voters have never even seen Bushs name on a ballot. Thats a surprisingly large number, says Smith, which is due to a combination of low turnout and the turnover in the electorate over the 13 years since he was last on the ballot. About 35 percent of voters in that election have disappeared from the states rollsmost have died, moved away or gone to prison. (Another group, thought to be much smaller, has been judged mentally incapacitated and stripped of the right to vote, although the Florida secretary of states office could not say precisely how many.) By contrast, 92 percent of Floridians who voted when Marco Rubio was last on the ballot, in 2010, are still registered.
Bush did it. But he may not be nearly as strong in Florida as his reputation suggests. A Bloomberg Politics study conducted with University of Florida political scientist Daniel A. Smith found that nearly three-quarters of Floridas 12.9 million currently registered voters have never even seen Bushs name on a ballot. Thats a surprisingly large number, says Smith, which is due to a combination of low turnout and the turnover in the electorate over the 13 years since he was last on the ballot. About 35 percent of voters in that election have disappeared from the states rollsmost have died, moved away or gone to prison. (Another group, thought to be much smaller, has been judged mentally incapacitated and stripped of the right to vote, although the Florida secretary of states office could not say precisely how many.) By contrast, 92 percent of Floridians who voted when Marco Rubio was last on the ballot, in 2010, are still registered.
http://www.bloomberg.com/politics/articles/2015-06-14/favorite-son-or-total-stranger-nearly-three-quarters-of-florida-s-voters-have-never-seen-jeb-bush-on-a-ballot
Title: Re: 2016 Official Polling Map Thread
Post by: pbrower2a on June 17, 2015, 07:08:42 PM
Quinnipiac -- 67-EV gold mine (FL, OH, PA)
FL:
Hillary/Rubio: 47/44
Hillary/Bush: 46/42
Hillary/Christie: 46/35
Hillary/Paul: 46/39
Hillary/Huckabee: 49/38
Hillary/Walker: 48/38
Hillary/Cruz: 48/37
Hilllary/Kasich: 48/35
OH:
Kasich/Hillary: 47/40
Hillary/Christie: 44/39
Hillary/Paul: 43/43
Hillary/Huckabee: 46/41
Hillary/Bush: 42/41
Hillary/Rubio: 45/42
Hillary/Walker: 44/40
Hillary/Cruz: 47/39
PA:
Rubio/Hillary: 44/43
Paul/Hillary: 45/44
Hillary/Christie: 43/41
Hillary/Huckabee: 46/39
Hillary/Bush: 45/41
Hillary/Walker: 46/41
Hillary/Cruz: 47/40
http://www.quinnipiac.edu/news-and-events/quinnipiac-university-poll/2016-presidential-swing-state-polls/release-detail?ReleaseID=2234
Go figure.
Hillary Clinton vs. Jeb Bush
(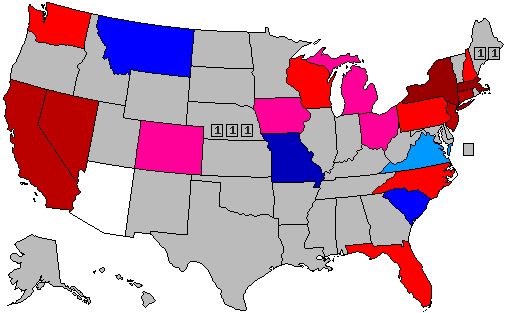 )
)
Hillary Clinton vs. Mike Huckabee
()
Hillary Clinton vs. Rand Paul
(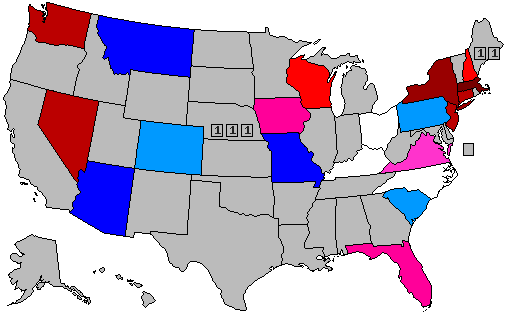 )
)
Hillary Clinton vs. Marco Rubio
(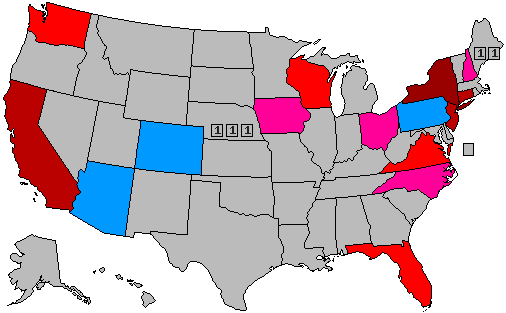 )
)
Hillary Clinton vs. Scott Walker
()
30% -- lead with 40-49% but a margin of 3% or less
40% -- lead with 40-49% but a margin of 4% or more
60% -- lead with 50-54%
70% -- lead with 55-59%
90% -- lead with 60% or more
FL:
Hillary/Rubio: 47/44
Hillary/Bush: 46/42
Hillary/Christie: 46/35
Hillary/Paul: 46/39
Hillary/Huckabee: 49/38
Hillary/Walker: 48/38
Hillary/Cruz: 48/37
Hilllary/Kasich: 48/35
OH:
Kasich/Hillary: 47/40
Hillary/Christie: 44/39
Hillary/Paul: 43/43
Hillary/Huckabee: 46/41
Hillary/Bush: 42/41
Hillary/Rubio: 45/42
Hillary/Walker: 44/40
Hillary/Cruz: 47/39
PA:
Rubio/Hillary: 44/43
Paul/Hillary: 45/44
Hillary/Christie: 43/41
Hillary/Huckabee: 46/39
Hillary/Bush: 45/41
Hillary/Walker: 46/41
Hillary/Cruz: 47/40
http://www.quinnipiac.edu/news-and-events/quinnipiac-university-poll/2016-presidential-swing-state-polls/release-detail?ReleaseID=2234
Go figure.
Hillary Clinton vs. Jeb Bush
(
Hillary Clinton vs. Mike Huckabee
(
Hillary Clinton vs. Rand Paul
(
Hillary Clinton vs. Marco Rubio
(
Hillary Clinton vs. Scott Walker
(
30% -- lead with 40-49% but a margin of 3% or less
40% -- lead with 40-49% but a margin of 4% or more
60% -- lead with 50-54%
70% -- lead with 55-59%
90% -- lead with 60% or more
Title: Re: 2016 Official Polling Map Thread
Post by: pbrower2a on June 19, 2015, 07:31:41 AM
Michigan -- Glengarriff, Detroit News.
Republicans might expect forty years of economic distress to make Michigan easy pickings for the GOP.
Clinton 42%
Rubio 39%
Clinton 45%
Paul 41%
Clinton 44%
Walker 37%
Clinton 46%
Bush 37%
Not this time.
http://www.detroitnews.com/story/news/politics/2015/06/16/poll-president/28843571/
Hillary Clinton vs. Jeb Bush
(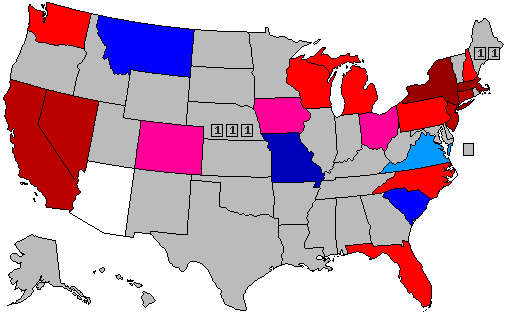 )
)
Hillary Clinton vs. Mike Huckabee
()
Hillary Clinton vs. Rand Paul
(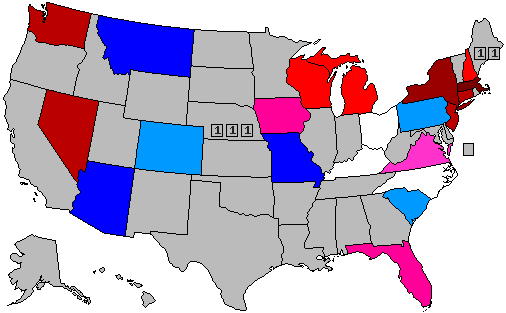 )
)
Hillary Clinton vs. Marco Rubio
(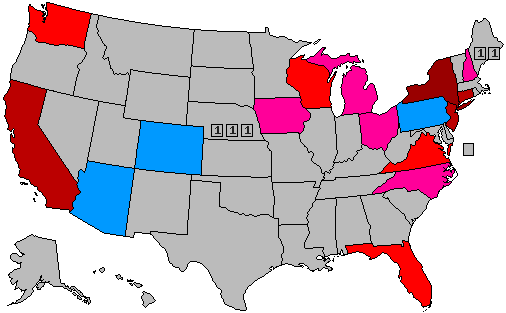 )
)
Hillary Clinton vs. Scott Walker
( )
)
30% -- lead with 40-49% but a margin of 3% or less
40% -- lead with 40-49% but a margin of 4% or more
60% -- lead with 50-54%
70% -- lead with 55-59%
90% -- lead with 60% or more
Republicans might expect forty years of economic distress to make Michigan easy pickings for the GOP.
Clinton 42%
Rubio 39%
Clinton 45%
Paul 41%
Clinton 44%
Walker 37%
Clinton 46%
Bush 37%
Not this time.
http://www.detroitnews.com/story/news/politics/2015/06/16/poll-president/28843571/
Hillary Clinton vs. Jeb Bush
(
Hillary Clinton vs. Mike Huckabee
(
Hillary Clinton vs. Rand Paul
(
Hillary Clinton vs. Marco Rubio
(
Hillary Clinton vs. Scott Walker
(
30% -- lead with 40-49% but a margin of 3% or less
40% -- lead with 40-49% but a margin of 4% or more
60% -- lead with 50-54%
70% -- lead with 55-59%
90% -- lead with 60% or more
Title: Re: 2016 Official Polling Map Thread
Post by: pbrower2a on June 19, 2015, 02:41:47 PM
Time for Colorado, Nevada, and Virginia!
Title: Re: 2016 Official Polling Map Thread
Post by: pbrower2a on June 23, 2015, 08:39:28 AM
Arkansas, Talk Business/Hendrix College.
The poll has huge limitations, to put it mildly.
Q: If the 2016 general election were held today and Mike Huckabee was the Republican presidential nominee and Hillary Clinton was the Democratic presidential nominee, would you be more likely to vote for Huckabee, Clinton, or are you unsure?
Mike Huckabee 51%
Hillary Clinton 37%
Q: What are your feelings toward Hillary Clinton?
38% Positive
53% Negative
Q: What are your feelings toward Mike Huckabee?
47% Positive
35% Negative
The survey was conducted from June 8-11, 2015 among 1,183 likely Arkansas voters. Respondents were surveyed by automated phone calls (80%) and online polling (20%). The poll has a margin of error of 1.84%
http://talkbusiness.net/2015/06/poll-huckabee-tops-hillary-beebe-bests-boozman-in-arkansas
Hillary Clinton vs. Jeb Bush
()
Hillary Clinton vs. Mike Huckabee
(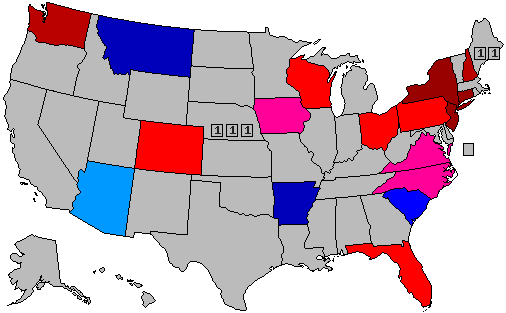 )
)
Hillary Clinton vs. Rand Paul
()
Hillary Clinton vs. Marco Rubio
()
Hillary Clinton vs. Scott Walker
()
30% -- lead with 40-49% but a margin of 3% or less
40% -- lead with 40-49% but a margin of 4% or more
60% -- lead with 50-54%
70% -- lead with 55-59%
90% -- lead with 60% or more
The poll has huge limitations, to put it mildly.
Q: If the 2016 general election were held today and Mike Huckabee was the Republican presidential nominee and Hillary Clinton was the Democratic presidential nominee, would you be more likely to vote for Huckabee, Clinton, or are you unsure?
Mike Huckabee 51%
Hillary Clinton 37%
Q: What are your feelings toward Hillary Clinton?
38% Positive
53% Negative
Q: What are your feelings toward Mike Huckabee?
47% Positive
35% Negative
The survey was conducted from June 8-11, 2015 among 1,183 likely Arkansas voters. Respondents were surveyed by automated phone calls (80%) and online polling (20%). The poll has a margin of error of 1.84%
http://talkbusiness.net/2015/06/poll-huckabee-tops-hillary-beebe-bests-boozman-in-arkansas
Hillary Clinton vs. Jeb Bush
(
Hillary Clinton vs. Mike Huckabee
(
Hillary Clinton vs. Rand Paul
(
Hillary Clinton vs. Marco Rubio
(
Hillary Clinton vs. Scott Walker
(
30% -- lead with 40-49% but a margin of 3% or less
40% -- lead with 40-49% but a margin of 4% or more
60% -- lead with 50-54%
70% -- lead with 55-59%
90% -- lead with 60% or more
Title: Re: 2016 Official Polling Map Thread
Post by: pbrower2a on June 24, 2015, 08:09:03 PM
KY, PPP. Bill Clinton is likely to be the last Democrat to win the electoral votes of Kentucky for a very long time. Last month's Louisville-area media poll that showed a tie between Clinton and Paul is forcibly debunked.
Q14 If the candidates for President next time were
Democrat Hillary Clinton and Republican Jeb
Bush, who would you vote for?
Hillary Clinton.................................................. 40%
Jeb Bush......................................................... 48%
Not sure .......................................................... 12%
Q15 If the candidates for President next time were
Democrat Hillary Clinton and Republican Ben
Carson, who would you vote for?
Hillary Clinton.................................................. 40%
Ben Carson..................................................... 49%
Not sure .......................................................... 11%
Q16 If the candidates for President next time were
Democrat Hillary Clinton and Republican Ted
Cruz, who would you vote for?
Hillary Clinton.................................................. 42%
Ted Cruz ......................................................... 48%
Not sure .......................................................... 10%
Q17 If the candidates for President next time were
Democrat Hillary Clinton and Republican Carly
Fiorina, who would you vote for?
Hillary Clinton.................................................. 40%
Carly Fiorina ................................................... 45%
Not sure .......................................................... 16%
Q18 If the candidates for President next time were
Democrat Hillary Clinton and Republican Mike
Huckabee, who would you vote for?
Hillary Clinton.................................................. 39%
Mike Huckabee ............................................... 49%
Not sure .......................................................... 11%
Q19 If the candidates for President next time were
Democrat Hillary Clinton and Republican Rand
Paul, who would you vote for?
Hillary Clinton.................................................. 40%
Rand Paul ....................................................... 50%
Not sure .......................................................... 10%
Q20 If the candidates for President next time were
Democrat Hillary Clinton and Republican
Marco Rubio, who would you vote for?
Hillary Clinton.................................................. 41%
Marco Rubio ................................................... 46%
Not sure .......................................................... 12%
Hillary Clinton vs. Jeb Bush
( )
)
Hillary Clinton vs. Mike Huckabee
(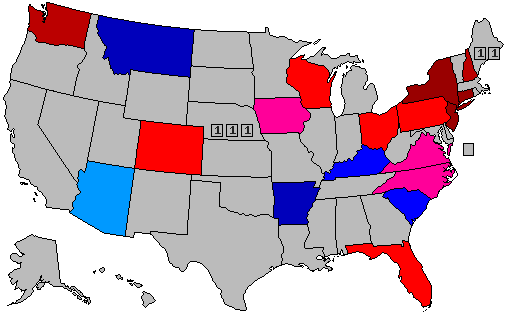 )
)
Hillary Clinton vs. Rand Paul
(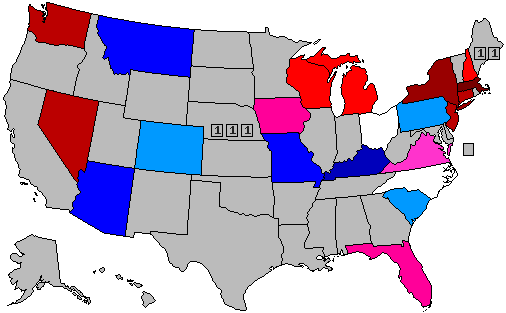 )
)
Hillary Clinton vs. Marco Rubio
(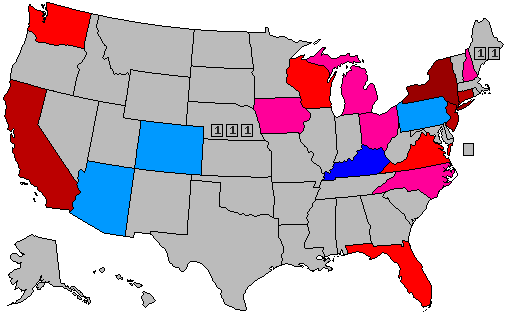 )
)
Hillary Clinton vs. Scott Walker
(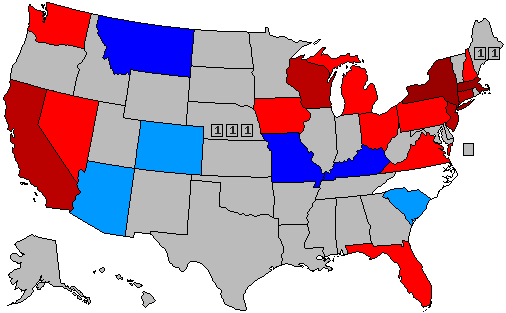 )
)
30% -- lead with 40-49% but a margin of 3% or less
40% -- lead with 40-49% but a margin of 4% or more
60% -- lead with 50-54%
70% -- lead with 55-59%
90% -- lead with 60% or more
[/quote]
Q14 If the candidates for President next time were
Democrat Hillary Clinton and Republican Jeb
Bush, who would you vote for?
Hillary Clinton.................................................. 40%
Jeb Bush......................................................... 48%
Not sure .......................................................... 12%
Q15 If the candidates for President next time were
Democrat Hillary Clinton and Republican Ben
Carson, who would you vote for?
Hillary Clinton.................................................. 40%
Ben Carson..................................................... 49%
Not sure .......................................................... 11%
Q16 If the candidates for President next time were
Democrat Hillary Clinton and Republican Ted
Cruz, who would you vote for?
Hillary Clinton.................................................. 42%
Ted Cruz ......................................................... 48%
Not sure .......................................................... 10%
Q17 If the candidates for President next time were
Democrat Hillary Clinton and Republican Carly
Fiorina, who would you vote for?
Hillary Clinton.................................................. 40%
Carly Fiorina ................................................... 45%
Not sure .......................................................... 16%
Q18 If the candidates for President next time were
Democrat Hillary Clinton and Republican Mike
Huckabee, who would you vote for?
Hillary Clinton.................................................. 39%
Mike Huckabee ............................................... 49%
Not sure .......................................................... 11%
Q19 If the candidates for President next time were
Democrat Hillary Clinton and Republican Rand
Paul, who would you vote for?
Hillary Clinton.................................................. 40%
Rand Paul ....................................................... 50%
Not sure .......................................................... 10%
Q20 If the candidates for President next time were
Democrat Hillary Clinton and Republican
Marco Rubio, who would you vote for?
Hillary Clinton.................................................. 41%
Marco Rubio ................................................... 46%
Not sure .......................................................... 12%
Hillary Clinton vs. Jeb Bush
(
Hillary Clinton vs. Mike Huckabee
(
Hillary Clinton vs. Rand Paul
(
Hillary Clinton vs. Marco Rubio
(
Hillary Clinton vs. Scott Walker
(
30% -- lead with 40-49% but a margin of 3% or less
40% -- lead with 40-49% but a margin of 4% or more
60% -- lead with 50-54%
70% -- lead with 55-59%
90% -- lead with 60% or more
[/quote]
Title: Re: 2016 Official Polling Map Thread
Post by: pbrower2a on June 30, 2015, 06:36:52 PM
PPP, Michigan
Clinton (D).................... 45%
Paul (R)....................... 42%
Clinton (D)................... 46%
Rubio (R)...................... 40%
Clinton (D)................... 44%
Christie (R).................. 38%
Clinton (D).................. 46%
Walker (R).................. 42%
Clinton (D)................. 47%
Huckabee (R)............. 42%
Clinton (D)................. 47%
Bush (R).................... 38%
Clinton (D)................ 49%
Carson (R)................ 41%
Clinton (D)................ 49%
Fiorina (R)................ 41%
Clinton (D)................ 49%
Cruz (R).................... 39%
Clinton (D)................ 49%
Trump (R)................. 39%
Hillary Clinton vs. Jeb Bush
()
Hillary Clinton vs. Mike Huckabee
(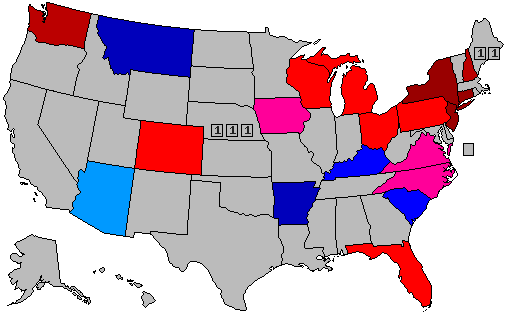 )
)
Hillary Clinton vs. Rand Paul
(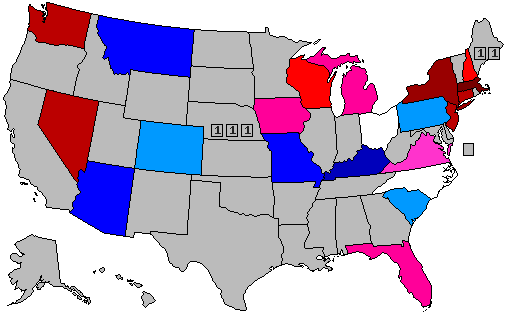 )
)
Hillary Clinton vs. Marco Rubio
(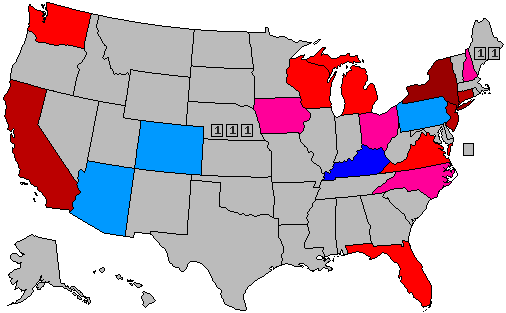 )
)
Hillary Clinton vs. Scott Walker
()
30% -- lead with 40-49% but a margin of 3% or less
40% -- lead with 40-49% but a margin of 4% or more
60% -- lead with 50-54%
70% -- lead with 55-59%
90% -- lead with 60% or more
Clinton (D).................... 45%
Paul (R)....................... 42%
Clinton (D)................... 46%
Rubio (R)...................... 40%
Clinton (D)................... 44%
Christie (R).................. 38%
Clinton (D).................. 46%
Walker (R).................. 42%
Clinton (D)................. 47%
Huckabee (R)............. 42%
Clinton (D)................. 47%
Bush (R).................... 38%
Clinton (D)................ 49%
Carson (R)................ 41%
Clinton (D)................ 49%
Fiorina (R)................ 41%
Clinton (D)................ 49%
Cruz (R).................... 39%
Clinton (D)................ 49%
Trump (R)................. 39%
Hillary Clinton vs. Jeb Bush
(
Hillary Clinton vs. Mike Huckabee
(
Hillary Clinton vs. Rand Paul
(
Hillary Clinton vs. Marco Rubio
(
Hillary Clinton vs. Scott Walker
(
30% -- lead with 40-49% but a margin of 3% or less
40% -- lead with 40-49% but a margin of 4% or more
60% -- lead with 50-54%
70% -- lead with 55-59%
90% -- lead with 60% or more
Title: Re: 2016 Official Polling Map Thread
Post by: pbrower2a on July 09, 2015, 05:59:24 AM
North Carolina, PPP:
The strongest GOP hopefuls for the general election, leading Clinton by 4, are Mike Huckabee at 49/45 and Scott Walker at 47/43. Ben Carson leads her by 3 at 47/44, and Marco Rubio and Rand Paul each have 1 point leads at 47/46 and 46/45 respectively.
The weakest Republicans in the state are Donald Trump and Chris Christie who each trail Clinton by 3 points at 47/44 and 46/43 respectively. Also trailing Clinton are Jeb Bush at 45/43 and Ted Cruz at 47/46. Clinton's tie comes with Carly Fiorina at 45%."
Hillary Clinton vs. Jeb Bush
(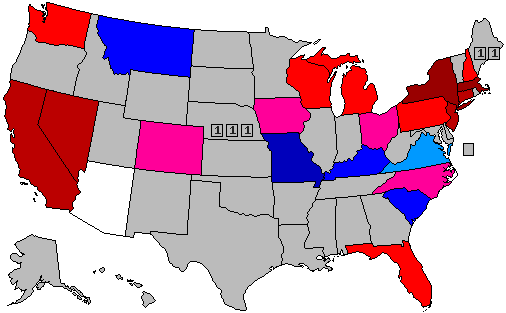 )
)
Hillary Clinton vs. Mike Huckabee
(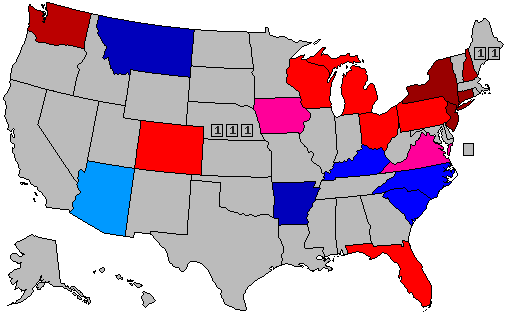 )
)
Hillary Clinton vs. Rand Paul
(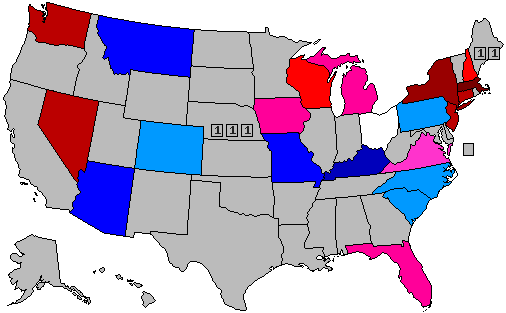 )
)
Hillary Clinton vs. Marco Rubio
(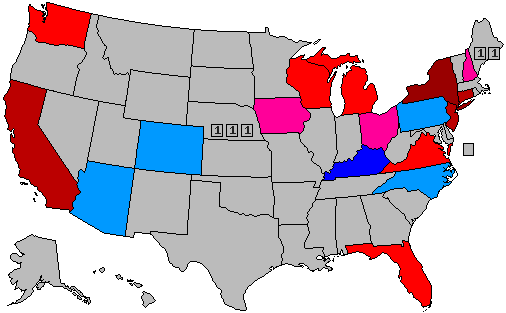 )
)
Hillary Clinton vs. Scott Walker
(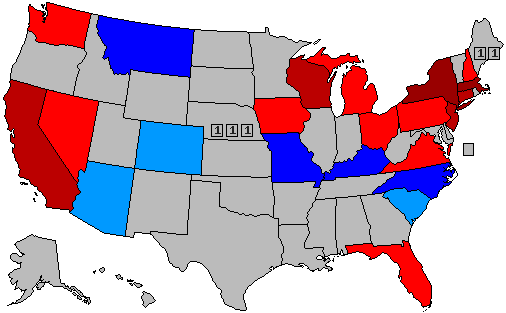 )
)
30% -- lead with 40-49% but a margin of 3% or less
40% -- lead with 40-49% but a margin of 4% or more
60% -- lead with 50-54%
70% -- lead with 55-59%
90% -- lead with 60% or more
[/quote]
The strongest GOP hopefuls for the general election, leading Clinton by 4, are Mike Huckabee at 49/45 and Scott Walker at 47/43. Ben Carson leads her by 3 at 47/44, and Marco Rubio and Rand Paul each have 1 point leads at 47/46 and 46/45 respectively.
The weakest Republicans in the state are Donald Trump and Chris Christie who each trail Clinton by 3 points at 47/44 and 46/43 respectively. Also trailing Clinton are Jeb Bush at 45/43 and Ted Cruz at 47/46. Clinton's tie comes with Carly Fiorina at 45%."
Hillary Clinton vs. Jeb Bush
(
Hillary Clinton vs. Mike Huckabee
(
Hillary Clinton vs. Rand Paul
(
Hillary Clinton vs. Marco Rubio
(
Hillary Clinton vs. Scott Walker
(
30% -- lead with 40-49% but a margin of 3% or less
40% -- lead with 40-49% but a margin of 4% or more
60% -- lead with 50-54%
70% -- lead with 55-59%
90% -- lead with 60% or more
[/quote]
Title: Re: 2016 Official Polling Map Thread
Post by: pbrower2a on July 16, 2015, 12:50:25 PM
Virginia, PPP:
Virginia went for Barack Obama by 4-6 points in 2008 and 2012 and Hillary Clinton starts out similarly well positioned in the state, leading all of her potential Republican opponents by somewhere in the 4-12 point range. The GOP hopefuls who come the closest to Clinton are Ben Carson and Marco Rubio who each trail by 4 at 47/43, and Rand Paul and Scott Walker who each trail by 5 at 47/42. The Republican who does the worst in the state is native son Jim Gilmore who trails by 12 at 47/35. Also trailing by double digits are Donald Trump and Mike Huckabee at 49/39. In between are Chris Christie who trails by 6 at 45/39, Carly Fiorina and Ted Cruz who lag by 7 at 46/39 and 48/41 respectively, and Jeb Bush who's down by 8 at 46/38.
We also tested Bernie Sanders against the leading Republicans- he leads Trump 43/39, but trails Bush 40/39, Walker 39/38, and Rubio 40/38. On average Clinton performs a little under 7 points better than Sanders against the top quartet of GOPers in head to head match ups.
http://www.publicpolicypolling.com/main/2015/07/bush-leads-gop-field-in-virginia-but-clinton-ahead-for-general.html#more
Getting ugly for Republicans. They can't win without Virginia... and Bernie Sanders is catching up with them in this state.
Hillary Clinton vs. Jeb Bush
( )
)
Hillary Clinton vs. Mike Huckabee
( )
)
Hillary Clinton vs. Rand Paul
(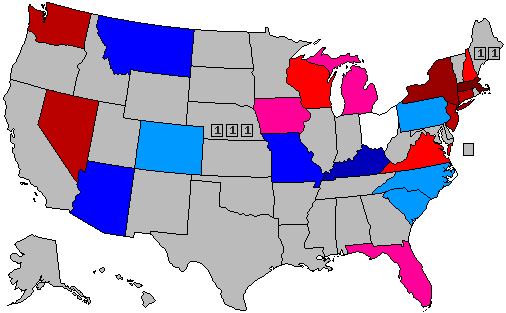 )
)
Hillary Clinton vs. Marco Rubio
()
Hillary Clinton vs. Scott Walker
()
30% -- lead with 40-49% but a margin of 3% or less
40% -- lead with 40-49% but a margin of 4% or more
60% -- lead with 50-54%
70% -- lead with 55-59%
90% -- lead with 60% or more
Quote
Virginia went for Barack Obama by 4-6 points in 2008 and 2012 and Hillary Clinton starts out similarly well positioned in the state, leading all of her potential Republican opponents by somewhere in the 4-12 point range. The GOP hopefuls who come the closest to Clinton are Ben Carson and Marco Rubio who each trail by 4 at 47/43, and Rand Paul and Scott Walker who each trail by 5 at 47/42. The Republican who does the worst in the state is native son Jim Gilmore who trails by 12 at 47/35. Also trailing by double digits are Donald Trump and Mike Huckabee at 49/39. In between are Chris Christie who trails by 6 at 45/39, Carly Fiorina and Ted Cruz who lag by 7 at 46/39 and 48/41 respectively, and Jeb Bush who's down by 8 at 46/38.
We also tested Bernie Sanders against the leading Republicans- he leads Trump 43/39, but trails Bush 40/39, Walker 39/38, and Rubio 40/38. On average Clinton performs a little under 7 points better than Sanders against the top quartet of GOPers in head to head match ups.
http://www.publicpolicypolling.com/main/2015/07/bush-leads-gop-field-in-virginia-but-clinton-ahead-for-general.html#more
Getting ugly for Republicans. They can't win without Virginia... and Bernie Sanders is catching up with them in this state.
Hillary Clinton vs. Jeb Bush
(
Hillary Clinton vs. Mike Huckabee
(
Hillary Clinton vs. Rand Paul
(
Hillary Clinton vs. Marco Rubio
(
Hillary Clinton vs. Scott Walker
(
30% -- lead with 40-49% but a margin of 3% or less
40% -- lead with 40-49% but a margin of 4% or more
60% -- lead with 50-54%
70% -- lead with 55-59%
90% -- lead with 60% or more
Title: Re: 2016 Official Polling Map Thread
Post by: MT Treasurer on July 16, 2015, 12:52:14 PM
Getting ugly for Republicans. They can't win without Virginia.
They can.
Title: Re: 2016 Official Polling Map Thread
Post by: pbrower2a on July 16, 2015, 06:17:01 PM
Getting ugly for Republicans. They can't win without Virginia.
They can.
They would have to win Florida, Ohio, and Pennsylvania... and so far I see no Republican winning all three.
I see Bernie Sanders closing in on Republicans as he gets better known... which indicates that the 2016 election does not depend upon the health of Hillary Clinton anymore.
A Republican win in 2016 will depend upon Obama failure. Failure to convince people who were never going to support him under any circumstances is not failure. An economic meltdown, a military debacle, or a diplomatic catastrophe would singly be enough.
Even one of the President's harshest critics, Karl Rove, admits that the President is "cautious".
Title: Re: 2016 Official Polling Map Thread
Post by: pbrower2a on July 17, 2015, 05:56:20 AM
PPP, Nevada -- commissioned by Democrats, but it looks cautious enough. Less favorable than the most recent poll of Nevada, but Clinton is near 50% against everyone and up by at least 5%. The previous poll of Nevada was more favorable than this.
Clinton (D) 48%
Rubio (R) 43%
Clinton (D) 48%
Trump (R) 42%
Clinton (D) 48%
Walker (R) 41%
Clinton (D) 49%
Bush (R) 37%
http://origin.ralstonreports.com/blog/democratic-poll-shows-nevada-senate-race-dead-heat-hillary-state
Hillary Clinton vs. Jeb Bush
( )
)
Hillary Clinton vs. Mike Huckabee
()
Hillary Clinton vs. Rand Paul
()
Hillary Clinton vs. Marco Rubio
(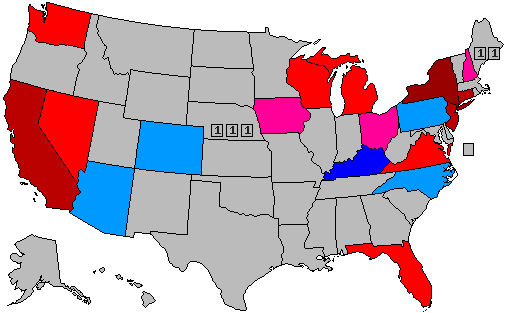 )
)
Hillary Clinton vs. Scott Walker
()
30% -- lead with 40-49% but a margin of 3% or less
40% -- lead with 40-49% but a margin of 4% or more
60% -- lead with 50-54%
70% -- lead with 55-59%
90% -- lead with 60% or more
Clinton (D) 48%
Rubio (R) 43%
Clinton (D) 48%
Trump (R) 42%
Clinton (D) 48%
Walker (R) 41%
Clinton (D) 49%
Bush (R) 37%
http://origin.ralstonreports.com/blog/democratic-poll-shows-nevada-senate-race-dead-heat-hillary-state
Hillary Clinton vs. Jeb Bush
(
Hillary Clinton vs. Mike Huckabee
(
Hillary Clinton vs. Rand Paul
(
Hillary Clinton vs. Marco Rubio
(
Hillary Clinton vs. Scott Walker
(
30% -- lead with 40-49% but a margin of 3% or less
40% -- lead with 40-49% but a margin of 4% or more
60% -- lead with 50-54%
70% -- lead with 55-59%
90% -- lead with 60% or more
Title: Re: 2016 Official Polling Map Thread
Post by: Tender Branson on July 22, 2015, 12:52:08 PM
So you won't add the Quinnipiac polls? LOL
Tender, plz close this thread.
Tender, plz close this thread.
Message sent to pbrower:
Quote
If you are not adding ALL polls to your maps, I will close your thread.
It's unbearable that you repeatedly exclude polls that show Republicans ahead of Clinton.
OK ?
Thx.
It's unbearable that you repeatedly exclude polls that show Republicans ahead of Clinton.
OK ?
Thx.
Title: Re: 2016 Official Polling Map Thread
Post by: Amenhotep Bakari-Sellers on July 22, 2015, 02:34:16 PM
Clinton was never gonna win by this much. She will barely get to 270.
Title: Re: 2016 Official Polling Map Thread
Post by: pbrower2a on July 22, 2015, 06:37:38 PM
So you won't add the Quinnipiac polls? LOL
Tender, plz close this thread.
Tender, plz close this thread.
Message sent to pbrower:
Quote
If you are not adding ALL polls to your maps, I will close your thread.
It's unbearable that you repeatedly exclude polls that show Republicans ahead of Clinton.
OK ?
Thx.
It's unbearable that you repeatedly exclude polls that show Republicans ahead of Clinton.
OK ?
Thx.
OK. The Republican steamroller has just begun to take off.
I will average polls for Virginia (consecutive weeks).
Title: Re: 2016 Official Polling Map Thread
Post by: pbrower2a on July 22, 2015, 07:07:24 PM
Matchups in each state show:
Colorado Iowa Virginia
* Clinton 38 36 41
* Rubio 46 44 43
* Clinton 36 36 39
* Bush 41 42 42
* Clinton 38 37 40
* Walker 47 45 43
(Of course, the undecided are high).
Hillary Clinton vs. Jeb Bush
(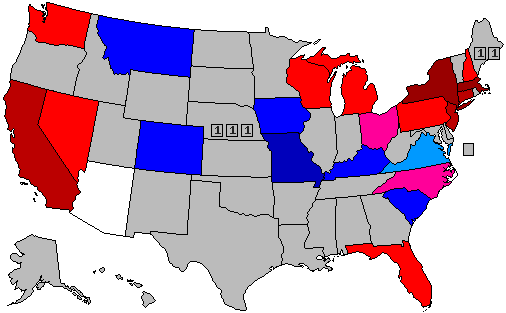 )
)
Hillary Clinton vs. Mike Huckabee
()
Hillary Clinton vs. Rand Paul
()
Hillary Clinton vs. Marco Rubio
(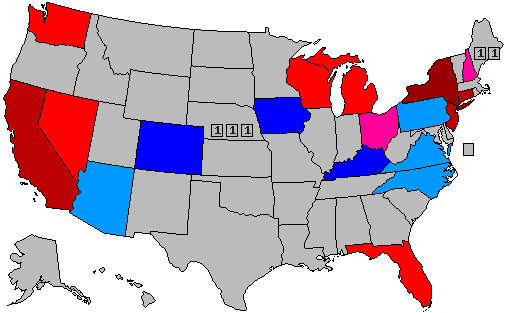 )
)
Hillary Clinton vs. Scott Walker
(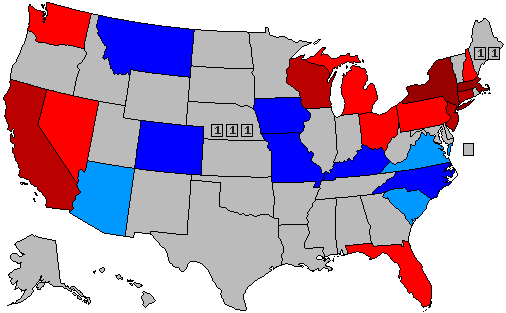 )
)
30% -- lead with 40-49% but a margin of 3% or less
40% -- lead with 40-49% but a margin of 4% or more
60% -- lead with 50-54%
70% -- lead with 55-59%
90% -- lead with 60% or more
Colorado Iowa Virginia
* Clinton 38 36 41
* Rubio 46 44 43
* Clinton 36 36 39
* Bush 41 42 42
* Clinton 38 37 40
* Walker 47 45 43
(Of course, the undecided are high).
Hillary Clinton vs. Jeb Bush
(
Hillary Clinton vs. Mike Huckabee
(
Hillary Clinton vs. Rand Paul
(
Hillary Clinton vs. Marco Rubio
(
Hillary Clinton vs. Scott Walker
(
30% -- lead with 40-49% but a margin of 3% or less
40% -- lead with 40-49% but a margin of 4% or more
60% -- lead with 50-54%
70% -- lead with 55-59%
90% -- lead with 60% or more
Title: Re: 2016 Official Polling Map Thread
Post by: Attorney General, LGC Speaker, and Former PPT Dwarven Dragon on July 22, 2015, 07:19:35 PM
Iowa should be blue on the Rubio and Walker maps.
Making that correction, and assuming the unpolled states go for the party they went for in 2012:
Rubio is at 272 EV's. Victory!
Paul must win in Ohio (exact tie currently) and Florida to get over 270
Walker must win in Ohio and Florida to get over 270
Bush must win in Ohio, North Carolina, and Florida to get over 270
Huckabee must win in Colorado, Iowa, Ohio, Virginia, and Florida to get over 270
Title: Re: 2016 Official Polling Map Thread
Post by: Amenhotep Bakari-Sellers on July 24, 2015, 03:06:38 PM
If the Democratic nominee, be it Sanders or Clinton, is in trouble in the state of Virginia, which has become a microcosm of the country, I have a hard time seeing them win the election. With Pennsylvania in play as well, we are headed for a very competitive election.
Clinton should win; without Va. She must win CO, NV and Pa. Not buying the QU polls on CO. Lets wait to hear from PPP. But, hopefully she wins 272-266
Title: Re: 2016 Official Polling Map Thread
Post by: EliteLX on July 24, 2015, 04:50:16 PM
2016 may end up being a real tight head-to-head match and HRC is going to have to play some killer damn defense, despite what media blows around. If the GOP picks a sharp ticket & a strong-shot VP then this election will be extremely exciting.
Title: Re: 2016 Official Polling Map Thread
Post by: Amenhotep Bakari-Sellers on July 26, 2015, 08:44:55 AM
Yeah, the Dems should win the 242 blue wall, and CO or OH will give Dems 270. Polls showing more than that; like a 2012 election scenario, doesnt know that this is a third Dem reelection.
Title: Re: 2016 Official Polling Map Thread
Post by: mvd10 on July 27, 2015, 12:47:58 PM
Getting ugly for Republicans. They can't win without Virginia.
They can.
They would have to win Florida, Ohio, and Pennsylvania... and so far I see no Republican winning all three.
I see Bernie Sanders closing in on Republicans as he gets better known... which indicates that the 2016 election does not depend upon the health of Hillary Clinton anymore.
A Republican win in 2016 will depend upon Obama failure. Failure to convince people who were never going to support him under any circumstances is not failure. An economic meltdown, a military debacle, or a diplomatic catastrophe would singly be enough.
Even one of the President's harshest critics, Karl Rove, admits that the President is "cautious".
If the GOP wins all the Romney states + Florida, Ohio, Colorado, New Hampshire and Iowa they win 272-266. Would be pretty hard, but still possible. And if Sandoval is on the ticket they might win Nevada. But it would be a lot easier for them if they manage to win Virginia or Pennsylvania.
Title: Re: 2016 Official Polling Map Thread
Post by: pbrower2a on July 29, 2015, 01:30:46 PM
PPP, Illinois:
The Land of Lincoln isn't going to vote for the Party that Abraham Lincoln practically created. Of course, the Party of Lincoln has become a mirror image of a Party of Lenin.
Clinton 48 - Bush 39
Clinton 51 - Huckabee 35
Clinton 47 - Paul 37
Clinton 49 - Rubio 39
Clinton 50 - Walker 39
Sanders beats every Republican now in Illinois, so if something happens to Hillary Clinton, he has a chance.
http://www.publicpolicypolling.com/pdf/2015/PPP_Release_IL_72915.pdf
Minnesota next week.
Hillary Clinton vs. Jeb Bush
(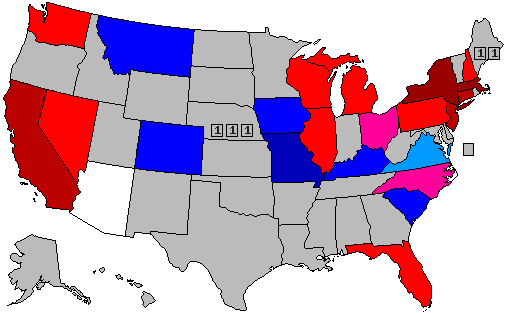 )
)
Hillary Clinton vs. Mike Huckabee
(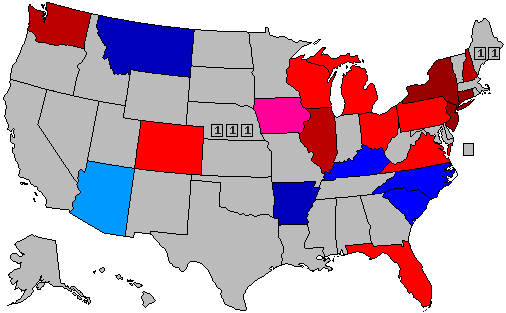 )
)
Hillary Clinton vs. Rand Paul
(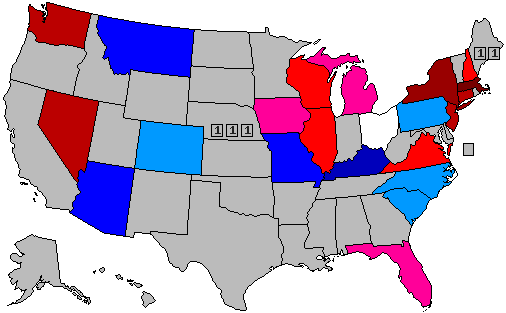 )
)
Hillary Clinton vs. Marco Rubio
(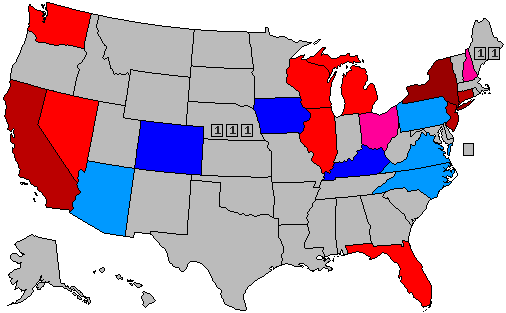 )
)
Hillary Clinton vs. Scott Walker
(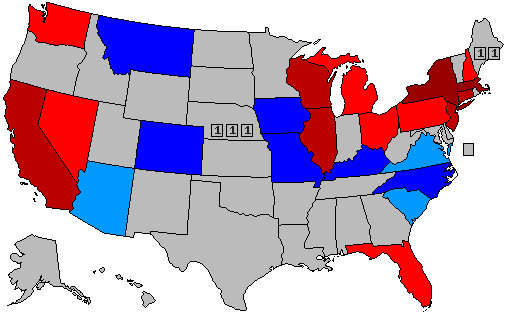 )
)
30% -- lead with 40-49% but a margin of 3% or less
40% -- lead with 40-49% but a margin of 4% or more
60% -- lead with 50-54%
70% -- lead with 55-59%
90% -- lead with 60% or more
[/quote]
The Land of Lincoln isn't going to vote for the Party that Abraham Lincoln practically created. Of course, the Party of Lincoln has become a mirror image of a Party of Lenin.
Clinton 48 - Bush 39
Clinton 51 - Huckabee 35
Clinton 47 - Paul 37
Clinton 49 - Rubio 39
Clinton 50 - Walker 39
Sanders beats every Republican now in Illinois, so if something happens to Hillary Clinton, he has a chance.
http://www.publicpolicypolling.com/pdf/2015/PPP_Release_IL_72915.pdf
Minnesota next week.
Hillary Clinton vs. Jeb Bush
(
Hillary Clinton vs. Mike Huckabee
(
Hillary Clinton vs. Rand Paul
(
Hillary Clinton vs. Marco Rubio
(
Hillary Clinton vs. Scott Walker
(
30% -- lead with 40-49% but a margin of 3% or less
40% -- lead with 40-49% but a margin of 4% or more
60% -- lead with 50-54%
70% -- lead with 55-59%
90% -- lead with 60% or more
[/quote]
Title: Re: 2016 Official Polling Map Thread
Post by: pbrower2a on July 29, 2015, 10:17:59 PM
PPP, Illinois:
The Land of Lincoln isn't going to vote for the Party that Abraham Lincoln practically created. Of course, the Party of Lincoln has become a mirror image of a Party of Lenin.
The Land of Lincoln isn't going to vote for the Party that Abraham Lincoln practically created. Of course, the Party of Lincoln has become a mirror image of a Party of Lenin.
Can you just post the maps without making these silly comments?
I could -- but I usually post such a comment once about a state.
Title: Re: 2016 Official Polling Map Thread
Post by: Kingpoleon on August 02, 2015, 04:00:29 PM
Losing Ohio, Colorado, Florida, and North Carolina would crush the Democrats in 2018, and 2020 would be SOLID GOP. Considering Paul and Rubio doing so well in Pennsylvania, along with Virginia, Clinton should be worried about the general.
Title: Re: 2016 Official Polling Map Thread
Post by: Crumpets on August 02, 2015, 04:48:44 PM
pbrower, do you mean to have Indiana as solid D on the Clinton vs. Walker map?
Title: Re: 2016 Official Polling Map Thread
Post by: pbrower2a on August 02, 2015, 05:51:07 PM
pbrower, do you mean to have Indiana as solid D on the Clinton vs. Walker map?
No. It's Illinois that would be solid D. Sorry about that. Correction made.
If anything, I would expect Indiana to be "weak Walker".
I still think that Quinnipiac assumes a 2014 electorate, which would practically ensure a Republican win of the Presidency and a hold on the Senate. A 2012 electorate dooms any Republican Presidential candidate and practically assures a Democratic win of the Senate.
Title: Re: 2016 Official Polling Map Thread
Post by: Attorney General, LGC Speaker, and Former PPT Dwarven Dragon on August 02, 2015, 06:48:04 PM
pbrower, do you mean to have Indiana as solid D on the Clinton vs. Walker map?
No. It's Illinois that would be solid D. Sorry about that.
If anything, I would expect Indiana to be "weak Walker".
I still think that Quinnipiac assumes a 2014 electorate, which would practically ensure a Republican win of the Presidency and a hold on the Senate. A 2012 electorate dooms any Republican Presidential candidate and practically assures a Democratic win of the Senate.
Not necessarily on the Senate. Toomey is looking very strong, Portman is a great fundraiser and campaigner, Ayotte is likely okay unless Hassan runs, Burr has no serious challenger, McCain is in the right state politically. IL, WI, FL is only 3 gains, 2 if Dems lose NV. They need 4 to reach 50 seats.
Title: Re: 2016 Official Polling Map Thread
Post by: pbrower2a on August 02, 2015, 07:05:28 PM
pbrower, do you mean to have Indiana as solid D on the Clinton vs. Walker map?
No. It's Illinois that would be solid D. Sorry about that.
If anything, I would expect Indiana to be "weak Walker".
I still think that Quinnipiac assumes a 2014 electorate, which would practically ensure a Republican win of the Presidency and a hold on the Senate. A 2012 electorate dooms any Republican Presidential candidate and practically assures a Democratic win of the Senate.
Not necessarily on the Senate. Toomey is looking very strong, Portman is a great fundraiser and campaigner, Ayotte is likely okay unless Hassan runs, Burr has no serious challenger, McCain is in the right state politically. IL, WI, FL is only 3 gains, 2 if Dems lose NV. They need 4 to reach 50 seats.
Portman is behind. Toomey? depends upon the pollster. Ayotte? Depends upon the competition. McCain? Trump has savaged him pointlessly, and those words will not go away.
It is easier for challengers emerge and defeat pols with weak approvals than it is for pols with weak approval ratings to become solid. Think of Blanche Lincoln.
Title: Re: 2016 Official Polling Map Thread
Post by: Amenhotep Bakari-Sellers on August 03, 2015, 07:34:15 AM
Toomey isnt up 20; I assure you that. PPP has him only up by 4. The only pollster showing him ahead; substantially; is QU; the same pllster you just questioned about Portman. Has Strickland running away with senate race.
Title: Re: 2016 Official Polling Map Thread
Post by: pbrower2a on August 03, 2015, 09:04:12 AM
Portman is behind.
Except he isn't. Still a Toss-up, probably tilt R.
The most recent poll has him behind Strickland.
Quote
Toomey? depends upon the pollster.
So if 6 out of 7 pollsters show him up by margins between 3-20 points, it "depends"? Also LOL@saying it depends on the pollster in PA but not in OH.
I see the wild range in approval ratings for Toomey. One is not going to win re-election with approval in the 30s in a state whose opposition to the incumbent is strong. High 40s? Tough. That's how things are in Ohio.
Quote
McCain? Trump has savaged him pointlessly, and those words will not go away.
There is no proof yet that Trump's remarks have damaged McCain.
...The Democrats will not use those. They have too much respect for military service. As I see it the big question mark on Senator McCain is his health due to his age.
Quote
It is easier for challengers emerge and defeat pols with weak approvals than it is for pols with weak approval ratings to become solid. Think of Blanche Lincoln.
None of these Senators have really weak approval ratings (except Kirk, of course). Also, that means that Michael Bennet is in trouble as well.
I have a thread for Senate approvals for incumbents up for re-election in 2016. See that.
Quote
You're a hack.
Aren't we all? Sure I want Democrats to win everything possible in 2016.
Title: Re: 2016 Official Polling Map Thread
Post by: pbrower2a on August 03, 2015, 09:20:05 AM
This (with some verbal changes for clarity because the post is better understood in context) is my most recent (as of August 3, 2015) post on approval of Senators up for re-election.
https://uselectionatlas.org/FORUM/index.php?topic=209635.msg4674395#msg4674395
I am not showing approval ratings on the map for retiring incumbents. Note that with the indictment of Senator Bob Menendez (D-NJ) I see the possibility of his current seat becoming available in 2016 because an appointed Senator must be re-elected.
"Other" means no credible polls.
Quote
Mark Kirk, R-IL
Approval 25%, disapproval 42%, undecided 33%
http://www.publicpolicypolling.com/pdf/2015/PPP_Release_IL_72915.pdf
I have waited for a poll (involving Senator Kirk before projecting his political demise in 20a16). I don't see him sticking around a 25% approval, but I see no possibility of him getting in the range for winning re-election. He was elected under freakish circumstances that will not be repeated in 2016. (He is simply a terrible) mis-match for the state -- just as a slightly-liberal Democratic Senator from Oklahoma who won election in poisoned circumstances would be a terrible mis-match for Oklahoma).
( )
)
Approval polls only.
White -- retiring incumbent or (should it happen) an incumbent defeated in a primary, with "D" or "R" for the party in question.
Yellow -- incumbent under indictment or with a terminal diagnosis short of the completion of his term, with "D" or "R" for the party in question.
Light green -- Republican incumbent apparently running for re-election, no polls.
Light orange -- Republican incumbent apparently running for re-election, no polls.
Blue -- Republican running for re-election with current polls available.
Red -- Republican running for re-election with current polls available.
Intensity percentage shows the first digit of the approval of the incumbent Senator --
"2" for approval between 20% and 30%, "3" for approval between 30% and 39%... "7" for approval between 70% and 79%.
Numbers are recent approval ratings for incumbent Senators if their approvals are below 55%. I'm not showing any number for any incumbent whose approval is 55% or higher because even this early that looks very safe.
An asterisk (*) is for an appointed incumbent (there are none now) because appointed pols have never shown their electability.
Approval only (although I might accept A/B/C/D/F) -- not favorability. I do not use any Excellent-Good-Fair-Poor ratings because "fair" is ambiguous. A fair performance by a 7-year-old violinist might impress you. A 'fair' performance by an adult violinist indicates something for which you would not want to buy a ticket.
NO PARTISAN POLLS.
This shows less than many would like to see. I'm not rating the strength of the opponent or the likelihood of the incumbent seeing himself in good-enough health to last into the election.
What I see so far with incumbents:
App Rep Dem
<40 4 0
40-44 2 0
45-49 2 2
50-54 3 0
55-59 0 0
>60 0 2
retire 1 3
indict 0 1
other 10 2
Approval 25%, disapproval 42%, undecided 33%
http://www.publicpolicypolling.com/pdf/2015/PPP_Release_IL_72915.pdf
I have waited for a poll (involving Senator Kirk before projecting his political demise in 20a16). I don't see him sticking around a 25% approval, but I see no possibility of him getting in the range for winning re-election. He was elected under freakish circumstances that will not be repeated in 2016. (He is simply a terrible) mis-match for the state -- just as a slightly-liberal Democratic Senator from Oklahoma who won election in poisoned circumstances would be a terrible mis-match for Oklahoma).
(
Approval polls only.
White -- retiring incumbent or (should it happen) an incumbent defeated in a primary, with "D" or "R" for the party in question.
Yellow -- incumbent under indictment or with a terminal diagnosis short of the completion of his term, with "D" or "R" for the party in question.
Light green -- Republican incumbent apparently running for re-election, no polls.
Light orange -- Republican incumbent apparently running for re-election, no polls.
Blue -- Republican running for re-election with current polls available.
Red -- Republican running for re-election with current polls available.
Intensity percentage shows the first digit of the approval of the incumbent Senator --
"2" for approval between 20% and 30%, "3" for approval between 30% and 39%... "7" for approval between 70% and 79%.
Numbers are recent approval ratings for incumbent Senators if their approvals are below 55%. I'm not showing any number for any incumbent whose approval is 55% or higher because even this early that looks very safe.
An asterisk (*) is for an appointed incumbent (there are none now) because appointed pols have never shown their electability.
Approval only (although I might accept A/B/C/D/F) -- not favorability. I do not use any Excellent-Good-Fair-Poor ratings because "fair" is ambiguous. A fair performance by a 7-year-old violinist might impress you. A 'fair' performance by an adult violinist indicates something for which you would not want to buy a ticket.
NO PARTISAN POLLS.
This shows less than many would like to see. I'm not rating the strength of the opponent or the likelihood of the incumbent seeing himself in good-enough health to last into the election.
What I see so far with incumbents:
App Rep Dem
<40 4 0
40-44 2 0
45-49 2 2
50-54 3 0
55-59 0 0
>60 0 2
retire 1 3
indict 0 1
other 10 2
https://uselectionatlas.org/FORUM/index.php?topic=209635.msg4674395#msg4674395
I am not showing approval ratings on the map for retiring incumbents. Note that with the indictment of Senator Bob Menendez (D-NJ) I see the possibility of his current seat becoming available in 2016 because an appointed Senator must be re-elected.
"Other" means no credible polls.
Title: Re: 2016 Official Polling Map Thread
Post by: pbrower2a on August 03, 2015, 09:24:44 AM
The polls showing Senators Portman and Toomey with approvals around 50% seem to involve a 2014 electorate.
Ron Johnson is extremely vulnerable in Wisconsin. Burr (NC) would bet in a Blanche Lincoln situation should he face a strong opponent. He loses to a strong Democrat with an electorate resembling that of 2008 or 2012. 35% approval? Not good enough for a slightly-R state. Please take any further discussion of Senate seats as affected by a Presidential election to
https://uselectionatlas.org/FORUM/index.php?topic=209635.msg4674395#msg4674395
Title: Re: 2016 Official Polling Map Thread
Post by: pbrower2a on August 04, 2015, 04:32:35 PM
Minnesota, PPP.
Clinton: 43%
Paul: 42%
Clinton: 44%
Bush: 42%
Clinton: 44%
Huckabee: 42%
Clinton: 42%
Rubio: 40%
Clinton: 44%
Fiorina: 33%
Clinton: 46%
Walker: 42%
Clinton: 44%
Carson: 39%
Clinton: 44%
Cruz: 39%
Clinton: 44%
Trump: 39%
Clinton: 43%
Christie: 38%
...Consistent with Quinnipiac results last week. E-mail gets resolved without a cover-up, or Hillary Clinton is in deep trouble. These are very shaky results for a Democrat in a state that has not voted for a Republican nominee for President since 1972.
Hillary Clinton vs. Jeb Bush
(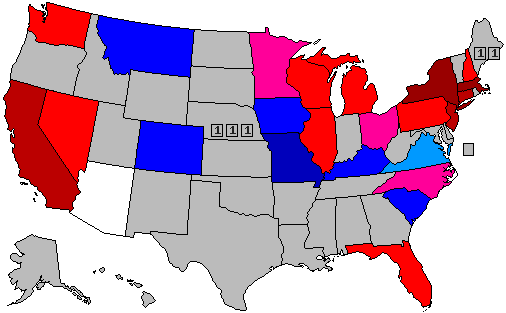 )
)
Hillary Clinton vs. Mike Huckabee
(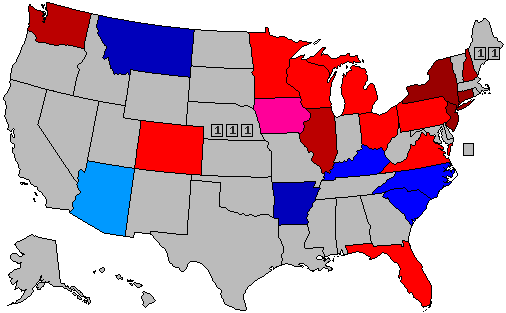 )
)
Hillary Clinton vs. Rand Paul
(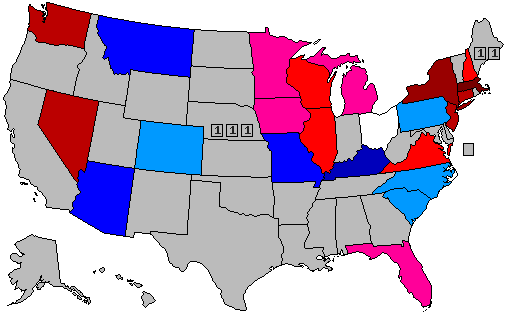 )
)
Hillary Clinton vs. Marco Rubio
(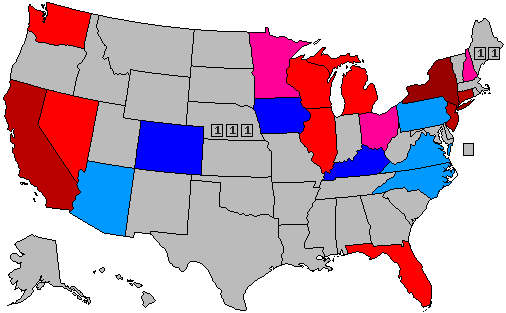 )
)
Hillary Clinton vs. Scott Walker
(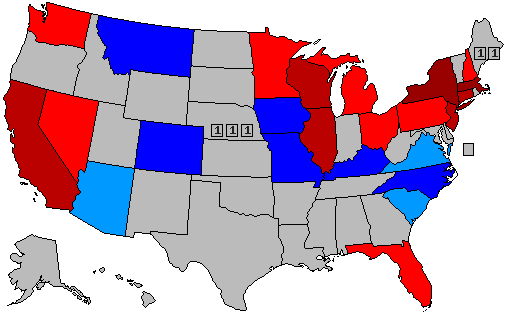 )
)
30% -- lead with 40-49% but a margin of 3% or less
40% -- lead with 40-49% but a margin of 4% or more
60% -- lead with 50-54%
70% -- lead with 55-59%
90% -- lead with 60% or more
Clinton: 43%
Paul: 42%
Clinton: 44%
Bush: 42%
Clinton: 44%
Huckabee: 42%
Clinton: 42%
Rubio: 40%
Clinton: 44%
Fiorina: 33%
Clinton: 46%
Walker: 42%
Clinton: 44%
Carson: 39%
Clinton: 44%
Cruz: 39%
Clinton: 44%
Trump: 39%
Clinton: 43%
Christie: 38%
...Consistent with Quinnipiac results last week. E-mail gets resolved without a cover-up, or Hillary Clinton is in deep trouble. These are very shaky results for a Democrat in a state that has not voted for a Republican nominee for President since 1972.
Hillary Clinton vs. Jeb Bush
(
Hillary Clinton vs. Mike Huckabee
(
Hillary Clinton vs. Rand Paul
(
Hillary Clinton vs. Marco Rubio
(
Hillary Clinton vs. Scott Walker
(
30% -- lead with 40-49% but a margin of 3% or less
40% -- lead with 40-49% but a margin of 4% or more
60% -- lead with 50-54%
70% -- lead with 55-59%
90% -- lead with 60% or more
Title: Re: 2016 Official Polling Map Thread
Post by: Mehmentum on August 04, 2015, 07:47:48 PM
Comparing recent 2016 polls (Clinton v. Bush) to 2012 results:
Minnesota: D -6 from 2012
Illinois: -8 (Obama had home state effect)
Virginia: +4
North Carolina: +4
Kentucky: +15
Michigan: -1
Ohio: -1
Pennsylvania: +6
Comparing 2016 polls (Clinton v. Best Republican) to 2012 Results:
Minnesota: D -7 (v. Paul)
Illinois: -8 (v. Bush)
Virginia: Even (v. Rubio & Carson)
North Carolina: -2 (v. Huckabee)
Michigan: -7 (v. Paul)
Arkansas: +10 (v. Huckabee)
Kentucky: +13 (v. Paul & Huckabee)
Ohio: -10 (v. Kasich, -6 v. Paul)
Pennsylvania: -6 (v. Rubio)
So Clinton is much stronger in the Upper South, holding steady in the coastal south, and doing worse in the Midwest
Title: Re: 2016 Official Polling Map Thread
Post by: Amenhotep Bakari-Sellers on August 04, 2015, 07:57:43 PM
I seriously have a hard time believing the 2016 results will be parallel to 2016.
Clinton clearly is tied with Jeb in QU polls. I think it will be a closer election. And polling such as QU proves it.
Jeb will probably win FL& NC.
Clinton clearly is tied with Jeb in QU polls. I think it will be a closer election. And polling such as QU proves it.
Jeb will probably win FL& NC.
Title: Re: 2016 Official Polling Map Thread
Post by: pbrower2a on August 05, 2015, 07:01:10 AM
Thinking ahead now to the 2016 general election for President of the United States. If the November 2016 election were today, and the only two candidates were Republican Rand Paul
and Democrat Hillary Clinton, who would you vote for?
44% Paul
42% Clinton
http://www.kentucky.com/2015/07/31/3968627/bluegrass-poll-rand-paul-vs-hillary.html
Hillary Clinton vs. Jeb Bush
()
Hillary Clinton vs. Mike Huckabee
()
Hillary Clinton vs. Rand Paul
( )
)
Hillary Clinton vs. Marco Rubio
()
Hillary Clinton vs. Scott Walker
()
30% -- lead with 40-49% but a margin of 3% or less
40% -- lead with 40-49% but a margin of 4% or more
60% -- lead with 50-54%
70% -- lead with 55-59%
90% -- lead with 60% or more
[/quote]
and Democrat Hillary Clinton, who would you vote for?
44% Paul
42% Clinton
http://www.kentucky.com/2015/07/31/3968627/bluegrass-poll-rand-paul-vs-hillary.html
Hillary Clinton vs. Jeb Bush
(
Hillary Clinton vs. Mike Huckabee
(
Hillary Clinton vs. Rand Paul
(
Hillary Clinton vs. Marco Rubio
(
Hillary Clinton vs. Scott Walker
(
30% -- lead with 40-49% but a margin of 3% or less
40% -- lead with 40-49% but a margin of 4% or more
60% -- lead with 50-54%
70% -- lead with 55-59%
90% -- lead with 60% or more
[/quote]
Title: Re: 2016 Official Polling Map Thread
Post by: Senator Cris on August 05, 2015, 07:06:06 AM
KY is red in your map.
Title: Re: 2016 Official Polling Map Thread
Post by: pbrower2a on August 05, 2015, 07:36:26 AM
KY is red in your map.
Not now.
Title: Re: 2016 Official Polling Map Thread
Post by: EliteLX on August 05, 2015, 05:39:37 PM
Thinking ahead now to the 2016 general election for President of the United States. If the November 2016 election were today, and the only two candidates were Republican Rand Paul
and Democrat Hillary Clinton, who would you vote for?
44% Paul
42% Clinton
http://www.kentucky.com/2015/07/31/3968627/bluegrass-poll-rand-paul-vs-hillary.html
Hillary Clinton vs. Jeb Bush
()
Hillary Clinton vs. Mike Huckabee
()
Hillary Clinton vs. Rand Paul
()
Hillary Clinton vs. Marco Rubio
()
Hillary Clinton vs. Scott Walker
()
30% -- lead with 40-49% but a margin of 3% or less
40% -- lead with 40-49% but a margin of 4% or more
60% -- lead with 50-54%
70% -- lead with 55-59%
90% -- lead with 60% or more
and Democrat Hillary Clinton, who would you vote for?
44% Paul
42% Clinton
http://www.kentucky.com/2015/07/31/3968627/bluegrass-poll-rand-paul-vs-hillary.html
Hillary Clinton vs. Jeb Bush
(
Hillary Clinton vs. Mike Huckabee
(
Hillary Clinton vs. Rand Paul
(
Hillary Clinton vs. Marco Rubio
(
Hillary Clinton vs. Scott Walker
(
30% -- lead with 40-49% but a margin of 3% or less
40% -- lead with 40-49% but a margin of 4% or more
60% -- lead with 50-54%
70% -- lead with 55-59%
90% -- lead with 60% or more
[/quote]
Title: Re: 2016 Official Polling Map Thread
Post by: pbrower2a on August 06, 2015, 05:09:36 AM
http://www.wmur.com/blob/view/-/34557172/data/2/-/e8xecl/-/GSP---8-5.pdf
Clinton 45
Bush 46
Clinton 43
Paul 45
Clinton 43
Walker 45
Clinton 44
Rubio 43
Clinton 50
Trump 40
Hillary Clinton seems to be slipping.
It shows here:
Clinton: 42%
Sanders: 36%
Biden: 5%
Webb: 1%
O'Malley: 1%
Tiny sample (6% MoE), but still.
in primary polling in New Hampshire. E-mails? Democrats going decisively more toward the Left in their preferences?
Hillary Clinton was running away as a front-runner until recently.
Hillary Clinton vs. Jeb Bush
( )
)
Hillary Clinton vs. Mike Huckabee
()
Hillary Clinton vs. Rand Paul
(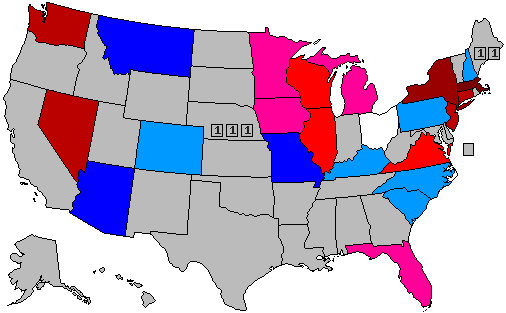 )
)
Hillary Clinton vs. Marco Rubio
()
Hillary Clinton vs. Scott Walker
(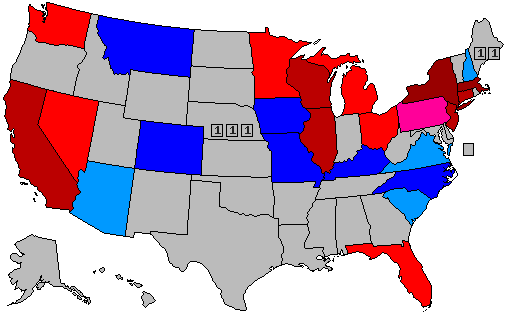 )
)
30% -- lead with 40-49% but a margin of 3% or less
40% -- lead with 40-49% but a margin of 4% or more
60% -- lead with 50-54%
70% -- lead with 55-59%
90% -- lead with 60% or more
Clinton 45
Bush 46
Clinton 43
Paul 45
Clinton 43
Walker 45
Clinton 44
Rubio 43
Clinton 50
Trump 40
Hillary Clinton seems to be slipping.
It shows here:
Clinton: 42%
Sanders: 36%
Biden: 5%
Webb: 1%
O'Malley: 1%
Tiny sample (6% MoE), but still.
in primary polling in New Hampshire. E-mails? Democrats going decisively more toward the Left in their preferences?
Hillary Clinton was running away as a front-runner until recently.
Hillary Clinton vs. Jeb Bush
(
Hillary Clinton vs. Mike Huckabee
(
Hillary Clinton vs. Rand Paul
(
Hillary Clinton vs. Marco Rubio
(
Hillary Clinton vs. Scott Walker
(
30% -- lead with 40-49% but a margin of 3% or less
40% -- lead with 40-49% but a margin of 4% or more
60% -- lead with 50-54%
70% -- lead with 55-59%
90% -- lead with 60% or more
Title: Re: 2016 Official Polling Map Thread
Post by: pbrower2a on August 06, 2015, 09:12:34 AM
This is what the 2016 Presidential results will look like with a 2010 or 2014 electorate, arguably the most right-wing American electorates since the 1920s:
(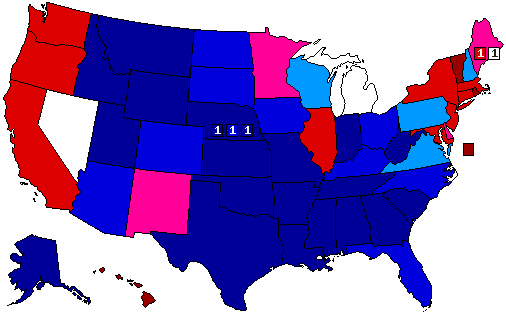 )
)
Atlas colors:
Strong (70% saturation) 10% or higher margin
Weak (50% saturation) 5-9.99% margin
Bare (30% saturation) 2- 4.99% margin
too-close-to-call white
Republican 335
Democrat 202
too close to call 23
Liberals who dislike this sort of America might consider emigrating if they see this on Election night.
(
Atlas colors:
Strong (70% saturation) 10% or higher margin
Weak (50% saturation) 5-9.99% margin
Bare (30% saturation) 2- 4.99% margin
too-close-to-call white
Republican 335
Democrat 202
too close to call 23
Liberals who dislike this sort of America might consider emigrating if they see this on Election night.
Title: Re: 2016 Official Polling Map Thread
Post by: Attorney General, LGC Speaker, and Former PPT Dwarven Dragon on August 06, 2015, 02:19:45 PM
This is what the 2016 Presidential results will look like with a 2010 or 2014 electorate, arguably the most right-wing American electorates since the 1920s:
Er, 1994 and 1980 were just as, if not more right wing across the board than 2010/14. 1952/56/72/84/88 were much more right wing on the presidential level than a presidential election held in 2010/14 would have been.
Title: Re: 2016 Official Polling Map Thread
Post by: pbrower2a on August 11, 2015, 10:38:13 AM
This is what the 2016 Presidential results will look like with a 2010 or 2014 electorate, arguably the most right-wing American electorates since the 1920s:
Er, 1994 and 1980 were just as, if not more right wing across the board than 2010/14. 1952/56/72/84/88 were much more right wing on the presidential level than a presidential election held in 2010/14 would have been.
Don't let facts get in the way of pbrower's nice story. Who cares if the 2014 VA electorate resembled the 2012 one in terms of racial makeup? Who cares if African American turnout in GA was at a record high? Who cares if Gory Gardner only won by 2 points? Who cares if NC was closer in 2014 than it was in 2012?
There were many moderate Republicans until the 1990s. Ronald Reagan won huge numbers of votes from such people. In the 1950s? You have seen my overlay between Ike and Obama... and I figure that except in the Plains states, many of the demographics that liked Ike fit Barack Obama 52 to 60 years later. It is arguable that Stevenson typically won a voter more conservative than the typical voter for Eisenhower. If Ike could win Massachusetts and Minnesota in two consecutive elections, then that says more about Ike as a moderate than about any right-wing shift in the electorate.
Today the Republican Party can succeed without the moderate vote.
In any event I project something that may be a temporary scenario. The typical wave election involves the losing side not knowing what hit its stale-but-venerable incumbents.
So what does a 2008/2012 electorate look like in the Presidential election of 2016? Much the same as for 2012. I do not need a map for that.
Some of the projections are based upon political results. I have Michigan in white because it elected a Democratic senator against a weak opponent but decisively re-elected a Republican Governor. States capable of electing a right-wing Republican to the Senate or the Governorship in 2010 or 2014 show the pattern of a Republican wave election as in 2010 and 2014.
What will the next big change in the electorate be? Your guess is as good as mine. If Christian evangelicals believe that they are getting the shaft then they might break with the right-wingers that offer them war, poverty, and economic insecurity and give nothing in return. But that is a huge assumption that nobody can see in the polls.
Do you think that I predict a 2010/2014 electorate for the 2016 Presidential election? Hardly. The difference is turnout, and the Right turns out with more certainty.
Title: Re: 2016 Official Polling Map Thread
Post by: pbrower2a on August 11, 2015, 10:48:38 AM
Iowa, PPP.
http://www.publicpolicypolling.com/main/2015/08/general-election-tight-in-iowa.html
I would have expected better of Kasich in view of his performance in the debates. This suggests that Hillary Clinton is slipping, but not as direly as Q showed last week. Sanders is catching up to Hillary Clinton in ability to contest potential Republican nominees.
Hillary Clinton vs. Jeb Bush
(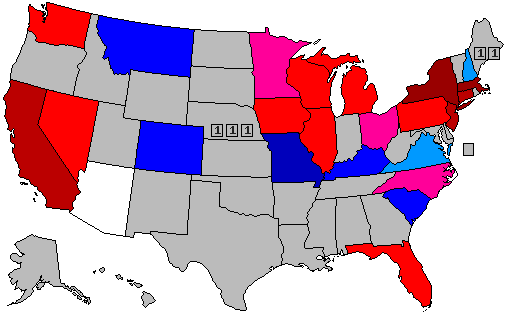 )
)
Hillary Clinton vs. Mike Huckabee
(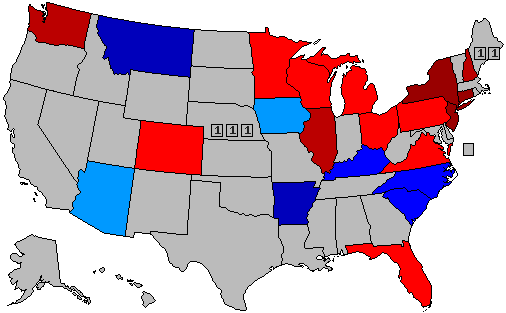 )
)
Hillary Clinton vs. Rand Paul
()
Hillary Clinton vs. Marco Rubio
(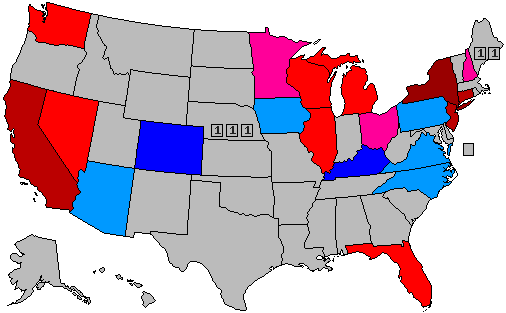 )
)
Hillary Clinton vs. Scott Walker
(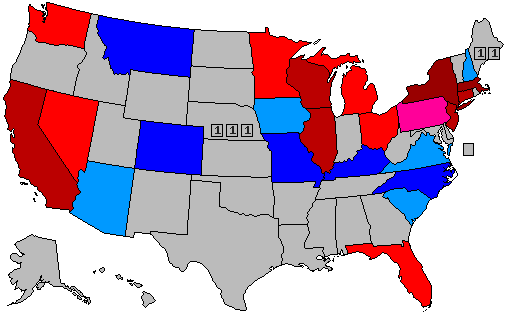 )
)
30% -- lead with 40-49% but a margin of 3% or less
40% -- lead with 40-49% but a margin of 4% or more
60% -- lead with 50-54%
70% -- lead with 55-59%
90% -- lead with 60% or more
[/quote]
Quote
The strongest Republican against Clinton in the state is Ben Carson, who leads her 44/40. The other three GOP hopefuls ahead of Clinton all lead her by just a single point- Mike Huckabee at 44/43, Scott Walker at 44/43, and Marco Rubio at 43/42.
The Republicans who fare the worst against Clinton are Jeb Bush who trails by 4 at 44/40, and Rand Paul and Donald Trump who each trail by 3 at 43/40. The rest of the GOP hopefuls each trail Clinton by 2 points- Ted Cruz at 44/42, Carly Fiorina at 42/40, and Chris Christie and John Kasich each at 41/39.
The Republicans who fare the worst against Clinton are Jeb Bush who trails by 4 at 44/40, and Rand Paul and Donald Trump who each trail by 3 at 43/40. The rest of the GOP hopefuls each trail Clinton by 2 points- Ted Cruz at 44/42, Carly Fiorina at 42/40, and Chris Christie and John Kasich each at 41/39.
http://www.publicpolicypolling.com/main/2015/08/general-election-tight-in-iowa.html
I would have expected better of Kasich in view of his performance in the debates. This suggests that Hillary Clinton is slipping, but not as direly as Q showed last week. Sanders is catching up to Hillary Clinton in ability to contest potential Republican nominees.
Hillary Clinton vs. Jeb Bush
(
Hillary Clinton vs. Mike Huckabee
(
Hillary Clinton vs. Rand Paul
(
Hillary Clinton vs. Marco Rubio
(
Hillary Clinton vs. Scott Walker
(
30% -- lead with 40-49% but a margin of 3% or less
40% -- lead with 40-49% but a margin of 4% or more
60% -- lead with 50-54%
70% -- lead with 55-59%
90% -- lead with 60% or more
[/quote]
Title: Re: 2016 Official Polling Map Thread
Post by: pbrower2a on August 12, 2015, 06:49:45 AM
PPP, Missouri. Note that this a poll of primary voters, so it is a constricted sample.
Bush 47%
Clinton 40%
Carson 52%
Clinton 38%
Christie 46%
Clinton 37%
Cruz 50%
Clinton 38%
Fiorina 47%
Clinton 37%
Huckabee 51%
Clinton 38%
Kasich 49%
Clinton 36%
Paul 49%
Clinton 37%
Rubio 51%
Clinton 36%
Trump 48%
Clinton 39%
Walker 50%
Clinton 37%
3-way
Clinton 34%
Trump 30%
Bush 29%
Sanders matchups
Bush 47%
Sanders 34%
Rubio 48%
Sanders 33%
Trump 48%
Sanders 39%
Walker 46%
Sanders 34%
http://www.publicpolicypolling.com/main/2015/08/trump-leads-republicans-in-mo-gop-field-leads-clinton.html
Title: Re: 2016 Official Polling Map Thread
Post by: Tender Branson on August 12, 2015, 08:46:16 AM
PPP, Missouri. Note that this a poll of primary voters, so it is a constricted sample.
It's not a primary poll, it's a general election poll of registered voters.
The primary numbers are separate and based on an oversample of potential GOP and DEM primary voters.
Title: Re: 2016 Official Polling Map Thread
Post by: Tender Branson on August 12, 2015, 08:49:59 AM
PPP, Missouri. Note that this a poll of primary voters, so it is a constricted sample.
It's not a primary poll, it's a general election poll of registered voters.
The primary numbers are separate and based on an oversample of potential GOP and DEM primary voters.
I still don't know why we even need this thread. We already have the official polling database. Also, pbrower is excluding polls that he doesn't like, so...
I'm just tolerating his thread because he said he would include all polls now and not exclude polls that show Hilldog trailing.
It's a free forum after all.
I'll close that thread after the primaries produce the 2 GE candidates ...
Title: Re: 2016 Official Polling Map Thread
Post by: pbrower2a on August 12, 2015, 02:33:05 PM
I saw the polls for primaries first and missed the larger count of polled voters (many people vote in the general election but not in the primaries). These are valid matchups.
Bush 47%
Clinton 40%
Huckabee 51%
Clinton 38%
Kasich 49%
Clinton 36%
Paul 49%
Clinton 37%
Rubio 51%
Clinton 36%
Walker 50%
Clinton 37%
Hillary Clinton is simply getting clobbered in Missouri, except by Jeb Bush -- who may be fading on his own. This map shows Clinton much closer to Paul than she is.
The strength of Huckabee shows the power of the evangelical/fundamentalist vote in Missouri.
I may soon have to replace someone with Kasich, who has shown himself strong as the result of the most recent Republican debate.
Hillary Clinton vs. Jeb Bush
( )
)
Hillary Clinton vs. Mike Huckabee
(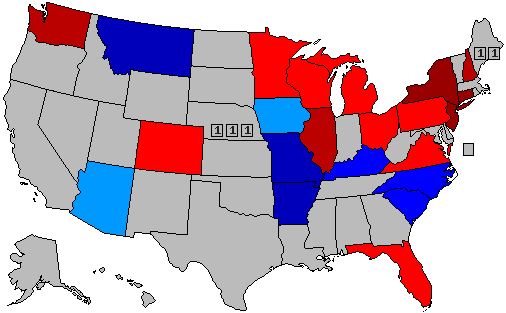 )
)
Hillary Clinton vs. Rand Paul
()
Hillary Clinton vs. Marco Rubio
(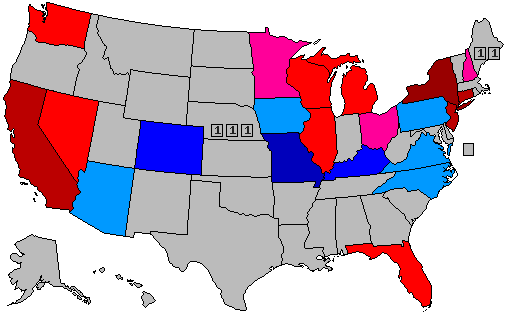 )
)
Hillary Clinton vs. Scott Walker
( )
)
30% -- lead with 40-49% but a margin of 3% or less
40% -- lead with 40-49% but a margin of 4% or more
60% -- lead with 50-54%
70% -- lead with 55-59%
90% -- lead with 60% or more
[/quote]
[/quote]
Bush 47%
Clinton 40%
Huckabee 51%
Clinton 38%
Kasich 49%
Clinton 36%
Paul 49%
Clinton 37%
Rubio 51%
Clinton 36%
Walker 50%
Clinton 37%
Hillary Clinton is simply getting clobbered in Missouri, except by Jeb Bush -- who may be fading on his own. This map shows Clinton much closer to Paul than she is.
The strength of Huckabee shows the power of the evangelical/fundamentalist vote in Missouri.
I may soon have to replace someone with Kasich, who has shown himself strong as the result of the most recent Republican debate.
Hillary Clinton vs. Jeb Bush
(
Hillary Clinton vs. Mike Huckabee
(
Hillary Clinton vs. Rand Paul
(
Hillary Clinton vs. Marco Rubio
(
Hillary Clinton vs. Scott Walker
(
30% -- lead with 40-49% but a margin of 3% or less
40% -- lead with 40-49% but a margin of 4% or more
60% -- lead with 50-54%
70% -- lead with 55-59%
90% -- lead with 60% or more
[/quote]
[/quote]
Title: Re: 2016 Official Polling Map Thread
Post by: pbrower2a on August 19, 2015, 10:22:51 AM
North Carolina, PPP.
Carson: 47%
Clinton: 40%
Rubio: 45%
Clinton: 41%
Clinton: 44%
Paul: 40%
Clinton: 40%
Christie: 39%
Clinton: 42%
Bush: 42%
Fiorina: 42%
Clinton: 41%
Kasich: 41%
Clinton: 40%
Cruz: 45%
Clinton: 43%
Huckabee: 46%
Clinton: 44%
Trump: 45%
Clinton: 42%
Walker: 44%
Clinton: 41%
-----
Sanders: 36%
Rubio: 42%
Sanders: 37%
Walker: 41%
Sanders: 40%
Bush: 43%
Sanders: 40%
Trump: 43%
----
Clinton: 38%
Bush: 28%
Trump: 27%
http://www.publicpolicypolling.com/main/2015/08/trump-grows-lead-in-nc-gop-leads-most-match-ups.html
This race is becoming increasingly complicated. "Establishment" Republican candidates seem to be fading (if they are losing leads in North Carolina they could be collapsing. Could be. But do we really know? Rand Paul looks to be in a tailspin.
The one certainty is that should the Republicans have to face not only the Democratic nominee but also Donald Trump as an independent, Hillary Clinton wins Missouri and North Carolina... and anything less Republican-leaning.
Do the e-mails matter that much? FoX News and Sinclair Broadcasting seem to so believe. We need remember that many people still have never used an e-mail, think that a server is someone who delivers their overpriced hamburger in a diner, and have no idea what the talking heads are discussing. This can exculpate Hillary Clinton -- or it can implode her campaign efforts.
Reality has suddenly become so complicated that this set of maps may be unsuited to the discussion. I never took Donald Trump, Ben Carson, or Carly Fiorina seriously. But whom do I drop? Bush? Huckabee? Paul?
Any Republican nominee who barely wins, let alone loses, North Carolina, cannot win nationwide.
Someone may need to close this thread.
Hillary Clinton vs. Jeb Bush
(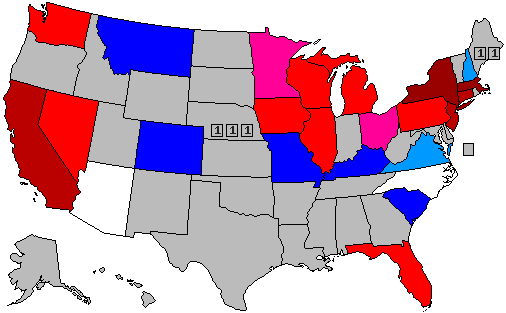 )
)
Hillary Clinton vs. Mike Huckabee
(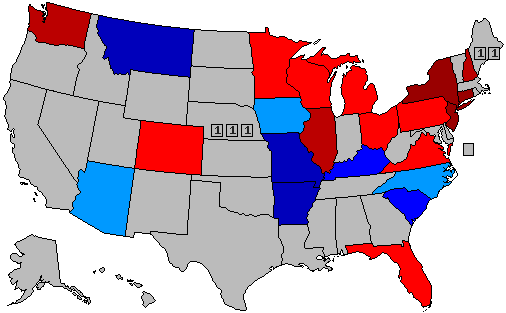 )
)
Hillary Clinton vs. Rand Paul
(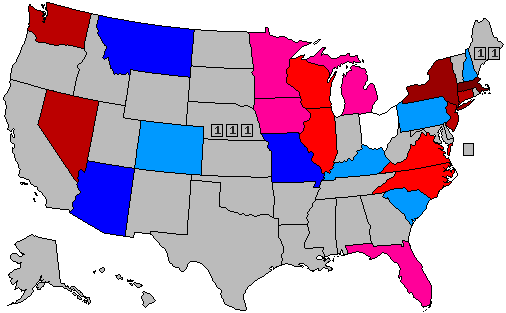 )
)
Hillary Clinton vs. Marco Rubio
(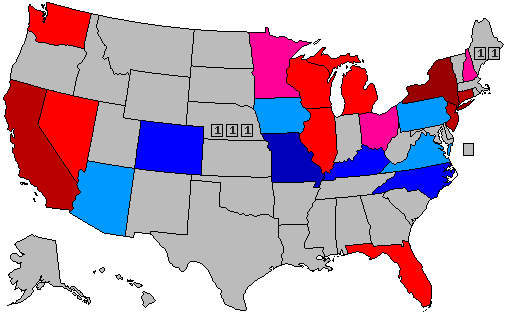 )
)
Hillary Clinton vs. Scott Walker
(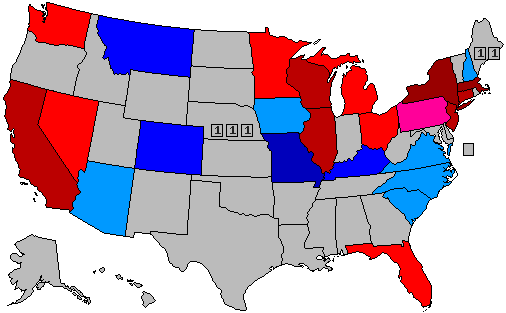 )
)
30% -- lead with 40-49% but a margin of 3% or less
40% -- lead with 40-49% but a margin of 4% or more
60% -- lead with 50-54%
70% -- lead with 55-59%
90% -- lead with 60% or more
Carson: 47%
Clinton: 40%
Rubio: 45%
Clinton: 41%
Clinton: 44%
Paul: 40%
Clinton: 40%
Christie: 39%
Clinton: 42%
Bush: 42%
Fiorina: 42%
Clinton: 41%
Kasich: 41%
Clinton: 40%
Cruz: 45%
Clinton: 43%
Huckabee: 46%
Clinton: 44%
Trump: 45%
Clinton: 42%
Walker: 44%
Clinton: 41%
-----
Sanders: 36%
Rubio: 42%
Sanders: 37%
Walker: 41%
Sanders: 40%
Bush: 43%
Sanders: 40%
Trump: 43%
----
Clinton: 38%
Bush: 28%
Trump: 27%
http://www.publicpolicypolling.com/main/2015/08/trump-grows-lead-in-nc-gop-leads-most-match-ups.html
This race is becoming increasingly complicated. "Establishment" Republican candidates seem to be fading (if they are losing leads in North Carolina they could be collapsing. Could be. But do we really know? Rand Paul looks to be in a tailspin.
The one certainty is that should the Republicans have to face not only the Democratic nominee but also Donald Trump as an independent, Hillary Clinton wins Missouri and North Carolina... and anything less Republican-leaning.
Do the e-mails matter that much? FoX News and Sinclair Broadcasting seem to so believe. We need remember that many people still have never used an e-mail, think that a server is someone who delivers their overpriced hamburger in a diner, and have no idea what the talking heads are discussing. This can exculpate Hillary Clinton -- or it can implode her campaign efforts.
Reality has suddenly become so complicated that this set of maps may be unsuited to the discussion. I never took Donald Trump, Ben Carson, or Carly Fiorina seriously. But whom do I drop? Bush? Huckabee? Paul?
Any Republican nominee who barely wins, let alone loses, North Carolina, cannot win nationwide.
Someone may need to close this thread.
Hillary Clinton vs. Jeb Bush
(
Hillary Clinton vs. Mike Huckabee
(
Hillary Clinton vs. Rand Paul
(
Hillary Clinton vs. Marco Rubio
(
Hillary Clinton vs. Scott Walker
(
30% -- lead with 40-49% but a margin of 3% or less
40% -- lead with 40-49% but a margin of 4% or more
60% -- lead with 50-54%
70% -- lead with 55-59%
90% -- lead with 60% or more
Title: Re: 2016 Official Polling Map Thread
Post by: pbrower2a on August 20, 2015, 02:39:57 PM
Wisconsin, Marquette Law School:
https://law.marquette.edu/poll/
No real change in Wisconsin. Wisconsin is within the Democratic firewall.
Hillary Clinton vs. Jeb Bush
()
Hillary Clinton vs. Mike Huckabee
()
Hillary Clinton vs. Rand Paul
()
Hillary Clinton vs. Marco Rubio
()
Hillary Clinton vs. Scott Walker
()
30% -- lead with 40-49% but a margin of 3% or less
40% -- lead with 40-49% but a margin of 4% or more
60% -- lead with 50-54%
70% -- lead with 55-59%
90% -- lead with 60% or more
Quote
Looking ahead to possible general election preferences of Wisconsin voters:
Clinton 47, Bush 42.
Clinton 52, Walker 42.
Clinton 50, Cruz 38.
Clinton 51, Trump 35.
In April, the results showed Clinton leading Bush 49-38. She led Walker 52-40 and Cruz 52-36. Trump was not matched against Clinton in the April poll.
Clinton 47, Bush 42.
Clinton 52, Walker 42.
Clinton 50, Cruz 38.
Clinton 51, Trump 35.
In April, the results showed Clinton leading Bush 49-38. She led Walker 52-40 and Cruz 52-36. Trump was not matched against Clinton in the April poll.
https://law.marquette.edu/poll/
No real change in Wisconsin. Wisconsin is within the Democratic firewall.
Hillary Clinton vs. Jeb Bush
(
Hillary Clinton vs. Mike Huckabee
(
Hillary Clinton vs. Rand Paul
(
Hillary Clinton vs. Marco Rubio
(
Hillary Clinton vs. Scott Walker
(
30% -- lead with 40-49% but a margin of 3% or less
40% -- lead with 40-49% but a margin of 4% or more
60% -- lead with 50-54%
70% -- lead with 55-59%
90% -- lead with 60% or more
Title: Re: 2016 Official Polling Map Thread
Post by: Tender Branson on August 20, 2015, 02:45:46 PM
No Quinnipiac polls, you hack?
"No, because ... I didn't see them."
or
"No, because ... Marco Rubio would beat Hillary US-wide and win the Presidency if the election would be held today. That CANNOT happen. The polls are FAKE !"
Title: Re: 2016 Official Polling Map Thread
Post by: Tender Branson on August 20, 2015, 02:51:35 PM
pbrower, for fu**s sake, include ALL polls and not just the ones in which Hillary is ahead or I'll close that thread !
Title: Re: 2016 Official Polling Map Thread
Post by: pbrower2a on August 20, 2015, 02:54:27 PM
I just haven't gotten to them yet.
Title: Re: 2016 Official Polling Map Thread
Post by: Attorney General, LGC Speaker, and Former PPT Dwarven Dragon on August 20, 2015, 03:23:08 PM
Maybe Branson should put *excludes some polls* or something in the topic title.
Title: Re: 2016 Official Polling Map Thread
Post by: pbrower2a on August 20, 2015, 03:51:17 PM
Quinnipiac, FL, OH, PA:
(FL) Bush tops Clinton 49 - 38 percent and Rubio leads 51 - 39 percent while Trump gets 43 percent to Clinton's 41 percent.
(OH) Clinton gets 41 percent to 39 percent for Bush. Rubio has 42 percent to Clinton's 40 percent while Clinton tops Trump 43 - 38 percent.
(PA) Bush gets 43 percent to 40 percent for Clinton. Rubio tops Clinton 47 - 40 percent while Clinton beats Trump 45 - 40 percent.
http://www.quinnipiac.edu/news-and-events/quinnipiac-university-poll/2016-presidential-swing-state-polls/release-detail?ReleaseID=2271
...What does Quinnipiac mean by "voters"? Those who voted in 2014?
Hillary Clinton vs. Jeb Bush
(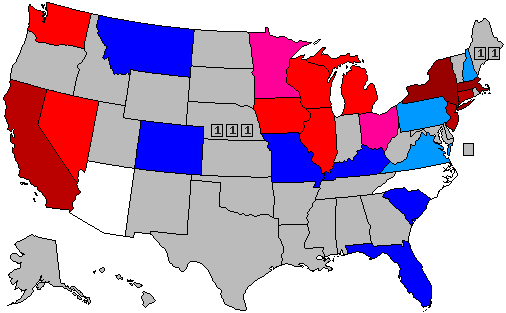 )
)
Hillary Clinton vs. Mike Huckabee
()
Hillary Clinton vs. Rand Paul
()
Hillary Clinton vs. Marco Rubio
( )
)
Hillary Clinton vs. Scott Walker
()
30% -- lead with 40-49% but a margin of 3% or less
40% -- lead with 40-49% but a margin of 4% or more
60% -- lead with 50-54%
70% -- lead with 55-59%
90% -- lead with 60% or more
(FL) Bush tops Clinton 49 - 38 percent and Rubio leads 51 - 39 percent while Trump gets 43 percent to Clinton's 41 percent.
(OH) Clinton gets 41 percent to 39 percent for Bush. Rubio has 42 percent to Clinton's 40 percent while Clinton tops Trump 43 - 38 percent.
(PA) Bush gets 43 percent to 40 percent for Clinton. Rubio tops Clinton 47 - 40 percent while Clinton beats Trump 45 - 40 percent.
http://www.quinnipiac.edu/news-and-events/quinnipiac-university-poll/2016-presidential-swing-state-polls/release-detail?ReleaseID=2271
...What does Quinnipiac mean by "voters"? Those who voted in 2014?
Hillary Clinton vs. Jeb Bush
(
Hillary Clinton vs. Mike Huckabee
(
Hillary Clinton vs. Rand Paul
(
Hillary Clinton vs. Marco Rubio
(
Hillary Clinton vs. Scott Walker
(
30% -- lead with 40-49% but a margin of 3% or less
40% -- lead with 40-49% but a margin of 4% or more
60% -- lead with 50-54%
70% -- lead with 55-59%
90% -- lead with 60% or more
Title: Re: 2016 Official Polling Map Thread
Post by: pbrower2a on August 20, 2015, 03:53:10 PM
The Daily Appalachian/Mark Halperin University poll:
West Virginia
Clinton: 84%
Bush: 9%
Undecided: 7%
Clinton: 80%
Rubio: 17%
Undecided: 3%
Kentucky
Clinton: 75%
Bush: 14%
Undecided: 11%
Clinton: 70%
Rubio: 25%
Undecided: 5%
Tennessee
Clinton: 64%
Bush: 22%
Undecided: 14%
Clinton: 60%
Rubio: 20%
Undecided: 20%
Getting ugly for Republicans. They can't win without WV, KY and TN... Hillary Clinton is doing much better with White Southern women here. Obama got slaughtered McGovern-style in those states. If Clinton is winning key Republican strongholds, there is NO PATH TO VICTORY for the GOP.
Hillary Clinton vs. Jeb Bush
(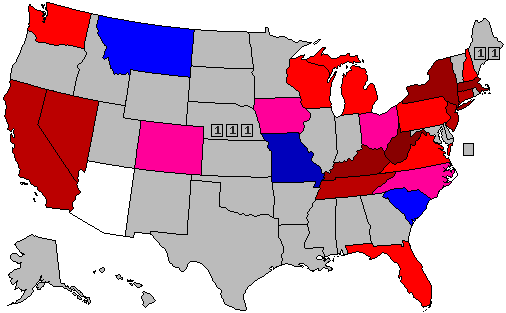 )
)
Hillary Clinton vs. Marco Rubio
(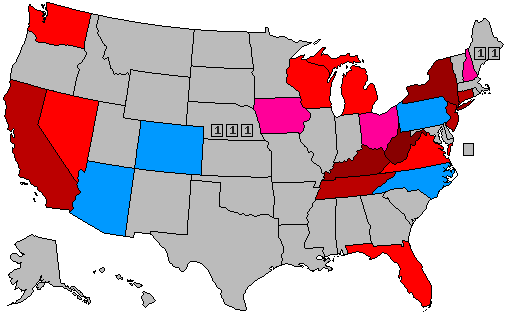 )
)
West Virginia
Clinton: 84%
Bush: 9%
Undecided: 7%
Clinton: 80%
Rubio: 17%
Undecided: 3%
Kentucky
Clinton: 75%
Bush: 14%
Undecided: 11%
Clinton: 70%
Rubio: 25%
Undecided: 5%
Tennessee
Clinton: 64%
Bush: 22%
Undecided: 14%
Clinton: 60%
Rubio: 20%
Undecided: 20%
Getting ugly for Republicans. They can't win without WV, KY and TN... Hillary Clinton is doing much better with White Southern women here. Obama got slaughtered McGovern-style in those states. If Clinton is winning key Republican strongholds, there is NO PATH TO VICTORY for the GOP.
Hillary Clinton vs. Jeb Bush
(
Hillary Clinton vs. Marco Rubio
(
Save this one for April Fool's Day.
I might come up with some polls from "Loof-Lirpa" Polling Institute that day.
Title: Re: 2016 Official Polling Map Thread
Post by: Attorney General, LGC Speaker, and Former PPT Dwarven Dragon on August 20, 2015, 05:25:47 PM
Okay, guys. If pbrower hasn't learned his lesson by now, he's not going to.
Title: Re: 2016 Official Polling Map Thread
Post by: pbrower2a on August 21, 2015, 08:07:47 AM
FL should be blue on the Hillary Clinton vs. Marco Rubio map.
Correction made.
Title: Re: 2016 Official Polling Map Thread
Post by: JonathanSwift on August 21, 2015, 11:28:34 AM
I don't know, guys. Hillary may be dominating in the Solid South and in the Mormon Corridor, but did you hear that the highly respected Halperin-Morris Institute just released a poll showing Jeb Bush trouncing Clinton in five key states won by Barack Obama?
California
Bush: 58%
Clinton: 37%
Other/Undecided: 5%
Colorado
Bush: 96%
Clinton: 1%
Other/Undecided: 3%
Iowa
Bush: 64%
Clinton: 32%
Other/Undecided: 4%
Michigan
Bush: 55%
Clinton: 40%
Other/Undecided: 5%
New Jersey
Bush: 54%
Clinton: 43%
Other/Undecided: 3%
Hillary Clinton vs. Jeb Bush
(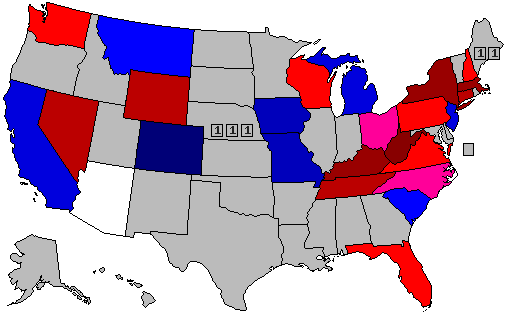 )
)
California
Bush: 58%
Clinton: 37%
Other/Undecided: 5%
Colorado
Bush: 96%
Clinton: 1%
Other/Undecided: 3%
Iowa
Bush: 64%
Clinton: 32%
Other/Undecided: 4%
Michigan
Bush: 55%
Clinton: 40%
Other/Undecided: 5%
New Jersey
Bush: 54%
Clinton: 43%
Other/Undecided: 3%
Hillary Clinton vs. Jeb Bush
(
Title: Re: 2016 Official Polling Map Thread
Post by: Attorney General, LGC Speaker, and Former PPT Dwarven Dragon on August 21, 2015, 12:54:09 PM
Hillary has fallen under 270 EV's on the official Atlas polling map!
Title: Re: 2016 Official Polling Map Thread
Post by: Amenhotep Bakari-Sellers on August 21, 2015, 01:04:40 PM
Nate Silver says 272, is CLINTON's best route, and it is still is. It is gonna be a close election.
Title: Re: 2016 Official Polling Map Thread
Post by: #TheShadowyAbyss on August 21, 2015, 01:10:28 PM
What is this? I don't even.... my brain hurts....
Title: Re: 2016 Official Polling Map Thread
Post by: Senator Cris on August 21, 2015, 02:12:52 PM
If you want to do all of these jokes, please do that in another thread.
Title: Re: 2016 Official Polling Map Thread
Post by: JonathanSwift on August 21, 2015, 02:17:46 PM
Guys, The Young Turks did a nationwide, 50 state poll of this election, with Sanders in green as the third party candidate.
()
I think these guys over-sampled Republicans in Vermont, Sanders i probably ahead.
I also "unskewed" the polls and it looks like Michigan is LEAN Clinton. Just LEAN, the college campuses will turn out for Sanders and make it close.
()
I think these guys over-sampled Republicans in Vermont, Sanders i probably ahead.
I also "unskewed" the polls and it looks like Michigan is LEAN Clinton. Just LEAN, the college campuses will turn out for Sanders and make it close.
Junk poll! There is no possible scenario under which Clinton wins Colorado.
Title: Re: 2016 Official Polling Map Thread
Post by: Attorney General, LGC Speaker, and Former PPT Dwarven Dragon on August 24, 2015, 02:39:20 PM
Back on topic, pbrower is also refusing to include the Mitchell poll of Michigan.
This is really getting annoying.
This is really getting annoying.
Title: Re: 2016 Official Polling Map Thread
Post by: Attorney General, LGC Speaker, and Former PPT Dwarven Dragon on August 24, 2015, 03:00:19 PM
So, have the Utah polls been released?
Yes:
Hillary: 54%
Kasich: 29%
Hillary: 54%
Carson: 27%
Hillary: 66%
Bush: 20%
Hillary: 67%
Rubio: 20%
Hillary: 71%
Walker: 18%
Hillary: 80%
Trump: 13%
Title: Re: 2016 Official Polling Map Thread
Post by: JonathanSwift on August 24, 2015, 03:03:20 PM
So, have the Utah polls been released?
Yes:
Hillary: 54%
Kasich: 29%
Hillary: 54%
Carson: 27%
Hillary: 66%
Bush: 20%
Hillary: 67%
Rubio: 20%
Hillary: 71%
Walker: 18%
Hillary: 80%
Trump: 13%
RIP GOP
Title: Re: 2016 Official Polling Map Thread
Post by: MT Treasurer on August 24, 2015, 03:10:41 PM
MS/VT/NM/FL-Gravis:
Mississippi
Clinton: 85% (Hillary leads 100-0 among women)
Bush: 3%
Other/Undecided: 12%
Vermont
Bush: 26%
Clinton: 12%
Sanders (WRITE-IN): 62%
New Mexico
Bush: 62%
Clinton: 32%
Other/Undecided: 6%
Florida
Bush: 44%
Clinton: 46%
Other/Undecided: 10%
The FL crosstabs are interesting:
White women: 75/16 Clinton
White men: 66/28 Bush
Hispanics: 94/5 Bush
NY transplants: 74/20 Clinton
Moderate suburbanites: 60/35 Clinton
Dixiecrats: 80/12 Clinton
Seniors: 46/44 Clinton
Obama voters: 46/42 Bush
Romney voters: 48/40 Clinton
Hmm, there is no Republican path to the presidency that doesn't include Florida and Mississippi. Getting ugly for the GOP. A 2016 electorate basically ensures a Clinton win.
Hillary Clinton vs. Jeb Bush
(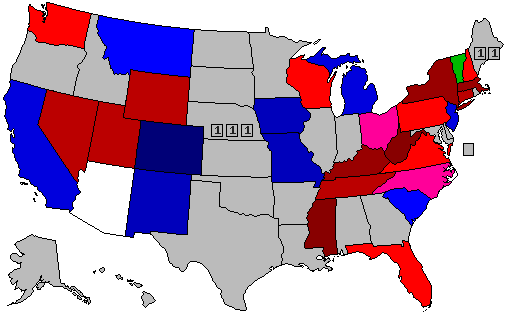 )
)
---
Someone needs to poll SC it seems. There is no way Bush is ahead in the state.
Mississippi
Clinton: 85% (Hillary leads 100-0 among women)
Bush: 3%
Other/Undecided: 12%
Vermont
Bush: 26%
Clinton: 12%
Sanders (WRITE-IN): 62%
New Mexico
Bush: 62%
Clinton: 32%
Other/Undecided: 6%
Florida
Bush: 44%
Clinton: 46%
Other/Undecided: 10%
The FL crosstabs are interesting:
White women: 75/16 Clinton
White men: 66/28 Bush
Hispanics: 94/5 Bush
NY transplants: 74/20 Clinton
Moderate suburbanites: 60/35 Clinton
Dixiecrats: 80/12 Clinton
Seniors: 46/44 Clinton
Obama voters: 46/42 Bush
Romney voters: 48/40 Clinton
Hmm, there is no Republican path to the presidency that doesn't include Florida and Mississippi. Getting ugly for the GOP. A 2016 electorate basically ensures a Clinton win.
Hillary Clinton vs. Jeb Bush
(
---
Someone needs to poll SC it seems. There is no way Bush is ahead in the state.
Title: Re: 2016 Official Polling Map Thread
Post by: Attorney General, LGC Speaker, and Former PPT Dwarven Dragon on August 24, 2015, 03:37:35 PM
Bush leading in Illinois and New York. A major realignment election is coming:
Illinois:
Bush: 51%
Clinton: 42%
New York:
Bush: 49%
Clinton: 42%
(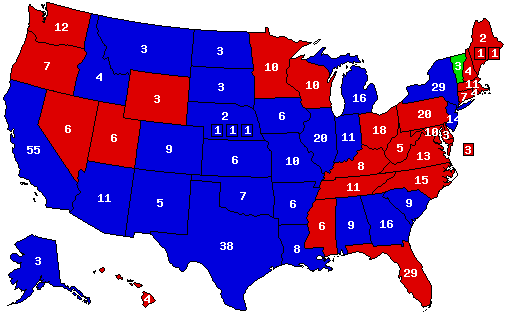 )
)
306-229 Bush Victory
Illinois:
Bush: 51%
Clinton: 42%
New York:
Bush: 49%
Clinton: 42%
(
306-229 Bush Victory
Title: Re: 2016 Official Polling Map Thread
Post by: JonathanSwift on August 24, 2015, 03:54:00 PM
New Ozark Herald poll coming in; Hillary dominating.
Arkansas
Bush: 0%
Clinton: 100%
Missouri
Bush: 9%
Clinton: 87%
Hillary Clinton vs. Jeb Bush
(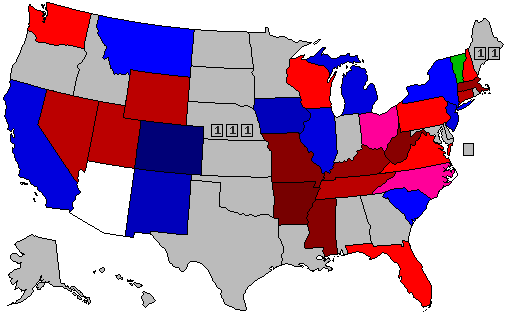 )
)
Arkansas
Bush: 0%
Clinton: 100%
Missouri
Bush: 9%
Clinton: 87%
Hillary Clinton vs. Jeb Bush
(
Title: Re: 2016 Official Polling Map Thread
Post by: JonathanSwift on August 24, 2015, 04:17:17 PM
LOL, I like how y'all are trying to hide the fact that Hillary leads in Texas.
Oh, I must have overlooked that one. Would you mind posting it?
Title: Re: 2016 Official Polling Map Thread
Post by: JonathanSwift on August 24, 2015, 09:50:40 PM
Quite interesting to see Cruz underperforming Rubio and Lincoln in his own home state. Anyway, Dixie Outfitters just released their long-awaited comprehensive Georgia poll.
Bush: 2%
Clinton: 94%
Other/Undecided: 4%
Carson: 7%
Clinton: 90%
Other/Undecided: 3%
Christie: 1%
Clinton: 97%
Other/Undecided: 2%
Clinton: 89%
Cruz: 8%
Other/Undecided: 3%
Clinton: 91%
Fiorina: 3%
Other/Undecided: 6%
Clinton: 90%
Gilmore: 2%
Other/Undecided: 8%
Clinton: 93%
Graham: 2%
Other/Undecided: 5%
Clinton: 78%
Huckabee: 21%
Other/Undecided: 1%
Clinton: 93%
Jindal: 3%
Other/Undecided: 4%
Clinton: 92%
Kasich: 4%
Other/Undecided: 4%
Clinton: 99%
Pataki: 0%
Other/Undecided: 1%
Clinton: 98%
Paul: 1%
Other/Undecided: 1%
Clinton: 92%
Perry: 5%
Other/Undecided: 3%
Clinton: 88%
Rubio: 8%
Other/Undecided: 4%
Clinton: 89%
Santorum: 5%
Other/Undecided: 6%
Clinton: 83%
Trump: 10%
Other/Undecided: 7%
Clinton: 94%
Walker: 3%
Other/Undecided: 3%
It looks like Hilldawg is inevitable even here :'(
Hillary Clinton vs. Jeb Bush
(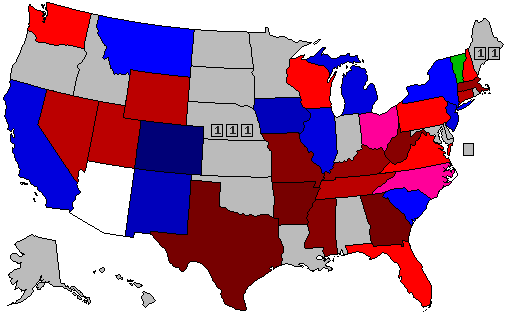 )
)
Bush: 2%
Clinton: 94%
Other/Undecided: 4%
Carson: 7%
Clinton: 90%
Other/Undecided: 3%
Christie: 1%
Clinton: 97%
Other/Undecided: 2%
Clinton: 89%
Cruz: 8%
Other/Undecided: 3%
Clinton: 91%
Fiorina: 3%
Other/Undecided: 6%
Clinton: 90%
Gilmore: 2%
Other/Undecided: 8%
Clinton: 93%
Graham: 2%
Other/Undecided: 5%
Clinton: 78%
Huckabee: 21%
Other/Undecided: 1%
Clinton: 93%
Jindal: 3%
Other/Undecided: 4%
Clinton: 92%
Kasich: 4%
Other/Undecided: 4%
Clinton: 99%
Pataki: 0%
Other/Undecided: 1%
Clinton: 98%
Paul: 1%
Other/Undecided: 1%
Clinton: 92%
Perry: 5%
Other/Undecided: 3%
Clinton: 88%
Rubio: 8%
Other/Undecided: 4%
Clinton: 89%
Santorum: 5%
Other/Undecided: 6%
Clinton: 83%
Trump: 10%
Other/Undecided: 7%
Clinton: 94%
Walker: 3%
Other/Undecided: 3%
It looks like Hilldawg is inevitable even here :'(
Hillary Clinton vs. Jeb Bush
(
Title: Re: 2016 Official Polling Map Thread
Post by: pbrower2a on August 25, 2015, 05:33:25 AM
Mitchell and Epic/MRA polls have a tradition of being extremely R-favoring. See also Susquehanna polling of Pennsylvania. Pollsters who do one state and look like outliers are suspect.
We now see a sorting-out of Republican candidates even when it is comparatively cheap to stay in nominal contention. For now, "Establishment" Republicans like Bush, Christie, and Walker seem on the fade.
...I am surprised that people see less problem with my slowness to add Donald Trump to the maps. Who am I to drop? One of the biggest fund-raisers for Scott Walker has apparently talked of defecting to Trump.
Title: Re: 2016 Official Polling Map Thread
Post by: Senator Cris on August 25, 2015, 05:40:30 AM
I think that pbrower should include that poll, but I absolutely don't tolerate all these jokes on this thread. This thread is a serious thread. I'm ok with all criticism, but if you want to do all of these jokes, please do that in ANOTHER THREAD.
Title: Re: 2016 Official Polling Map Thread
Post by: pbrower2a on August 25, 2015, 04:15:21 PM
Close, except with Trump:
Clinton 45
Trump 32
Clinton 42
Bush 41
Clinton 42
Walker 38
Clinton 41
Rubio 40
http://www.roanoke.edu/Documents/rcpoll/RCPoll.Politics%20Aug%202015.Topline.pdf
Hillary Clinton vs. Jeb Bush
( )
)
Hillary Clinton vs. Mike Huckabee
()
Hillary Clinton vs. Rand Paul
()
Hillary Clinton vs. Marco Rubio
(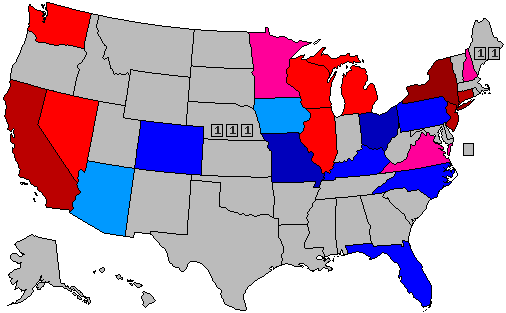 )
)
Hillary Clinton vs. Scott Walker
(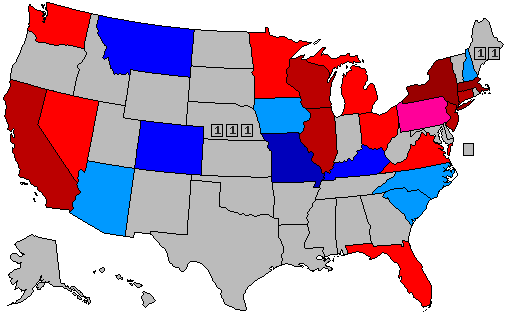 )
)
30% -- lead with 40-49% but a margin of 3% or less
40% -- lead with 40-49% but a margin of 4% or more
60% -- lead with 50-54%
70% -- lead with 55-59%
90% -- lead with 60% or more
Clinton 45
Trump 32
Clinton 42
Bush 41
Clinton 42
Walker 38
Clinton 41
Rubio 40
http://www.roanoke.edu/Documents/rcpoll/RCPoll.Politics%20Aug%202015.Topline.pdf
Hillary Clinton vs. Jeb Bush
(
Hillary Clinton vs. Mike Huckabee
(
Hillary Clinton vs. Rand Paul
(
Hillary Clinton vs. Marco Rubio
(
Hillary Clinton vs. Scott Walker
(
30% -- lead with 40-49% but a margin of 3% or less
40% -- lead with 40-49% but a margin of 4% or more
60% -- lead with 50-54%
70% -- lead with 55-59%
90% -- lead with 60% or more
Title: Re: 2016 Official Polling Map Thread
Post by: pbrower2a on August 25, 2015, 04:18:50 PM
Virginia -- Close, except with Trump:
Clinton 45
Trump 32
Clinton 42
Bush 41
Clinton 42
Walker 38
Clinton 41
Rubio 40
http://www.roanoke.edu/Documents/rcpoll/RCPoll.Politics%20Aug%202015.Topline.pdf
Hillary Clinton vs. Jeb Bush
()
Hillary Clinton vs. Mike Huckabee
()
Hillary Clinton vs. Rand Paul
()
Hillary Clinton vs. Marco Rubio
()
Hillary Clinton vs. Scott Walker
()
30% -- lead with 40-49% but a margin of 3% or less
40% -- lead with 40-49% but a margin of 4% or more
60% -- lead with 50-54%
70% -- lead with 55-59%
90% -- lead with 60% or more
Clinton 45
Trump 32
Clinton 42
Bush 41
Clinton 42
Walker 38
Clinton 41
Rubio 40
http://www.roanoke.edu/Documents/rcpoll/RCPoll.Politics%20Aug%202015.Topline.pdf
Hillary Clinton vs. Jeb Bush
(
Hillary Clinton vs. Mike Huckabee
(
Hillary Clinton vs. Rand Paul
(
Hillary Clinton vs. Marco Rubio
(
Hillary Clinton vs. Scott Walker
(
30% -- lead with 40-49% but a margin of 3% or less
40% -- lead with 40-49% but a margin of 4% or more
60% -- lead with 50-54%
70% -- lead with 55-59%
90% -- lead with 60% or more
Title: Re: 2016 Official Polling Map Thread
Post by: pbrower2a on August 25, 2015, 04:23:45 PM
Why not Mitchell in Michigan?
There are huge differences by age:
While Rubio leads by 21% with 18-39 year olds, Bush is only up 1% and Trump
trails by 20%.
However, with 40-49 year olds, Trump leads Clinton by 12%, Rubio by 9%, while
Bush trails by 16%.
All three Republicans are strong with 50-59 year olds. Rubio and Trump are up
by 27% and Bush by 21%.
All three trail with 60-69 year olds. Trump is down by 21%, Rubio by 9% and
Bush by 8%.
All three GOP candidates are behind with 60-69 year olds. Again, Trump is
behind by a bigger margin, 15%, while Bush trails by 6% and Rubio by just 2%.
Want to buy a used car from these folks?
Why not Epic/MRA in Michigan?
2012 electorate:
39% Moderate
35% Conservative
26% Liberal
40% Democrat
30% Republican
30% Independent
2016 (according to EpicMRA) electorate:
33% Moderate (- 6% compared to 2012)
37% Conservative (+ 2%)
21% Liberal (- 5%)
9% Undecided
42% Democrat (+ 2%)
37% Republican (+ 7%)
15% Independent (- 15% !)
6% Undecided
Is there any reason to believe that Michigan is getting an infusion of 'conservative' voters or is hemorrhaging 'liberal' voters?
If the demographics make no sense, then the poll is junk.
Title: Re: 2016 Official Polling Map Thread
Post by: JonathanSwift on August 25, 2015, 05:20:37 PM
SC polls been released yet?
Swamp Fox Poll
Bush: 7%
Clinton: 89%
Other/Undecided: 4%
Clinton: 77%
Graham: 18%
Other/Undecided: 5%
Clinton: 82%
Rubio: 14%
Other/Undecided: 4%
Clinton: 80%
Trump: 16%
Other/Undecided: 4%
Clinton: 83%
Walker: 12%
Other/Undecided: 5%
Hillary Clinton vs. Jeb Bush
(
Title: Re: 2016 Official Polling Map Thread
Post by: MT Treasurer on August 25, 2015, 07:42:59 PM
FL - White Appalachian:
Clinton: 55%
Bush: 44%
Other/Undecided: 1%
Clinton leads 62-38 among White women.
Minnesota - BRTD polls
Clinton: 40%
Bush: 47%
Other/Undecided: 13%
Oregon - Mark Halperin University
Clinton: 31%
Bush: 31%
Sanders (WRITE-IN): 32%
Undecided/Other: 6%
Hillary Clinton vs. Jeb Bush
(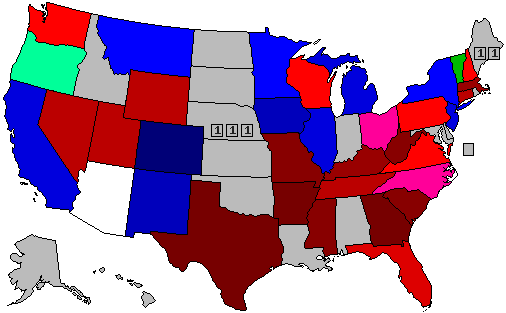 )
)
Clinton: 55%
Bush: 44%
Other/Undecided: 1%
Clinton leads 62-38 among White women.
Minnesota - BRTD polls
Clinton: 40%
Bush: 47%
Other/Undecided: 13%
Oregon - Mark Halperin University
Clinton: 31%
Bush: 31%
Sanders (WRITE-IN): 32%
Undecided/Other: 6%
Hillary Clinton vs. Jeb Bush
(
Title: Re: 2016 Official Polling Map Thread
Post by: JonathanSwift on August 25, 2015, 07:59:59 PM
New Daily Scarecrow poll shows Hillary making massive inroads on the Plains.
Kansas
Bush: 32%
Clinton: 60%
Other/Undecided: 8%
Nebraska
Bush: 35%
Clinton: 58%
Other/Undecided: 7%
North Dakota
Bush: 42%
Clinton: 48%
Other/Undecided: 10%
Oklahoma
Bush: 24%
Clinton: 69%
Other/Undecided: 7%
South Dakota
Bush: 45%
Clinton: 49%
Other/Undecided: 6%
Hillary Clinton vs. Jeb Bush
(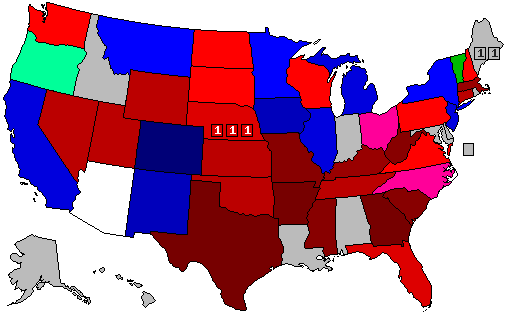 )
)
Things are getting U-G-L-Y for the GOP, folks. If Hillary has states like Kansas and Nebraska firmly in her column, there simply is no path to the White House for the Party of Lincoln.
Kansas
Bush: 32%
Clinton: 60%
Other/Undecided: 8%
Nebraska
Bush: 35%
Clinton: 58%
Other/Undecided: 7%
North Dakota
Bush: 42%
Clinton: 48%
Other/Undecided: 10%
Oklahoma
Bush: 24%
Clinton: 69%
Other/Undecided: 7%
South Dakota
Bush: 45%
Clinton: 49%
Other/Undecided: 6%
Hillary Clinton vs. Jeb Bush
(
Things are getting U-G-L-Y for the GOP, folks. If Hillary has states like Kansas and Nebraska firmly in her column, there simply is no path to the White House for the Party of Lincoln.
Title: Re: 2016 Official Polling Map Thread
Post by: Attorney General, LGC Speaker, and Former PPT Dwarven Dragon on August 25, 2015, 08:16:13 PM
I think that pbrower should include that poll, but I absolutely don't tolerate all these jokes on this thread. This thread is a serious thread. I'm ok with all criticism, but if you want to do all of these jokes, please do that in ANOTHER THREAD.
I know I joined in on this at first, but this is really getting ridiculous now. I have to agree with Cris here.
Title: Re: 2016 Official Polling Map Thread
Post by: Attorney General, LGC Speaker, and Former PPT Dwarven Dragon on August 25, 2015, 10:06:18 PM
Again, this thread is even more ridiculous. What's the point of having an "official" polling map thread that excludes most of the polls showing the Democratic candidate behind?
Well, who would you suggest to lead it instead of pbrower?
(No, I don't have the time. I've got 2 timelines, the 1972 election game, and my 16 college credits creating plenty of actual work.)
Title: Re: 2016 Official Polling Map Thread
Post by: Senator Cris on August 26, 2015, 03:45:04 AM
Again, this thread is even more ridiculous. What's the point of having an "official" polling map thread that excludes most of the polls showing the Democratic candidate behind?
Title: Re: 2016 Official Polling Map Thread
Post by: pbrower2a on August 26, 2015, 06:34:15 AM
Again, this thread is even more ridiculous. What's the point of having an "official" polling map thread that excludes most of the polls showing the Democratic candidate behind?
I have seen junk polls, most of which come from advocacy groups. Polls gotten by biased organizations (labor unions, ethnic advocacy groups, and trade associations) are worthless unless they fill in for a state not already polled. Some polls just have incredible demographics that could only distort the results.
Title: Re: 2016 Official Polling Map Thread
Post by: pbrower2a on August 26, 2015, 09:45:13 AM
Could we please have the pure nonsense of non-existent polls and maps derived from those deleted?
Title: Re: 2016 Official Polling Map Thread
Post by: pbrower2a on August 26, 2015, 02:48:11 PM
New Hampshire, PPP:
Kasich/Clinton: 43/41
Clinton/Trump: 46/44
Clinton/Fiorina: 45/42
Clinton/Paul: 47/37 (lol)
Clinton/Cruz: 49/38
Clinton/Huckabee: 49/36
Clinton/Bush: 46/39
Clinton/Christie: 46/38
Clinton/Rubio: 47/39
Clinton/Walker: 47/39
Clinton/Carson: 48/40
Sanders/Bush: 46/38
Sanders/Walker: 47/39
Sanders/Trump: 50/41
Sanders/Rubio: 48/35
Clinton/Trump/Bush: 43/28/22
http://www.publicpolicypolling.com/main/2015/08/ayottehassan-a-toss-up-clintonsanders-generally-lead-gop-field.html
Hillary Clinton vs. Jeb Bush
It looks really good for Hillary Clinton against just about any Republican in New Hampshire. But Bernie Sanders seems to have caught up with Hillary Clinton in New Hampshire. Republicans seem to have practically no chance of winning New Hampshire.
Hillary Clinton vs. Jeb Bush
(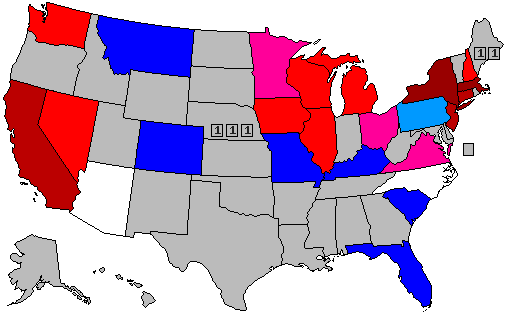 )
)
Hillary Clinton vs. Mike Huckabee
( )
)
Hillary Clinton vs. Rand Paul
( )
)
Hillary Clinton vs. Marco Rubio
( )
)
Hillary Clinton vs. Scott Walker
(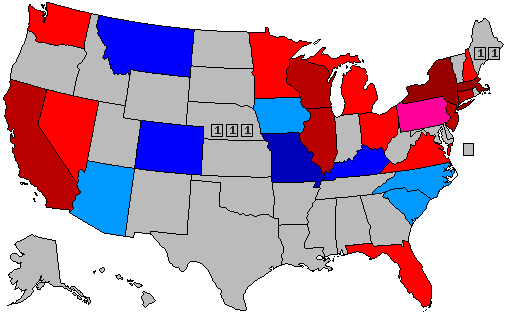 )
)
30% -- lead with 40-49% but a margin of 3% or less
40% -- lead with 40-49% but a margin of 4% or more
60% -- lead with 50-54%
70% -- lead with 55-59%
90% -- lead with 60% or more
...I will soon need to dump one of the assumed Republican candidates so that I can map the results for contests between Hillary Clinton and Donald Trump.
Kasich/Clinton: 43/41
Clinton/Trump: 46/44
Clinton/Fiorina: 45/42
Clinton/Paul: 47/37 (lol)
Clinton/Cruz: 49/38
Clinton/Huckabee: 49/36
Clinton/Bush: 46/39
Clinton/Christie: 46/38
Clinton/Rubio: 47/39
Clinton/Walker: 47/39
Clinton/Carson: 48/40
Sanders/Bush: 46/38
Sanders/Walker: 47/39
Sanders/Trump: 50/41
Sanders/Rubio: 48/35
Clinton/Trump/Bush: 43/28/22
http://www.publicpolicypolling.com/main/2015/08/ayottehassan-a-toss-up-clintonsanders-generally-lead-gop-field.html
Hillary Clinton vs. Jeb Bush
It looks really good for Hillary Clinton against just about any Republican in New Hampshire. But Bernie Sanders seems to have caught up with Hillary Clinton in New Hampshire. Republicans seem to have practically no chance of winning New Hampshire.
Hillary Clinton vs. Jeb Bush
(
Hillary Clinton vs. Mike Huckabee
(
Hillary Clinton vs. Rand Paul
(
Hillary Clinton vs. Marco Rubio
(
Hillary Clinton vs. Scott Walker
(
30% -- lead with 40-49% but a margin of 3% or less
40% -- lead with 40-49% but a margin of 4% or more
60% -- lead with 50-54%
70% -- lead with 55-59%
90% -- lead with 60% or more
...I will soon need to dump one of the assumed Republican candidates so that I can map the results for contests between Hillary Clinton and Donald Trump.
Title: Re: 2016 Official Polling Map Thread
Post by: Attorney General, LGC Speaker, and Former PPT Dwarven Dragon on August 26, 2015, 03:28:01 PM
Drop Huckabee and add in Trump
Title: Re: 2016 Official Polling Map Thread
Post by: JonathanSwift on August 26, 2015, 03:31:24 PM
Drop Huckabee and add in Trump
Title: Re: 2016 Official Polling Map Thread
Post by: Crumpets on August 26, 2015, 03:33:38 PM
Drop Huckabee and add in Trump
Title: Re: 2016 Official Polling Map Thread
Post by: WVdemocrat on August 26, 2015, 03:59:09 PM
It's time to stop treating Trump like a joke. Replace Huckabee with him.
Title: Re: 2016 Official Polling Map Thread
Post by: JonathanSwift on August 26, 2015, 04:13:42 PM
Drop Huckabee and add in Trump
Kasich's chances are vastly overrated on this forum, and I don't think there's been much head-to-head polling involving him anyway. I'd suggest Cruz rather than Kasich as Paul's replacement.
Title: Re: 2016 Official Polling Map Thread
Post by: pbrower2a on August 27, 2015, 09:00:01 AM
Quinnipiac, nationwide poll.
Clinton 42%
Bush 40%
Clinton 44%
Rubio 43%
Clinton 45%
Trump 41%
Biden 45%
Bush 39%
Biden 44%
Rubio 41%
Biden 48%
Trump 40%
Sanders 43%
Bush 49%
Sanders 40%
Rubio 41%
Sanders 44%
Trump 41%
Clinton 40%
Bush 24%
Trump 24%
http://www.quinnipiac.edu/news-and-events/quinnipiac-university-poll/national/release-detail?ReleaseID=2274
........................
If the matter of the 'private server' has been shown to be either insignificant, innocent, or "no-harm, no-foul", then the nationwide map will soon go much more supportive of the prospect of a Democratic victory in 2016. What may be less clear now is who the Democratic nominee will be.
That was all that the Republicans had on Hillary Clinton. It's hard to see that subject imploding so fast -- but just look at the PPP poll of Mew Hampshire and contrast that to the fairly-recent PPP poll of Minnesota. Minnesota is much more D than New Hampshire.
Q just showed a national poll in which Hillary Clinton is doing far better than she did recently in such swing states as Florida, Iowa, Ohio, Pennsylvania, and Virginia. Q may have been showing a temporary trend based upon something that could go either way.
I think that we are going to see the map of electoral projections going much more Atlas Red than it has been recently. Projections of Ohio and Pennsylvania going for any Republican nominee for President or Minnesota shaky are unlikely to stick in reality. Florida will become a contested state again.
Is Q a bad pollster? Maybe not. It may have accurately shown how Americans saw Hillary Clinton when they had cause to doubt her integrity and competence. Change that circumstanxces, and Q polls change.
Title: Re: 2016 Official Polling Map Thread
Post by: pbrower2a on August 27, 2015, 09:13:41 AM
Before I dump one of the 'alleged likely' GOP front-runners for Trump, I can still show a map involving Donald Trump. I am tempted more to dump Rand Paul or Scott Walker than Huckabee.
Huckabee at the least is a good regional candidate -- well, better than Lindsey Graham, isn't he?
Blank map so that I can backtrack:
Hillary Clinton vs. Donald Trump
( )
)
Huckabee at the least is a good regional candidate -- well, better than Lindsey Graham, isn't he?
Blank map so that I can backtrack:
Hillary Clinton vs. Donald Trump
(
Title: Re: 2016 Official Polling Map Thread
Post by: pbrower2a on August 27, 2015, 10:07:27 AM
Wisconsin -- Marquette University Law School:
Clinton 51
Trump 35
http://www.wisn.com/politics/marquette-poll-shows-walker-still-leading-gop-field-in-wisconsin/34824926
New Hampshire, PPP
Clinton/Trump: 46/44
http://www.publicpolicypolling.com/main/2015/08/ayottehassan-a-toss-up-clintonsanders-generally-lead-gop-field.html
Michigan, EpicMRA
Trump 42
Clinton 44
https://lintvwood.files.wordpress.com/2015/08/epic-mra-august-2015-survey.pdf
(not using, for reasons shown elsewhere)
Clinton 39
Trump 40 (!!!)
http://www.realclearpolitics.com/docs/2016/Mitchell_Poll_MI_Press_Release_8-20-15_Rubio_Prez_Final.pdf
Not usable because nobody cracks '40'
Quinnipiac, FL/OH/PA
FL -- Trump: 43% -- Clinton: 41%
OH -- Clinton: 43% -- Trump: 38%
PA -- Clinton: 45% -- Trump: 40%
http://www.quinnipiac.edu/news-and-events/quinnipiac-university-poll/2016-presidential-swing-state-polls/release-detail?ReleaseID=2271
Virginia, Roanoake University:
Clinton 45
Trump 32
http://www.roanoke.edu/Documents/rcpoll/RCPoll.Politics%20Aug%202015.Topline.pdf
PPP, North Carolina
Trump (R)........................... 45%
Clinton (D)......................... 42%
http://www.publicpolicypolling.com/main/2015/08/trump-grows-lead-in-nc-gop-leads-most-match-ups.html
Iowa, PPP:
"Donald Trump ... trail(s) by 3 at 43/40"
http://www.publicpolicypolling.com/main/2015/08/general-election-tight-in-iowa.html
Minnesota, PPP:
Clinton: 44% -- Trump: 39%
http://www.publicpolicypolling.com/pdf/2015/PPP_Release_MN_80415.pdf
Michigan, PPP (from June!)
Clinton (D)................ 49%
Trump (R)................. 39%
Nevada, PPP:
Clinton (D) 48%
Trump (R) 42%
http://origin.ralstonreports.com/blog/democratic-poll-shows-nevada-senate-race-dead-heat-hillary-state
(Warning -- PPP, but commissioned by a Democratic group) faute a mieux
Hillary Clinton vs. Donald Trump
(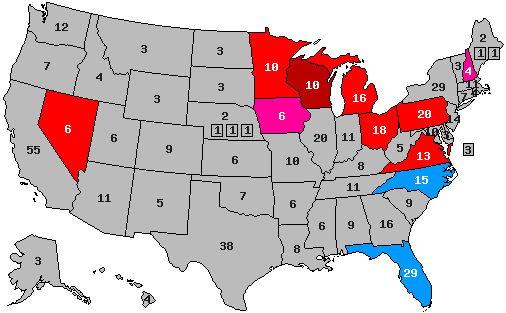 )
)
Clinton 51
Trump 35
http://www.wisn.com/politics/marquette-poll-shows-walker-still-leading-gop-field-in-wisconsin/34824926
New Hampshire, PPP
Clinton/Trump: 46/44
http://www.publicpolicypolling.com/main/2015/08/ayottehassan-a-toss-up-clintonsanders-generally-lead-gop-field.html
Michigan, EpicMRA
Trump 42
Clinton 44
https://lintvwood.files.wordpress.com/2015/08/epic-mra-august-2015-survey.pdf
(not using, for reasons shown elsewhere)
Clinton 39
Trump 40 (!!!)
http://www.realclearpolitics.com/docs/2016/Mitchell_Poll_MI_Press_Release_8-20-15_Rubio_Prez_Final.pdf
Not usable because nobody cracks '40'
Quinnipiac, FL/OH/PA
FL -- Trump: 43% -- Clinton: 41%
OH -- Clinton: 43% -- Trump: 38%
PA -- Clinton: 45% -- Trump: 40%
http://www.quinnipiac.edu/news-and-events/quinnipiac-university-poll/2016-presidential-swing-state-polls/release-detail?ReleaseID=2271
Virginia, Roanoake University:
Clinton 45
Trump 32
http://www.roanoke.edu/Documents/rcpoll/RCPoll.Politics%20Aug%202015.Topline.pdf
PPP, North Carolina
Trump (R)........................... 45%
Clinton (D)......................... 42%
http://www.publicpolicypolling.com/main/2015/08/trump-grows-lead-in-nc-gop-leads-most-match-ups.html
Iowa, PPP:
"Donald Trump ... trail(s) by 3 at 43/40"
http://www.publicpolicypolling.com/main/2015/08/general-election-tight-in-iowa.html
Minnesota, PPP:
Clinton: 44% -- Trump: 39%
http://www.publicpolicypolling.com/pdf/2015/PPP_Release_MN_80415.pdf
Michigan, PPP (from June!)
Clinton (D)................ 49%
Trump (R)................. 39%
Nevada, PPP:
Clinton (D) 48%
Trump (R) 42%
http://origin.ralstonreports.com/blog/democratic-poll-shows-nevada-senate-race-dead-heat-hillary-state
(Warning -- PPP, but commissioned by a Democratic group) faute a mieux
Hillary Clinton vs. Donald Trump
(
Title: Re: 2016 Official Polling Map Thread
Post by: Senator Cris on August 27, 2015, 10:09:25 AM
Clinton 39
Trump 40 (!!!)
http://www.realclearpolitics.com/docs/2016/Mitchell_Poll_MI_Press_Release_8-20-15_Rubio_Prez_Final.pdf
Not usable because nobody cracks '40'
Trump 40 (!!!)
http://www.realclearpolitics.com/docs/2016/Mitchell_Poll_MI_Press_Release_8-20-15_Rubio_Prez_Final.pdf
Not usable because nobody cracks '40'
In that poll, Trump cracks 40, so it's usable. ;)
Title: Re: 2016 Official Polling Map Thread
Post by: pbrower2a on August 27, 2015, 10:20:29 AM
Clinton 39
Trump 40 (!!!)
http://www.realclearpolitics.com/docs/2016/Mitchell_Poll_MI_Press_Release_8-20-15_Rubio_Prez_Final.pdf
Not usable because nobody cracks '40'
Trump 40 (!!!)
http://www.realclearpolitics.com/docs/2016/Mitchell_Poll_MI_Press_Release_8-20-15_Rubio_Prez_Final.pdf
Not usable because nobody cracks '40'
In that poll, Trump cracks 40, so it's usable. ;)
21% undecided?
A few years ago I saw a poll in which Obama led in Tennessee with something like a 39-37 margin... and he ended up losing by 57-41 in Tennessee.
10% undecided? OK. I have to take some risks. 21% undecided? Worthless even if valid.
Title: Re: 2016 Official Polling Map Thread
Post by: pbrower2a on August 27, 2015, 10:34:32 AM
I have started a new thread without the joke polls... you know, the ones saying that Clinton wins Utah or every Republican beats her in Massachusetts.
https://uselectionatlas.org/FORUM/index.php?topic=218213.0
https://uselectionatlas.org/FORUM/index.php?topic=218213.0