Title: Turnout as a percentage of the total Mid-2012 population
Post by: Tender Branson on December 26, 2012, 04:39:22 AM
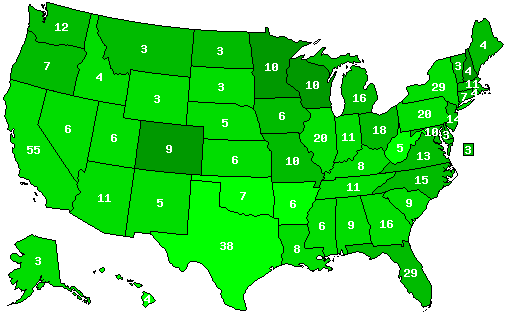
Here's the chart I made (will create another one when the Mid-2012 voting age population is released by the Census Bureau in late January):
()
()
Title: Re: Turnout as a percentage of the total Mid-2012 population
Post by: Tender Branson on December 27, 2012, 11:39:19 AM
Once the Mid-2012 state estimates are out for the voting-age crowd (18+), I will then use the American Community Survey 2011 data for 18+ citizenship in each state and also the American Community Survey 2010 data and project the non-citizen population aged 18+ to Mid-2012, to get a better turnout picture. Of course waiting for the ACS 2012 data to be released would be better, but that won't happen until next October or November.
Title: Re: Turnout as a percentage of the total Mid-2012 population
Post by: Tender Branson on December 27, 2012, 11:51:56 AM
I can already estimate that the Mid-2012 VAP was about 76.5% of the total population of 313.914.000, because the Mid-2010 VAP was 76.03% and the Mid-2011 VAP was 76.27%.
This means that on July 1, 2012 about 240.144.000 people were aged 18+
According to the ACS 2011, about 8.5% of 18+ people were non-citizens, down from 8.6% in the ACS 2010. So, it's likely that there were about 8.4% non-citizens in Mid-2012 among the 18+ people.
240.144.000 x 0.916 = 219.972.000 VAP who were also citizens
Of course the numbers would be higher using Nov. 6 numbers instead of July 1, 2012 numbers.
Also, overseas voters are outweighing imprisoned people, upping the number of eligible voters.
So, it can be said that the 2012 turnout was ca. 58% US-wide on November 6.
Title: Re: Turnout as a percentage of the total Mid-2012 population
Post by: BaldEagle1991 on December 27, 2012, 12:53:38 PM
Why does a lot of the red states tend to have lower turnouts?
Title: Re: Turnout as a percentage of the total Mid-2012 population
Post by: Tender Branson on December 28, 2012, 01:18:03 AM
Why does a lot of the red states tend to have lower turnouts?
The chart above is not reflecting actual turnout, only turnout as a %age of the total population.
A lot of "red states" like UT and TX have a very young population (in the case of UT about 1/3 of the population is younger than 18) and also have a high non-citizen population.
Therefore their turnout is much higher when this is factored in.
On the other hand, states like VT, where the population is rather old and "American", will fall back in the ranking when the VEP is considered.
Title: Re: Turnout as a percentage of the total Mid-2012 population
Post by: Tender Branson on January 01, 2013, 06:05:11 AM
The Mid-2012 VAP (voting-age-population) estimates will be released by the Census Bureau on Thursday already:
http://www.calendarwiz.com/calendars/day.php?month=1&day=3&year=2013&crd=cens1sample&
So, we'll have more accurate turnout figures then, when I calculate the rates for every state.
http://www.calendarwiz.com/calendars/day.php?month=1&day=3&year=2013&crd=cens1sample&
So, we'll have more accurate turnout figures then, when I calculate the rates for every state.
Title: Final turnout in the 2012 election was 58.5%
Post by: Tender Branson on January 01, 2013, 06:39:01 AM
Here's a more accurate turnout calculation for the US:
The November 6 population in the US was 314.775.000 (I calculated this using the monthly population estimates from Nov. 1 and Dec. 1)
On November 6, about 76.6% of the US population was older than 18 (calculated by using the Mid-2011 numbers (76.27%) and the Mid-2010 numbers (76.03%) and projecting it to Nov. 6)
On November 6, about 8.4 to 8.5% of the voting-age-population was non-citizen, according to the American Community Surveys 2010 and 2011.
...
So: 314.775.000 x 0,766 = 241.118.000 VAP x 0,9155 = 220.744.000 VEP
220.744.000 / 129.133.000 = 58.5% total turnout
...
Of course, we would also have to factor in people in prison and on parole who cannot vote and overseas Americans who are eligible, but nobody actually knows how many there are, because the statistics are either outdated or just not available.
Title: Re: Turnout as a percentage of the total Mid-2012 population
Post by: Antonio the Sixth on January 01, 2013, 07:50:32 AM
So is that higher or lower than 2004, after all?
Title: Re: Turnout as a percentage of the total Mid-2012 population
Post by: Negusa Nagast 🚀 on January 01, 2013, 08:19:45 AM
So is that higher or lower than 2004, after all?
Down. 2004 was 60.1%. 2008 was 61.6%
Title: Re: Turnout as a percentage of the total Mid-2012 population
Post by: Tender Branson on January 01, 2013, 08:37:22 AM
So is that higher or lower than 2004, after all?
Using the intercensal age estimates and the 2000 Census data on citizenship, as well as the 2005 and 2008/2009 American Community Survey Data for Citizenship, and projecting them to early November of each election year, the results are:
2000 VAP: 210.626.000 -> 18+ non-citizens: 7.70% -> VEP: 194.408.000 -> Turnout: 54.22%
2004 VAP: 220.338.000 -> 18+ non-citizens: 8.40% -> VEP: 201.830.000 -> Turnout: 60.59%
2008 VAP: 230.879.000 -> 18+ non-citizens: 8.40% -> VEP: 211.485.000 -> Turnout: 62.09%
2012 VAP: 241.118.000 -> 18+ non-citizens: 8.40% -> VEP: 220.864.000 -> Turnout: 58.47%
http://www.census.gov/popest/data/intercensal/national/nat2010.html
Important notes: The 2000 Census showed that 7.6% of 18+ Americans were non-citizens, the 2005 ACS (the first one) showed 8.5% and the 2008 and 2009 ACS showed 8.4% each. The 2010 ACS showed 8.6% and the 2011 ACS showed 8.5%, so we can assume that the 2012 ACS will show 8.4% non-citizens.
I used the Wikipedia election totals for the 2000, 2004, 2008 and 2012 election results.
Title: Re: Turnout as a percentage of the total Mid-2012 population
Post by: Antonio the Sixth on January 01, 2013, 08:53:06 AM
So is that higher or lower than 2004, after all?
Down. 2004 was 60.1%. 2008 was 61.6%
DAMN!! That means Dubya slightly beat Obama in terms of % of VEP, with 30.49% against 30.06%... :(
Title: Re: Turnout as a percentage of the total Mid-2012 population
Post by: minionofmidas on January 01, 2013, 09:04:13 AM
That much lower!? Color me surprised.
Title: Re: Turnout as a percentage of the total Mid-2012 population
Post by: Filuwaúrdjan on January 01, 2013, 11:30:31 AM
Immigrants and poor whites as the least likely to be engaged in the political process. Shocking.
Title: Re: Turnout as a percentage of the total Mid-2012 population
Post by: memphis on January 01, 2013, 01:02:56 PM
That much lower!? Color me surprised.
Also, per USAToday
Alabama 57.6%
Alaska 58.1%
Arizona 51.4%
Arkansas 49.5%
California 55.3%
Colorado* 70.7%
Connecticut 61.2%
Delaware 61.1%
District of Columbia 63.3%
Florida* 62.6%
Georgia 56.8%
Hawaii 44.1%
Idaho 57.6%
Illinois 59.0%
Indiana 55.0%
Iowa* 69.9%
Kansas 56.9%
Kentucky 54.7%
Louisiana 59.7%
Maine 67.7%
Maryland 66.1%
Massachusetts 67.4%
Michigan 64.7%
Minnesota 75.0%
Mississippi 58.4%
Missouri 60.9%
Montana 62.1%
Nebraska 59.7%
Nevada* 54.3%
New Hampshire* 69.6%
New Jersey 61.2%
New Mexico 53.6%
New York 50.1%
North Carolina* 64.1%
North Dakota 61.8%
Ohio* 64.5%
Oklahoma 48.6%
Oregon 63.2%
Pennsylvania* 59.3%
Rhode Island 58.1%
South Carolina 55.9%
South Dakota 59.4%
Tennessee 51.4%
Texas 49.0%
Utah 55.3%
Vermont 60.3%
Virginia* 66.0%
Washington 64.3%
West Virginia 45.7%
Wisconsin* 71.7%
Wyoming 57.3%
* denotes swing states.
Swing state turnout 64.2%
Non-swing state turnout 56.8%
Cite: http://www.usatoday.com/story/news/politics/2012/12/23/voter-turnout-swing-states/1787693/
Title: Re: Turnout as a percentage of the total Mid-2012 population
Post by: Tender Branson on January 01, 2013, 01:59:10 PM
Wait for my numbers that I will calculate on Thursday, when the CB will release the voting-age-population for 2012.
They will be more accurate and up-to-date than the numbers above from the USAToday.
They will be more accurate and up-to-date than the numbers above from the USAToday.
Title: Re: Turnout as a percentage of the total Mid-2012 population
Post by: Antonio the Sixth on January 01, 2013, 03:45:53 PM
That much lower!? Color me surprised.
I don't think the high turnout in 2004 and 2008 was caused by a "crisis" situation. 1980 didn't have a very high turnout, after all. What happened these two years is that a side (the GOP in 2004, Dems in 2008) did a great job at turning out their base. And, considering the situation, the still pretty good 2012 turnout is because Obama's GOTV machine still does a good job. If there is anything we can learn for the last few things, is that campaigns, when they put a little efforts in it, can and do manage to increase turnout. What happened in the 80s and 90s is that nobody bothered about turning out voters.
Hopefully politicians (dems in particular, since their base is naturally less prone to voting) will learn the lesson and keep on with GOTV efforts.
Title: Re: Turnout as a percentage of the total Mid-2012 population
Post by: memphis on January 01, 2013, 06:20:45 PM
That much lower!? Color me surprised.
I don't think the high turnout in 2004 and 2008 was caused by a "crisis" situation. 1980 didn't have a very high turnout, after all. What happened these two years is that a side (the GOP in 2004, Dems in 2008) did a great job at turning out their base. And, considering the situation, the still pretty good 2012 turnout is because Obama's GOTV machine still does a good job. If there is anything we can learn for the last few things, is that campaigns, when they put a little efforts in it, can and do manage to increase turnout. What happened in the 80s and 90s is that nobody bothered about turning out voters.
Hopefully politicians (dems in particular, since their base is naturally less prone to voting) will learn the lesson and keep on with GOTV efforts.
Title: Re: Turnout as a percentage of the total Mid-2012 population
Post by: Antonio the Sixth on January 02, 2013, 06:51:36 AM
That much lower!? Color me surprised.
I don't think the high turnout in 2004 and 2008 was caused by a "crisis" situation. 1980 didn't have a very high turnout, after all. What happened these two years is that a side (the GOP in 2004, Dems in 2008) did a great job at turning out their base. And, considering the situation, the still pretty good 2012 turnout is because Obama's GOTV machine still does a good job. If there is anything we can learn for the last few things, is that campaigns, when they put a little efforts in it, can and do manage to increase turnout. What happened in the 80s and 90s is that nobody bothered about turning out voters.
Hopefully politicians (dems in particular, since their base is naturally less prone to voting) will learn the lesson and keep on with GOTV efforts.
I still don't think that "crisis" provides any explanation. There are plenty of other dynamics that explain turnout evolution much better.
Title: Re: Turnout as a percentage of the total Mid-2012 population
Post by: Tender Branson on January 03, 2013, 01:51:39 PM
Today, the Census Bureau has released the 18+ population for all states on July 1, 2012:
United States: 313.914.040 - 240.185.952 - 76.5%
http://www.census.gov/popest/data/state/asrh/2012/files/SCPRC-EST2012-18+POP-RES.csv
Exactly the same percentage I estimated a few days ago, but just with slightly different total numbers:
United States: 313.914.040 - 240.185.952 - 76.5%
http://www.census.gov/popest/data/state/asrh/2012/files/SCPRC-EST2012-18+POP-RES.csv
Exactly the same percentage I estimated a few days ago, but just with slightly different total numbers:
I can already estimate that the Mid-2012 VAP was about 76.5% of the total population of 313.914.000, because the Mid-2010 VAP was 76.03% and the Mid-2011 VAP was 76.27%.
This means that on July 1, 2012 about 240.144.000 people were aged 18+
This means that on July 1, 2012 about 240.144.000 people were aged 18+
Title: Re: Turnout as a percentage of the total Mid-2012 population
Post by: Tender Branson on January 03, 2013, 01:55:36 PM
With the 18+ figures out for every state, I will now first calculate the turnout as a percentage of the VAP, using these new numbers.
Then I will calculate the VEP (using the 18+ non-citizen data for each state from the 2011 American Community Survey) to get an even better turnout picture for every state.
Then I will calculate the VEP (using the 18+ non-citizen data for each state from the 2011 American Community Survey) to get an even better turnout picture for every state.
Title: Re: Turnout as a percentage of the total Mid-2012 population
Post by: Tender Branson on January 03, 2013, 02:40:41 PM
With the 18+ figures out for every state, I will now first calculate the turnout as a percentage of the VAP, using these new numbers.
This is the chart (green = swing states):
()
Title: Re: Turnout as a percentage of the Mid-2012 VEP
Post by: Tender Branson on January 03, 2013, 03:14:31 PM
Then I will calculate the VEP (using the 18+ non-citizen data for each state from the 2011 American Community Survey) to get an even better turnout picture for every state.
(right click with your mouse to get bigger picture)
()
Title: Re: Turnout as a percentage of the total Mid-2012 population
Post by: Tender Branson on January 03, 2013, 03:21:47 PM
The Excel formula for calculating the VEP for each state is pretty cool too:
Quote
=((($C3))-(($C3)*($G3/100)))
Title: Re: Turnout as a percentage of the total Mid-2012 population
Post by: Tender Branson on January 03, 2013, 03:56:21 PM
Turnout map:
( )
)
(
Title: Re: Turnout as a percentage of the total Mid-2012 population
Post by: greenforest32 on January 03, 2013, 04:13:29 PM
Good stuff.
It would be nice if the focus was made on the voting base being eligible (and the should be eligible) voters instead of just registered voters. So many people are overlooked when that's the perspective. Classic casual (http://www.urbandictionary.com/define.php?term=casual) reporting on registered voters:
http://www.kgw.com/news/Oregon-voter-turnout--177709741.html
http://mynorthwest.com/11/2145928/Voter-turnout-in-Washington-was-largest-in-nation
Also wish there was a reliable, up-to-date, source of data by state for 18+ citizens made ineligible via things like felony disenfranchisement (Florida (http://www.motherjones.com/mojo/2012/11/swing-states-florida-virginia-felon-disenfranchisement) is a big one with that) so we can get an even more accurate snapshot.
It would be nice if the focus was made on the voting base being eligible (and the should be eligible) voters instead of just registered voters. So many people are overlooked when that's the perspective. Classic casual (http://www.urbandictionary.com/define.php?term=casual) reporting on registered voters:
http://www.kgw.com/news/Oregon-voter-turnout--177709741.html
Quote
SALEM -- Oregon voters filled out their ballots in high numbers for the 2012 election, reaching 81 percent as of Tuesday morning.
The Secretary of State's office was reporting 81 percent voter turnout with 1,791,339 ballots returned and more still coming Tuesday.
The Secretary of State's office was reporting 81 percent voter turnout with 1,791,339 ballots returned and more still coming Tuesday.
http://mynorthwest.com/11/2145928/Voter-turnout-in-Washington-was-largest-in-nation
Quote
Secretary of State Sam Reed certified the election results on Wednesday, and also shared an impressive number.
Voter turnout in Washington reached 81 percent -- the highest voter turnout nationwide.
Reed said they're still working on the final numbers, but he wanted to congratulate the people of the state of Washington.
Voter turnout in Washington reached 81 percent -- the highest voter turnout nationwide.
Reed said they're still working on the final numbers, but he wanted to congratulate the people of the state of Washington.
Also wish there was a reliable, up-to-date, source of data by state for 18+ citizens made ineligible via things like felony disenfranchisement (Florida (http://www.motherjones.com/mojo/2012/11/swing-states-florida-virginia-felon-disenfranchisement) is a big one with that) so we can get an even more accurate snapshot.
Title: Re: Turnout as a percentage of the total Mid-2012 population
Post by: Antonio the Sixth on January 03, 2013, 04:33:00 PM
Colorado really stands out. Pretty interesting map anyways.