Title: Census population estimates 2011-2019
Post by: krazen1211 on December 20, 2012, 10:34:54 AM
Edit: This thread has been assembled from the separate discussions on official census estimates released this decade. muon2
http://www.census.gov/newsroom/releases/archives/population/cb12-250.html
The 10 Fastest-Growing States from July 1, 2011, to July 1, 2012
Percent Change
1. North Dakota 2.17
2. District of Columbia 2.15
3. Texas 1.67
4. Wyoming 1.60
5. Utah 1.45
6. Nevada 1.43
7. Colorado 1.39
8. Arizona 1.33
9. Florida 1.23
10. South Dakota 1.19
Title: Re: Census population estimates 2011-2019
Post by: minionofmidas on December 20, 2012, 10:35:25 AM
http://www.census.gov/newsroom/releases/archives/population/cb12-250.html
The 10 Fastest-Growing States from July 1, 2011, to July 1, 2012
Percent Change
1. North Dakota 2.17
2. District of Columbia 2.15
The 10 Fastest-Growing States from July 1, 2011, to July 1, 2012
Percent Change
1. North Dakota 2.17
2. District of Columbia 2.15
Title: Re: Census population estimates 2011-2019
Post by: krazen1211 on December 20, 2012, 10:38:59 AM
Based on jimtrex's post I don't see how Arizona gains a seat. Colorado might.
At a guess:
RI: -1
CA: 1
CO: 1
FL: 1
IL: -1
MI: -1
MN: -1
NY: -1
NC: 1
OH: -1
PA: -1
TX: 3
VA: 1
WV: -1
Alabama and Oregon appear to be competing for that last seat.
At a guess:
RI: -1
CA: 1
CO: 1
FL: 1
IL: -1
MI: -1
MN: -1
NY: -1
NC: 1
OH: -1
PA: -1
TX: 3
VA: 1
WV: -1
Alabama and Oregon appear to be competing for that last seat.
Title: Re: Census population estimates 2011-2019
Post by: Skill and Chance on December 20, 2012, 05:05:42 PM
So, thinking about this in partisan terms:
RI: -1D
CA: +1D (new majority Hispanic seat)
CO: +1D
FL: Probably +1D (a court would require an additional Hispanic district under FDF)
IL: Probably -1R (although a court would draw -1D due to Chicago population loss)
MI: -1D (although in court at least 2 seats would flip from R+ to D+)
MN: -1R or -1Peterson
NY: Fair Fight or -1R
NC: +1R (will need to make McIntyre's seat permanently D for it to work, though)
OH: -1R
PA: Are they crazy enough to try -1D? Probably a Fair Fight otherwise
TX: +2R +1D (or +3R if VRA doesn't apply to redistricting after next year)
VA: +1D
WV: -1R (don't think Rahall is still in WV-03 in 2020)
Title: Re: Census population estimates 2011-2019
Post by: krazen1211 on December 20, 2012, 06:37:15 PM
So, thinking about this in partisan terms:
RI: -1D
CA: +1D (new majority Hispanic seat)
CO: +1D
FL: Probably +1D (a court would require an additional Hispanic district under FDF)
IL: Probably -1R (although a court would draw -1D due to Chicago population loss)
MI: -1D (although in court at least 2 seats would flip from R+ to D+)
MN: -1R or -1Peterson
NY: Fair Fight or -1R
NC: +1R (will need to make McIntyre's seat permanently D for it to work, though)
OH: -1R
PA: Are they crazy enough to try -1D? Probably a Fair Fight otherwise
TX: +2R +1D (or +3R if VRA doesn't apply to redistricting after next year)
VA: +1D
WV: -1R (don't think Rahall is still in WV-03 in 2020)
RI: -1D
CA: +1D (new majority Hispanic seat)
CO: +1D
FL: Probably +1D (a court would require an additional Hispanic district under FDF)
IL: Probably -1R (although a court would draw -1D due to Chicago population loss)
MI: -1D (although in court at least 2 seats would flip from R+ to D+)
MN: -1R or -1Peterson
NY: Fair Fight or -1R
NC: +1R (will need to make McIntyre's seat permanently D for it to work, though)
OH: -1R
PA: Are they crazy enough to try -1D? Probably a Fair Fight otherwise
TX: +2R +1D (or +3R if VRA doesn't apply to redistricting after next year)
VA: +1D
WV: -1R (don't think Rahall is still in WV-03 in 2020)
Colorado I think ends up 6D 2R if they are drawing a partisan map. Otherwise Coffman gets a safe seat in Douglas County.
Florida has no place to put a new Hispanic seat. They just put one in Orlando after putting one last decade in Miami, and the Miami districts already extend into other counties. It's more likely to be R leaning in the Gulf Coast and they'll split off the Keys; however Garcia might get a packed seat if he survives the decade.
Title: Re: Census population estimates 2011-2019
Post by: jimrtex on December 20, 2012, 06:41:04 PM
If the apportionment were based on 2012 estimates, with continuous redistribution such as is done in Australia, North Carolina would have gained its 14th seat and Minnesota would have lost its 8th.
Projecting the 2010 (Census)-2012(July 2012 estimate) forward:
2013: No change.
2014: Texas (37+), Michigan (13-)
2015: Virginia (12+) Pennsylvania (17-)
2016: Texas (38+) Rhode Island (1-)
2017: Florida (28+) Illinois (17-)
2018: Colorado (8+) Ohio (15-)
2019: No change.
2020: California (54+). Texas (39+), New York (26-), West Virginia (2-)
Projections assume annual compounding, and project to July 1, except in 2020 which is to April 1. Overseas population is ignored. In 2020, the last seats between California, Texas, and New York are very close with only 2 of 3 winning out. So New York might keep a seat, at the expense of California or Texas not gaining.
The era of favorable rounding seems to be ending. Imagine you had 5 states that were entitled to n.4 seats, where n is some integer (eg. 7.4, 3.4, 10.4, 9.4, 13.4). Collectively, they would be entitled to 2 more seats than the closest number of seats. So even though they aren't entitled to it based on their individual entitlement, two of them would gain the extra seat. This process favors larger states since their deficit is spread over more representatives. If California is short 50,000 people that is less than 1,000 per representative. If Montana is short 50,000 people, that is 50,000 per district.
On the other hand, if you had 5 states that were entitled to n.6 seats where n is some integer (eg 7.6, 3.6, 10.6, 9.6, 13.6). Collectively they would be entitled to 2 less seats than the closest number of seats. When this happens, larger states are disfavored, since their surplus can be spread over more districts.
The fractions are probably close to normally distributed over [0,1). But 50 states is a fairly small sample, and in the last two censuses, there has a somewhat large number of states with fractions just below 1/2 and relatively few just above 1/2. In 2010, California, Florida, Minnesota, Texas, and Washington benefited.
If we continue the projection forward:
2021: No change.
2022: No change.
2023: Texas (40+), Alabama (6-)
2024: No change.
2025: Arizona (10+), Michigan (12-)
2026: Texas (41+), Florida (29+), Illinois (16-), Pennsylvania (16-)
2027: California (55+), Georgia (15+), Wisconsin (7-), Ohio (14-)
2028: No change.
2029: Texas (42+), California (54-)
2030: Utah (5+), Indiana (8-)
In 2027, California would get a favorable rounding, but would lose it as Texas surged past. Under the current apportionment scheme, states can gain population share, but lose representation share.
If Rhode Island continues to lose population, it will have less population than Montana by 2020, and Montana is not going to be gaining a representative, so Rhode Island is almost certain to lose. West Virginia should be very close to losing its 3rd seat. Nebraska is growing only slightly than the country as a whole, and has just passed West Virginia in population, so it is safe at 3 for a while On the other hand, Idaho has slowed a lot. Previously it appeared that all 3 states would be around the 2.5 level in 2020, but Nebraska and Idaho now appear to be ready to keep their representation.
Alabama appears to be the next small state to lose a representative, and it could be this decade, if states like Arizona, Florida, and Nevada recover some of their past growth.
Oregon remains just short of a 6th representative, and by 2020 could have districts with 830,000 persons.
At the current rate, North Dakota gains its 2nd representative back in 2051. Does Bismarck go in the east or west?
Title: Re: Census population estimates 2011-2019
Post by: muon2 on December 20, 2012, 08:44:54 PM
Here's my annual projection from the new estimates. I used the July 2012 estimates and the April 2010 Census base to get an annual growth rate. This correctly accounts for the 2 and a quarter year period between the Census and the estimate. I then applied the annual growth rate to the 2010 reapportionment population to get the 2020 projection. This accounts for the extra overseas population used in reapportionment but not for redistricting. Ten years is a long stretch for a simple model like this, but here are the projected changes.
CA +1
CO +1
FL +1
IL -1
MI -1
MN -1
NY -1
NC +1
OH -1
PA -1
RI -1
TX +3
VA +1
WV -1
None of these have changed since the 2011 estimates were released last year. There is some shuffling in the bubble seats. The bubble seats in this projection are based on the last five awarded and the next five in line.
The last five awarded are VA-12, CO-8, AL-7, TX-39, and CA-54 (#435).
The next five in line are NY-27, WV-3, OR-6, MN-8, AZ-10.
Title: Re: Census population estimates 2011-2019
Post by: jimrtex on December 20, 2012, 10:05:34 PM
Fractional apportionment for 2010, and projected for 2020. It can't be assumed that fractions round, since they are not rounded independently, and fixed size of House, even if projection was correct.
Change is accurate (subject to projection error). Thus, Alabama is almost certain to lose 7th by 2030, even it saves it this time. Number of seats, takes into account rank order of quotients, so is really a guess for states near 0.500 fractions. Margin is the change needed, to cause the loss of a seat (or another seat), while increase is the projected population increase. So if Alabama were to only gain 173K (only 18K less than projected 191K) it would in even more danger. But if it bumped its growth up a bit, it would be safe for now.
California's projected gain of 3.630 million only has margin of 2K for 54th seat (3.627 million would not be enough).
State 2010 2020 Change N +- Margin Increase 8-Ball.
Alabama 6.737 6.506 -0.231 7 = -18 191 Getting real close.
Alaska 1.117 1.169 0.052 1 = 271 99
Arizona 8.999 9.332 0.333 9 = 110 748 Still a possibility.
Arkansas 4.129 4.033 -0.096 4 = 351 151
California 52.369 53.356 0.987 54 +1 -2 3630 50/50.
Colorado 7.087 7.550 0.462 8 +1 -54 743 Not sure on 8th.
Connecticut 5.049 4.785 -0.263 5 = -229 73
Delaware 1.358 1.381 0.023 1 = 94 88
Florida 26.435 27.673 1.238 28 +1 -190 2399 Somewhat safe for one.
Georgia 13.627 14.055 0.429 14 = 311 1076
Hawaii 1.976 2.031 0.055 2 = 363 148
Idaho 2.260 2.270 0.010 2 = 176 129 3 not getting closer.
Illinois 18.043 17.012 -1.031 17 -1 338 200 Sure loss.
Indiana 9.128 8.791 -0.337 9 = -241 241
Iowa 4.312 4.167 -0.145 4 = 247 123
Kansas 4.042 3.949 -0.092 4 = -355 149
Kentucky 6.120 5.926 -0.194 6 = -339 185
Louisiana 6.392 6.344 -0.048 6 = 107 313 Stops the bleeding.
Maine 1.933 1.809 -0.124 2 = -251 4 Safe until 2050.
Maryland 8.131 8.215 0.084 8 = 201 510
Massachusetts 9.217 9.145 -0.073 9 = 253 449
Michigan 13.902 12.906 -0.996 13 -1 -338 -1 Sure loss.
Minnesota 7.472 7.386 -0.087 7 -1 72 343 Long shot to keep 8.
Mississippi 4.201 4.007 -0.194 4 = 371 79
Missouri 8.433 8.025 -0.408 8 = 347 148
Montana 1.478 1.472 -0.006 1 = 20 72 Will Bakken help?
Nebraska 2.615 2.606 -0.010 3 = -88 133 Safe for now.
Nevada 3.829 3.908 0.079 4 = -323 269 Not even a solid 4.
New Hampshire 1.917 1.813 -0.104 2 = -255 19 Safe until 2050.
New Jersey 12.369 11.912 -0.457 12 = -340 328
New Mexico 2.937 2.887 -0.050 3 = -307 120 Losing ground.
New York 27.244 26.427 -0.817 26 -1 1 869 50/50 on loss of seat.
North Carolina 13.413 13.759 0.346 14 +1 -227 1001 14 is in the bag.
North Dakota 1.070 1.159 0.090 1 = 279 129
Ohio 16.224 15.108 -1.116 15 -1 268 34 One is certain.
Oklahoma 5.297 5.298 0.001 5 = 144 290
Oregon 5.408 5.431 0.023 5 = 42 313 Needs to heat it up.
Pennsylvania 17.862 16.942 -0.920 17 -1 -373 274 In the bag ;)
Rhode Island 1.562 1.449 -0.112 1 -1 38 -10 Pretty much a lock.
South Carolina 6.521 6.647 0.126 7 = -126 453
South Dakota 1.249 1.280 0.031 1 = 178 89
Tennessee 8.935 8.954 0.019 9 = -366 504
Texas 35.350 38.459 3.110 39 +3 -50 4322 3rd is not in the bag.
Utah 3.917 4.198 0.281 4 = 224 430 Faster than neighbors.
Vermont 1.012 0.959 -0.053 1 = 454 1
Virginia 11.258 11.568 0.310 12 +1 -76 855 Somewhat safe.
Washington 9.466 9.834 0.368 10 = -276 801
West Virginia 2.652 2.483 -0.169 2 -1 8 11 Could still save 3rd.
Wisconsin 8.010 7.669 -0.340 8 = -146 177 OK until 2030
Wyoming 0.937 0.954 0.017 1 = 458 59
Title: Re: Census population estimates 2011-2019
Post by: Skill and Chance on December 20, 2012, 10:40:38 PM
Overall, this looks like it could be kinder to D's than the last several reapportionments, assuming that CO and VA keep voting left of the nation through 2020. And most of the Rust Belt states will have no choice but to eliminate R's. If any of OH, MI or VA are sent to court they will be D goldmines (PA less so because R's control the court).
Title: Re: Census population estimates 2011-2019
Post by: krazen1211 on December 21, 2012, 08:30:44 AM
Here's my annual projection from the new estimates. I used the July 2012 estimates and the April 2010 Census base to get an annual growth rate. This correctly accounts for the 2 and a quarter year period between the Census and the estimate. I then applied the annual growth rate to the 2010 reapportionment population to get the 2020 projection. This accounts for the extra overseas population used in reapportionment but not for redistricting. Ten years is a long stretch for a simple model like this, but here are the projected changes.
CA +1
CO +1
FL +1
IL -1
MI -1
MN -1
NY -1
NC +1
OH -1
PA -1
RI -1
TX +3
VA +1
WV -1
None of these have changed since the 2011 estimates were released last year. There is some shuffling in the bubble seats. The bubble seats in this projection are based on the last five awarded and the next five in line.
The last five awarded are VA-12, CO-8, AL-7, TX-39, and CA-54 (#435).
The next five in line are NY-27, WV-3, OR-6, MN-8, AZ-10.
CA +1
CO +1
FL +1
IL -1
MI -1
MN -1
NY -1
NC +1
OH -1
PA -1
RI -1
TX +3
VA +1
WV -1
None of these have changed since the 2011 estimates were released last year. There is some shuffling in the bubble seats. The bubble seats in this projection are based on the last five awarded and the next five in line.
The last five awarded are VA-12, CO-8, AL-7, TX-39, and CA-54 (#435).
The next five in line are NY-27, WV-3, OR-6, MN-8, AZ-10.
Yes, I did an identical calculation more or less.
Title: Re: Census population estimates 2011-2019
Post by: Linus Van Pelt on December 21, 2012, 09:03:27 PM
+8/-8 would be the lowest total change in the whole 435-seat era. Interstate migration is low by historical standards.
Title: Re: Census population estimates 2011-2019
Post by: jimrtex on December 21, 2012, 11:28:21 PM
+8/-8 would be the lowest total change in the whole 435-seat era. Interstate migration is low by historical standards.
But now, a similar number of Minnesotans would hardly be noticed, some of the former retirees are dying or moving back to live near their children, and some Arizonan's voluntarily move to Minnesota.
And overall growth rate is declining. For a state with 10 representatives to lose one, it has to grow 10% slower than the country. If the country increases 20%, the state could have a healthy 10% increase and still lose representation. If the country increases 10%, the state would have to have no growth, or could grow at 5% for 20 years.
But with the country growing at 8% rate, 5% growth results in the state losing a district every 30 years.
Title: Re: Census population estimates 2011-2019
Post by: Linus Van Pelt on December 22, 2012, 12:02:10 AM
+8/-8 would be the lowest total change in the whole 435-seat era. Interstate migration is low by historical standards.
But now, a similar number of Minnesotans would hardly be noticed, some of the former retirees are dying or moving back to live near their children, and some Arizonan's voluntarily move to Minnesota.
And overall growth rate is declining. For a state with 10 representatives to lose one, it has to grow 10% slower than the country. If the country increases 20%, the state could have a healthy 10% increase and still lose representation. If the country increases 10%, the state would have to have no growth, or could grow at 5% for 20 years.
But with the country growing at 8% rate, 5% growth results in the state losing a district every 30 years.
Yes, but in fact also the gross interstate migration rate has been undergoing a major decline. It was over 0.03 in 1990 and is now close to 0.015, and this has been a secular decline over the 20-year period, not just due to the recent recession. That decline in rate is enough to more than offset population growth, so even the gross number of interstate migrants is smaller now than in 1990.
http://www.minneapolisfed.org/research/wp/wp697.pdf
Title: Re: Census population estimates 2011-2019
Post by: Horus on December 22, 2012, 03:07:13 AM
Anyone know where I could find county by county loss/gain margins from '10 - '12?
Title: Re: Census population estimates 2011-2019
Post by: Sbane on December 22, 2012, 03:35:41 AM
Anyone know where I could find county by county loss/gain margins from '10 - '12?
I remember the census released data for change from 2010-2011. Is this going to be released at a later date?
Title: Re: Census population estimates 2011-2019
Post by: minionofmidas on December 22, 2012, 05:38:44 AM
But now, a similar number of Minnesotans would hardly be noticed, some of the former retirees are dying or moving back to live near their children, and some Arizonan's voluntarily move to Minnesota.
Title: Re: Census population estimates 2011-2019
Post by: politicallefty on December 22, 2012, 06:00:56 AM
Overall, this looks like it could be kinder to D's than the last several reapportionments, assuming that CO and VA keep voting left of the nation through 2020. And most of the Rust Belt states will have no choice but to eliminate R's. If any of OH, MI or VA are sent to court they will be D goldmines (PA less so because R's control the court).
That was one of my first thoughts as well. It's been quite some time since Democrats have had anything remotely nearing a friendly apportionment. I didn't think Colorado and Virginia were both on track to gain an additional seat this decade, as it now looks quite possible. Hopefully, California can hold on to some good sustainable growth and finally get its 54th seat. Interestingly, the CA Department of Finance underestimated population growth, which is the opposite compared to the pre-Census estimates.
While I wouldn't be sad to see West Virginia drop down to two seats, I was hoping Montana would have some nice growth to get its second seat back. Any reasonable redistricting would create divide the state East/West, which would give Democrats a huge opportunity in the Western district.
Btw, jimrtex, you didn't leave a comment on Pennsylvania, which is another certainty to lose a seat in 2020. ;)
Title: Re: Census population estimates 2011-2019
Post by: muon2 on December 22, 2012, 08:05:19 AM
Anyone know where I could find county by county loss/gain margins from '10 - '12?
I remember the census released data for change from 2010-2011. Is this going to be released at a later date?
County estimates for 2012, including change data, are scheduled for June 2013.
Title: Re: Census population estimates 2011-2019
Post by: jimrtex on December 22, 2012, 12:01:55 PM
Btw, jimrtex, you didn't leave a comment on Pennsylvania, which is another certainty to lose a seat in 2020. ;)
Title: Re: Census population estimates 2011-2019
Post by: jimrtex on December 22, 2012, 12:08:32 PM
Anyone know where I could find county by county loss/gain margins from '10 - '12?
I remember the census released data for change from 2010-2011. Is this going to be released at a later date?
Title: Re: Census population estimates 2011-2019
Post by: Linus Van Pelt on May 11, 2013, 08:26:33 PM
Yes, but in fact also the gross interstate migration rate has been undergoing a major decline. It was over 0.03 in 1990 and is now close to 0.015, and this has been a secular decline over the 20-year period, not just due to the recent recession. That decline in rate is enough to more than offset population growth, so even the gross number of interstate migrants is smaller now than in 1990.
http://www.minneapolisfed.org/research/wp/wp697.pdf
http://www.minneapolisfed.org/research/wp/wp697.pdf
Bump re the above to note an interesting new paper here (http://www.federalreserve.gov/pubs/feds/2013/201327/201327pap.pdf) by some Federal Reserve economists exploring possible reasons why the rate of migration has been declining since the 1980's. They find that the shift is not explained just by demographic changes, and explore some possible other explanations, including: that the range of industries and occupations has become more similar across metropolitan areas; that the rise of dual-career couples has made moves more difficult since both partners are unlikely to be looking for new jobs at the same time; and that the structure of work has changed in ways that disincentivize job changes. The last of these is their favored hypothesis.
Title: Re: Census population estimates 2011-2019
Post by: Benj on May 11, 2013, 10:10:33 PM
Yes, but in fact also the gross interstate migration rate has been undergoing a major decline. It was over 0.03 in 1990 and is now close to 0.015, and this has been a secular decline over the 20-year period, not just due to the recent recession. That decline in rate is enough to more than offset population growth, so even the gross number of interstate migrants is smaller now than in 1990.
http://www.minneapolisfed.org/research/wp/wp697.pdf
http://www.minneapolisfed.org/research/wp/wp697.pdf
Bump re the above to note an interesting new paper here (http://www.federalreserve.gov/pubs/feds/2013/201327/201327pap.pdf) by some Federal Reserve economists exploring possible reasons why the rate of migration has been declining since the 1980's. They find that the shift is not explained just by demographic changes, and explore some possible other explanations, including: that the range of industries and occupations has become more similar across metropolitan areas; that the rise of dual-career couples has made moves more difficult since both partners are unlikely to be looking for new jobs at the same time; and that the structure of work has changed in ways that disincentivize job changes. The last of these is their favored hypothesis.
The last sounds the least likely to me. I'm lacking any data in front of me, but there's definitely been a shift in the labor market over the past 30-40 years (somewhat longer scale, but still) from people entering the labor force at one company and working for that company for their entire lives to people changing jobs every five years or so.
Title: Re: Census population estimates 2011-2019
Post by: jimrtex on May 11, 2013, 11:39:42 PM
Bump re the above to note an interesting new paper here (http://www.federalreserve.gov/pubs/feds/2013/201327/201327pap.pdf) by some Federal Reserve economists exploring possible reasons why the rate of migration has been declining since the 1980's. They find that the shift is not explained just by demographic changes, and explore some possible other explanations, including: that the range of industries and occupations has become more similar across metropolitan areas; that the rise of dual-career couples has made moves more difficult since both partners are unlikely to be looking for new jobs at the same time; and that the structure of work has changed in ways that disincentivize job changes. The last of these is their favored hypothesis.
The last sounds the least likely to me. I'm lacking any data in front of me, but there's definitely been a shift in the labor market over the past 30-40 years (somewhat longer scale, but still) from people entering the labor force at one company and working for that company for their entire lives to people changing jobs every five years or so.
Their argument is that jobs at both the high end and low end have become more consistently common across metropolitan areas, and middle-skill jobs have decreased.
You don't move 2000 miles to switch from an east-facing cubicle to a west-facing cubicle for $100 per month. You do it for an upgrade in salary, and that is possible to do within a major metropolitan area.
Title: Re: Census population estimates 2011-2019
Post by: greenforest32 on July 25, 2013, 06:01:04 AM
I was just looking over this again and the raw numbers from 2010-2012 are interesting too.
States ranked by numerical population change from April 1, 2010 to July 1, 2012:
Also the percentage population change from April 1, 2010 to July 1, 2012 ranking:
(^ The table feature is confusing. I couldn't get it to work right like jimrtex's one above so I used separate columns.)
States ranked by numerical population change from April 1, 2010 to July 1, 2012:
| State Texas California Florida Georgia North Carolina New York Virginia Washington Arizona Colorado Maryland Tennessee Massachusetts South Carolina Utah Minnesota New Jersey Louisiana Oregon Oklahoma Pennsylvania Nevada Indiana Illinois Alabama Kentucky Wisconsin Arkansas Missouri Kansas Hawaii District of Columbia Nebraska Idaho Iowa North Dakota New Mexico Alaska South Dakota Delaware Mississippi Connecticut Montana Wyoming Ohio New Hampshire West Virginia Maine Vermont Michigan Rhode Island 50 state + DC | 2010 Pop-CEN 25,145,561 37,253,956 18,801,310 9,687,653 9,535,483 19,378,102 8,001,024 6,724,540 6,392,017 5,029,196 5,773,552 6,346,105 6,547,629 4,625,364 2,763,885 5,303,925 8,791,894 4,533,372 3,831,074 3,751,351 12,702,379 2,700,551 6,483,802 12,830,632 4,779,736 4,339,367 5,686,986 2,915,918 5,988,927 2,853,118 1,360,301 601,723 1,826,341 1,567,582 3,046,355 672,591 2,059,179 710,231 814,180 897,934 2,967,297 3,574,097 989,415 563,626 11,536,504 1,316,470 1,852,994 1,328,361 625,741 9,883,640 1,052,567 308,745,538 | 2012 Pop-EST 26,059,203 38,041,430 19,317,568 9,919,945 9,752,073 19,570,261 8,185,867 6,897,012 6,553,255 5,187,582 5,884,563 6,456,243 6,646,144 4,723,723 2,855,287 5,379,139 8,864,590 4,601,893 3,899,353 3,814,820 12,763,536 2,758,931 6,537,334 12,875,255 4,822,023 4,380,415 5,726,398 2,949,131 6,021,988 2,885,905 1,392,313 632,323 1,855,525 1,595,728 3,074,186 699,628 2,085,538 731,449 833,354 917,092 2,984,926 3,590,347 1,005,141 576,412 11,544,225 1,320,718 1,855,413 1,329,192 626,011 9,883,360 1,050,292 313,914,040 | Change # 913,642 787,474 516,258 232,292 216,590 192,159 184,843 172,472 161,238 158,386 111,011 110,138 98,515 98,359 91,402 75,214 72,696 68,521 68,279 63,469 61,157 58,380 53,532 44,623 42,287 41,048 39,412 33,213 33,061 32,787 32,012 30,600 29,184 28,146 27,831 27,037 26,359 21,218 19,174 19,158 17,629 16,250 15,726 12,786 7,721 4,248 2,419 831 270 -280 -2,275 5,168,502 | Change % 3.63% 2.11% 2.75% 2.40% 2.27% 0.99% 2.31% 2.56% 2.52% 3.15% 1.92% 1.74% 1.50% 2.13% 3.31% 1.42% 0.83% 1.51% 1.78% 1.69% 0.48% 2.16% 0.83% 0.35% 0.88% 0.95% 0.69% 1.14% 0.55% 1.15% 2.35% 5.09% 1.60% 1.80% 0.91% 4.02% 1.28% 2.99% 2.36% 2.13% 0.59% 0.45% 1.59% 2.27% 0.07% 0.32% 0.13% 0.06% 0.04% 0.00% -0.22% 1.67% |
Also the percentage population change from April 1, 2010 to July 1, 2012 ranking:
| State District of Columbia North Dakota Texas Utah Colorado Alaska Florida Washington Arizona Georgia South Dakota Hawaii Virginia North Carolina Wyoming Nevada Delaware South Carolina California Maryland Idaho Oregon Tennessee Oklahoma 50 state + DC Nebraska Montana Louisiana Massachusetts Minnesota New Mexico Kansas Arkansas New York Kentucky Iowa Alabama New Jersey Indiana Wisconsin Mississippi Missouri Pennsylvania Connecticut Illinois New Hampshire West Virginia Ohio Maine Vermont Michigan Rhode Island | Change % 5.09% 4.02% 3.63% 3.31% 3.15% 2.99% 2.75% 2.56% 2.52% 2.40% 2.36% 2.35% 2.31% 2.27% 2.27% 2.16% 2.13% 2.13% 2.11% 1.92% 1.80% 1.78% 1.74% 1.69% 1.67% 1.60% 1.59% 1.51% 1.50% 1.42% 1.28% 1.15% 1.14% 0.99% 0.95% 0.91% 0.88% 0.83% 0.83% 0.69% 0.59% 0.55% 0.48% 0.45% 0.35% 0.32% 0.13% 0.07% 0.06% 0.04% 0.00% -0.22% |
(^ The table feature is confusing. I couldn't get it to work right like jimrtex's one above so I used separate columns.)
Title: Re: Census population estimates 2011-2019
Post by: Tender Branson on November 18, 2013, 08:18:51 AM
New state population estimates will be released in ca. 1 month !
My prediction:
316.159.818
My prediction:
316.159.818
Title: Re: Census population estimates 2011-2019
Post by: Adam Griffin on November 18, 2013, 06:57:33 PM
316,211,453
Title: Re: Census population estimates 2011-2019
Post by: jimrtex on November 19, 2013, 09:49:21 AM
New state population estimates will be released in ca. 1 month !
My prediction:
316.159.818
My prediction:
316.159.818
NC+1, MN-1 remains only apportionment change, until 2014 when Texas gains from Michigan.
Title: Re: Census population estimates 2011-2019
Post by: Tender Branson on November 19, 2013, 10:40:29 AM
TX will have the largest numerical growth once again: ca. 400-450K I guess.
It's hard to say which state will have the highest % growth though: ND again ? Or DC ? Or WY ? Or UT ?
It's hard to say which state will have the highest % growth though: ND again ? Or DC ? Or WY ? Or UT ?
Title: Re: Census population estimates 2011-2019
Post by: KingSweden on November 23, 2013, 12:30:21 PM
I'd say ND, then DC, then TX, then UT, then WA, then FL. No scientific reasons, just guesses :P
I also wonder if Michigan's population decline has stopped, though I suspect Rhode Island's has not. I expect most New England states to have more or less minimal growth.
I also wonder if Michigan's population decline has stopped, though I suspect Rhode Island's has not. I expect most New England states to have more or less minimal growth.
Title: Re: Census population estimates 2011-2019
Post by: True Federalist (진정한 연방 주의자) on November 23, 2013, 01:55:23 PM
I predict that the population on July 1, 2014 will be 35,274 if one doesn't count the zombies. ;) Would zombies count as three-fifths of a person for apportionment purposes?
Title: Re: Census population estimates 2011-2019
Post by: ElectionsGuy on November 23, 2013, 11:02:45 PM
315,594,607
Title: Re: Census population estimates 2011-2019
Post by: All Along The Watchtower on November 24, 2013, 03:31:44 AM
316,667,233
Title: Re: Census population estimates 2011-2019
Post by: Mr. Morden on November 24, 2013, 04:39:12 AM
314,159,265
More or less.
Though I fear that may be an irrational answer.
More or less.
Though I fear that may be an irrational answer.
Title: Re: Census population estimates 2011-2019
Post by: Tender Branson on November 24, 2013, 06:34:35 AM
314,159,265
More or less.
Though I fear that may be an irrational answer.
More or less.
Though I fear that may be an irrational answer.
The official Mid-2012 population was already 313,914,040
http://quickfacts.census.gov/qfd/states/00000.html
You might change your prediction, because the US typically grows by 0.7% each year now.
;)
Title: Re: Census population estimates 2011-2019
Post by: Vern on November 25, 2013, 09:10:25 AM
319,030,466
Title: Re: Census population estimates 2011-2019
Post by: Tender Branson on November 28, 2013, 10:43:33 AM
1.6% growth has not happened in the US since the 1970s ...
Title: Re: Census population estimates 2011-2019
Post by: kcguy on November 28, 2013, 12:27:58 PM
314,159,265
More or less.
Though I fear that may be an irrational answer.
More or less.
Though I fear that may be an irrational answer.
It's ironic that I got your joke on a day I'm going to be eating pie.
Title: Re: Census population estimates 2011-2019
Post by: True Federalist (진정한 연방 주의자) on November 29, 2013, 12:08:00 AM
314,159,265
More or less.
Though I fear that may be an irrational answer.
More or less.
Though I fear that may be an irrational answer.
It's ironic that I got your joke on a day I'm going to be eating pie.
I had cornbread (http://people.brandeis.edu/~mob/puns.htm) today. It was good, but the pie was transcendental.
Title: Re: Census population estimates 2011-2019
Post by: hopper on November 29, 2013, 07:30:47 PM
I'd say ND, then DC, then TX, then UT, then WA, then FL. No scientific reasons, just guesses :P
I also wonder if Michigan's population decline has stopped, though I suspect Rhode Island's has not. I expect most New England states to have more or less minimal growth.
I also wonder if Michigan's population decline has stopped, though I suspect Rhode Island's has not. I expect most New England states to have more or less minimal growth.
Title: Re: Census population estimates 2011-2019
Post by: hopper on November 29, 2013, 07:39:32 PM
I'd say ND, then DC, then TX, then UT, then WA, then FL. No scientific reasons, just guesses :P
I also wonder if Michigan's population decline has stopped, though I suspect Rhode Island's has not. I expect most New England states to have more or less minimal growth.
I also wonder if Michigan's population decline has stopped, though I suspect Rhode Island's has not. I expect most New England states to have more or less minimal growth.
Other 2011-2012 Census findings:
Georgia has passed Michigan for 7th populous state.
Arizona has passed Indiana in Population growth to move up to the 14th most populous state.
Nebraska has passed West Virginia for 37th most populous state.
Might happen this decade:
Utah will pass Kansas in population growth
North Carolina might pass Michigan for 8th most populous state
Oklahoma might pass Oregon in population growth as the 26h most populous state.
Title: Re: Census population estimates 2011-2019
Post by: hopper on November 29, 2013, 08:01:53 PM
New state population estimates will be released in ca. 1 month !
My prediction:
316.159.818
My prediction:
316.159.818
NC+1, MN-1 remains only apportionment change, until 2014 when Texas gains from Michigan.
Title: Re: Census population estimates 2011-2019
Post by: JerryArkansas on November 29, 2013, 08:06:17 PM
New state population estimates will be released in ca. 1 month !
My prediction:
316.159.818
My prediction:
316.159.818
NC+1, MN-1 remains only apportionment change, until 2014 when Texas gains from Michigan.
Title: Re: Census population estimates 2011-2019
Post by: jimrtex on November 30, 2013, 11:28:49 AM
New state population estimates will be released in ca. 1 month !
My prediction:
316.159.818
My prediction:
316.159.818
NC+1, MN-1 remains only apportionment change, until 2014 when Texas gains from Michigan.
Based on the ranking:
429 GA
430 SC
431 FL
432 CA
433 WA
434 MN
435 TX
=====
436 NC
437 MO
438 NY
439 NJ
440 MT
441 LA
To keep its 8th seat, MN has to avoid being passed by two states, or alternatively pass some states ahead of it.
If you think of it as a finish of a long distance race, MN is in a pack with some fast finishers, and it just barely kept ahead of NC and TX. If the race was another 100 yards TX and NC would have caught MN. Also from 2010 to 2012, MN was 28th fastest, which is just mediocre.
Because of this cluster of fast gainers just above the threshold, and mostly slow gainers below, there have been few changes so far. TX easily went past MN into 435, and then NC gained its 14th seat and the expense of MN.
By the time the slow growing states drop down to the level of MN, faster growing states have caught up.
2014: TX gains 37th (essentially it has lapped MN), MI loses 14th.
2015: VA gains 12th, PA loses 18th.
2016: TX gains 38th, RI loses 2nd.
2017: FL gains 28th, IL loses 18th.
2018: CO gains 8th, OH loses 16th.
2020: TX gains 39th, CA gains 54th, WV loses 3rd, NY loses 27th.
By 2020, MN will not yet have caught WV and NY, and OR will have surpassed it.
Based on projecting April 2010 census to July 2012 estimate forward to April 2020, Minnesota will have grown 6.5%. But the country as a whole will have increased 7.6%. Minnesota has to keep pace with the country as a whole to keep its 8th seat.
Title: Re: Census population estimates 2011-2019
Post by: politicallefty on December 01, 2013, 08:43:25 AM
What are the current odds of California getting a 54th seat at the next Census? I know that based on its shear population, it can easily be on the cusp of losing a seat, gaining a seat, or staying steady with minimal population shifts. Obviously, I think California getting its financial situation in order can only benefit good population growth. I'm just curious to know what the trends are leading towards (beyond the vague Northeast and Midwest towards the South and West).
I'm also wondering about Oregon and it's potential sixth seat. Based on what I've seen, it seems rather surprising that CO-08 will happen before OR-06.
I'm also wondering about Oregon and it's potential sixth seat. Based on what I've seen, it seems rather surprising that CO-08 will happen before OR-06.
Title: Re: Census population estimates 2011-2019
Post by: Skill and Chance on December 01, 2013, 10:04:07 PM
New state population estimates will be released in ca. 1 month !
My prediction:
316.159.818
My prediction:
316.159.818
NC+1, MN-1 remains only apportionment change, until 2014 when Texas gains from Michigan.
Based on the ranking:
429 GA
430 SC
431 FL
432 CA
433 WA
434 MN
435 TX
=====
436 NC
437 MO
438 NY
439 NJ
440 MT
441 LA
To keep its 8th seat, MN has to avoid being passed by two states, or alternatively pass some states ahead of it.
If you think of it as a finish of a long distance race, MN is in a pack with some fast finishers, and it just barely kept ahead of NC and TX. If the race was another 100 yards TX and NC would have caught MN. Also from 2010 to 2012, MN was 28th fastest, which is just mediocre.
Because of this cluster of fast gainers just above the threshold, and mostly slow gainers below, there have been few changes so far. TX easily went past MN into 435, and then NC gained its 14th seat and the expense of MN.
By the time the slow growing states drop down to the level of MN, faster growing states have caught up.
2014: TX gains 37th (essentially it has lapped MN), MI loses 14th.
2015: VA gains 12th, PA loses 18th.
2016: TX gains 38th, RI loses 2nd.
2017: FL gains 28th, IL loses 18th.
2018: CO gains 8th, OH loses 16th.
2020: TX gains 39th, CA gains 54th, WV loses 3rd, NY loses 27th.
By 2020, MN will not yet have caught WV and NY, and OR will have surpassed it.
Based on projecting April 2010 census to July 2012 estimate forward to April 2020, Minnesota will have grown 6.5%. But the country as a whole will have increased 7.6%. Minnesota has to keep pace with the country as a whole to keep its 8th seat.
It's interesting that so many seats will come down to the wire. How much have projections changed since the 2010 census? I'm surprised to see that AZ-10 isn't even on the short list? Is AL-07 still in danger?
Title: Re: Census population estimates 2011-2019
Post by: jimrtex on December 02, 2013, 04:26:25 AM
What are the current odds of California getting a 54th seat at the next Census? I know that based on its shear population, it can easily be on the cusp of losing a seat, gaining a seat, or staying steady with minimal population shifts. Obviously, I think California getting its financial situation in order can only benefit good population growth. I'm just curious to know what the trends are leading towards (beyond the vague Northeast and Midwest towards the South and West).
I'm also wondering about Oregon and it's potential sixth seat. Based on what I've seen, it seems rather surprising that CO-08 will happen before OR-06.
I'm also wondering about Oregon and it's potential sixth seat. Based on what I've seen, it seems rather surprising that CO-08 will happen before OR-06.
The differential for Colorado is 7.2% vs Oregon at 0.6%. Colorado is making progress at 12 times the rate of Oregon. To gain a seat, you can estimate that a state will have to have a cumulative increase of 1/(N-0.5) to gain an Nth seat. So for Colorado 1/7.5 = 13.3%. So the 7.2% is about half of what it needs.
Colorado barely secured the 7th seat in 2000 (it was much closer to 6.5), it solidified its 7th seat in 2010, and by the end of the decade will be right around 7.5.
Oregon needs 1/(6-0.5) = 18.2%, but at only 0.6% faster, it takes many decades to gain a seat. A fractional apportionment would have them go from 5.408 to 5.431 from 2010 to 2020. Its close to 5.5 - but making much progress.
California needs 1/(54-0.5) = 1.9%, which is about what it is doing. It got a very lucky rounding in 2000, and a somewhat lucky rounding in 2010. It is right about increasing a whole seat, but if it doesn't get a lucky rounding, it won't actually gain.
Title: Re: Census population estimates 2011-2019
Post by: jimrtex on December 02, 2013, 11:39:07 AM
It's interesting that so many seats will come down to the wire. How much have projections changed since the 2010 census? I'm surprised to see that AZ-10 isn't even on the short list? Is AL-07 still in danger?
430. CO (8) 54 0.9%
431. FL (28) 190 0.9%
432. VA (12) 76 0.9%
433. AL (7) 18 0.4%
434. TX (39) 50 0.2%
435. CA (54) 2 0.0%
-------------------------
436. NY (26) 1 0.0%
437. WV (3) 8 0.4%
438. OR (6) 42 1.0%
439. MN (8) 72 1.3%
440. AZ (10) 110 1.5%
441. MT (2) 20 1.8%
442. CA (55) 750 1.8%
If everything else were unchanged:
For AL to lose its 7th representative, it would have to gain 18 thousand fewer persons (0.4%) less than its projected gain of 4.0%. For AZ to gain its 10th representative it would need 110 thousand more persons (1.5%) - increase its growth rate from 11.7% to 13.2%.
Since CA has about 1/8 of the USA population, it should appear about every 8th position on the list, so with 13 positions from CA 53 to CA 55, it is actually a bit sparse around the final seats.
The losses for IL (18), MI (14), OH (16), PA (18), and RI (2) are more certain (a margin of at least 2%), as are the first two gains for TX (37,38) and NC (14).
In a sense, AL is keeping its 7th seat because no one is stepping forward to take it; and NY, WV, and MN might keep their districts, or OR and AZ claim one with not a big jump.
Whenever the census bureau releases estimates, it updates older estimates. So when it releases the 2013 estimate it will also make changes to the 2012 and older estimates.
Title: Re: Census population estimates 2011-2019
Post by: Skill and Chance on December 02, 2013, 12:37:19 PM
Can most of the pre-2020 changes be considered sure things? If growth fell off so that the decade ended with projected 2019 populations instead of projected 2020 populations, we would still have the new FL, VA and CO seats and the first 2 new TX seats? In your mind are any of these in doubt?
Title: Re: Census population estimates 2011-2019
Post by: jimrtex on December 02, 2013, 08:11:37 PM
Can most of the pre-2020 changes be considered sure things? If growth fell off so that the decade ended with projected 2019 populations instead of projected 2020 populations, we would still have the new FL, VA and CO seats and the first 2 new TX seats? In your mind are any of these in doubt?
Pennsylvania is projected to increase 276,000 in the decade. But it would need to gain another 373,000 to save its 18th seat. That isn't going to happen.
If fertility rates increase, that is pretty much an across the board in all states, with some older states not getting quite the benefit since they have a smaller share of woman of child-bearing age. In Pennsylvania and West Virginia, an increase in the fertility rate, won't have as much effect on the birth rate or growth rate.
California and New York are extremely close (1 part in 20000) - so that is a coin flip even if the projections were perfect.
Title: Re: Census population estimates 2011-2019
Post by: Tender Branson on December 06, 2013, 09:56:23 AM
There's a release date now:
Dec. 30
http://www.calendarwiz.com/calendars/popup.php?op=view&id=70683196&crd=cens1sample&
Dec. 30
http://www.calendarwiz.com/calendars/popup.php?op=view&id=70683196&crd=cens1sample&
Title: Re: Census population estimates 2011-2019
Post by: Flake on December 08, 2013, 03:51:50 AM
315,816,421
Title: Re: Census population estimates 2011-2019
Post by: Tender Branson on December 28, 2013, 02:21:10 AM
The numbers are out on Monday.
A fact: Georgia will top 10 million for the first time.
A 50-50 chance: Florida will overtake New York already this year.
A possibility: North Carolina will overtake Michigan (certainly next year, if not this year).
A fact: Georgia will top 10 million for the first time.
A 50-50 chance: Florida will overtake New York already this year.
A possibility: North Carolina will overtake Michigan (certainly next year, if not this year).
Title: Re: Census population estimates 2011-2019
Post by: Tender Branson on December 28, 2013, 02:43:07 AM
My predictions for the Top 10 in terms of 01.07.2013 population:
01 - CA (38.39)
02 - TX (26.48)
03 - NY (19.65)
04 - FL (19.55)
05 - IL (12.90)
06 - PA (12.78]
07 - OH (11.55)
08 - GA (10.03)
09 - MI (9.90)
10 - NC (9.86)
01 - CA (38.39)
02 - TX (26.48)
03 - NY (19.65)
04 - FL (19.55)
05 - IL (12.90)
06 - PA (12.78]
07 - OH (11.55)
08 - GA (10.03)
09 - MI (9.90)
10 - NC (9.86)
Title: Re: Census population estimates 2011-2019
Post by: Adam Griffin on December 28, 2013, 06:33:51 AM
The numbers are out on Monday.
A fact: Georgia will top 10 million for the first time.
A fact: Georgia will top 10 million for the first time.
()
Title: Re: Census population estimates 2011-2019
Post by: ElectionsGuy on December 29, 2013, 05:25:11 PM
My guesses:
California: 38.3 million
Texas: 26.4 million
New York: 19.55 million
Florida: 19.5
Illinois: 12.9 million
Pennsylvania: 12.85 million
Ohio: 11.575 million
Georgia: 10.05 million
Michigan: 9.9 million
North Carolina: 9.875 million
New Jersey: 8.9 million
Virginia: 8.25 million
Washington: 6.95 million
Also, for racial demographics, in New Mexico, Latinos will become a majority of the state (currently 47%), and a plurality in California (currently at 38%, and whites are at 39%). They will probably become a plurality in Texas in a few years as well. And lastly, Nevada will become majority non-white in a few years.
Title: Re: Census population estimates 2011-2019
Post by: Flake on December 29, 2013, 06:48:13 PM
My predictions:
1. California: 38,375,000
2. Texas: 26,697,000
3. Florida: 19,612,000
4. New York: 19,610,000
5. Illinois: 12,844,000
6. Pennsylvania: 12,841,000
7. Ohio: 11,524,000
8. Georgia: 10,110,000
9. North Carolina: 9,857,000
10. Michigan: 9,856,000
1. California: 38,375,000
2. Texas: 26,697,000
3. Florida: 19,612,000
4. New York: 19,610,000
5. Illinois: 12,844,000
6. Pennsylvania: 12,841,000
7. Ohio: 11,524,000
8. Georgia: 10,110,000
9. North Carolina: 9,857,000
10. Michigan: 9,856,000
Title: Re: Census population estimates 2011-2019
Post by: Tender Branson on December 30, 2013, 10:05:11 AM
The numbers are out:
01 - CA (38.333)
02 - TX (26.448)
03 - NY (19.651)
04 - FL (19.553)
05 - IL (12.882)
06 - PA (12.774]
07 - OH (11.571)
08 - GA (9.992) !!!
09 - MI (9.896)
10 - NC (9.848)
GA has less than 10 Mio. ?
WTF ?
http://www.census.gov/popest/data/state/totals/2013/tables/NST-EST2013-01.xls
01 - CA (38.333)
02 - TX (26.448)
03 - NY (19.651)
04 - FL (19.553)
05 - IL (12.882)
06 - PA (12.774]
07 - OH (11.571)
08 - GA (9.992) !!!
09 - MI (9.896)
10 - NC (9.848)
GA has less than 10 Mio. ?
WTF ?
http://www.census.gov/popest/data/state/totals/2013/tables/NST-EST2013-01.xls
Title: Re: Census population estimates 2011-2019
Post by: Tender Branson on December 30, 2013, 10:06:29 AM
USA: 316.128.839
Title: Re: Census population estimates 2011-2019
Post by: Tender Branson on December 30, 2013, 10:11:19 AM
Biggest numerical gains:
TX (387.000)
CA (333.000)
FL (232.000)
NC (100.000)
CO (79.000)
GA (77.000)
WA (76.000)
AZ (76.000)
NY (75.000)
VA (74.000)
Losses:
ME (-199)
WV (-2400)
USA (2.255.000)
TX (387.000)
CA (333.000)
FL (232.000)
NC (100.000)
CO (79.000)
GA (77.000)
WA (76.000)
AZ (76.000)
NY (75.000)
VA (74.000)
Losses:
ME (-199)
WV (-2400)
USA (2.255.000)
Title: Re: Census population estimates 2011-2019
Post by: Tender Branson on December 30, 2013, 10:16:10 AM
Biggest % gains/losses (2012 -> 2013):
ND (+3.14)
DC (+2.06)
UT (+1.61)
CO (+1.52)
TX (+1.49)
NV (+1.30)
SD (+1.30)
FL (+1.20)
AZ (+1.15)
WA (+1.10)
SC (+1.09)
ME (-0.01)
WV (-0.13)
USA (0.72)
ND (+3.14)
DC (+2.06)
UT (+1.61)
CO (+1.52)
TX (+1.49)
NV (+1.30)
SD (+1.30)
FL (+1.20)
AZ (+1.15)
WA (+1.10)
SC (+1.09)
ME (-0.01)
WV (-0.13)
USA (0.72)
Title: Re: Census population estimates 2011-2019
Post by: Tender Branson on December 30, 2013, 10:20:20 AM
I nailed 5 of 10 states in my prediction and wasn't really that much off with my national prediction either ... :)
Title: Re: Census population estimates 2011-2019
Post by: ElectionsGuy on December 30, 2013, 10:23:19 AM
The numbers are out
:D
Biggest numerical gains:
TX (387.000)
CA (333.000)
FL (232.000)
NC (100.000)
CO (79.000)
GA (77.000)
WA (76.000)
AZ (76.000)
NY (75.000)
VA (74.000)
Losses:
ME (-199)
WV (-2400)
USA (2.255.000)
TX (387.000)
CA (333.000)
FL (232.000)
NC (100.000)
CO (79.000)
GA (77.000)
WA (76.000)
AZ (76.000)
NY (75.000)
VA (74.000)
Losses:
ME (-199)
WV (-2400)
USA (2.255.000)
Ouch on West Virginia, looking more and more to be 4 electoral votes. Anyways, some facts.
Florida is still behind New York, with its 19.55 million compared to NY's 19.65 million. :(
Georgia almost at 10 million, sad it didn't get past the milestone.
Looks like the trend we've been seeing all along, with the South and West growing fast and the Midwest and Northeast growing slow.
Title: Re: Census population estimates 2011-2019
Post by: Vern on December 30, 2013, 10:31:36 AM
What was the percentage growth for NC and GA?
Title: Re: Census population estimates 2011-2019
Post by: Skill and Chance on December 30, 2013, 10:35:40 AM
Does this suggest any changes in predicted apportionment for 2021? It certainly looks like CO-08 became more likely and holding WV-03 became less likely.
Title: Re: Census population estimates 2011-2019
Post by: Tender Branson on December 30, 2013, 10:44:57 AM
()
Title: Re: Census population estimates 2011-2019
Post by: muon2 on December 30, 2013, 11:11:17 AM
Here's my annual projection from the new estimates. I used the July 2013 estimates and the April 2010 Census base to get an annual growth rate. This correctly accounts for the 3 and a quarter year period between the Census and the estimate. I then applied the annual growth rate to the 2010 reapportionment population to get the 2020 projection. This accounts for the extra overseas population used in reapportionment but not for redistricting. Ten years is a long stretch for a simple model like this, but here are the projected changes.
CO +1
FL +1
IL -1
MI -1
MN -1
NC +1
OH -1
PA -1
RI -1
TX +3
VA +1
WV -1
The only change since my projections last year (https://uselectionatlas.org/FORUM/index.php?topic=166668.msg3562852#msg3562852) is that CA and NY both hold even. They continue to be the most likely to change, and there is some shifting in the other bubble seats. Perhaps the most surprising is to see MT now appear on the bubble for a second seat. The bubble seats in this projection are based on the last five awarded and the next five in line.
The last five awarded are FL-28, VA-12, AL-7, TX-39, and NY-27 (#435).
The next five in line are CA-54, MT-2, WV-3, OR-6, MN-8.
Title: Re: Census population estimates 2011-2019
Post by: krazen1211 on December 30, 2013, 11:22:27 AM
As of right now NC has taken a 14th seat from Minnesota per this link (http://www.psc.isr.umich.edu/dis/census/tools/apportionment/)
Title: Re: Census population estimates 2011-2019
Post by: muon2 on December 30, 2013, 11:29:01 AM
As of right now NC has taken a 14th seat from Minnesota per this link (http://www.psc.isr.umich.edu/dis/census/tools/apportionment/output.html)
The link gives some sort of error message for me. You may need to go back to the calculator (http://www.psc.isr.umich.edu/dis/census/tools/apportionment/) and enter new numbers. I think the result you cite comes from assuming that the apportionment is done with the 2013 estimate, though it is generally more useful to project forward to 2020 when the next reapportionment will take place.
Title: Re: Census population estimates 2011-2019
Post by: krazen1211 on December 30, 2013, 11:32:12 AM
As of right now NC has taken a 14th seat from Minnesota per this link (http://www.psc.isr.umich.edu/dis/census/tools/apportionment/output.html)
The link gives some sort of error message for me.
Hmm. Try this one. It's just an apportionment calculator.
Link (http://www.psc.isr.umich.edu/dis/census/tools/apportionment/)
I did check the apportionment both based on a hypothetical 2013 reapportionment (which results in the NC 14th seat) and exponentially multiplying out 2020 numbers, which gives you what you posted.
Title: Re: Census population estimates 2011-2019
Post by: Tender Branson on December 30, 2013, 12:26:07 PM
A couple more charts for easier viewing:
Sorted by numerical change
()
Sorted by % change
()
Sorted by numerical change
()
Sorted by % change
()
Title: Re: Census population estimates 2011-2019
Post by: True Federalist (진정한 연방 주의자) on December 30, 2013, 12:38:26 PM
Based on these estimates, if we were to reapportion today based on them the bubble seats would be:
#431 WA-10
#432 MI-14
#433 PA-18
#434 CA-53
#435 NC-14
#436 TX-37
#437 MN-8
#438 VA-12
#439 MT-2
#440 OR-6
#431 WA-10
#432 MI-14
#433 PA-18
#434 CA-53
#435 NC-14
#436 TX-37
#437 MN-8
#438 VA-12
#439 MT-2
#440 OR-6
Title: Re: Census population estimates 2011-2019
Post by: Tender Branson on December 30, 2013, 12:40:35 PM
Cumulative % change (Census 2010 -> Mid 2013):
7.6% ND
7.4% DC
5.2% TX
5.0% UT
4.8% CO
4.0% FL
3.8% SD
3.7% WA
3.7% AZ
3.5% AK
3.4% WY
Losses:
ME & RI (ME was stagnant - lost only 59 people in 3 years, RI lost 0.1%)
7.6% ND
7.4% DC
5.2% TX
5.0% UT
4.8% CO
4.0% FL
3.8% SD
3.7% WA
3.7% AZ
3.5% AK
3.4% WY
Losses:
ME & RI (ME was stagnant - lost only 59 people in 3 years, RI lost 0.1%)
Title: Re: Census population estimates 2011-2019
Post by: Tender Branson on December 30, 2013, 12:46:46 PM
Cumulative numerical change (Census 2010 -> Mid 2013):
1.303.000 TX
1.079.000 CA
752.000 FL
313.000 NC
305.000 GA
273.000 NY
259.000 VA
247.000 WA
239.000 CO
235.000 AZ
7.383.000 USA
1.303.000 TX
1.079.000 CA
752.000 FL
313.000 NC
305.000 GA
273.000 NY
259.000 VA
247.000 WA
239.000 CO
235.000 AZ
7.383.000 USA
Title: Re: Census population estimates 2011-2019
Post by: muon2 on December 30, 2013, 12:48:40 PM
A couple more charts for easier viewing:
Sorted by numerical change
()
Sorted by numerical change
()
Over 17% over the growth in the US is in TX.
Title: Re: Census population estimates 2011-2019
Post by: True Federalist (진정한 연방 주의자) on December 30, 2013, 12:50:47 PM
Also for those of you who advocate the cube root apportionment method. The 2013 estimates gives a House of 680 seats, up 5 from the 2010 census. Changes in the House from 2010 would be California gains a 83rd seat, Florida gains a 42nd seat, Georgia gains a 22nd seat, Idaho gains a 4th seat, Michigan loses its 22ns seat, Mississippi loses its 7th seat, Oregon gains its 9th seat, and Texas gains its 56th and 57th seats.
Alabama 10
Alaska 2
Arizona 14
Arkansas 6
California 83
Colorado 11
Connecticut 8
Delaware 2
Florida 42
Georgia 22
Hawaii 3
Idaho 4
Illinois 28
Indiana 14
Iowa 7
Kansas 6
Kentucky 10
Louisiana 10
Maine 3
Maryland 13
Massachusetts 14
Michigan 21
Minnesota 12
Mississippi 6
Missouri 13
Montana 2
Nebraska 4
Nevada 6
New Hampshire 3
New Jersey 19
New Mexico 5
New York 42
North Carolina 21
North Dakota 2
Ohio 25
Oklahoma 8
Oregon 9
Pennsylvania 28
Rhode Island 2
South Carolina 10
South Dakota 2
Tennessee 14
Texas 57
Utah 6
Vermont 1
Virginia 18
Washington 15
West Virginia 4
Wisconsin 12
Wyoming 1
Title: Re: Census population estimates 2011-2019
Post by: Tender Branson on December 30, 2013, 12:52:08 PM
A couple more charts for easier viewing:
Sorted by numerical change
(pic)
Sorted by numerical change
(pic)
Over 17% over the growth in the US is in TX.
Yeah, the fact that TX has a relatively high birth rate (1.5% in 2012) and a low birth rate (0.7%) is helping.
TX grew by 1.5%, of which 0.8% came from a birth surplus and 0.7% from a migration surplus.
Title: Re: Census population estimates 2011-2019
Post by: ElectionsGuy on December 30, 2013, 12:52:28 PM
2012 to 2013 growth population:
( )
)
Over average growth: 279
Under average growth: 248
On par growth: 11
(
Over average growth: 279
Under average growth: 248
On par growth: 11
Title: Re: Census population estimates 2011-2019
Post by: Tender Branson on December 30, 2013, 12:56:24 PM
Question:
What about Puerto Rico ?
Migration to the mainland ?
What about Puerto Rico ?
Migration to the mainland ?
Title: Re: Census population estimates 2011-2019
Post by: Skill and Chance on December 30, 2013, 12:57:27 PM
2012 to 2013 growth population:
()
MA really sticks out. Also MN and NM. Why would NM be lagging?
Over average growth: 279
Under average growth: 248
On par growth: 11
(
MA really sticks out. Also MN and NM. Why would NM be lagging?
Over average growth: 279
Under average growth: 248
On par growth: 11
Title: Re: Census population estimates 2011-2019
Post by: Tender Branson on December 30, 2013, 12:58:51 PM
2012 to 2013 growth population:
()
MA really sticks out. Also MN and NM. Why would NM be lagging?
Over average growth: 279
Under average growth: 248
On par growth: 11
(
MA really sticks out. Also MN and NM. Why would NM be lagging?
Over average growth: 279
Under average growth: 248
On par growth: 11
Better border enforcement (=> Mexicans staying in Mexico) ?
Title: Re: Census population estimates 2011-2019
Post by: ElectionsGuy on December 30, 2013, 01:05:07 PM
2012 to 2013 growth population:
()
MA really sticks out. Also MN and NM. Why would NM be lagging?
Over average growth: 279
Under average growth: 248
On par growth: 11
(
MA really sticks out. Also MN and NM. Why would NM be lagging?
Over average growth: 279
Under average growth: 248
On par growth: 11
Unfortunately you can't see how much specifically they grew because I was didn't feel like doing shades, but Minnesota only grew slightly larger than the national average, and overall the Twin Cities are doing good and is growing much faster in comparison to Wisconsin or Iowa. Massachusetts seems to be the one area in New England that is actually growing, its a hot spot for liberals and Boston seems to be keeping people's interest. New Mexico actually had very little growth (the fourth lowest in the nation!). I'm guessing Latinos are still building up, but people are moving out of the state. But I have no idea on that one.
Title: Re: Census population estimates 2011-2019
Post by: Tender Branson on December 30, 2013, 01:09:17 PM
Updated topic title.
Title: Re: Census population estimates 2011-2019
Post by: Gass3268 on December 30, 2013, 01:10:17 PM
Does anyone know if any states switched spots in population rankings?
Title: Re: Census population estimates 2011-2019
Post by: Tender Branson on December 30, 2013, 01:13:45 PM
Does anyone know if any states switched spots in population rankings?
UT passed KS over the last year and NE passed WV.
That's all.
Title: Re: Census population estimates 2011-2019
Post by: ElectionsGuy on December 30, 2013, 01:15:14 PM
Does anyone know if any states switched spots in population rankings?
UT passed KS over the last year and NE passed WV.
That's all.
Beat me to it.
Title: Re: Census population estimates 2011-2019
Post by: Gass3268 on December 30, 2013, 01:20:58 PM
Does anyone know if any states switched spots in population rankings?
UT passed KS over the last year and NE passed WV.
That's all.
Ah interesting, thanks! Looks like next year might have a bit more movement in the rankings.
Title: Re: Census population estimates 2011-2019
Post by: Tender Branson on December 30, 2013, 01:23:04 PM
Just checked the NM situation:
NM had a birth rate of 1.3% in 2012 and a death rate of 0.8% - a surplus of 0.5%
But the overall population growth was just 0.1%, which indicates a massive out-migration.
The Census Bureau decided to release the "components of change" separately this time, in February ... :P
NM had a birth rate of 1.3% in 2012 and a death rate of 0.8% - a surplus of 0.5%
But the overall population growth was just 0.1%, which indicates a massive out-migration.
The Census Bureau decided to release the "components of change" separately this time, in February ... :P
Title: Re: Census population estimates 2011-2019
Post by: krazen1211 on December 30, 2013, 01:28:12 PM
CO +1
FL +1
IL -1
MI -1
MN -1
NC +1
OH -1
PA -1
RI -1
TX +3
VA +1
WV -1
Sean Trende has:
2020:CO+1 seat, FL+1, MT+1 (!!), NC+1, TX+2, VA+1, IL-1, MI-1, NY-1, OH-1, PA-1, RI-1 (!!), WV-1
Title: Re: Census population estimates 2011-2019
Post by: True Federalist (진정한 연방 주의자) on December 30, 2013, 01:40:47 PM
Here's my annual projection from the new estimates. I used the July 2013 estimates and the April 2010 Census base to get an annual growth rate. This correctly accounts for the 3 and a quarter year period between the Census and the estimate. I then applied the annual growth rate to the 2010 reapportionment population to get the 2020 projection. This accounts for the extra overseas population used in reapportionment but not for redistricting. Ten years is a long stretch for a simple model like this, but here are the projected changes.
CO +1
FL +1
IL -1
MI -1
MN -1
NC +1
OH -1
PA -1
RI -1
TX +3
VA +1
WV -1
The bubble seats in this projection are based on the last five awarded and the next five in line.
The last five awarded are FL-28, VA-12, AL-7, TX-39, and NY-27 (#435).
The next five in line are CA-54, MT-2, WV-3, OR-6, MN-8.
CO +1
FL +1
IL -1
MI -1
MN -1
NC +1
OH -1
PA -1
RI -1
TX +3
VA +1
WV -1
The bubble seats in this projection are based on the last five awarded and the next five in line.
The last five awarded are FL-28, VA-12, AL-7, TX-39, and NY-27 (#435).
The next five in line are CA-54, MT-2, WV-3, OR-6, MN-8.
Using a different growth model that weighted the growth from each estimate, giving a greater weight to the estimated growth rate from 2012 to 2013 than 2011 to 2012, etc. I come up with similar values that yield the same seat changes, but a different order of the ten bubble seats.
431 FL-28
432 VA-12
433 AL-7
434 NY-27
435 TX-39
436 CA-54
437 MT-2
438 MN-8
439 OR-6
440 WV-3
BTW, krazen, why the surprise at Rhode Island losing a seat? Given these estimates, I fail to see how Rhode Island avoids losing a seat under any reasonable model of population change.
Title: Re: Census population estimates 2011-2019
Post by: krazen1211 on December 30, 2013, 02:03:42 PM
I merely cut and pasted his message. (https://twitter.com/SeanTrende)
Title: Re: Census population estimates 2011-2019
Post by: True Federalist (진정한 연방 주의자) on December 30, 2013, 02:16:02 PM
I merely cut and pasted his message. (https://twitter.com/SeanTrende)
In that case, since I don't have or want to be a twit, even tho I don't expect Sean to read this: Sean, why the surprise at Rhode Island losing a seat? Given these estimates, I fail to see how Rhode Island avoids losing a seat under any reasonable model of population change.
Title: Re: Census population estimates 2011-2019
Post by: old timey villain on December 30, 2013, 02:30:40 PM
pretty disappointed in Georgia. I was sure we would pass 10 million this year. A 77K increase is actually pretty dismal for our state as well. Even during the recession we were adding more than that yearly. What's even weirder is that the economy is really improving in Georgia. The unemployment rate is falling and the cranes are back all over Atlanta.
Title: Re: Census population estimates 2011-2019
Post by: Tender Branson on December 30, 2013, 02:36:39 PM
If Austria were a US state, where would it be in the ranking ?
12th in terms of overall population (8.502 Mio.)
11th in terms of numerical change (62.000)
Slightly above the US average in % terms (0.73%)
12th in terms of overall population (8.502 Mio.)
11th in terms of numerical change (62.000)
Slightly above the US average in % terms (0.73%)
Title: Re: Census population estimates 2011-2019
Post by: muon2 on December 30, 2013, 03:21:36 PM
CO +1
FL +1
IL -1
MI -1
MN -1
NC +1
OH -1
PA -1
RI -1
TX +3
VA +1
WV -1
Sean Trende has:
2020:CO+1 seat, FL+1, MT+1 (!!), NC+1, TX+2, VA+1, IL-1, MI-1, NY-1, OH-1, PA-1, RI-1 (!!), WV-1
His Twitter feed doesn't give any sense of the model he's using. I pulled up his RCP article (http://www.realclearpolitics.com/articles/2013/12/30/population_data_show_more_movement_south_and_west.html) to get a better idea. He uses a linear projection instead of a compounding formula which puts large high-growth states like TX at a disadvantage and partially explains why he only gets TX+2. The list quoted above is not his initial analysis, but is based on adding the growth in 2012 plus twice the growth in 2013 so it is very sensitive to fluctuations in the 2013 numbers just released. His basic linear projection gives: CO+1, FL+1, NC+1, TX+3, VA+1, IL-1, MI-1, MN-1, OH-1, PA-1, RI-1, WV-1, and is the same as the list I get.
Title: Re: Census population estimates 2011-2019
Post by: Nhoj on December 30, 2013, 03:53:55 PM
Question:
What about Puerto Rico ?
Migration to the mainland ?
What about Puerto Rico ?
Migration to the mainland ?
Title: Re: Census population estimates 2011-2019
Post by: Ban my account ffs! on December 30, 2013, 06:53:40 PM
I'm surprised Minnesota grew faster than the national average. This hasn't happened often recently at all. Hopefully it keeps up.
Title: Re: Census population estimates 2011-2019
Post by: DINGO Joe on December 30, 2013, 07:37:08 PM
When do county estimates come out?
Title: Re: Census population estimates 2011-2019
Post by: Nhoj on December 30, 2013, 07:45:55 PM
When do county estimates come out?
Title: Re: Census population estimates 2011-2019
Post by: danny on December 30, 2013, 10:46:20 PM
If Austria were a US state, where would it be in the ranking ?
12th in terms of overall population (8.502 Mio.)
11th in terms of numerical change (62.000)
Slightly above the US average in % terms (0.73%)
12th in terms of overall population (8.502 Mio.)
11th in terms of numerical change (62.000)
Slightly above the US average in % terms (0.73%)
I'll do the same for Israel:
13th in terms of overall population (8.132 Mio.)
4th in terms of numerical change (147,000)
3rd in terms of percent change (1.8%)
Title: Re: Census population estimates 2011-2019
Post by: Tender Branson on December 31, 2013, 02:59:56 AM
If Austria were a US state, where would it be in the ranking ?
12th in terms of overall population (8.502 Mio.)
11th in terms of numerical change (62.000)
Slightly above the US average in % terms (0.73%)
12th in terms of overall population (8.502 Mio.)
11th in terms of numerical change (62.000)
Slightly above the US average in % terms (0.73%)
I'll do the same for Israel:
13th in terms of overall population (8.132 Mio.)
4th in terms of numerical change (147,000)
3rd in terms of percent change (1.8%)
Israel is similar to Utah, having the same high birth rate and low death rate. Plus a good share of immigration as well.
Here, births and deaths are about equal - with all of the growth coming from foreigners moving in.
Title: Re: Census population estimates 2011-2019
Post by: Tender Branson on December 31, 2013, 06:51:53 AM
Here's my comprehensive chart, based on the Census Bureau file (http://www.census.gov/popest/data/state/totals/2013/index.html) yesterday (click right for big version):
()
I added the 4 "change" columns to the CB file and formatted it slightly.
In previous years, the CB always added the "change" columns themselves.
This year, they were extremely lazy ... ;)
()
I added the 4 "change" columns to the CB file and formatted it slightly.
In previous years, the CB always added the "change" columns themselves.
This year, they were extremely lazy ... ;)
Title: Re: Census population estimates 2011-2019
Post by: ElectionsGuy on January 04, 2014, 10:01:41 AM
A sad fact might be that Los Angeles County, California might hit 10 million in population before Georgia. As of now (2012 estimate) its at 9.96 million.
Title: Re: Census population estimates 2011-2019
Post by: Tender Branson on January 04, 2014, 10:51:42 AM
A sad fact might be that Los Angeles County, California might hit 10 million in population before Georgia. As of now (2012 estimate) its at 9.96 million.
According to the CA DoF estimates for Mid-2013 it already did:
http://www.dof.ca.gov/research/demographic/reports/estimates/e-2/documents/E2_press_release_Jul2013.pdf
The Dof estimates use a different method though.
Title: Re: Census population estimates 2011-2019
Post by: Tender Branson on January 05, 2014, 10:19:33 AM
States that have grown faster/slower in the past year than on average in the past 3.25 years since the Census:
(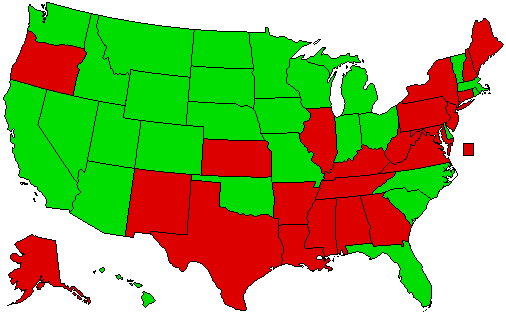 )
)
green => faster
red => slower
...
For example:
CO grew 73.600 on average in the past 3.25 years, but by 78.900 in the past year.
TX grew 401.000 on average, but only 387.000 last year.
(
green => faster
red => slower
...
For example:
CO grew 73.600 on average in the past 3.25 years, but by 78.900 in the past year.
TX grew 401.000 on average, but only 387.000 last year.
Title: Re: Census population estimates 2011-2019
Post by: hopper on January 18, 2014, 01:55:24 AM
Nice to see Michigan gaining population again.
Title: Re: Census population estimates 2011-2019
Post by: Linus Van Pelt on January 30, 2014, 07:25:37 PM
Components of population change by state have been released here. (http://factfinder2.census.gov/faces/tableservices/jsf/pages/productview.xhtml?src=bkmk)
Title: Re: Census population estimates 2011-2019
Post by: Gass3268 on January 30, 2014, 07:33:53 PM
Components of population change by state have been released here. (http://factfinder2.census.gov/faces/tableservices/jsf/pages/productview.xhtml?src=bkmk)
Link doesn't work for me
Title: Re: Census population estimates 2011-2019
Post by: Linus Van Pelt on January 30, 2014, 07:41:54 PM
Components of population change by state have been released here. (http://factfinder2.census.gov/faces/tableservices/jsf/pages/productview.xhtml?src=bkmk)
Link doesn't work for me
Sorry, linking to the FactFinder is tricky. What if you go here (http://www.census.gov/popest/data/national/totals/2013/index.html) and then click on the third link, called "Estimates of the Components of Resident Population Change for the United States, Regions, States, and Puerto Rico: April 1, 2010 to July 1, 2013"?
Title: Re: Census population estimates 2011-2019
Post by: Tender Branson on December 02, 2014, 03:34:46 AM
http://www.calendarwiz.com/calendars/calendar.php?crd=cens1sample&&jsenabled=1&winh=947&winw=1466&inifr=false
The most likely estimates for the TOP-10:
1 - CA - 38.67 Mio.
2 - TX - 26.84 Mio.
3 - FL - 19.79 Mio.
4 - NY -19.73 Mio.
5 - IL - 12.90 Mio.
6 - PA - 12.78 Mio.
7 - OH - 11.59 Mio.
8 - GA - 10.07 Mio.
9 - NC - 9.95 Mio.
10 - MI - 9.91 Mio.
USA: 318.35 Mio. (+2.22 Mio., +0.7%)
FL overtakes NY. NC overtakes MI.
Title: Re: Census population estimates 2011-2019
Post by: Tender Branson on December 03, 2014, 04:12:08 AM
Any predictions for which states will have the biggest increase in % terms ?
Probably ND and DC will have the highest growth rates again, like last year.
I think CO might actually overtake UT for 3rd.
Or maybe NV is back in the top-3 again.
Last year, only ME, WV and PR lost population.
Probably ND and DC will have the highest growth rates again, like last year.
I think CO might actually overtake UT for 3rd.
Or maybe NV is back in the top-3 again.
Last year, only ME, WV and PR lost population.
Title: Re: Census population estimates 2011-2019
Post by: Tender Branson on December 22, 2014, 07:02:56 AM
Some states, such as WA, OR, CA, WI, FL and GA (Atlanta Metro) release their own annual estimates - independently to the Census Bureau numbers (which means they often differ from those).
There are indications that the population growth in WA, OR and GA has picked up in the past year between July 1, 2013 and July 1, 2014.
CA's growth rate is steady at around 0.9% and FL has picked up 250.000 people, which means it has overtaken NY for sure in the new estimates out tomorrow.
There are indications that the population growth in WA, OR and GA has picked up in the past year between July 1, 2013 and July 1, 2014.
CA's growth rate is steady at around 0.9% and FL has picked up 250.000 people, which means it has overtaken NY for sure in the new estimates out tomorrow.
Title: Re: Census population estimates 2011-2019
Post by: muon2 on December 22, 2014, 11:13:12 AM
Some states, such as WA, OR, CA, WI, FL and GA (Atlanta Metro) release their own annual estimates - independently to the Census Bureau numbers (which means they often differ from those).
There are indications that the population growth in WA, OR and GA has picked up in the past year between July 1, 2013 and July 1, 2014.
CA's growth rate is steady at around 0.9% and FL has picked up 250.000 people, which means it has overtaken NY for sure in the new estimates out tomorrow.
There are indications that the population growth in WA, OR and GA has picked up in the past year between July 1, 2013 and July 1, 2014.
CA's growth rate is steady at around 0.9% and FL has picked up 250.000 people, which means it has overtaken NY for sure in the new estimates out tomorrow.
The state estimates often differ substantially from the CB. On top of that, the methodology from the states varies from state to state. The CB uses the same methodology for all states, so it's the best measure to compare growth rates from state to state.
Title: Re: Census population estimates 2011-2019
Post by: Tender Branson on December 23, 2014, 03:04:45 AM
I assume the new numbers will come out at some point in the morning (EST time), which is afternoon here.
I'm at a birthday party during the afternoon, so please someone else post the figures here.
Thx.
I'll check in later.
I'm at a birthday party during the afternoon, so please someone else post the figures here.
Thx.
I'll check in later.
Title: Re: Census population estimates 2011-2019
Post by: muon2 on December 23, 2014, 10:35:10 AM
Here's my annual projection from the new estimates. I used the July 2014 estimates and the April 2010 Census base to get an annual growth rate. This correctly accounts for the 3 and a quarter year period between the Census and the estimate. I then applied the annual growth rate to the 2010 reapportionment population to get the 2020 projection. This accounts for the extra overseas population used in reapportionment but not for redistricting. Ten years is a long stretch for a simple model like this, but here are the projected changes.
CA +1
CO +1
FL +1
IL -1
MI -1
MN -1
NY -1
NC +1
OH -1
PA -1
RI -1
TX +3
VA +1
WV -1
The only change since my projections last year (https://uselectionatlas.org/FORUM/index.php?topic=182602.msg3996843#msg3996843) is that CA is back to +1 and NY is back to -1 as they were after the 2012 estimate instead of even last year. They continue to be the most likely to change, and there is some shifting in the other bubble seats. The bubble seats in this projection are based on the last five awarded and the next five in line.
The last five awarded are CO-8, TX-39, VA-12, CA-54, and AL-7 (#435).
The next five in line are NY-27, OR-6, AZ-10, MT-2, MN-8.
Title: Re: Census population estimates 2011-2019
Post by: Miles on December 23, 2014, 10:59:58 AM
Yep, FL passes NY: (http://census.gov/newsroom/press-releases/2014/cb14-232.html)
CA- 38,802,500
TX- 26,956,958
FL- 19,893,297
NY- 19,746,227
CA- 38,802,500
TX- 26,956,958
FL- 19,893,297
NY- 19,746,227
Title: Re: Census population estimates 2011-2019
Post by: muon2 on December 23, 2014, 11:09:16 AM
Since the 2010 Census happened during the housing downturn of the Great Recession, I thought it would be worth testing the model if the growth was based off the last two years of estimates. That means that I use the 2014 and 2012 estimates and use them to extract a compounding rate of population growth. I apply that to the 2014 estimate and adjust for the April to July difference, then add the overseas population difference increased by the state's growth rate. The result assumes that recent growth is more indicative of how that state will grow for the rest of the decade.
Using this model, I get the following projected changes, using bold to show the differences compared to my full decade projection.
AL -1
AZ +1
CA +1
CO +1
FL +1
IL -1
MI -1
MN -1
NY -1
NC +1
OH -1
OR +1
PA -1
RI -1
TX +3
VA +0
WV -1
The changes are all bubble states. The West shows more increase in growth recently, and if it holds to that growth the West could see extra seats as a benefit.
Title: Re: Census population estimates 2011-2019
Post by: Tender Branson on December 23, 2014, 11:20:30 AM
I'm at a birthday party during the afternoon, so please someone else post the figures here.
Thx.
I'll check in later.
Thx.
I'll check in later.
Back !
...
Top numerical gainers (2013 => 2014):
451K - TX
371K - CA
293K - FL
103K - GA
97K - AZ
95K - NC
88K - WA
84K - CO
61K - SC
56K - VA
Top %-gainers (2013 => 2014):
2.16% ND
1.71% NV
1.70% TX
1.59% CO
1.51% DC
1.50% FL
1.45% AZ
1.38% UT
1.34% ID
1.27% SC
States that lost population (2013 => 2014):
-1K VT
-1K AK
-1K NM
-3K CT
-3K WV
-10K IL
-47K PR
Title: Re: Census population estimates 2011-2019
Post by: Tender Branson on December 23, 2014, 11:22:56 AM
Any predictions for which states will have the biggest increase in % terms ?
Probably ND and DC will have the highest growth rates again, like last year.
I think CO might actually overtake UT for 3rd.
Or maybe NV is back in the top-3 again.
Last year, only ME, WV and PR lost population.
Probably ND and DC will have the highest growth rates again, like last year.
I think CO might actually overtake UT for 3rd.
Or maybe NV is back in the top-3 again.
Last year, only ME, WV and PR lost population.
ND is ahead again, but DC fell back a bit.
NV indeed is in the top-3 again, recovering from the housing bust.
CO is not 3rd, but has overtaken UT.
TX really continues to be a magnet.
Title: Re: Census population estimates 2011-2019
Post by: Tender Branson on December 23, 2014, 11:25:21 AM
The CB's infographic, showing how FL has caught up to NY in recent decades and now overtook it:
()
()
Title: Re: Census population estimates 2011-2019
Post by: Tender Branson on December 23, 2014, 11:36:46 AM
States with the highest numerical migration gains (international + domestic):
251K - FL
239K - TX
129K - CA
58K - NC
56K - AZ
52K - WA
51K - CO
47K - GA
45K - SC
34K - TN
States with the highest numerical migration gains (international only):
161K - CA
119K - NY
112K - FL
85K - TX
52K - NJ
37K - MA
34K - VA
33K - IL
29K - PA
29K - MD
States with the highest numerical migration gains (domestic only):
155K - TX
139K - FL
42K - AZ
40K - CO
39K - SC
36K - NC
28K - WA
25K - TN
24K - NV
23K - OR
Title: Re: Census population estimates 2011-2019
Post by: Sol on December 23, 2014, 11:39:40 AM
What are the stats for international % of growth in a state? I bet an unusually high percentage of migration to MN is international.
Title: Re: Census population estimates 2011-2019
Post by: Brittain33 on December 23, 2014, 11:42:00 AM
What are the stats for international % of growth in a state? I bet an unusually high percentage of migration to MN is international.
Minnesota's international migration is 2.6 per 1000, a little lower than the national average of 3.1 per 1000. It has net domestic outmigration of -1.2.
Title: Re: Census population estimates 2011-2019
Post by: Tender Branson on December 23, 2014, 11:42:13 AM
The 10 states with the highest numerical domestic migration losses are all Democratic states:
-16K MA
-18K OH
-20K VA
-26K CT
-29K MI
-32K PA
-32K CA
-56K NJ
-95K IL
-154K NY
-16K MA
-18K OH
-20K VA
-26K CT
-29K MI
-32K PA
-32K CA
-56K NJ
-95K IL
-154K NY
Title: Re: Census population estimates 2011-2019
Post by: Sol on December 23, 2014, 11:43:40 AM
What are the stats for international % of growth in a state? I bet an unusually high percentage of migration to MN is international.
Minnesota's international migration is 2.6 per 1000, a little lower than the national average of 3.1 per 1000. It has net domestic outmigration of -1.2.
Huh, I thought it'd be higher with all the refugee resettlement.
Title: Re: Census population estimates 2011-2019
Post by: Brittain33 on December 23, 2014, 11:46:17 AM
What are the stats for international % of growth in a state? I bet an unusually high percentage of migration to MN is international.
Minnesota's international migration is 2.6 per 1000, a little lower than the national average of 3.1 per 1000. It has net domestic outmigration of -1.2.
Huh, I thought it'd be higher with all the refugee resettlement.
It may be that MN isn't much of a destination for immigrants except for refugees.
Title: Re: Census population estimates 2011-2019
Post by: Brittain33 on December 23, 2014, 11:47:07 AM
Arizona has still not surpassed Massachusetts in official numbers, but probably has as of today.
Maine continues to be a smidge ahead of New Hampshire.
Pennsylvania should break the 13,000,000 barrier by the year 2050.
Maine continues to be a smidge ahead of New Hampshire.
Pennsylvania should break the 13,000,000 barrier by the year 2050.
Title: Re: Census population estimates 2011-2019
Post by: Tender Branson on December 23, 2014, 11:58:36 AM
The states with the highest international migration gains (per 1000 inhabitants):
6.1 HI
6.0 NY
5.8 NJ
5.7 DC
5.7 FL
5.5 MA
4.9 MD
4.7 CT
4.2 CA
4.1 VA
The states with the highest domestic migration gains (per 1000 inhabitants):
12.3 ND
8.4 NV
8.0 SC
7.6 CO
7.0 FL
6.3 AZ
5.8 TX
5.7 OR
5.1 DE
4.7 ID
The states with the highest domestic migration losses (per 1000 inhabitants):
-3.2 RI
-3.6 HI
-4.6 WY
-4.8 KS
-6.2 NJ
-6.8 NM
-7.3 CT
-7.4 IL
-7.8 NY
-13.8 AK
Title: Re: Census population estimates 2011-2019
Post by: hopper on December 23, 2014, 12:15:07 PM
The 10 states with the highest numerical domestic migration losses are all Democratic states:
-16K MA
-18K OH
-20K VA
-26K CT
-29K MI
-32K PA
-32K CA
-56K NJ
-95K IL
-154K NY
-16K MA
-18K OH
-20K VA
-26K CT
-29K MI
-32K PA
-32K CA
-56K NJ
-95K IL
-154K NY
PA is about the same as MI although it has had one Republican US Senator since 1995 except for most of 2009-2010 when the late Arlen Specter switched parties from R to D in early 2009. The GOP lost the governorship last month though.
Title: Re: Census population estimates 2011-2019
Post by: Tender Branson on December 23, 2014, 12:16:31 PM
Yeah sure, but I meant 2008/2012 Pres. election results with "Democratic states".
Title: Re: Census population estimates 2011-2019
Post by: Tender Branson on December 23, 2014, 12:21:05 PM
Also worth mentioning:
Overall US population growth is ca. 150.000 higher than last year (but not beacuse of higher natural growth, but because the international migration balance is almost up to 1 Mio. people again).
Overall US population growth is ca. 150.000 higher than last year (but not beacuse of higher natural growth, but because the international migration balance is almost up to 1 Mio. people again).
Title: Re: Census population estimates 2011-2019
Post by: Tender Branson on December 23, 2014, 12:27:05 PM
Pennsylvania should break the 13,000,000 barrier by the year 2050.
I somehow hate long-term demographic projections.
"should" = could/maybe/whatever
Because it's impossible to estimate future migration trends.
You can estimate future natural population developments (births minus deaths) to some extent though, because of past trends in fertility and mortality. But even that does not take into account possible future economic boom/bust periods, which could heavily increase or decrease them (like after 2007/08).
In 2000 for example (during the height of the economic boom), the Census Bureau projected that the US population in 2050 is likely around 450 Mio. people.
In their latest projections though from a few weeks ago, it will have only 395 Mio. anymore ...
Title: Re: Census population estimates 2011-2019
Post by: hopper on December 23, 2014, 12:34:54 PM
AZ is in NC population growth territory. Wow!
Title: Re: Census population estimates 2011-2019
Post by: Tender Branson on December 23, 2014, 12:43:03 PM
AZ is in NC population growth territory. Wow!
That's not surprising.
For most of the 90s and the years between 2000 and 2007 (before the economic and housing crash), AZ had 2.5-3% growth (or +150.000 people each year). Roughly the same amount as NC (but NC is bigger, so the relative growth was lower).
After the bust, both states had a collapse in their growth rates (domestic Americans were unable to move to the South or AZ, because they went unemployed etc.) and international migration went down too (especially from MEX). Also, AZ pissed off immigrants because of their new anti-illegal alien laws.
Title: Re: Census population estimates 2011-2019
Post by: Tender Branson on December 23, 2014, 12:55:27 PM
As I've said, I'm not a fan of long-term projections but if you want to know when TX is going to overtake CA as biggest state (based on the past year's numbers):
In the 2160s.
In the 2160s.
Title: Re: Census population estimates 2011-2019
Post by: Brittain33 on December 23, 2014, 02:12:59 PM
Pennsylvania should break the 13,000,000 barrier by the year 2050.
I somehow hate long-term demographic projections.
"should" = could/maybe/whatever
Because it's impossible to estimate future migration trends.
You can estimate future natural population developments (births minus deaths) to some extent though, because of past trends in fertility and mortality. But even that does not take into account possible future economic boom/bust periods, which could heavily increase or decrease them (like after 2007/08).
In 2000 for example (during the height of the economic boom), the Census Bureau projected that the US population in 2050 is likely around 450 Mio. people.
In their latest projections though from a few weeks ago, it will have only 395 Mio. anymore ...
Of course, you are absolutely correct. I was joking because Pennsylvania has been a very slow growth state for an extremely long period of time, and is so close to 13,000,000 without getting there.
That said, it is a state we should expect to do pretty well out of climate change.
Title: Re: Census population estimates 2011-2019
Post by: Panda Express on December 23, 2014, 09:11:55 PM
Yep, FL passes NY: (http://census.gov/newsroom/press-releases/2014/cb14-232.html)
CA- 38,802,500
TX- 26,956,958
FL- 19,893,297
NY- 19,746,227
CA- 38,802,500
TX- 26,956,958
FL- 19,893,297
NY- 19,746,227
Disgusting
Title: Re: Census population estimates 2011-2019
Post by: ○∙◄☻¥tπ[╪AV┼cVê└ on December 24, 2014, 01:48:25 AM
Yep, FL passes NY: (http://census.gov/newsroom/press-releases/2014/cb14-232.html)
CA- 38,802,500
TX- 26,956,958
FL- 19,893,297
NY- 19,746,227
CA- 38,802,500
TX- 26,956,958
FL- 19,893,297
NY- 19,746,227
Disgusting
Damn you, Florida.
Title: Re: Census population estimates 2011-2019
Post by: ○∙◄☻¥tπ[╪AV┼cVê└ on December 24, 2014, 01:51:09 AM
As I've said, I'm not a fan of long-term projections but if you want to know when TX is going to overtake CA as biggest state (based on the past year's numbers):
In the 2160s.
In the 2160s.
Predictions like that are meaningless. After some rapid growth in the 1890s, Texas had over twice the population of California in 1900.
Title: Re: Census population estimates 2011-2019
Post by: Tender Branson on December 24, 2014, 03:11:59 AM
The states with the highest international migration gains (per 1000 inhabitants):
6.1 HI
6.0 NY
5.8 NJ
5.7 DC
5.7 FL
5.5 MA
4.9 MD
4.7 CT
4.2 CA
4.1 VA
6.1 HI
6.0 NY
5.8 NJ
5.7 DC
5.7 FL
5.5 MA
4.9 MD
4.7 CT
4.2 CA
4.1 VA
I just looked up our 2013 numbers and it turns out that the international migration balance was 55K last year.
That means Austria had a rate of 6.5 last year and therefore a higher rate than any US state.
Title: Re: Census population estimates 2011-2019
Post by: jimrtex on December 24, 2014, 07:32:57 AM
Alabama 6.737 6.461 -0.277 6 -1 9 165
Alaska 1.117 1.126 0.009 1 = 307 64
Arizona 8.999 9.417 0.418 9 = 33 828
Arkansas 4.129 3.986 -0.143 4 = -393 120
California 52.369 53.406 1.036 54 +1 -179 3747
Colorado 7.087 7.612 0.525 8 +1 -122 803
Connecticut 5.049 4.751 -0.298 5 = -215 53
Delaware 1.358 1.382 0.024 1 = 92 91
Florida 26.435 27.969 1.534 28 +1 -489 2668
Georgia 13.627 13.919 0.292 14 = -385 992
Hawaii 1.976 2.022 0.045 2 = 369 144
Idaho 2.260 2.307 0.048 2 = 143 162
Illinois 18.043 16.873 -1.170 17 -1 -364 118
Indiana 9.128 8.810 -0.318 9 = -278 269
Iowa 4.312 4.186 -0.126 4 = 228 144
Kansas 4.042 3.906 -0.135 4 = -331 121
Kentucky 6.120 5.903 -0.217 6 = -336 176
Louisiana 6.392 6.287 -0.105 6 = 143 278
Maine 1.933 1.806 -0.127 2 = -253 4
Maryland 8.131 8.172 0.041 8 = 225 489
Massachusetts 9.217 9.161 -0.057 9 = 230 475
Michigan 13.902 12.964 -0.938 13 -1 -415 62
Minnesota 7.472 7.404 -0.068 7 -1 49 368
Mississippi 4.201 3.979 -0.222 4 = -387 63
Missouri 8.433 8.047 -0.386 8 = 321 177
Montana 1.478 1.483 0.005 1 = 9 82
Nebraska 2.615 2.600 -0.016 3 = -90 132
Nevada 3.829 3.988 0.159 4 = -395 337
New Hampshire 1.917 1.817 -0.100 2 = -262 24
New Jersey 12.369 11.915 -0.453 12 = -373 348
New Mexico 2.937 2.809 -0.129 3 = -253 63
New York 27.244 26.387 -0.856 27 = -38 877
North Carolina 13.413 13.717 0.304 14 +1 -230 989
North Dakota 1.070 1.204 0.134 1 = 240 168
Ohio 16.224 15.212 -1.012 15 -1 171 136
Oklahoma 5.297 5.307 0.010 5 = 131 305
Oregon 5.408 5.450 0.042 5 = 21 336
Pennsylvania 17.862 16.813 -1.049 17 -1 -318 201
Rhode Island 1.562 1.467 -0.095 1 -1 22 6
South Carolina 6.521 6.697 0.176 7 = -182 502
South Dakota 1.249 1.285 0.036 1 = 172 95
Tennessee 8.935 8.916 -0.018 9 = -360 489
Texas 35.350 38.580 3.230 39 +3 -242 4472
Utah 3.917 4.203 0.286 4 = 215 440
Vermont 1.012 0.958 -0.053 1 = 453 2
Virginia 11.258 11.457 0.199 12 +1 -21 786
Washington 9.466 9.839 0.374 10 = -305 820
West Virginia 2.652 2.457 -0.195 2 -1 26 -6
Wisconsin 8.010 7.642 -0.368 8 = -144 167
Wyoming 0.937 0.942 0.005 1 = 468 49
The change since 2012 is that New York is not now estimated to lose a seat, which would the first time since 1940 that this had not happened, and Alabama is now expected to lose a representative.
As of 2014, there would only be four changes: NC and TX gain a seat, and PA and MN lose a seat.
The first column is the entitlement in 2010 if fractional representatives were apportioned, but the geometric mean were used. If we define the P = population/quota, then a state with a population P = sqrt((n+1/2)(n-1/2)) would be entitled to n representatives. Solving for
n, n = sqrt(P2 + 1/4).
We can adjust the quota such that sum(n) for all states = 435 (we can estimate the quota as the total US population divided by 435, and then recursively adjust it until sum(n) = 435. It converges very quickly, and the initial estimate would have yielded a House of 436.865 members, less than two members extra.
The second column represents the entitlement based on the estimated 2020 population, based on projecting the rate of growth for the 4.25 years from April 2010 to July 2014, to April 2020 (using a compounded rate of growth). Only the domestic population was used.
The national rate of growth would 7.9%. States growing faster than the nation include all states in the West, except NM; all states in the middle tier from ND to TX, except NE and KS; and all states on the Atlantic Coast, from DE to FL.
The third column represents the change in raw entitlement between 2010 and 2020.
The fourth column represents the estimated number of representative for 2020. If we use simple rounding, and give Wyoming and Vermont their guaranteed representative, this would only give 432 representatives. Rather than choosing the states with the three largest fractions, we calculate the quotients as they would be for the apportionment list. When there are extra seats for be apportioned, this favors larger states, who in essence can distribute their deficit over more representatives. In this case, the last 3 seats go to CA, NY, and VA; while AL, AZ, OR, MN, and MT miss out.
The fifth column is the change in representation from 2010, showing gains for CA, CO, FL, NC, TX(3), and VA; and loss of a seat for AL, IL, MI, MN, OH, PA, RI, and WV (Obama +4, -6, Net -2); Romney (+4, -2. net +2).
The next two columns represent the change necessary to get an additional seat, and the estimated increase in population from 2010 to 2020. For example, if Alabama were to gain an additional 9K it would stave off its loss of its 7th seat. Since it is estimated to gain 165K, it is pretty clear that it is a coin flip as to whether it not it happens, because of changes in growth rates, errors in estimates, and what happens in other states.
Title: Re: Census population estimates 2011-2019
Post by: jimrtex on December 24, 2014, 07:55:40 AM
Alabama 6.737 6.461 -0.277 6 -1 9 165
Alaska 1.117 1.126 0.009 1 = 307 64
Arizona 8.999 9.417 0.418 9 = 33 828
Arkansas 4.129 3.986 -0.143 4 = -393 120
California 52.369 53.406 1.036 54 +1 -179 3747
Colorado 7.087 7.612 0.525 8 +1 -122 803
Connecticut 5.049 4.751 -0.298 5 = -215 53
Delaware 1.358 1.382 0.024 1 = 92 91
Florida 26.435 27.969 1.534 28 +1 -489 2668
Georgia 13.627 13.919 0.292 14 = -385 992
Hawaii 1.976 2.022 0.045 2 = 369 144
Idaho 2.260 2.307 0.048 2 = 143 162
Illinois 18.043 16.873 -1.170 17 -1 -364 118
Indiana 9.128 8.810 -0.318 9 = -278 269
Iowa 4.312 4.186 -0.126 4 = 228 144
Kansas 4.042 3.906 -0.135 4 = -331 121
Kentucky 6.120 5.903 -0.217 6 = -336 176
Louisiana 6.392 6.287 -0.105 6 = 143 278
Maine 1.933 1.806 -0.127 2 = -253 4
Maryland 8.131 8.172 0.041 8 = 225 489
Massachusetts 9.217 9.161 -0.057 9 = 230 475
Michigan 13.902 12.964 -0.938 13 -1 -415 62
Minnesota 7.472 7.404 -0.068 7 -1 49 368
Mississippi 4.201 3.979 -0.222 4 = -387 63
Missouri 8.433 8.047 -0.386 8 = 321 177
Montana 1.478 1.483 0.005 1 = 9 82
Nebraska 2.615 2.600 -0.016 3 = -90 132
Nevada 3.829 3.988 0.159 4 = -395 337
New Hampshire 1.917 1.817 -0.100 2 = -262 24
New Jersey 12.369 11.915 -0.453 12 = -373 348
New Mexico 2.937 2.809 -0.129 3 = -253 63
New York 27.244 26.387 -0.856 27 = -38 877
North Carolina 13.413 13.717 0.304 14 +1 -230 989
North Dakota 1.070 1.204 0.134 1 = 240 168
Ohio 16.224 15.212 -1.012 15 -1 171 136
Oklahoma 5.297 5.307 0.010 5 = 131 305
Oregon 5.408 5.450 0.042 5 = 21 336
Pennsylvania 17.862 16.813 -1.049 17 -1 -318 201
Rhode Island 1.562 1.467 -0.095 1 -1 22 6
South Carolina 6.521 6.697 0.176 7 = -182 502
South Dakota 1.249 1.285 0.036 1 = 172 95
Tennessee 8.935 8.916 -0.018 9 = -360 489
Texas 35.350 38.580 3.230 39 +3 -242 4472
Utah 3.917 4.203 0.286 4 = 215 440
Vermont 1.012 0.958 -0.053 1 = 453 2
Virginia 11.258 11.457 0.199 12 +1 -21 786
Washington 9.466 9.839 0.374 10 = -305 820
West Virginia 2.652 2.457 -0.195 2 -1 26 -6
Wisconsin 8.010 7.642 -0.368 8 = -144 167
Wyoming 0.937 0.942 0.005 1 = 468 49
The second column represents the entitlement based on the estimated 2020 population, based on projecting the rate of growth for the 4.25 years from April 2010 to July 2014, to April 2020 (using a compounded rate of growth). Only the domestic population was used.
The national rate of growth would 7.9%. States growing faster than the nation include all states in the West, except NM; all states in the middle tier from ND to TX, except NE and KS; and all states on the Atlantic Coast, from DE to FL.
The third column represents the change in raw entitlement between 2010 and 2020.
The fourth column represents the estimated number of representative for 2020. If we use simple rounding, and give Wyoming and Vermont their guaranteed representative, this would only give 432 representatives. Rather than choosing the states with the three largest fractions, we calculate the quotients as they would be for the apportionment list. When there are extra seats for be apportioned, this favors larger states, who in essence can distribute their deficit over more representatives. In this case, the last 3 seats go to CA, NY, and VA; while AL, AZ, OR, MN, and MT miss out.
The fifth column is the change in representation from 2010, showing gains for CA, CO, FL, NC, TX(3), and VA; and loss of a seat for AL, IL, MI, MN, OH, PA, RI, and WV (Obama +4, -6, Net -2); Romney (+4, -2. net +2).
The next two columns represent the change necessary to get an additional seat, and the estimated increase in population from 2010 to 2020. For example, if Alabama were to gain an additional 9K it would stave off its loss of its 7th seat. Since it is estimated to gain 165K, it is pretty clear that it is a coin flip as to whether it not it happens, because of changes in growth rates, errors in estimates, and what happens in other states.
Future losses:
AL 2020-2030
AR 2060
CT 2030
IN 2030-2040
IA 2080
KS 2050-2060
KY 2040-2050
ME 2050
MS 2040-2050
MO 2040
NH 2050-2060
NM 2050
WI 2030
IL, MI, NY, OH, and PA will continue to lose about 1 representative per decade.
While LA, NE, and TN are losing population share, it as such a slow rate or they have such a long way to go to lose a seat, it is not worth even guessing.
Gainers:
AZ +1, every couple of decades.
CA +1 per decade.
CO +1, every couple of decades
FL +1 or +2 per decade
GA 2040-2050
ID 2060
DE 2070
MT 2060
NV 2060-2070
NC 2050
ND 2040-2050
OR 2030-2040
SC 2070
TX +3 per decade
UT 2030-2040
VA 2070-2080
WA 2040
AK, MD, OK, SD, and WY are gaining population share, but it is indefinite when this will result in an increase in representation.
Title: Re: Census population estimates 2011-2019
Post by: Brittain33 on December 24, 2014, 12:31:55 PM
Jim, thanks for posting this. I have a question because I'm missing something critical here.
If Alabama were to gain 9k as compared to what? Over its 2014 population by 2020, compared to what is predicted for 2010-2020 (165k?) Am I reading it correctly that Alabama simply has to increase by 9k in the next 6 years to hold its seat?
Put another way, Alabama would need to gain 174k over 2010-2020 to hold on to their 7th seat?
The next two columns represent the change necessary to get an additional seat, and the estimated increase in population from 2010 to 2020. For example, if Alabama were to gain an additional 9K it would stave off its loss of its 7th seat. Since it is estimated to gain 165K, it is pretty clear that it is a coin flip as to whether it not it happens, because of changes in growth rates, errors in estimates, and what happens in other states.
If Alabama were to gain 9k as compared to what? Over its 2014 population by 2020, compared to what is predicted for 2010-2020 (165k?) Am I reading it correctly that Alabama simply has to increase by 9k in the next 6 years to hold its seat?
Put another way, Alabama would need to gain 174k over 2010-2020 to hold on to their 7th seat?
Title: Re: Census population estimates 2011-2019
Post by: jimrtex on December 24, 2014, 04:02:13 PM
Jim, thanks for posting this. I have a question because I'm missing something critical here.
If Alabama were to gain 9k as compared to what? Over its 2014 population by 2020, compared to what is predicted for 2010-2020 (165k?) Am I reading it correctly that Alabama simply has to increase by 9k in the next 6 years to hold its seat?
Put another way, Alabama would need to gain 174k over 2010-2020 to hold on to their 7th seat?
The next two columns represent the change necessary to get an additional seat, and the estimated increase in population from 2010 to 2020. For example, if Alabama were to gain an additional 9K it would stave off its loss of its 7th seat. Since it is estimated to gain 165K, it is pretty clear that it is a coin flip as to whether it not it happens, because of changes in growth rates, errors in estimates, and what happens in other states.
If Alabama were to gain 9k as compared to what? Over its 2014 population by 2020, compared to what is predicted for 2010-2020 (165k?) Am I reading it correctly that Alabama simply has to increase by 9k in the next 6 years to hold its seat?
Put another way, Alabama would need to gain 174k over 2010-2020 to hold on to their 7th seat?
It is currently estimated to gain 165K over the 10 year period, though 70K of that has happened in the first 4.25 years since the Census. Assuming that the 2014 estimate is correct, then it is estimated to grow by an additional 95K during the remainder of the decade.
If it grew 9K more (to 104K) it would save the 7th seat. While 9/104 is 9%, it may be possible to change some of the components. For example, 9K would only be an increase of 2% in the number of births. Of course if the birth rate increases in Alabama, it likely will increase in other states. Alabama has almost zero net domestic migration (3.5K in the first 4 years). But Mississippi has had 27K net out-migration. So totally guesstimating, Alabama may have had 50K out and 54K in over the four years. Decreasing that going out, or increasing those coming in would make a huge difference in the net. Domestic migration was estimated at 2K in the last year, so there is a favorable trend.
Contrast to Alaska. It would need 307K more persons to gain a 2nd seat. But the estimated increase is only 64K. It is quite unlikely to have that sort of massive change.
Negative numbers indicate a smaller increase that would cause a state to surpass (in the negative sense), Alabama for the 436th seat. For example, if Colorado gained 122K less than the 803K estimated, it would not gain its 8th district. But it has also banked the 327K of the increase, so it is not quite like a 15% change in the the rate of increase (from around 1.5% annual increase, to about 1.3% annual increase), but rather a 25% change in the rate of future increase (from around 1.5% annual increase, to about 1.1% annual increase). Still possible, since migration is more susceptible to economic factors, but becoming less likely.
Title: Re: Census population estimates 2011-2019
Post by: Tender Branson on December 25, 2014, 02:40:57 AM
Also:
NC to pass 10 million people for the 1st time ever in ca. 1 month.
NC had 9.944 million on July 1, 2014 and adds ca. 8K people each month.
NC to pass 10 million people for the 1st time ever in ca. 1 month.
NC had 9.944 million on July 1, 2014 and adds ca. 8K people each month.
Title: Re: Census population estimates 2011-2019
Post by: ○∙◄☻¥tπ[╪AV┼cVê└ on December 25, 2014, 05:34:31 PM
Also:
NC to pass 10 million people for the 1st time ever in ca. 1 month.
NC had 9.944 million on July 1, 2014 and adds ca. 8K people each month.
NC to pass 10 million people for the 1st time ever in ca. 1 month.
NC had 9.944 million on July 1, 2014 and adds ca. 8K people each month.
FL probably just hit 20 million.
Title: Re: Census population estimates 2011-2019
Post by: Flake on December 25, 2014, 07:39:37 PM
Yep, FL passes NY: (http://census.gov/newsroom/press-releases/2014/cb14-232.html)
CA- 38,802,500
TX- 26,956,958
FL- 19,893,297
NY- 19,746,227
CA- 38,802,500
TX- 26,956,958
FL- 19,893,297
NY- 19,746,227
Disgusting
Damn you, Florida.
Obviously great news.
Also:
NC to pass 10 million people for the 1st time ever in ca. 1 month.
NC had 9.944 million on July 1, 2014 and adds ca. 8K people each month.
NC to pass 10 million people for the 1st time ever in ca. 1 month.
NC had 9.944 million on July 1, 2014 and adds ca. 8K people each month.
FL probably just hit 20 million.
Even better news!
Title: Re: Census population estimates 2011-2019
Post by: jimrtex on December 26, 2014, 04:01:46 AM
Jim, thanks for posting this. I have a question because I'm missing something critical here.
If Alabama were to gain 9k as compared to what? Over its 2014 population by 2020, compared to what is predicted for 2010-2020 (165k?) Am I reading it correctly that Alabama simply has to increase by 9k in the next 6 years to hold its seat?
Put another way, Alabama would need to gain 174k over 2010-2020 to hold on to their 7th seat?
The next two columns represent the change necessary to get an additional seat, and the estimated increase in population from 2010 to 2020. For example, if Alabama were to gain an additional 9K it would stave off its loss of its 7th seat. Since it is estimated to gain 165K, it is pretty clear that it is a coin flip as to whether it not it happens, because of changes in growth rates, errors in estimates, and what happens in other states.
If Alabama were to gain 9k as compared to what? Over its 2014 population by 2020, compared to what is predicted for 2010-2020 (165k?) Am I reading it correctly that Alabama simply has to increase by 9k in the next 6 years to hold its seat?
Put another way, Alabama would need to gain 174k over 2010-2020 to hold on to their 7th seat?
Alabama 6.737 6.461 -0.277 6 -1 9 165 0.34% 0.37%
Alaska 1.117 1.126 0.009 1 = 307 64 0.87% 6.90%
Arizona 8.999 9.417 0.418 9 = 33 828 1.22% 1.31%
Arkansas 4.129 3.986 -0.143 4 = -393 120 0.40% -1.99%
California 52.369 53.406 1.036 54 +1 -179 3747 0.96% 0.89%
Colorado 7.087 7.612 0.525 8 +1 -122 803 1.49% 1.12%
Connecticut 5.049 4.751 -0.298 5 = -215 53 0.15% -0.91%
Delaware 1.358 1.382 0.024 1 = 92 91 0.97% 2.55%
Florida 26.435 27.969 1.534 28 +1 -489 2668 1.34% 0.93%
Georgia 13.627 13.919 0.292 14 = -385 992 0.98% 0.34%
Hawaii 1.976 2.022 0.045 2 = 369 144 1.01% 4.94%
Idaho 2.260 2.307 0.048 2 = 143 162 0.99% 2.39%
Illinois 18.043 16.873 -1.170 17 -1 -364 118 0.09% -0.40%
Indiana 9.128 8.810 -0.318 9 = -278 269 0.41% -0.32%
Iowa 4.312 4.186 -0.126 4 = 228 144 0.46% 1.68%
Kansas 4.042 3.906 -0.135 4 = -331 121 0.42% -1.62%
Kentucky 6.120 5.903 -0.217 6 = -336 176 0.40% -0.94%
Louisiana 6.392 6.287 -0.105 6 = 143 278 0.60% 1.11%
Maine 1.933 1.806 -0.127 2 = -253 4 0.03% -3.57%
Maryland 8.131 8.172 0.041 8 = 225 489 0.82% 1.44%
Massachusetts 9.217 9.161 -0.057 9 = 230 475 0.70% 1.27%
Michigan 13.902 12.964 -0.938 13 -1 -415 62 0.06% -0.68%
Minnesota 7.472 7.404 -0.068 7 -1 49 368 0.67% 0.82%
Mississippi 4.201 3.979 -0.222 4 = -387 63 0.21% -2.14%
Missouri 8.433 8.047 -0.386 8 = 321 177 0.29% 1.18%
Montana 1.478 1.483 0.005 1 = 9 82 0.80% 0.96%
Nebraska 2.615 2.600 -0.016 3 = -90 132 0.70% -0.11%
Nevada 3.829 3.988 0.159 4 = -395 337 1.18% -1.23%
New Hampshire 1.917 1.817 -0.100 2 = -262 24 0.18% -3.53%
New Jersey 12.369 11.915 -0.453 12 = -373 348 0.39% -0.34%
New Mexico 2.937 2.809 -0.129 3 = -253 63 0.30% -1.89%
New York 27.244 26.387 -0.856 27 = -38 877 0.44% 0.41%
North Carolina 13.413 13.717 0.304 14 +1 -230 989 0.99% 0.60%
North Dakota 1.070 1.204 0.134 1 = 240 168 2.26% 6.83%
Ohio 16.224 15.212 -1.012 15 -1 171 136 0.12% 0.37%
Oklahoma 5.297 5.307 0.010 5 = 131 305 0.78% 1.34%
Oregon 5.408 5.450 0.042 5 = 21 336 0.84% 0.93%
Pennsylvania 17.862 16.813 -1.049 17 -1 -318 201 0.16% -0.28%
Rhode Island 1.562 1.467 -0.095 1 -1 22 6 0.06% 0.42%
South Carolina 6.521 6.697 0.176 7 = -182 502 1.04% 0.40%
South Dakota 1.249 1.285 0.036 1 = 172 95 1.11% 4.20%
Tennessee 8.935 8.916 -0.018 9 = -360 489 0.74% -0.20%
Texas 35.350 38.580 3.230 39 +3 -242 4472 1.65% 1.51%
Utah 3.917 4.203 0.286 4 = 215 440 1.49% 2.64%
Vermont 1.012 0.958 -0.053 1 = 453 2 0.03% 9.95%
Virginia 11.258 11.457 0.199 12 +1 -21 786 0.94% 0.90%
Washington 9.466 9.839 0.374 10 = -305 820 1.16% 0.43%
West Virginia 2.652 2.457 -0.195 2 -1 26 -6 -0.03% 0.21%
Wisconsin 8.010 7.642 -0.368 8 = -144 167 0.29% -0.14%
Wyoming 0.937 0.942 0.005 1 = 468 49 0.85% 11.30%
So Alabama would only need to increase its rate of increase from 0.34% to 0.37% to stave off loss of it 7th seat.
This is the same information, with states ordered on the smallest change needed for a more favorable outcome. Only states which could improve their outcome with a change in rate of increase of less than 0.50% are shown.
Alabama 6.737 6.461 -0.277 6 -1 9 165 0.34% 0.37% To avoid loss of 7th.
Arizona 8.999 9.417 0.418 9 = 33 828 1.22% 1.31% To gain 10th.
Oregon 5.408 5.450 0.042 5 = 21 336 0.84% 0.93% To gain 6th.
Minnesota 7.472 7.404 -0.068 7 -1 49 368 0.67% 0.82% To avoid loss of 8th.
Montana 1.478 1.483 0.005 1 = 9 82 0.80% 0.96% To gain 2nd.
West Virginia 2.652 2.457 -0.195 2 -1 26 -6 -0.03% 0.21% To avoid loss of 3rd.
Ohio 16.224 15.212 -1.012 15 -1 171 136 0.12% 0.37% To avoid loss of 16th.
Rhode Island 1.562 1.467 -0.095 1 -1 22 6 0.06% 0.42% To avoid loss of 2nd.
And here is the change that would result in a less favorable outcome.
New York 27.244 26.387 -0.856 27 = -38 877 0.44% 0.41% To lose 27th.
Virginia 11.258 11.457 0.199 12 +1 - 21 786 0.94% .90% To not gain 12th.
California 52.369 53.406 1.036 54 +1 -179 3747 0.96% 0.89% To not gain 54th.
Texas 35.350 38.580 3.230 39 +3 -242 4472 1.65% 1.51% To be +2, not +3.
Colorado 7.087 7.612 0.525 8 +1 -122 803 1.49% 1.12% To not gain 8th.
NorthCarolina 13.413 13.717 0.304 14 +1 -230 989 0.99% 0.60% To not gain 14th.
Florida 26.435 27.969 1.534 28 +1 -489 2668 1.34% 0.93% To not gain 28th.
Pennsylvania 17.862 16.813 -1.049 17 -1 -318 201 0.16% -0.28% To be -2, not -1.
Wisconsin 8.010 7.642 -0.368 8 = -144 167 0.29% -0.14% To lose 8th.
Illinois 18.043 16.873 -1.170 17 -1 -364 18 0.09% -0.40% To be -2, not -1.
If we regard any change of more than 0.50% in the annual rate of growth to be quite improbable, then the losses of one seat by IL, MI, and PA to be certain; as is the increase of +2 by Texas.
Title: Re: Census population estimates 2011-2019
Post by: jimrtex on December 26, 2014, 04:47:17 AM
Also:
NC to pass 10 million people for the 1st time ever in ca. 1 month.
NC had 9.944 million on July 1, 2014 and adds ca. 8K people each month.
NC to pass 10 million people for the 1st time ever in ca. 1 month.
NC had 9.944 million on July 1, 2014 and adds ca. 8K people each month.
This is interesting. North Carolina have similar populations, and quite similar rates of increase, but the components are quite distiffernt.
State Increase Natural Births Deaths Migration Intern. Domestic
Georgia 408,662 248,226 556,992 308,766 151,661 102,677 48,984
North Carolina 408,273 166,093 511,558 345,465 233,880 90,452 143,428
Georgia has a substantially higher natural increase, with more births and fewer deaths, which indicates a younger population, or possibly a larger share of the population is Black and Hispanic. Yet net domestic migration is much higher in North Carolina. Interstate movers are typically in their 20s, moving for employment or adventure reasons, and would be expected to provide a base of child-bearers, who aren't dying for a few more decades.
Is there substantial movement from Atlanta back to southern states, such that the net change is small? Is there a difference due to the dominance of Atlanta, which leaves a vast rural area, whereas in North Carolina you have Charlotte, Raleigh-Durham, and Greensboro-Winston-Salem.
Title: Re: Census population estimates 2011-2019
Post by: hopper on March 08, 2015, 12:46:08 AM
Domestic Migration Gains 2010-2014(rounded to the nearest thousandth.)
Texas: 522,600
Florida 449.900
North Carolina 143.400
Colorado 140,100
Arizona 116,300
South Carolina 112,300
Tennessee 84,300
Washington 84,000
Oregon 58,300
Georgia 48,900
Top Domestic Migration Losses
New York -486,580
Illinois -318,987
New Jersey -204,197
California -189,282
Michigan -153,159
Ohio -122,031
Pennsylvania -89,155
Connecticut -75,852
Missouri -43,539
Kansas -40,173
Title: Re: Census population estimates 2011-2019
Post by: hopper on March 08, 2015, 01:12:43 AM
Top International Population Gains by State(2010-2014)
California 648,856
New York 485,224
Florida 467,201
Texas 343,093
New Jersey 211,165
Massachusetts 151,731
Virginia 141,687
Illinois 128,843
Maryland 118,187
Pennsylvania 118,159
California 648,856
New York 485,224
Florida 467,201
Texas 343,093
New Jersey 211,165
Massachusetts 151,731
Virginia 141,687
Illinois 128,843
Maryland 118,187
Pennsylvania 118,159
Title: Re: Census population estimates 2011-2019
Post by: hopper on March 08, 2015, 01:49:29 AM
Top Migration Gains(International and Domestic Combined.) (2010-2014)
Florida 917,135
Texas 905,754
California 459,574
North Carolina 233,880
Colorado 183,324
Washington 179,873
Arizona 172,848
Georgia 151,661
Virginia 145,072
South Carolina 139,545
Top Migration Losses(International and Domestic Combined.)
Illinois -190,144
Michigan -72,674
Ohio -50,959
New Mexico -18,886
Mississippi -16,999
Kansas -15,299
Wisconsin -11,288
Missouri -8,048
Connecticut -5,861
Alaska -4,700
Title: Re: Census population estimates 2011-2019
Post by: President Punxsutawney Phil on March 08, 2015, 01:53:00 AM
Top Migration Gains(International and Domestic Combined.) (2010-2014)
Florida 917,135
Texas 905,754
California 459,574
North Carolina 233,880
Colorado 183,324
Washington 179,873
Arizona 172,848
Georgia 151,661
Virginia 145,072
South Carolina 139,545
Top Migration Losses(International and Domestic Combined.)
Illinois -190,144
Michigan -72,674
Ohio -50,959
New Mexico -18,886
Mississippi -16,999
Kansas -15,299
Wisconsin -11,288
Missouri -8,048
Connecticut -5,861
Alaska -4,700
Florida 917,135
Texas 905,754
California 459,574
North Carolina 233,880
Colorado 183,324
Washington 179,873
Arizona 172,848
Georgia 151,661
Virginia 145,072
South Carolina 139,545
Top Migration Losses(International and Domestic Combined.)
Illinois -190,144
Michigan -72,674
Ohio -50,959
New Mexico -18,886
Mississippi -16,999
Kansas -15,299
Wisconsin -11,288
Missouri -8,048
Connecticut -5,861
Alaska -4,700
Almost a million for Florida and Texas? Truely surprising. Illinois losing almost 200,000 is also very surprising.
Title: Re: Census population estimates 2011-2019
Post by: Flake on March 08, 2015, 07:29:19 PM
Top Migration Gains(International and Domestic Combined.) (2010-2014)
Florida 917,135
Texas 905,754
California 459,574
North Carolina 233,880
Colorado 183,324
Washington 179,873
Arizona 172,848
Georgia 151,661
Virginia 145,072
South Carolina 139,545
Top Migration Losses(International and Domestic Combined.)
Illinois -190,144
Michigan -72,674
Ohio -50,959
New Mexico -18,886
Mississippi -16,999
Kansas -15,299
Wisconsin -11,288
Missouri -8,048
Connecticut -5,861
Alaska -4,700
Florida 917,135
Texas 905,754
California 459,574
North Carolina 233,880
Colorado 183,324
Washington 179,873
Arizona 172,848
Georgia 151,661
Virginia 145,072
South Carolina 139,545
Top Migration Losses(International and Domestic Combined.)
Illinois -190,144
Michigan -72,674
Ohio -50,959
New Mexico -18,886
Mississippi -16,999
Kansas -15,299
Wisconsin -11,288
Missouri -8,048
Connecticut -5,861
Alaska -4,700
We're #1! :D
Title: Re: Census population estimates 2011-2019
Post by: muon2 on March 08, 2015, 08:36:40 PM
Top Migration Gains(International and Domestic Combined.) (2010-2014)
Florida 917,135
Texas 905,754
California 459,574
North Carolina 233,880
Colorado 183,324
Washington 179,873
Arizona 172,848
Georgia 151,661
Virginia 145,072
South Carolina 139,545
Top Migration Losses(International and Domestic Combined.)
Illinois -190,144
Michigan -72,674
Ohio -50,959
New Mexico -18,886
Mississippi -16,999
Kansas -15,299
Wisconsin -11,288
Missouri -8,048
Connecticut -5,861
Alaska -4,700
Florida 917,135
Texas 905,754
California 459,574
North Carolina 233,880
Colorado 183,324
Washington 179,873
Arizona 172,848
Georgia 151,661
Virginia 145,072
South Carolina 139,545
Top Migration Losses(International and Domestic Combined.)
Illinois -190,144
Michigan -72,674
Ohio -50,959
New Mexico -18,886
Mississippi -16,999
Kansas -15,299
Wisconsin -11,288
Missouri -8,048
Connecticut -5,861
Alaska -4,700
We're #1! :D
So are we. :(
Title: Re: Census population estimates 2011-2019
Post by: hopper on March 15, 2015, 01:40:13 AM
Top 10 Natural Population Increases(2010-2014.)
Texas 1,711,241
California 1,466,489
Florida 1,041,077
North Carolina 384,476
Georgia 382, 879
New York 345,360
Washington 319,619
Arizona 319,485
Colorado 307,291
Virginia 300,913
Top 10 Slowest Natural Population Increases(2010-2014)
West Virginia -3,850
Vermont 770
Rhode Island 2,095
Maine 2,728
New Hampshire 10,296
Connecticut 17,332
Wyoming 19,795
New Mexico 20,622
Alaska 22,876
Mississippi 23,368
Title: Re: Census population estimates 2011-2019
Post by: KingSweden on March 23, 2015, 07:59:47 PM
Top Migration Gains(International and Domestic Combined.) (2010-2014)
Florida 917,135
Texas 905,754
California 459,574
North Carolina 233,880
Colorado 183,324
Washington 179,873
Arizona 172,848
Georgia 151,661
Virginia 145,072
South Carolina 139,545
Top Migration Losses(International and Domestic Combined.)
Illinois -190,144
Michigan -72,674
Ohio -50,959
New Mexico -18,886
Mississippi -16,999
Kansas -15,299
Wisconsin -11,288
Missouri -8,048
Connecticut -5,861
Alaska -4,700
Florida 917,135
Texas 905,754
California 459,574
North Carolina 233,880
Colorado 183,324
Washington 179,873
Arizona 172,848
Georgia 151,661
Virginia 145,072
South Carolina 139,545
Top Migration Losses(International and Domestic Combined.)
Illinois -190,144
Michigan -72,674
Ohio -50,959
New Mexico -18,886
Mississippi -16,999
Kansas -15,299
Wisconsin -11,288
Missouri -8,048
Connecticut -5,861
Alaska -4,700
We're #1! :D
So are we. :(
Where in Illinois are these people leaving from? Downstate or Chicagoland?
Title: Re: Census population estimates 2011-2019
Post by: Gass3268 on March 23, 2015, 08:23:49 PM
Top Migration Gains(International and Domestic Combined.) (2010-2014)
Florida 917,135
Texas 905,754
California 459,574
North Carolina 233,880
Colorado 183,324
Washington 179,873
Arizona 172,848
Georgia 151,661
Virginia 145,072
South Carolina 139,545
Top Migration Losses(International and Domestic Combined.)
Illinois -190,144
Michigan -72,674
Ohio -50,959
New Mexico -18,886
Mississippi -16,999
Kansas -15,299
Wisconsin -11,288
Missouri -8,048
Connecticut -5,861
Alaska -4,700
Florida 917,135
Texas 905,754
California 459,574
North Carolina 233,880
Colorado 183,324
Washington 179,873
Arizona 172,848
Georgia 151,661
Virginia 145,072
South Carolina 139,545
Top Migration Losses(International and Domestic Combined.)
Illinois -190,144
Michigan -72,674
Ohio -50,959
New Mexico -18,886
Mississippi -16,999
Kansas -15,299
Wisconsin -11,288
Missouri -8,048
Connecticut -5,861
Alaska -4,700
We're #1! :D
So are we. :(
Where in Illinois are these people leaving from? Downstate or Chicagoland?
We'll find out on Thursday when the county estimates are released.
Title: Re: Census population estimates 2011-2019
Post by: KingSweden on March 24, 2015, 08:43:38 AM
Top Migration Gains(International and Domestic Combined.) (2010-2014)
Florida 917,135
Texas 905,754
California 459,574
North Carolina 233,880
Colorado 183,324
Washington 179,873
Arizona 172,848
Georgia 151,661
Virginia 145,072
South Carolina 139,545
Top Migration Losses(International and Domestic Combined.)
Illinois -190,144
Michigan -72,674
Ohio -50,959
New Mexico -18,886
Mississippi -16,999
Kansas -15,299
Wisconsin -11,288
Missouri -8,048
Connecticut -5,861
Alaska -4,700
Florida 917,135
Texas 905,754
California 459,574
North Carolina 233,880
Colorado 183,324
Washington 179,873
Arizona 172,848
Georgia 151,661
Virginia 145,072
South Carolina 139,545
Top Migration Losses(International and Domestic Combined.)
Illinois -190,144
Michigan -72,674
Ohio -50,959
New Mexico -18,886
Mississippi -16,999
Kansas -15,299
Wisconsin -11,288
Missouri -8,048
Connecticut -5,861
Alaska -4,700
We're #1! :D
So are we. :(
Where in Illinois are these people leaving from? Downstate or Chicagoland?
We'll find out on Thursday when the county estimates are released.
So Thursday is the day, then? Very exciting. I look forward to the county estimates more than the state ones.
Title: Re: Census population estimates 2011-2019
Post by: Tender Branson on December 10, 2015, 01:36:40 PM
On December 22 to be exact.
Some early trends from states who are releasing their own population estimates before the Census Bureau:
California (Jan. 1, 2015): +0.9% (+358.000)
http://www.dof.ca.gov/research/demographic/reports/estimates/e-1/view.php
Florida (April 1, 2015): +1.6% (+308.000)
http://www.edr.state.fl.us/Content/population-demographics/data/FLcopops.xls
Washington (April 1, 2015): +1.3% (+93.000)
http://www.ofm.wa.gov/pop/april1
Colorado (July 1, 2015): +1.7% (+90.000)
https://www.colorado.gov/pacific/dola/population-data-components-change
Oregon (July 1, 2015): +1.3% (+51.000)
https://www.pdx.edu/prc/sites/www.pdx.edu.prc/files/PrelimEst2015_Web.xlsx
...
These numbers would indicate a slightly higher population growth for the US compared with the year before (maybe up by 2.4-2.5 million compared with the 2.36 million between 2013-14).
But this is based only on these handful of states and their estimates are often totally different to the ones from the Census Bureau.
Title: Re: Census population estimates 2011-2019
Post by: Ban my account ffs! on December 10, 2015, 11:23:16 PM
I'd imagine growth slowed down significantly in North Dakota. The boom is over for the time being so I'd imagine many have left the state again.
Minnesota is probably around +0.7%. Domestic migration continues negative even though millennials are moving to the state (esp the 25-34 age group). It is being offset by baby boomers leaving.
Minnesota is probably around +0.7%. Domestic migration continues negative even though millennials are moving to the state (esp the 25-34 age group). It is being offset by baby boomers leaving.
Title: Re: Census population estimates 2011-2019
Post by: cinyc on December 10, 2015, 11:44:07 PM
I'd imagine growth slowed down significantly in North Dakota. The boom is over for the time being so I'd imagine many have left the state again.
Minnesota is probably around +0.7%. Domestic migration continues negative even though millennials are moving to the state (esp the 25-34 age group). It is being offset by baby boomers leaving.
Minnesota is probably around +0.7%. Domestic migration continues negative even though millennials are moving to the state (esp the 25-34 age group). It is being offset by baby boomers leaving.
The county population estimates will be even more interesting in North Dakota and Texas when they are released. Many of the fastest-growing counties in the past few years have been in the oil patch in those states. Will those become the fastest-declining counties now? Statewide, will North Dakota just have slowed growth or has it gone in reverse? The economies of the non-oil patch cities like Fargo are still vibrant, so growth probably isn't negative statewide yet.
Title: Re: Census population estimates 2011-2019
Post by: Ban my account ffs! on December 10, 2015, 11:52:47 PM
I'd imagine the census won't catch the rapid migration due to the oil boom... at least not this year. So I'd say ND will still have decent growth. The price crash was thought to be very temporary and many banks still lent money to oil companies until quite recently.
But even during the rush many employees were doing 2 weeks on 2 weeks off rotations and many of those people were commuting from Minnesota. A guy I know bought a house that way... in MN of course.
But even during the rush many employees were doing 2 weeks on 2 weeks off rotations and many of those people were commuting from Minnesota. A guy I know bought a house that way... in MN of course.
Title: Re: Census population estimates 2011-2019
Post by: Tender Branson on December 11, 2015, 01:39:01 AM
Yeah, ND's growth of over 2% in the previous years will end with the new estimates.
In the November jobs report, ND lost almost 10.000 jobs compared with November 2014 - a decline of more than 2% - which means people are likely moving out of the state again.
I guess ND's population growth is down from 2.2% to ~1% in the new estimates.
http://www.bls.gov/news.release/laus.nr0.htm
Also, another state which is badly hit by the mining/oil downturn is West Virginia, which is already one of the slowest growing (or already declining) states due to more deaths than births and almost no migration.
The state lost 14.000 jobs between Nov. 2014 and Nov. 2015, the only state to do so after ND.
Also, Texas' job growth almost halved as well (growing by 400K in previous years, but only 200K in the past year.
In general this could mean that states like NV, CO and UT are now the fastest-growing states in the country, with TX close behind. ND could actually fall out of the top-10 and states like WV could lose population at a higher clip ...
Title: Re: Census population estimates 2011-2019
Post by: DINGO Joe on December 11, 2015, 01:31:36 PM
Yeah, it would be quite an upset if anyone could compete with WV as biggest loser.
Title: Re: Census population estimates 2011-2019
Post by: Tender Branson on December 12, 2015, 01:53:06 AM
New AZ numbers:
July 1, 2015: +1.4% (+91.000)
https://population.az.gov/population-estimates
July 1, 2015: +1.4% (+91.000)
https://population.az.gov/population-estimates
Title: Re: Census population estimates 2011-2019
Post by: muon2 on December 13, 2015, 03:14:48 PM
Yeah, it would be quite an upset if anyone could compete with WV as biggest loser.
Last year IL lost more in total pop than WV.
Title: Re: Census population estimates 2011-2019
Post by: DINGO Joe on December 14, 2015, 01:17:24 AM
Yeah, it would be quite an upset if anyone could compete with WV as biggest loser.
Last year IL lost more in total pop than WV.
Not percentage wise, and no matter what travails Illinois may be facing they don't come anywhere close to the demographic and public health problems WV has.
Title: Re: Census population estimates 2011-2019
Post by: Tender Branson on December 17, 2015, 01:41:39 AM
New CA numbers for July 1, 2015 came out yesterday:
http://www.dof.ca.gov/research/demographic/reports/estimates/e-2/documents/pressrelease_package_Jul15.pdf
http://www.dof.ca.gov/research/demographic/reports/estimates/e-2/documents/pressrelease_package_Jul15.pdf
Title: Re: Census population estimates 2011-2019
Post by: muon2 on December 17, 2015, 07:45:06 AM
New CA numbers for July 1, 2015 came out yesterday:
http://www.dof.ca.gov/research/demographic/reports/estimates/e-2/documents/pressrelease_package_Jul15.pdf
http://www.dof.ca.gov/research/demographic/reports/estimates/e-2/documents/pressrelease_package_Jul15.pdf
Net domestic migration remains negative with foreign migration slightly more than replacing the domestic outflow. They largely cancel, and the growth is mostly natural growth from births minus deaths.
Title: Re: Census population estimates 2011-2019
Post by: Torie on December 17, 2015, 08:32:09 AM
New CA numbers for July 1, 2015 came out yesterday:
http://www.dof.ca.gov/research/demographic/reports/estimates/e-2/documents/pressrelease_package_Jul15.pdf
http://www.dof.ca.gov/research/demographic/reports/estimates/e-2/documents/pressrelease_package_Jul15.pdf
My goodness, Orange and San Diego counties have below average growth in CA, while San Francisco is considerably above it. Hip inner city urban areas are the cat's meow now. :)
Title: Re: Census population estimates 2011-2019
Post by: Cubby on December 18, 2015, 11:57:08 PM
Florida will reach 20,000,000 people. Only a few more years till it's bigger than Australia.
Oil prices started to plunge in Fall 2014, the estimates are for 7/1/15, so its possible North Dakota's rate will slow, but its probably too soon. Though if we have more weeks like this one, with oil below $35 a barrel, then we'll be back to 80's (declining) or 90's (slowest growing in the nation) rates of growth. Then hopefully we can find some land there for Buffalo Commons.
Oil prices started to plunge in Fall 2014, the estimates are for 7/1/15, so its possible North Dakota's rate will slow, but its probably too soon. Though if we have more weeks like this one, with oil below $35 a barrel, then we'll be back to 80's (declining) or 90's (slowest growing in the nation) rates of growth. Then hopefully we can find some land there for Buffalo Commons.
Title: Re: Census population estimates 2011-2019
Post by: Tender Branson on December 19, 2015, 10:30:09 AM
Also, NC will break 10 Mio. people for the first time.
AZ will overtake MA.
TN could overtake IN, but probably not this year but next.
MD will break 6 Mio. people for the first time.
SC will overtake AL.
OR will break 4 Mio. people for the first time.
MS and AR might break 3 Mio. people for the first time (but it's more likely that UT does before them).
NH could pass ME.
Puerto Rico could drop below 3.5 Mio. people.
Title: Re: Census population estimates 2011-2019
Post by: Tender Branson on December 22, 2015, 12:56:24 AM
These will be out later today ...
Title: Re: Census population estimates 2011-2019
Post by: Vern on December 22, 2015, 01:54:04 AM
should be interesting
Title: Re: Census population estimates 2011-2019
Post by: muon2 on December 22, 2015, 09:55:04 AM
Here's my annual projection from the new estimates. I used the July 2015 estimates and the April 2010 Census base to get an annual growth rate. This correctly accounts for the 5 and a quarter year period between the Census and the estimate. I then applied the annual growth rate to the 2010 reapportionment population to get the 2020 projection. This accounts for the extra overseas population used in reapportionment but not for redistricting. Ten years is a long stretch for a simple model like this, but here are the projected changes.
AL -1
AZ +1
CA +1
CO +1
FL +1
IL -1
MI -1
MN -1
NY -1
NC +1
OH -1
OR +1
PA -1
RI -1
TX +3
WV -1
There a number of changes since my projections last year (https://uselectionatlas.org/FORUM/index.php?topic=203537.msg4424230#msg4424230). AL is down, AZ is up, OR is up and VA isn't up. The bubble seats in this projection are based on the last five awarded and the next five in line.
The last five awarded are CA-53, TX-39, OR-6, CA-54, and AZ-10 (#435).
The next five in line are FL-29, AL-7, VA-12, NY-27, MT-2.
Title: Re: Census population estimates 2011-2019
Post by: Torie on December 22, 2015, 10:07:39 AM
How close is NY to the cusp given your latest projections? I ask, because my little CD will have a very new design given the shape of the state and where I am, if it loses a CD. It will become a much more suburban CD. And Nolan in MN-08 will be happy if MN loses a CD. His CD per your rules is slated to become more Dem as it loses Pub areas on its south end.
Title: Re: Census population estimates 2011-2019
Post by: jimrtex on December 22, 2015, 10:23:07 AM
Here's my annual projection from the new estimates. I used the July 2015 estimates and the April 2010 Census base to get an annual growth rate. This correctly accounts for the 3 and a quarter year period between the Census and the estimate.
4-1/4 ?
Title: Re: Census population estimates 2011-2019
Post by: muon2 on December 22, 2015, 10:32:27 AM
Here's my annual projection from the new estimates. I used the July 2015 estimates and the April 2010 Census base to get an annual growth rate. This correctly accounts for the 3 and a quarter year period between the Census and the estimate.
4-1/4 ?
fixed: 5 1/4
Title: Re: Census population estimates 2011-2019
Post by: muon2 on December 22, 2015, 10:37:41 AM
How close is NY to the cusp given your latest projections? I ask, because my little CD will have a very new design given the shape of the state and where I am, if it loses a CD. It will become a much more suburban CD. And Nolan in MN-08 will be happy if MN loses a CD. His CD per your rules is slated to become more Dem as it loses Pub areas on its south end.
NY would need about 300K more people than it is currently on track for by 2020. Alternatively there needs t be a significant slow down in the fast growing states, much like the Great Recession kept AZ from going to 10 last time.
BTW if I only use the last two years to make my projection, CA won't gain but FL will gain 2.
Title: Re: Census population estimates 2011-2019
Post by: Asian Nazi on December 22, 2015, 12:18:37 PM
Nice to see Oregon gaining a seat in your projection. :)
Also didn't realize that Montana was so close to gaining a second district. It looks like the new Rhode Island At-Large would take Montana's place for largest single district by population.
Also didn't realize that Montana was so close to gaining a second district. It looks like the new Rhode Island At-Large would take Montana's place for largest single district by population.
Title: Re: Census population estimates 2011-2019
Post by: Tender Branson on December 22, 2015, 12:54:49 PM
In addition to FL breaking 20 million, let's see how my estimates turned out:
Also, NC will break 10 Mio. people for the first time. TRUE
AZ will overtake MA. TRUE
TN could overtake IN, but probably not this year but next. TRUE (next year)
MD will break 6 Mio. people for the first time. TRUE
SC will overtake AL. TRUE
OR will break 4 Mio. people for the first time. TRUE
MS and AR might break 3 Mio. people for the first time (but it's more likely that UT does before them). Semi-true: MS and AR did not break 3 million, but UT overtook them with 2.996 million and definitely is above 3 million already.
NH could pass ME. TRUE
Puerto Rico could drop below 3.5 Mio. people. TRUE
Title: Re: Census population estimates 2011-2019
Post by: Tender Branson on December 22, 2015, 01:02:09 PM
Here's my annual projection from the new estimates. I used the July 2015 estimates and the April 2010 Census base to get an annual growth rate. This correctly accounts for the 5 and a quarter year period between the Census and the estimate. I then applied the annual growth rate to the 2010 reapportionment population to get the 2020 projection. This accounts for the extra overseas population used in reapportionment but not for redistricting. Ten years is a long stretch for a simple model like this, but here are the projected changes.
AL -1
AZ +1
CA +1
CO +1
FL +1
IL -1
MI -1
MN -1
NY -1
NC +1
OH -1
OR +1
PA -1
RI -1
TX +3
WV -1
There a number of changes since my projections last year (https://uselectionatlas.org/FORUM/index.php?topic=203537.msg4424230#msg4424230). AL is down, AZ is up, OR is up and VA isn't up. The bubble seats in this projection are based on the last five awarded and the next five in line.
The last five awarded are CA-53, TX-39, OR-6, CA-54, and AZ-10 (#435).
The next five in line are FL-29, AL-7, VA-12, NY-27, MT-3.
So, Obama-states are projected to lose 7 EV (IL, MI, MN, NY, OH, PA, RI) - while gaining 4 (CA, CO, FL, OR) - for a net loss of 3 EV.
Romney-states gain 5 (3TX, AZ, NC), while losing 2 (AL, WV) - for a net gain of 3 EV.
Title: Re: Census population estimates 2011-2019
Post by: muon2 on December 22, 2015, 01:05:39 PM
Yeah, it would be quite an upset if anyone could compete with WV as biggest loser.
Last year IL lost more in total pop than WV.
Not percentage wise, and no matter what travails Illinois may be facing they don't come anywhere close to the demographic and public health problems WV has.
IL lost more this year than last, though WV slightly edges IL in percent loss.
Title: Re: Census population estimates 2011-2019
Post by: Tender Branson on December 22, 2015, 01:59:06 PM
The national and state "components of population change" are also interesting:
The US had 3.986 million births last year and 2.625 million deaths (natural increase = 1.361 million).
It also had an international migration surplus of 1.151 million - for a total growth of 2.512 million people (+0.8%).
That means ca. 54% of the population growth came from natural increase and 46% from a migration gain.
...
Looking at the states, CA/NY/FL/TX/NJ were the biggest magnets for international migrants - while basically no person from abroad moved to WY/MT/VT/WV/ME.
The 10 states with the biggest domestic migration (= people moving between the states) gains were FL, TX, CO, AZ, SC, WA, NC, OR, GA and NV.
The 10 states with the biggest domestic migration losses were NY, IL, CA, NJ, PA, MI, OH, CT, MD and VA.
Only 2 states had more deaths than births: WV and ME.
Puerto Rico's population dropped by more than 60.000 people (or 1.7%)
Title: Re: Census population estimates 2011-2019
Post by: Tender Branson on December 22, 2015, 02:13:37 PM
Also, what has not been mentioned so far:
North Dakota actually remained the fastest-growing state between 2014-15, despite the downturn in the oil/gas sector in the past year.
ND grew by 2.3%, followed by CO/DC/NV (each +1.9%)
North Dakota actually remained the fastest-growing state between 2014-15, despite the downturn in the oil/gas sector in the past year.
ND grew by 2.3%, followed by CO/DC/NV (each +1.9%)
Title: Re: Census population estimates 2011-2019
Post by: Tender Branson on December 22, 2015, 02:22:05 PM
And not only that: ND also had the biggest domestic migration gains (= most people moving into a state from other states) per capita last year.
ND gained 10.000 people from other states in the past year - giving it a 13.2/1000 net domestic migration gain.
FL and CO followed far behind with 10/1000.
The state with the worst loss (= most people moving away to other states) was actually Alaska - which had almost 8.000 people leaving for other states and giving the state a -10.4/1000 net domestic migration loss.
Title: Re: Census population estimates 2011-2019
Post by: Tender Branson on December 22, 2015, 02:26:34 PM
Also, does anyone know why VA turned from a magnet for US citizens from other states between 2000-2010 to being in the top-10 of states with the most Americans leaving to other states ?
Title: Re: Census population estimates 2011-2019
Post by: muon2 on December 22, 2015, 04:00:28 PM
Also, does anyone know why VA turned from a magnet for US citizens from other states between 2000-2010 to being in the top-10 of states with the most Americans leaving to other states ?
During the Great Recession the government sector was one of the few growth areas, particularly as driven by the stimulus. That may be a factor in VA. As the rest of the economy has picked up, VA doesn't stand out anymore. It would be consistent with my projection making a seat gain less likely than last year.
Title: Re: Census population estimates 2011-2019
Post by: Kevinstat on December 22, 2015, 05:53:01 PM
Here's my annual projection from the new estimates. I used the July 2015 estimates and the April 2010 Census base to get an annual growth rate. This correctly accounts for the 5 and a quarter year period between the Census and the estimate. I then applied the annual growth rate to the 2010 reapportionment population to get the 2020 projection. This accounts for the extra overseas population used in reapportionment but not for redistricting. Ten years is a long stretch for a simple model like this, but here are the projected changes.
AL -1
AZ +1
CA +1
CO +1
FL +1
IL -1
MI -1
MN -1
NY -1
NC +1
OH -1
OR +1
PA -1
RI -1
TX +3
WV -1
There a number of changes since my projections last year (https://uselectionatlas.org/FORUM/index.php?topic=203537.msg4424230#msg4424230). AL is down, AZ is up, OR is up and VA isn't up. The bubble seats in this projection are based on the last five awarded and the next five in line.
The last five awarded are CA-53, TX-39, OR-6, CA-54, and AZ-10 (#435).
The next five in line are FL-29, AL-7, VA-12, NY-27, MT-3.
AL -1
AZ +1
CA +1
CO +1
FL +1
IL -1
MI -1
MN -1
NY -1
NC +1
OH -1
OR +1
PA -1
RI -1
TX +3
WV -1
There a number of changes since my projections last year (https://uselectionatlas.org/FORUM/index.php?topic=203537.msg4424230#msg4424230). AL is down, AZ is up, OR is up and VA isn't up. The bubble seats in this projection are based on the last five awarded and the next five in line.
The last five awarded are CA-53, TX-39, OR-6, CA-54, and AZ-10 (#435).
The next five in line are FL-29, AL-7, VA-12, NY-27, MT-3.
Do you mean MT-2 here? Or WV-3?
Title: Re: Census population estimates 2011-2019
Post by: muon2 on December 22, 2015, 09:51:32 PM
Here's my annual projection from the new estimates. I used the July 2015 estimates and the April 2010 Census base to get an annual growth rate. This correctly accounts for the 5 and a quarter year period between the Census and the estimate. I then applied the annual growth rate to the 2010 reapportionment population to get the 2020 projection. This accounts for the extra overseas population used in reapportionment but not for redistricting. Ten years is a long stretch for a simple model like this, but here are the projected changes.
AL -1
AZ +1
CA +1
CO +1
FL +1
IL -1
MI -1
MN -1
NY -1
NC +1
OH -1
OR +1
PA -1
RI -1
TX +3
WV -1
There a number of changes since my projections last year (https://uselectionatlas.org/FORUM/index.php?topic=203537.msg4424230#msg4424230). AL is down, AZ is up, OR is up and VA isn't up. The bubble seats in this projection are based on the last five awarded and the next five in line.
The last five awarded are CA-53, TX-39, OR-6, CA-54, and AZ-10 (#435).
The next five in line are FL-29, AL-7, VA-12, NY-27, MT-3.
AL -1
AZ +1
CA +1
CO +1
FL +1
IL -1
MI -1
MN -1
NY -1
NC +1
OH -1
OR +1
PA -1
RI -1
TX +3
WV -1
There a number of changes since my projections last year (https://uselectionatlas.org/FORUM/index.php?topic=203537.msg4424230#msg4424230). AL is down, AZ is up, OR is up and VA isn't up. The bubble seats in this projection are based on the last five awarded and the next five in line.
The last five awarded are CA-53, TX-39, OR-6, CA-54, and AZ-10 (#435).
The next five in line are FL-29, AL-7, VA-12, NY-27, MT-3.
Do you mean MT-2 here? Or WV-3?
MT-2. Fixed.
Title: Re: Census population estimates 2011-2019
Post by: cinyc on December 22, 2015, 09:59:59 PM
Also, what has not been mentioned so far:
North Dakota actually remained the fastest-growing state between 2014-15, despite the downturn in the oil/gas sector in the past year.
ND grew by 2.3%, followed by CO/DC/NV (each +1.9%)
North Dakota actually remained the fastest-growing state between 2014-15, despite the downturn in the oil/gas sector in the past year.
ND grew by 2.3%, followed by CO/DC/NV (each +1.9%)
North Dakota's growth rate from 2014-15 was about the same as the growth rate from 2013-14. So much for growth slowing down.
The only state to lose population since the 2010 Census is West Virginia. (Puerto Rico has also lost over 250,000 residents over that time period.) Maine and Vermont grew by less than 1,000 people over that time frame. Meanwhile, Texas added more residents than live in many states - over 2.3 million.
I think D.C. is actually the second-fastest growing state or territory over that time period, behind North Dakota. If North Dakota growth starts to fall soon, D.C. might end up being the fastest-growing jurisdiction this decade.
Title: Re: Census population estimates 2011-2019
Post by: tschandler on December 22, 2015, 11:42:10 PM
Alabama is intriguing. Granted my experience is limited to North Alabama (the Black belt may certainly be shrinking) but in our rural area of Northeast Alabama we are experiencing solid growth. I have new neighbors/students from California, Oregon, Texas, Alaska, Tennessee, Florida, and Nevada. It is known that rural Alabama is a combination of what rural Texas and Florida were a generation ago (cheap open farmland and people retiring because Alabama doesn't tax retirement/social security).
And Huntsville is rapidly growing.
And Huntsville is rapidly growing.
Title: Re: Census population estimates 2011-2019
Post by: DINGO Joe on December 23, 2015, 12:45:52 AM
Yeah, it would be quite an upset if anyone could compete with WV as biggest loser.
Last year IL lost more in total pop than WV.
Not percentage wise, and no matter what travails Illinois may be facing they don't come anywhere close to the demographic and public health problems WV has.
IL lost more this year than last, though WV slightly edges IL in percent loss.
IL certainly gave it the old college try
Title: Re: Census population estimates 2011-2019
Post by: DINGO Joe on December 23, 2015, 01:12:14 AM
Alabama is intriguing.
No, no it's not.
Title: Re: Census population estimates 2011-2019
Post by: DINGO Joe on December 23, 2015, 01:22:03 AM
Nice to see Oregon gaining a seat in your projection. :)
Also didn't realize that Montana was so close to gaining a second district. It looks like the new Rhode Island At-Large would take Montana's place for largest single district by population.
Also didn't realize that Montana was so close to gaining a second district. It looks like the new Rhode Island At-Large would take Montana's place for largest single district by population.
Montana has actually had some spillover from the drilling boom in adjacent states. It may struggle sustaining any growth going forward, especially in the Eastern part of the state.
Title: Re: Census population estimates 2011-2019
Post by: Tender Branson on December 23, 2015, 01:28:52 AM
Also, what's with New Mexico ?
It even lost population last year, while most western states saw high growth - even the Plain states did better than NM.
It even lost population last year, while most western states saw high growth - even the Plain states did better than NM.
Title: Re: Census population estimates 2011-2019
Post by: DINGO Joe on December 23, 2015, 01:32:27 AM
Also, what's with New Mexico ?
It even lost population last year, while most western states saw high growth - even the Plain states did better than NM.
It even lost population last year, while most western states saw high growth - even the Plain states did better than NM.
I guess it's the Mississippi of the Rockies.
Title: Re: Census population estimates 2011-2019
Post by: Tender Branson on December 23, 2015, 01:41:56 AM
Here's a map of states which have all 3 factors:
A) a natural increase (more births than deaths)
B) a positive international migration balance
C) a positive domestic migration balance (more people coming from other states than moving out)
(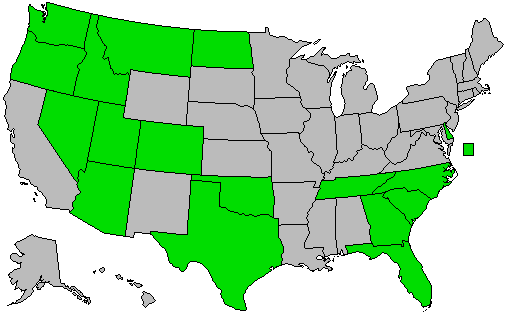 )
)
A) a natural increase (more births than deaths)
B) a positive international migration balance
C) a positive domestic migration balance (more people coming from other states than moving out)
(
Title: Re: Census population estimates 2011-2019
Post by: jimrtex on December 23, 2015, 04:22:08 AM
Alabama is intriguing. Granted my experience is limited to North Alabama (the Black belt may certainly be shrinking) but in our rural area of Northeast Alabama we are experiencing solid growth. I have new neighbors/students from California, Oregon, Texas, Alaska, Tennessee, Florida, and Nevada. It is known that rural Alabama is a combination of what rural Texas and Florida were a generation ago (cheap open farmland and people retiring because Alabama doesn't tax retirement/social security).
And Huntsville is rapidly growing.
And Huntsville is rapidly growing.
The national growth rate (2010 to 2020) is 8.0%, while for Alabama is 3.2%.
Title: Re: Census population estimates 2011-2019
Post by: jimrtex on December 23, 2015, 04:55:06 AM
If we were doing continuous reapportionment, Florida (28) and Oregon (6) would have gained a seat, and Illinois (17) and Michigan (13) would have lost a seat. These would be in addition to previous gains in for Texas (37) and North Carolina (14), and losses for Minnesota (7) and Pennsylvania (17).
In Michigan this would could result in the Detroit UCC adding Washtenaw or Genesee to keep 6 districts.
2014 projected gains: CA, CO, FL, NC, TX (+3), VA
2015 projected gains: AZ, CA, CO, FL, NC, OR TX (+3)
So not only is Oregon projected to now add a seat, it has already reached the level needed.
2014 projected losses: AL, IL, MI, MN, OH, PA, RI, WV
2015 projected losses: AL, IL, MI, MN, NY, OH, PA, RI, WV
While it now appears that New York will extend a 7-decade string of losing districts, this will be the first without multiple losses.
Title: Re: Census population estimates 2011-2019
Post by: jimrtex on December 23, 2015, 07:04:52 AM
The first column is the fractional entitlement for 2010, the second column for 2020, and the 3rd column the difference between the two. That is, Alabama has lost about 0.299 of a representative between 2010 and 2020. States with a negative change are growing slower than the United States as a whole. Those with a positive change are growing faster (increasing their representational share). The fourth and fifth columns show the projected 2020 apportionment, and the change from 2010.
The next column is the change (in 1000s) for a state not being rounded, to get an additional seat. That is, if Alabama were to gain an additional 20K persons beyond what it is projected by 2020, it would retain its 7th seat. For a state that is rounded, it is the decrease needed to cause the lost of rounding. The next column is the projected change (in 1000s). Alabama is projected to add 152K between 2010 and 2020. The next column is the annualized growth rate projected between 2010 and 2020. The final column is the annualized growth rate needed over the remainder of the decade to cause a change in projected apportionment. Alabama is projected to increase at a 0.31% annual rate. If it were to gain at a 0.40% rate for the remainder of the decade it would retain the 7th seat.
States with some uncertainty are in red.
State 2010 2020 Change Apportion More Change Proj. Needed
Alabama 6.737 6.438 -0.299 6 -1 20 152 0.31% 0.40%
Alaska 1.117 1.114 -0.003 1 = 316 55 0.74% 8.34%
Arizona 8.999 9.447 0.448 10 +1 -22 856 1.26% 1.20%
Arkansas 4.129 3.982 -0.147 4 = -397 120 0.40% -2.52%
California 52.369 53.283 0.914 54 +1 -189 3684 0.95% 0.85%
Colorado 7.087 7.662 0.575 8 +1 -174 845 1.57% 0.92%
Connecticut 5.049 4.720 -0.329 5 = -200 32 0.09% -1.10%
Delaware 1.358 1.384 0.026 1 = 89 94 1.00% 2.84%
Florida 26.435 28.245 1.810 28 +1 73 2896 1.44% 1.51%
Georgia 13.627 13.957 0.330 14 = -441 1029 1.01% 0.13%
Hawaii 1.976 2.014 0.038 2 = 372 139 0.98% 5.80%
Idaho 2.260 2.317 0.057 2 = 133 170 1.04% 2.62%
Illinois 18.043 16.779 -1.263 17 -1 -324 56 0.04% -0.49%
Indiana 9.128 8.793 -0.335 9 = -282 261 0.40% -0.50%
Iowa 4.312 4.189 -0.123 4 = 222 148 0.48% 1.90%
Kansas 4.042 3.892 -0.150 4 = -327 113 0.39% -2.05%
Kentucky 6.120 5.883 -0.237 6 = -332 165 0.37% -1.23%
Louisiana 6.392 6.265 -0.127 6 = 153 265 0.57% 1.24%
Maine 1.933 1.802 -0.131 2 = -253 2 0.01% -4.33%
Maryland 8.131 8.117 -0.014 8 = 258 452 0.76% 1.62%
Massachusetts 9.217 9.158 -0.060 9 = 222 478 0.71% 1.37%
Michigan 13.902 12.970 -0.932 13 -1 -444 74 0.07% -0.88%
Minnesota 7.472 7.388 -0.085 7 -1 54 359 0.66% 0.86%
Mississippi 4.201 3.956 -0.245 4 = -377 48 0.16% -2.61%
Missouri 8.433 8.047 -0.387 8 = 312 182 0.30% 1.35%
Montana 1.478 1.485 0.007 1 = 7 85 0.82% 0.95%
Nebraska 2.615 2.602 -0.014 3 = -96 135 0.72% -0.34%
Nevada 3.829 4.033 0.204 4 = 342 374 1.31% 3.58%
New Hampshire 1.917 1.819 -0.098 2 = -266 27 0.20% -4.35%
New Jersey 12.369 11.869 -0.500 12 = -360 319 0.36% -0.49%
New Mexico 2.937 2.790 -0.148 3 = -243 50 0.24% -2.31%
New York 27.244 26.271 -0.973 26 -1 62 803 0.41% 0.47%
North Carolina 13.413 13.707 0.294 14 +1 -249 990 0.99% 0.48%
North Dakota 1.070 1.205 0.135 1 = 238 170 2.28% 7.78%
Ohio 16.224 15.214 -1.010 15 -1 153 147 0.13% 0.40%
Oklahoma 5.297 5.310 0.013 5 = 123 311 0.80% 1.43%
Oregon 5.408 5.511 0.103 6 +1 -45 386 0.96% 0.74%
Pennsylvania 17.862 16.789 -1.074 17 -1 -331 191 0.15% -0.40%
Rhode Island 1.562 1.467 -0.095 1 -1 21 7 0.07% 0.48%
South Carolina 6.521 6.728 0.207 7 = -218 529 1.09% 0.17%
South Dakota 1.249 1.274 0.025 1 = 180 86 1.01% 4.96%
Tennessee 8.935 8.915 -0.020 9 = -376 493 0.75% -0.44%
Texas 35.350 38.730 3.381 39 +3 -433 4610 1.70% 1.38%
Utah 3.917 4.224 0.307 4 = 194 459 1.55% 2.81%
Vermont 1.012 0.956 -0.055 1 = 454 1 0.01% 12.18%
Virginia 11.258 11.392 0.134 11 = 34 743 0.89% 0.97%
Washington 9.466 9.903 0.437 10 = -373 875 1.23% 0.16%
West Virginia 2.652 2.441 -0.211 2 -1 35 -17 -0.09% 0.31%
Wisconsin 8.010 7.629 -0.381 8 = -149 162 0.28% -0.26%
Wyoming 0.937 0.935 -0.002 1 = 473 44 0.75% 13.74%
Alabama has added an estimated 79K population, and is projected to add 73K more by 2020. If they were to add another 20K, they would retain the 7th district (because rounding of the final seats is based on a ranking of the states, there is also additional uncertainty).
Arizona was a very solid 9 districts in 2010, and is projected to gain a 10th on a favorable rounding. But if its projected increase of 856K were reduced by 22K to 834K, it would lose the 10th seat. On the other hand, Arizona has been increasing its population rate following recovery from the housing bubble.
California has been getting favorable rounding for the past few decades. If its projected increase of 3684K were to drop a bit, the rounding for 2020 would be lost, but California would actually earn its 53rd seat. Because of its large delegation California needs to add 3 million people just to tread water (the average district size will increase by nearly 60K this decade).
Florida would only need 73K additional population to gain a second seat. Based on an uptick over the past couple of years, this might almost be regarded as a certainty.
Minnesota could still avoid the loss of a district. It added 186K in the first 5.25 years, and is projected to add 173K more. If it could add another 54K it could keep the 7th seat.. However, Minnesota has had a slower growth the last couple of years.
Montana has been ever so close for ever so long (it sued over its loss of the second seat after the 1990 Census). Montana would only need to add another 7K persons beyond its projected increase of 85K. But in a state that has been adding 8K or so per year, another 7K is a lot.
New York could keep its 26th seat, but its growth has been declining the last couple of years.
Oregon really bumped up its growth for 2015 (57K versus 34K average for the first four years). If it were to drop back down, it might lose the 6th seat.
Rhode Island is only projected to gain 7K for the decade. To increase this to 28K is huge. Montana will likely equal Rhode Island's population by 2018.
Texas has been adding between 400K and 500K per year. A drop to around 350K per year is not out of the range of possibility if the oil price continue below $40/barrel, which would cause a loss of the 3rd additional seat.
Virginia is just short of the projected population for a 12th district. But its growth has been tapering off. If it doesn't add a district, the other districts will continue to be sucked into NOVA. Othewise a 4th district in the NOVA area would push the other districts back some.
West Virginia is estimated to have lost 9K by 2015, and lose another 8K by 2020. To convert this into an 18K increase for the decade would require a huge turn around.
Title: Re: Census population estimates 2011-2019
Post by: Tender Branson on December 24, 2015, 03:20:23 PM
Any reason why Hawaii has a net negative domestic migration ?
I always thought HI is a magnet for mainland Americans to move to and retire or buy property, but it actually seems way more Americans are leaving HI for the mainland ...
I always thought HI is a magnet for mainland Americans to move to and retire or buy property, but it actually seems way more Americans are leaving HI for the mainland ...
Title: Re: Census population estimates 2011-2019
Post by: Asian Nazi on December 24, 2015, 03:24:12 PM
Any reason why Hawaii has a net negative domestic migration ?
I always thought HI is a magnet for mainland Americans to move to and retire or buy property, but it actually seems way more Americans are leaving HI for the mainland ...
I always thought HI is a magnet for mainland Americans to move to and retire or buy property, but it actually seems way more Americans are leaving HI for the mainland ...
Due to high cost of living and limited job opportunities, lots of younger locals move to the mainland. My family is an example of this.
It could also have to do with the military.
Title: Re: Census population estimates 2011-2019
Post by: Hillary pays minimum wage on December 25, 2015, 03:20:24 AM
I've devoted my life to opposing statistics in many respects, but I have to take my hat off and admit that you found something interesting.
Title: Re: Census population estimates 2011-2019
Post by: hopper on December 26, 2015, 12:11:46 AM
States with some uncertainty are in red.
Minnesota could still avoid the loss of a district. It added 186K in the first 5.25 years, and is projected to add 173K more. If it could add another 54K it could keep the 7th seat.. However, Minnesota has had a slower growth the last couple of years.
New York could keep its 26th seat, but its growth has been declining the last couple of years.
Virginia is just short of the projected population for a 12th district. But its growth has been tapering off. If it doesn't add a district, the other districts will continue to be sucked into NOVA. Othewise a 4th district in the NOVA area would push the other districts back some.
So if Virginia doesn't gain a seat who loses in redistricting? Comstock or Wittman on the Republican Side or maybe Conolly's district turns into a swing seat again? I was looking at the current Virginia Congressional Map and it doesn't look like Brat will be redistricted out. His district is to far off the Washington DC path. Beyer's district is too D for him to be redistricted out.
Title: Re: Census population estimates 2011-2019
Post by: Kevinstat on January 03, 2016, 01:25:07 PM
State 2010 2020 Change Apportion More Change Proj. Needed
Alabama 6.737 6.438 -0.299 6 -1 20 152 0.31% 0.40%
Florida 26.435 28.245 1.810 28 +1 73 2896 1.44% 1.51%
Minnesota 7.472 7.388 -0.085 7 -1 54 359 0.66% 0.86%
Montana 1.478 1.485 0.007 1 = 7 85 0.82% 0.95%
New York 27.244 26.271 -0.973 26 -1 62 803 0.41% 0.47%
Rhode Island 1.562 1.467 -0.095 1 -1 21 7 0.07% 0.48%
Virginia 11.258 11.392 0.134 11 = 34 743 0.89% 0.97%
West Virginia 2.652 2.441 -0.211 2 -1 35 -17 -0.09% 0.31%
Arizona 8.999 9.447 0.448 10 +1 -22 856 1.26% 1.20%
California 52.369 53.283 0.914 54 +1 -189 3684 0.95% 0.85%
Oregon 5.408 5.511 0.103 6 +1 -45 386 0.96% 0.74%
Texas 35.350 38.730 3.381 39 +3 -433 4610 1.70% 1.38%
Title: Re: Census population estimates 2011-2019
Post by: jimrtex on January 03, 2016, 10:41:12 PM
Edit: "New York is quite solid at either no change or losing one."
Based on your table, which I've altered to get rid of the states you didn't have in red, change red to green for the states that might end up better than your predicting (as opposed to worse, although maybe California could (by your mathematical standard) also be within range of gaining a 2nd seat (doing 1 better than your projection) or losing a seat (doing 2 worse than your projection)), and to put all the states in red after all those in green, you have 12 states competing for 4 seats, although as you pointed out some of the states I just put in green really don't have much chance of having a result other than your projected one.
Thanks.
I have reordered the states based on the ratio of the needed growth rate vs. projected growth rate. For example, Florida would need to increase its growth rate from 1.44% to 1.51% to gain a second seat. The green states are ordered by most likely to do better. This ignores dynamic effects. For example, the growth rate in Florida has been increasing as a resulted of the recovery from the housing bubble. So it is actually quite likely to gain an additional seat. The growth rate has been declining in New York and Virginia, so their projections (loss of one for New York, no change for Virginia) are becoming more reliable.
While Arizona would appear to be the most vulnerable, its growth has also been recovering. California may be the most vulnerable. For the past two census, rounding has been favorable for larger states, and this may disappear. It depends on the overall distribution of state population, and the apportionment method does not systematically favor larger states.
Based on back of the envelope calculations:
With 53 districts, California gains an additional district with about a 2% gain. Over the 5 remaining years of the decade, this is annual increase of about 0.40%. So California would be around gaining a 55th district if it upped its increase to 1.25% per year, or could lose as seat if it were to drop to 0.45%.
For Texas, 1/36 is about 3%, or 0.6% for the remaining 5 years until the census. If the growth rate increased to 1.98% per year it would be in line for gaining 4 seats. This indicates that Texas is about as close to gaining 4 seats, as it as gaining 2.
For New York, 1/27 is about 4%, or 0.8% for the remaining 5 years until 2020. It would need to increase to 1.27% per year to gain a seat, or decline by 0.33% per year to lose two seats. New York is quite solid at either no change or losing one. Similarly Florida is quite solid at gaining either one or two.
State 2010 2020 Change Apportion More Change Proj. Needed
Florida 26.435 28.245 1.810 28 +1 73 2896 1.44% 1.51%
Virginia 11.258 11.392 0.134 11 = 34 743 0.89% 0.97%
Montana 1.478 1.485 0.007 1 = 7 85 0.82% 0.95%
New York 27.244 26.271 -0.973 26 -1 62 803 0.41% 0.47%
Alabama 6.737 6.438 -0.299 6 -1 20 152 0.31% 0.40%
Minnesota 7.472 7.388 -0.085 7 -1 54 359 0.66% 0.86%
Rhode Island 1.562 1.467 -0.095 1 -1 21 7 0.07% 0.48%
West Virginia 2.652 2.441 -0.211 2 -1 35 -17 -0.09% 0.31%
Arizona 8.999 9.447 0.448 10 +1 -22 856 1.26% 1.20%
California 52.369 53.283 0.914 54 +1 -189 3684 0.95% 0.85%
Texas 35.350 38.730 3.381 39 +3 -433 4610 1.70% 1.38%
Oregon 5.408 5.511 0.103 6 +1 -45 386 0.96% 0.74%
I have reordered the states based on the ratio of the needed growth rate vs. projected growth rate. For example, Florida would need to increase its growth rate from 1.44% to 1.51% to gain a second seat. The green states are ordered by most likely to do better. This ignores dynamic effects. For example, the growth rate in Florida has been increasing as a resulted of the recovery from the housing bubble. So it is actually quite likely to gain an additional seat. The growth rate has been declining in New York and Virginia, so their projections (loss of one for New York, no change for Virginia) are becoming more reliable.
While Arizona would appear to be the most vulnerable, its growth has also been recovering. California may be the most vulnerable. For the past two census, rounding has been favorable for larger states, and this may disappear. It depends on the overall distribution of state population, and the apportionment method does not systematically favor larger states.
Based on back of the envelope calculations:
With 53 districts, California gains an additional district with about a 2% gain. Over the 5 remaining years of the decade, this is annual increase of about 0.40%. So California would be around gaining a 55th district if it upped its increase to 1.25% per year, or could lose as seat if it were to drop to 0.45%.
For Texas, 1/36 is about 3%, or 0.6% for the remaining 5 years until the census. If the growth rate increased to 1.98% per year it would be in line for gaining 4 seats. This indicates that Texas is about as close to gaining 4 seats, as it as gaining 2.
For New York, 1/27 is about 4%, or 0.8% for the remaining 5 years until 2020. It would need to increase to 1.27% per year to gain a seat, or decline by 0.33% per year to lose two seats. New York is quite solid at either no change or losing one. Similarly Florida is quite solid at gaining either one or two.
Title: Re: Census population estimates 2011-2019
Post by: DINGO Joe on January 06, 2016, 11:21:22 AM
I just realized that the 2014 estimates were slightly different for the states. Did the revision occur with the release of the 2015 estimates, or was there some sort of interim revision?
Title: Re: Census population estimates 2011-2019
Post by: Tender Branson on January 06, 2016, 11:23:52 AM
I just realized that the 2014 estimates were slightly different for the states. Did the revision occur with the release of the 2015 estimates, or was there some sort of interim revision?
Old estimates are always revised when the new numbers come out.
Also, after each 10-year Census the intercensal estimates are revised based on the new Census numbers.
Title: Re: Census population estimates 2011-2019
Post by: jimrtex on January 06, 2016, 03:58:02 PM
I just realized that the 2014 estimates were slightly different for the states. Did the revision occur with the release of the 2015 estimates, or was there some sort of interim revision?
Based on a quick read of Population Estimate Metodology (PDF) (http://www.census.gov/popest/methodology/2015-natstcopr-meth.pdf), the difference may be due to lagging of reporting of vital statistics (birth and deaths).
They don't have any data for 2015, and only national data for 2014. So the 2015 estimates assume the same birth and death rate for 2015 as 2014, and there is also an adjustment for the lag in state and county reporting.
Next year, when making the 2016 estimates, they will have 2015 national vital statistics and 2014 state and local data. This means they will be able to improve the 2014 and 2015 estimates as well as making the 2016 estimates.
Title: Re: Census population estimates 2011-2019
Post by: Sol on January 18, 2016, 01:31:43 PM
When Maryland gain a district?
Title: Re: Census population estimates 2011-2019
Post by: Brittain33 on January 18, 2016, 03:18:48 PM
When Maryland gain a district?
According to Jim's table, it's trending very slightly downward.
Title: Re: Census population estimates 2011-2019
Post by: jimrtex on January 18, 2016, 06:55:20 PM
When Maryland gain a district?
Title: Re: Census population estimates 2011-2019
Post by: Torie on January 19, 2016, 11:13:23 AM
"For New York, 1/27 is about 4%, or 0.8% for the remaining 5 years until 2020. It would need to increase to 1.27% per year to gain a seat, or decline by 0.33% per year to lose two seats. New York is quite solid at either no change or losing two. Similarly Florida is quite solid at gaining either one or two."
Based on the above, it appears to me that NY is quite solid to lose one, and only one, seat. What am I missing? Your figures represent pretty substantial changes in growth rates, and my impression is that the 9 upstate seats are pretty stable at having no growth up or down, thereby requiring a higher change in the NYC metro area to make a difference. I guess maybe NY could lose two seats, if Wall Street takes another rather long enduring dump.
Based on the above, it appears to me that NY is quite solid to lose one, and only one, seat. What am I missing? Your figures represent pretty substantial changes in growth rates, and my impression is that the 9 upstate seats are pretty stable at having no growth up or down, thereby requiring a higher change in the NYC metro area to make a difference. I guess maybe NY could lose two seats, if Wall Street takes another rather long enduring dump.
Title: Re: Census population estimates 2011-2019
Post by: jimrtex on January 20, 2016, 10:40:13 AM
"For New York, 1/27 is about 4%, or 0.8% for the remaining 5 years until 2020. It would need to increase to 1.27% per year to gain a seat, or decline by 0.33% per year to lose two seats. New York is quite solid at either no change or losing two. Similarly Florida is quite solid at gaining either one or two."
Based on the above, it appears to me that NY is quite solid to lose one, and only one, seat. What am I missing? Your figures represent pretty substantial changes in growth rates, and my impression is that the 9 upstate seats are pretty stable at having no growth up or down, thereby requiring a higher change in the NYC metro area to make a difference. I guess maybe NY could lose two seats, if Wall Street takes another rather long enduring dump.
Based on the above, it appears to me that NY is quite solid to lose one, and only one, seat. What am I missing? Your figures represent pretty substantial changes in growth rates, and my impression is that the 9 upstate seats are pretty stable at having no growth up or down, thereby requiring a higher change in the NYC metro area to make a difference. I guess maybe NY could lose two seats, if Wall Street takes another rather long enduring dump.
Losing two would require New York to start losing population (50,000 or so per year). Gaining one, would require a substantial increase in population.
New York is projected to increase by 803K. If it could increase by 62K more, it would be in position to not lose a seat. Prior to this year, New York was projected to not lose a seat, but its growth rate has slowed a bit. Since the 2020 projection is based on an assumption that the 2010-2015 growth rate will be maintained, it is optimistic.
One reason that it is difficult to project apportionment is it is based on a competition among the states.
Imagine that it were a marathon, and New York were on a pace for a 3:43 finish. We would look at past results and say that would be good for 438th place. We might also say that the average spacing was 21 seconds per place.
But when we are at the finish line in this race, the runners are not going to be spread out at 21 second intervals. And even if New York finishes at 3:43 it might get 435th. And this is without even considering changes in pace over the remainder of the race.
Title: Re: Census population estimates 2011-2019
Post by: Torie on January 20, 2016, 11:16:55 AM
OK, thanks. Giving the the nine upstate NY CD's are so stably stagnant, NYC metro growth would have to increase by a pretty brisk rate to avoid losing a seat, putting aside your footrace comment. Any NY growth slowed down this last year didn't it, suggesting NYC metro area growth is slowing down, which makes sense given Wall Street is slowing down, and now slowing down some more.
Title: Re: Census population estimates 2011-2019
Post by: Torie on January 21, 2016, 09:44:40 AM
If the growth rates for each state over the past two years, continue at that rate for the balance of the census period, what would be the CD allocation for each state? That might be an interesting projection.
Title: Re: Census population estimates 2011-2019
Post by: muon2 on January 21, 2016, 01:02:10 PM
If the growth rates for each state over the past two years, continue at that rate for the balance of the census period, what would be the CD allocation for each state? That might be an interesting projection.
I looked at that when the numbers came out. Compared to the five-year data the only change I project is that CA stays the same and FL gets +2 instead of +1. AZ 10 was the last seat in that projection and CA 54 is the next.
Title: Re: Census population estimates 2011-2019
Post by: Torie on January 21, 2016, 01:18:06 PM
If the growth rates for each state over the past two years, continue at that rate for the balance of the census period, what would be the CD allocation for each state? That might be an interesting projection.
I looked at that when the numbers came out. Compared to the five-year data the only change I project is that CA stays the same and FL gets +2 instead of +1. AZ 10 was the last seat in that projection and CA 54 is the next.
It looks like in NY, if the same slow growth of the last two years persists until the end of the census cycle, and the population of the 9 upstate CD's stays the same, that NY-18 just takes Columbia County (still about 7,000 short, but that can be fudged), with a pack penalty incurred, while NY-17 retains Sullivan County.
Title: Re: Census population estimates 2011-2019
Post by: hopper on January 30, 2016, 07:59:06 PM
In addition to FL breaking 20 million, let's see how my estimates turned out:
AZ will overtake MA. TRUE
TN could overtake IN, but probably not this year but next. TRUE (next year)
SC will overtake AL. TRUE
MS and AR might break 3 Mio. people for the first time (but it's more likely that UT does before them). Semi-true: MS and AR did not break 3 million, but UT overtook them with 2.996 million and definitely is above 3 million already.
NH could pass ME. TRUE
Quote
Yes NH passed ME.
Other states that can pass each other in population:
Colorado should pass Minnesota in population next year for the 21st largest state in population.
AR will come close to passing MS in population next year but I think will just miss.
On a side note I wonder how much population is Illinois's is gonna lose given they lost 23,000 people last year in natural population in the last 2 census cycles going from 12.859 million people this year to 12.882 people last year and from 12.889 people from the year before in 2013. Illinois is now back to the population that it had in 2011 with 12.681 million people.
Title: Re: Census population estimates 2011-2019
Post by: Tender Branson on December 17, 2016, 01:51:41 AM
New mid-2016 population estimates are out next Tuesday for the US, the states, DC and Puerto Rico as well as the voting-age estimates for each state and demographic changes over the past year (births, deaths, migration balances - which includes international and domestic migration estimates for each state).
Something to look at:
* CO will overtake MN in terms of total population
* PA could overtake IL, but that's very unlikely (more likely in 2017)
* NJ could hit 9 million (also unlikely => 2017)
* TN will overtake IN's population
* UT will definitely pass the 3 million
* AR could hit 3 million too (but much more likely that it will be in 2017)
* NV will overtake KS
---
* TX will remain the state with the biggest numerical gain (+450k)
* FL and CA will follow with +350k each
* WA might actually become the 4th fastest growing state numerically
* GA and NC still have steady high growth (+130K each)
* CO and AZ will be around +100K each
* OR probably picked up some speed (+70K)
* The 10th slot will go to SC (+65K)
---
In terms of % growth, a couple states will match themselves for 1st place because I guess ND's growth will fall back a bit to 1.5%
CO, NV, FL, UT, TX and DC are likely to grow between 1.7 and 2% each.
Hard to say who comes out on top ...
---
In general, births in the US dropped by 1% last year while deaths increased by 3.5% - resulting in a lower natural increase.
The big unknown is the immigration balance.
In general I believe the US population is up a bit less than last year (2.45 million vs. 2.51 million), but if the migration surplus was higher that could also change.
Title: Re: Census population estimates 2011-2019
Post by: Tender Branson on December 17, 2016, 09:01:13 AM
My estimates for the TOP-10 states:
CA: 39.52 million (+380k) +1.0%
TX: 27.98 million (+510k) +1.8%
FL: 20.65 million (+380k) +1.8%
NY: 19.84 million (+ 45k) +0.2%
IL: 12.83 million (- 30k) -0.2%
PA: 12.82 million (+12k) +0.1%
OH: 11.63 million (+16k) +0.1%
GA: 10.35 million (+135k) +1.3%
NC: 10.16 million (+117k) +1.1%
CA: 39.52 million (+380k) +1.0%
TX: 27.98 million (+510k) +1.8%
FL: 20.65 million (+380k) +1.8%
NY: 19.84 million (+ 45k) +0.2%
IL: 12.83 million (- 30k) -0.2%
PA: 12.82 million (+12k) +0.1%
OH: 11.63 million (+16k) +0.1%
GA: 10.35 million (+135k) +1.3%
NC: 10.16 million (+117k) +1.1%
Title: Re: Census population estimates 2011-2019
Post by: jimrtex on December 17, 2016, 09:07:42 AM
New mid-2016 population estimates are out next Tuesday for the US, the states, DC and Puerto Rico as well as the voting-age estimates for each state and demographic changes over the past year (births, deaths, migration balances - which includes international and domestic migration estimates for each state).
Something to look at:
* CO will overtake MN in terms of total population
* PA could overtake IL, but that's very unlikely (more likely in 2017)
* NJ could hit 9 million (also unlikely => 2017)
* TN will overtake IN's population
* UT will definitely pass the 3 million
* AR could hit 3 million too (but much more likely that it will be in 2017)
* NV will overtake KS
---
* TX will remain the state with the biggest numerical gain (+450k)
* FL and CA will follow with +350k each
* WA might actually become the 4th fastest growing state numerically
* GA and NC still have steady high growth (+130K each)
* CO and AZ will be around +100K each
* OR probably picked up some speed (+70K)
* The 10th slot will go to SC (+65K)
---
In terms of % growth, a couple states will match themselves for 1st place because I guess ND's growth will fall back a bit to 1.5%
CO, NV, FL, UT, TX and DC are likely to grow between 1.7 and 2% each.
Hard to say who comes out on top ...
---
In general, births in the US dropped by 1% last year while deaths increased by 3.5% - resulting in a lower natural increase.
The big unknown is the immigration balance.
In general I believe the US population is up a bit less than last year (2.45 million vs. 2.51 million), but if the migration surplus was higher that could also change.
Something to look at:
* CO will overtake MN in terms of total population
* PA could overtake IL, but that's very unlikely (more likely in 2017)
* NJ could hit 9 million (also unlikely => 2017)
* TN will overtake IN's population
* UT will definitely pass the 3 million
* AR could hit 3 million too (but much more likely that it will be in 2017)
* NV will overtake KS
---
* TX will remain the state with the biggest numerical gain (+450k)
* FL and CA will follow with +350k each
* WA might actually become the 4th fastest growing state numerically
* GA and NC still have steady high growth (+130K each)
* CO and AZ will be around +100K each
* OR probably picked up some speed (+70K)
* The 10th slot will go to SC (+65K)
---
In terms of % growth, a couple states will match themselves for 1st place because I guess ND's growth will fall back a bit to 1.5%
CO, NV, FL, UT, TX and DC are likely to grow between 1.7 and 2% each.
Hard to say who comes out on top ...
---
In general, births in the US dropped by 1% last year while deaths increased by 3.5% - resulting in a lower natural increase.
The big unknown is the immigration balance.
In general I believe the US population is up a bit less than last year (2.45 million vs. 2.51 million), but if the migration surplus was higher that could also change.
Title: Re: Census population estimates 2011-2019
Post by: Tender Branson on December 17, 2016, 09:22:32 AM
I don't see a total collapse in ND.
Maybe down to +1% from the previous year's 2% (when it was still the fastest growing state in the US, even though oil prices already went down).
ND still has much more births than deaths and some people are still moving there, so probably no total collapse ...
Maybe down to +1% from the previous year's 2% (when it was still the fastest growing state in the US, even though oil prices already went down).
ND still has much more births than deaths and some people are still moving there, so probably no total collapse ...
Title: Re: Census population estimates 2011-2019
Post by: jimrtex on December 17, 2016, 09:28:04 AM
I don't see a total collapse in ND.
Maybe down to +1% from the previous year's 2% (when it was still the fastest growing state in the US, even though oil prices already went down).
ND still has much more births than deaths and some people are still moving there, so probably no total collapse ...
Maybe down to +1% from the previous year's 2% (when it was still the fastest growing state in the US, even though oil prices already went down).
ND still has much more births than deaths and some people are still moving there, so probably no total collapse ...
Title: Re: Census population estimates 2011-2019
Post by: Tender Branson on December 17, 2016, 10:19:01 AM
I don't see a total collapse in ND.
Maybe down to +1% from the previous year's 2% (when it was still the fastest growing state in the US, even though oil prices already went down).
ND still has much more births than deaths and some people are still moving there, so probably no total collapse ...
Maybe down to +1% from the previous year's 2% (when it was still the fastest growing state in the US, even though oil prices already went down).
ND still has much more births than deaths and some people are still moving there, so probably no total collapse ...
Probably a silly thing for me to post ... but some families may stay put and wait for higher oil prices rather than moving out of the state. Some might also have moved to bigger ND cities who are less dependent on oil and gas in the meantime ...
Title: Re: Census population estimates 2011-2019
Post by: RINO Tom on December 17, 2016, 11:14:27 AM
New mid-2016 population estimates are out next Tuesday for the US, the states, DC and Puerto Rico as well as the voting-age estimates for each state and demographic changes over the past year (births, deaths, migration balances - which includes international and domestic migration estimates for each state).
Something to look at:
* CO will overtake MN in terms of total population
* PA could overtake IL, but that's very unlikely (more likely in 2017)
* NJ could hit 9 million (also unlikely => 2017)
* TN will overtake IN's population
* UT will definitely pass the 3 million
* AR could hit 3 million too (but much more likely that it will be in 2017)
* NV will overtake KS
---
* TX will remain the state with the biggest numerical gain (+450k)
* FL and CA will follow with +350k each
* WA might actually become the 4th fastest growing state numerically
* GA and NC still have steady high growth (+130K each)
* CO and AZ will be around +100K each
* OR probably picked up some speed (+70K)
* The 10th slot will go to SC (+65K)
---
In terms of % growth, a couple states will match themselves for 1st place because I guess ND's growth will fall back a bit to 1.5%
CO, NV, FL, UT, TX and DC are likely to grow between 1.7 and 2% each.
Hard to say who comes out on top ...
---
In general, births in the US dropped by 1% last year while deaths increased by 3.5% - resulting in a lower natural increase.
The big unknown is the immigration balance.
In general I believe the US population is up a bit less than last year (2.45 million vs. 2.51 million), but if the migration surplus was higher that could also change.
Something to look at:
* CO will overtake MN in terms of total population
* PA could overtake IL, but that's very unlikely (more likely in 2017)
* NJ could hit 9 million (also unlikely => 2017)
* TN will overtake IN's population
* UT will definitely pass the 3 million
* AR could hit 3 million too (but much more likely that it will be in 2017)
* NV will overtake KS
---
* TX will remain the state with the biggest numerical gain (+450k)
* FL and CA will follow with +350k each
* WA might actually become the 4th fastest growing state numerically
* GA and NC still have steady high growth (+130K each)
* CO and AZ will be around +100K each
* OR probably picked up some speed (+70K)
* The 10th slot will go to SC (+65K)
---
In terms of % growth, a couple states will match themselves for 1st place because I guess ND's growth will fall back a bit to 1.5%
CO, NV, FL, UT, TX and DC are likely to grow between 1.7 and 2% each.
Hard to say who comes out on top ...
---
In general, births in the US dropped by 1% last year while deaths increased by 3.5% - resulting in a lower natural increase.
The big unknown is the immigration balance.
In general I believe the US population is up a bit less than last year (2.45 million vs. 2.51 million), but if the migration surplus was higher that could also change.
NEVER! :P
Title: Re: Census population estimates 2011-2019
Post by: White Trash on December 17, 2016, 12:02:35 PM
Surprised that PA might overtake IL. Is all this growth in urban areas?
Title: Re: Census population estimates 2011-2019
Post by: Tender Branson on December 17, 2016, 12:23:54 PM
Surprised that PA might overtake IL. Is all this growth in urban areas?
Mostly, yes.
And the suburban areas in the South-East.
The areas which swung heavily to Trump are losing population fast. The light-blue areas and the red ones, which swung slightly to Hillary, are having modest population gains:
()
citypopulation.de has a nice clickable map of population changes by county:
https://www.citypopulation.de/php/usa-census-admin.php
Title: Re: Census population estimates 2011-2019
Post by: RINO Tom on December 17, 2016, 12:27:31 PM
At least as of a couple years ago, literally the only places in IL with any growth were some north and northwest Chicago suburbs, some Peoria suburbs, Bloomington-Normal and Champaign (growing like crazy, not necessarily in population terms, but in redevelopment and revitalization). :(
Title: Re: Census population estimates 2011-2019
Post by: jimrtex on December 18, 2016, 02:38:10 AM
I don't see a total collapse in ND.
Maybe down to +1% from the previous year's 2% (when it was still the fastest growing state in the US, even though oil prices already went down).
ND still has much more births than deaths and some people are still moving there, so probably no total collapse ...
Maybe down to +1% from the previous year's 2% (when it was still the fastest growing state in the US, even though oil prices already went down).
ND still has much more births than deaths and some people are still moving there, so probably no total collapse ...
Probably a silly thing for me to post ... but some families may stay put and wait for higher oil prices rather than moving out of the state. Some might also have moved to bigger ND cities who are less dependent on oil and gas in the meantime ...
June 2014: 170 (and had been around that range for 3 years, and would be for another 1/2 year).
June 2015: 77 (55% drop in 6 months). You may hang on now.
June 2016: 24
A lot of people would be moving in for opportunities. As workers take jobs on rigs, other employers have to push up wages, motels might be built, people hired in truck rental agencies, etc. Some people would move from Fargo and Grand Forks, and rent a trailer, but others would move from Rapid City and Gillette, and beyond.
If you built a motel, and have 80% vacancy, you're going to let everyone go, and pay the others minimum wages, as you try to hang on.
The timing is right for July 2016 to have 0% growth. I'm not saying that it will go negative. It just won't have growth like before.
Title: Re: Census population estimates 2011-2019
Post by: Tender Branson on December 18, 2016, 04:28:51 AM
This will be interesting to see who's right ...
I'm still predicting some 0.8% to 1.5% growth for ND between 7/2015 and 7/2016.
Do we have any other indicator of people moving out of ND over the past year other than the fall of oil rigs ?
Did the overall ND economy collapse last year and in the first half of 2016 ?
I'm still predicting some 0.8% to 1.5% growth for ND between 7/2015 and 7/2016.
Do we have any other indicator of people moving out of ND over the past year other than the fall of oil rigs ?
Did the overall ND economy collapse last year and in the first half of 2016 ?
Title: Re: Census population estimates 2011-2019
Post by: jimrtex on December 18, 2016, 10:58:49 AM
This will be interesting to see who's right ...
I'm still predicting some 0.8% to 1.5% growth for ND between 7/2015 and 7/2016.
Do we have any other indicator of people moving out of ND over the past year other than the fall of oil rigs ?
Did the overall ND economy collapse last year and in the first half of 2016 ?
I'm still predicting some 0.8% to 1.5% growth for ND between 7/2015 and 7/2016.
Do we have any other indicator of people moving out of ND over the past year other than the fall of oil rigs ?
Did the overall ND economy collapse last year and in the first half of 2016 ?
I found one article that said there was a small increase in school enrollment, as kindergartners entered the system. It also said rig workers tended to be 2-week on and 2-week off, and not necessarily from the state. I met a work who was on his way from Shreveport for a 2-week shift, and was getting 100 hours per week, which with overtime would be equivalent to 130 hours. But production workers were more local.
Another article used IRS data that showed the average taxpayer moving to North Dakota between 2014 and 2015 experienced a 26% increase in income, the highest in the country. All states other than California showed an improvement for in-movers. If you move to California, you will see a loss in income plus impossible housing costs.
North Dakota still has one of the lowest unemployment rates, but that may be because population matches employment opportunities. North Dakota can be miserable in winter (Williston has a forecast of wind chill of -55 F (-48 C).
Title: Re: Census population estimates 2011-2019
Post by: Gass3268 on December 20, 2016, 10:29:12 AM
North Dakota plummeted down to 0.1%, Utah was the fastest growing state, 8 states lost population (CT, IL, MS, NY, PA, VT, WV, and WY).
Title: Re: Census population estimates 2011-2019
Post by: Tender Branson on December 20, 2016, 10:34:23 AM
ND down to 0.1% growth, from 2.3% in the previous year.
:o
:o
Title: Re: Census population estimates 2011-2019
Post by: Tender Branson on December 20, 2016, 10:35:35 AM
Interesting that NY lost population ...
()
()
Title: Re: Census population estimates 2011-2019
Post by: Gass3268 on December 20, 2016, 10:42:54 AM
So much for New York not losing a congressional seat.
Title: Re: Census population estimates 2011-2019
Post by: Tender Branson on December 20, 2016, 10:48:03 AM
FL now has a higher domestic migration gain than TX ...
And NY has the worst domestic migration loss of all states (almost 200K people last year).
And NY has the worst domestic migration loss of all states (almost 200K people last year).
Title: Re: Census population estimates 2011-2019
Post by: Tender Branson on December 20, 2016, 10:56:41 AM
As a percentage of the state's population, OR had the biggest domestic migration gain of all states.
NY once again the worst loss.
When it comes to international migration though, DC, MA and NY had the biggest gains - MT had the smallest international gain.
When both domestic and international migration are combined, the results show that FL, NV and OR had the biggest gains, while WY, IL and ND had the biggest losses.
Title: Re: Census population estimates 2011-2019
Post by: Tender Branson on December 20, 2016, 10:58:39 AM
UT and ND had the highest birth rates last year, NH and ME the lowest.
UT also had the lowest death rate, WV the highest.
UT also had the lowest death rate, WV the highest.
Title: Re: Census population estimates 2011-2019
Post by: Tender Branson on December 20, 2016, 11:02:42 AM
Despite ND's economic collapse over the past year, 3 states actually had a higher domestic outmigration rate than ND:
NY
IL
CT
NY
IL
CT
Title: Re: Census population estimates 2011-2019
Post by: muon2 on December 20, 2016, 11:10:19 AM
Here's my annual projection from the new estimates. I used the July 2016 estimates and the April 2010 Census base to get an annual growth rate. This correctly accounts for the 6 and a quarter year period between the Census and the estimate. I then applied the annual growth rate to the 2010 reapportionment population to get the 2020 projection. This accounts for the extra overseas population used in reapportionment but not for redistricting. Ten years is a long stretch for a simple model like this, but here are the projected changes.
AL -1
AZ +1
CO +1
FL +2
IL -1
MI -1
MN -1
NY -1
NC +1
OH -1
OR +1
PA -1
RI -1
TX +3
WV -1
There is only one change since my projections last year (https://uselectionatlas.org/FORUM/index.php?topic=166668.msg4837582#msg4837582). CA stays unchanged at 53 instead of adding a seat and FL gains 2 instead of 1 up to 29. The bubble seats in this projection are based on the last five awarded and the next five in line.
The last five awarded are IL-17, TX-39, CA-53, AZ-10, and FL-29 (#435).
The next five in line are MT-2, AL-7, CA-54, VA-12, and MN-8.
An alternate projection could use just the last two years of estimates to determine the rate of growth for the rest of the decade. That model gives the same projection as the one above, with changes only in the order of the bubble seats.
Title: Re: Census population estimates 2011-2019
Post by: Tender Branson on December 20, 2016, 11:15:35 AM
Based on muon's model, states won by Trump would gain 2 EV after the 2020 Census, while Hillary states would lose 2.
Using Obama 2012, Obama states would lose 3, Romney states gain 3.
Using Obama 2012, Obama states would lose 3, Romney states gain 3.
Title: Re: Census population estimates 2011-2019
Post by: Tender Branson on December 20, 2016, 11:25:50 AM
States with high population growth mostly trended to Hillary, while virtually all states that lost population last year (except IL) trended to Trump.
That is pretty similar to Austria: In regions with high population growth, the Green VdB did well - but (periphery) regions with slow growth or losses voted for Hofer.
That is pretty similar to Austria: In regions with high population growth, the Green VdB did well - but (periphery) regions with slow growth or losses voted for Hofer.
Title: Re: Census population estimates 2011-2019
Post by: Tender Branson on December 20, 2016, 12:02:03 PM
If Austria were a US state, it would:
* be the 12th biggest state (after NJ - with 8.78 million people)
* have the 5th highest numerical population increase (after TX, FL, CA and WA - at 116.000 people)
* have the 11th highest percentage population growth (tied with SC at 1.35%)
* have the 4th lowest birth rate (9.9/1000, after NH, ME and VT)
* rank 21st when it comes to the death rate (9.0/1000)
* have the 4th highest migration surplus (tied with WA)
* have the highest international migration surplus
Title: Re: Census population estimates 2011-2019
Post by: Virginiá on December 20, 2016, 12:33:22 PM
If Austria were a US state, it would:
* be the 12th biggest state (after NJ - with 8.78 million people)
* have the 5th highest numerical population increase (after TX, FL, CA and WA - at 116.000 people)
* have the 11th highest percentage population growth (tied with SC at 1.35%)
* have the 4th lowest birth rate (9.9/1000, after NH, ME and VT)
* rank 21st when it comes to the death rate (9.0/1000)
* have the 4th highest migration surplus (tied with WA)
* have the highest international migration surplus
* be the 12th biggest state (after NJ - with 8.78 million people)
* have the 5th highest numerical population increase (after TX, FL, CA and WA - at 116.000 people)
* have the 11th highest percentage population growth (tied with SC at 1.35%)
* have the 4th lowest birth rate (9.9/1000, after NH, ME and VT)
* rank 21st when it comes to the death rate (9.0/1000)
* have the 4th highest migration surplus (tied with WA)
* have the highest international migration surplus
I'd also like to add:
* 14th largest clustering of people around Tender's house, particularly the basement area.
Title: Re: Census population estimates 2011-2019
Post by: Nyvin on December 20, 2016, 02:00:03 PM
Is there any set date when the county estimates come out?
Title: Re: Census population estimates 2011-2019
Post by: muon2 on December 20, 2016, 02:58:46 PM
Is there any set date when the county estimates come out?
They come out in March, I don't know if there's a public date yet.
Title: Re: Census population estimates 2011-2019
Post by: LLR on December 20, 2016, 04:13:44 PM
NY losing population? Sad!
Any reason why, though?
Any reason why, though?
Title: Re: Census population estimates 2011-2019
Post by: muon2 on December 20, 2016, 04:48:32 PM
NY losing population? Sad!
Any reason why, though?
Any reason why, though?
Here are the relevant components:
Births +237K
Deaths -161K
Natural increase +76K
International migration +118K
Domestic migration -191K
Net migration -73K
Total population change -2K
Note that's the sum of natural change and migration is a 3K increase not the -2K decrease that's being reported. According to the CB the change "includes a residual. This residual represents the change in population that cannot be attributed to any specific demographic component. See Population Estimates Terms and Definitions at http://www.census.gov/programs-surveys/popest/about/glossary.html."
In any case the largest factor in the decline in NY is the net migration to other states.
Title: Re: Census population estimates 2011-2019
Post by: krazen1211 on December 20, 2016, 05:37:15 PM
Illinois losing 2 Congressional districts could put a damper on the ruthless gerrymander.
Title: Re: Census population estimates 2011-2019
Post by: KingSweden on December 20, 2016, 05:58:58 PM
Illinois losing 2 Congressional districts could put a damper on the ruthless gerrymander.
The county estimates will be interesting in that regard. Probably an odd mix of downstate and downscale Chicago suburbs
Title: Re: Census population estimates 2011-2019
Post by: Tintrlvr on December 20, 2016, 06:36:50 PM
NY losing population? Sad!
Any reason why, though?
Any reason why, though?
I would guess that, as in the past, the main cause is continued decline in upstate (both urban and rural) due to poor economic conditions and undesirable weather, along with stagnation of growth (or possibly even decline) in outer suburban NYC counties like Suffolk and Orange. NYC itself is still growing at a good clip relative to other large cities.
Title: Re: Census population estimates 2011-2019
Post by: muon2 on December 20, 2016, 07:28:59 PM
Illinois losing 2 Congressional districts could put a damper on the ruthless gerrymander.
The county estimates will be interesting in that regard. Probably an odd mix of downstate and downscale Chicago suburbs
IL would have to lose at least 200K through the rest of the decade to lose a second CD. That's a much faster pace than losses have occurred so far, and short of stopping legal immigration (not just illegal immigration), it's hard to see IL lose that much in the next 3+ years.
Title: Re: Census population estimates 2011-2019
Post by: Nyvin on December 20, 2016, 08:35:55 PM
Illinois losing 2 Congressional districts could put a damper on the ruthless gerrymander.
It goes that FL-29 is the last seat to be added, then AZ-10 second to last, etc, then IL-17 is the fifth to last. So the bottom five are
431: IL-17
432: TX-39
433: CA-53
434: AZ-10
435: FL-29
So for Illinois to lose a seat, it would "currently" mean the other four either passed IL or all five dropped further down the list, replaced by other states.
Title: Re: Census population estimates 2011-2019
Post by: Figueira on December 20, 2016, 09:20:33 PM
So, California might lose a congressional district?
Title: Re: Census population estimates 2011-2019
Post by: Kevinstat on December 20, 2016, 09:35:14 PM
So, California might lose a congressional district?
Title: Re: Census population estimates 2011-2019
Post by: cinyc on December 20, 2016, 11:16:22 PM
Hmmm... could the oil crash put TX-39 in doubt again by 2020? And I'm surprised MT is holding up so well given the collapse in ND. VA-12 now seems quite unlikely, especially with Republicans taking control of the federal budget. IL losing 2 CDs would really be something.
There is little reason for Montana's population to collapse. Montana's growth isn't one-tenth as dependent on oil as North Dakota's. Besides, the portion of eastern Montana near North Dakota is sparsely populated. Its oil patch cities are few and far between - Sidney and perhaps Glendive, but even categorizing Glendive as an oil patch city is a stretch.
Title: Re: Census population estimates 2011-2019
Post by: jimrtex on December 21, 2016, 03:14:04 AM
ND down to 0.1% growth, from 2.3% in the previous year.
:o
:o
Title: Re: Census population estimates 2011-2019
Post by: jimrtex on December 21, 2016, 04:02:24 AM
Through 2016 there have been the following changes.
Florida +1 to 28.
North Carolina +1 to 14
Oregon +1 to 6
Texas +1 to 37
Illinois -1 to 17
Michigan -1 to 13
Minnesota -1 to 7
Pennsylvania -1 to 17
Were this Australia, a redistribution would have occurred, but this would have been in 2015 or earlier. There were no changes this year.
Projected additional changes by 2020:
Arizona +1 to 10
Colorado +1 to 8
Florida +1 (more) to 29 *** This is a change ***
Texas +2 to 39
Alabama -1 to 6
New York -1 to 26
Ohio -1 to 15
Rhode Island -1 to 1
West Virginia -1 to 2
California 0 to 53 *** This is a change ***
Title: Re: Census population estimates 2011-2019
Post by: jimrtex on December 21, 2016, 12:45:27 PM
So, California might lose a congressional district?
California can go from 52.5/435 to 53.5/435 of the population with an increase of 1.9% in population relative to that of the country. So a 9.5% increase would add one representative, a 5.7% increase would subtract one representative.
But you also have to consider rounding. California can spread any error around among 53 districts. For the past two decades the overall distribution has been favorable to rounding up. California was entitled to less than 52.5 districts, but got a favorable rounding. In 2010, CA, FL, MN, TX, and WA all got favorable rounding.
By 2020, it is estimated that only FL will get a favorable rounding.
So California might get rounded from 52.3 to 53 one census; and from 52.7 to 52 the next.
Another factor is that the Census Bureau revises its estimates.
In 2015, the estimate of the 2015 population was 39.144M.
In 2016, the estimate of the 2015 population was 38.994M.
In 2016, the estimate of the 2016 population was 39.250M.
Based on the 2015 and 2016 vintage estimates California only grew 0.27%.
Based on 2016 vintage estimates the increase was 0.66%.
While growth has slowed, it was not as severe as suggested by two different vintages.
Title: Re: Census population estimates 2011-2019
Post by: jimrtex on December 21, 2016, 01:20:15 PM
Hmmm... could the oil crash put TX-39 in doubt again by 2020? And I'm surprised MT is holding up so well given the collapse in ND. VA-12 now seems quite unlikely, especially with Republicans taking control of the federal budget. IL losing 2 CDs would really be something.
There is so little population base in the area that Minot and Bismarck have also had considerable growth this decade. You might be able to commute from Minot at least for a few months until you found an apartment or mobile home closer.
Title: Re: Census population estimates 2011-2019
Post by: jimrtex on December 21, 2016, 02:03:15 PM
It appears that traditional growth areas in the West are having accelerated growth, with both the 1st and 2nd derivatives positive in WA, OR, NV, AZ, UT, ID, MT and CO.
The most dramatic effect has been in Oregon which has dawdled along below 6 seats for some time. They made the 2020 projection for a gain in 2015; and actually would have achieved it in 2016.
Based on the 2016 vintage estimates:
2011: CO+1, FL+1, NC+1, TX+3, VA+1; AL-1; IL-1; MI-1, MN-1, OH-1, PA-1, RI-1.
Actual change: NC+1; MN-1
2012: CO+1, FL+1, NC+1, TX+3, VA+1; AL-1; IL-1, MI-1, MN-1, OH-1, PA-1, RI-1.
Actual change: NC+1; MN-1
2013: CO+1, FL+1, NC+1, TX+3, VA+1; AL=0; IL-1, MI-1, MN-1, OH-1, PA-1, RI-1, WV-1.
Actual change: NC+1; MN-1
West Virginia has turned negative and declined for the past four years. It, in effect, dropped faster than Alabama.
2014: CO+1, FL+1, NC+1, TX+3, VA+1; AL=0; IL-1, MI-1, MN-1, OH-1, PA-1, RI-1, WV-1.
Actual change: NC+1, TX+1; MN-1, PA-1
2015: AZ+1, CA+1, CO+1, FL+1, NC+1, OR+1, TX+3, VA=0; AL-1, IL-1, MI-1, MN-1, NY-1, OH-1, PA-1, RI-1, WV-1.
Actual change: FL+1, NC+1, TX+1; IL-1, MN-1, PA-1
Accelerating growth in the West added three seats in Arizona, California, and Oregon, at the expense of Alabama, New York, and Virginia. In the case of Alabama and Virginia it was a case of being caught by faster gainers, while New York has had a substantial decline in growth (and its projected population for 2020).
2016: AZ+1, CO+1, FL+2, NC+1, OR+1, TX+3; CA=0, VA=0; AL-1, IL-1, MI-1, MN-1, NY-1, OH-1, PA-1, RI-1, WV-1.
Actual change: FL+1, NC+1, OR+1, TX+1; IL-1, MI-1, MN-1, PA-1
Accelerating growth in Florida gives it a second seat by the end of the decade while the growth rate in California is declining. Oregon actually gains its 6th seat, one year after being projected to gain a seat.
Title: Re: Census population estimates 2011-2019
Post by: windjammer on December 21, 2016, 07:13:52 PM
Here's my annual projection from the new estimates. I used the July 2016 estimates and the April 2010 Census base to get an annual growth rate. This correctly accounts for the 6 and a quarter year period between the Census and the estimate. I then applied the annual growth rate to the 2010 reapportionment population to get the 2020 projection. This accounts for the extra overseas population used in reapportionment but not for redistricting. Ten years is a long stretch for a simple model like this, but here are the projected changes.
AL -1
AZ +1
CO +1
FL +2
IL -1
MI -1
MN -1
NY -1
NC +1
OH -1
OR +1
PA -1
RI -1
TX +3
WV -1
There is only one change since my projections last year (https://uselectionatlas.org/FORUM/index.php?topic=166668.msg4837582#msg4837582). CA stays unchanged at 53 instead of adding a seat and FL gains 2 instead of 1 up to 29. The bubble seats in this projection are based on the last five awarded and the next five in line.
The last five awarded are IL-17, TX-39, CA-53, AZ-10, and FL-29 (#435).
The next five in line are MT-2, AL-7, CA-54, VA-12, and MN-8.
An alternate projection could use just the last two years of estimates to determine the rate of growth for the rest of the decade. That model gives the same projection as the one above, with changes only in the order of the bubble seats.
AL -1
AZ +1
CO +1
FL +2
IL -1
MI -1
MN -1
NY -1
NC +1
OH -1
OR +1
PA -1
RI -1
TX +3
WV -1
There is only one change since my projections last year (https://uselectionatlas.org/FORUM/index.php?topic=166668.msg4837582#msg4837582). CA stays unchanged at 53 instead of adding a seat and FL gains 2 instead of 1 up to 29. The bubble seats in this projection are based on the last five awarded and the next five in line.
The last five awarded are IL-17, TX-39, CA-53, AZ-10, and FL-29 (#435).
The next five in line are MT-2, AL-7, CA-54, VA-12, and MN-8.
An alternate projection could use just the last two years of estimates to determine the rate of growth for the rest of the decade. That model gives the same projection as the one above, with changes only in the order of the bubble seats.
Title: Re: Census population estimates 2011-2019
Post by: ○∙◄☻¥tπ[╪AV┼cVê└ on December 21, 2016, 09:50:11 PM
Even losing one would be sort of a victory for NY since it'd be the first time it didn't lose multiple since peaking at 45 in the '30s and '40s.
Title: Re: Census population estimates 2011-2019
Post by: jimrtex on December 22, 2016, 05:25:08 AM
The last five awarded are IL-17, TX-39, CA-53, AZ-10, and FL-29 (#435).
The next five in line are MT-2, AL-7, CA-54, VA-12, and MN-8.
An alternate projection could use just the last two years of estimates to determine the rate of growth for the rest of the decade. That model gives the same projection as the one above, with changes only in the order of the bubble seats.
The next five in line are MT-2, AL-7, CA-54, VA-12, and MN-8.
An alternate projection could use just the last two years of estimates to determine the rate of growth for the rest of the decade. That model gives the same projection as the one above, with changes only in the order of the bubble seats.
For 2000 and 2010, larger states with a fraction less than 0.5 were being rounded upward. But it appears that this tendency may be balancing out. Arizona and Florida are increasing their growth, so that a projection that assumes a constant rate of increase will underestimate the population, so AZ-10 and FL-29 will likely pass IL-17 by 2020.
For MT-2 or AL-7 etc. to pass IL-17 would require an even larger decrease for Illinois. Illinois has been negative for the past 3 years, and the rate of decline is increasing .
So it appears to be in the realm of possibility, but perhaps not likelihood.
Title: Re: Census population estimates 2011-2019
Post by: Tender Branson on December 24, 2016, 02:10:47 AM
Question:
The 2020 Census is done on April 1, 2020 (and slightly before and after that).
But the results + apportionment of CD's and EV's are only announced in December 2020.
So, are the new EV numbers already used for the 2020 Presidential election, or only for 2024 ?
The 2020 Census is done on April 1, 2020 (and slightly before and after that).
But the results + apportionment of CD's and EV's are only announced in December 2020.
So, are the new EV numbers already used for the 2020 Presidential election, or only for 2024 ?
Title: Re: Census population estimates 2011-2019
Post by: hopper on December 24, 2016, 03:21:17 AM
ND down to 0.1% growth, from 2.3% in the previous year.
:o
:o
Title: Re: Census population estimates 2011-2019
Post by: hopper on December 24, 2016, 03:28:54 AM
NY losing population? Sad!
Any reason why, though?
Any reason why, though?
Here are the relevant components:
Births +237K
Deaths -161K
Natural increase +76K
International migration +118K
Domestic migration -191K
Net migration -73K
Total population change -2K
Note that's the sum of natural change and migration is a 3K increase not the -2K decrease that's being reported. According to the CB the change "includes a residual. This residual represents the change in population that cannot be attributed to any specific demographic component. See Population Estimates Terms and Definitions at http://www.census.gov/programs-surveys/popest/about/glossary.html."
In any case the largest factor in the decline in NY is the net migration to other states.
Title: Re: Census population estimates 2011-2019
Post by: muon2 on December 24, 2016, 04:29:22 AM
Question:
The 2020 Census is done on April 1, 2020 (and slightly before and after that).
But the results + apportionment of CD's and EV's are only announced in December 2020.
So, are the new EV numbers already used for the 2020 Presidential election, or only for 2024 ?
The 2020 Census is done on April 1, 2020 (and slightly before and after that).
But the results + apportionment of CD's and EV's are only announced in December 2020.
So, are the new EV numbers already used for the 2020 Presidential election, or only for 2024 ?
The next apportionment comes out after the 2020 election, so it will first be used in the 2022 off-year election and the presidential election of 2024.
Title: Re: Census population estimates 2011-2019
Post by: Tender Branson on December 24, 2016, 05:02:50 AM
Question:
The 2020 Census is done on April 1, 2020 (and slightly before and after that).
But the results + apportionment of CD's and EV's are only announced in December 2020.
So, are the new EV numbers already used for the 2020 Presidential election, or only for 2024 ?
The 2020 Census is done on April 1, 2020 (and slightly before and after that).
But the results + apportionment of CD's and EV's are only announced in December 2020.
So, are the new EV numbers already used for the 2020 Presidential election, or only for 2024 ?
The next apportionment comes out after the 2020 election, so it will first be used in the 2022 off-year election and the presidential election of 2024.
Interesting, thanks.
If they'd release the numbers 2 months earlier, they could already use the newly apportioned EV for the 2020 Presidential Election, instead of waiting 4 years.
But I guess calculating the results from the Census takes some time ...
Title: Re: Census population estimates 2011-2019
Post by: muon2 on December 24, 2016, 05:26:42 AM
Question:
The 2020 Census is done on April 1, 2020 (and slightly before and after that).
But the results + apportionment of CD's and EV's are only announced in December 2020.
So, are the new EV numbers already used for the 2020 Presidential election, or only for 2024 ?
The 2020 Census is done on April 1, 2020 (and slightly before and after that).
But the results + apportionment of CD's and EV's are only announced in December 2020.
So, are the new EV numbers already used for the 2020 Presidential election, or only for 2024 ?
The next apportionment comes out after the 2020 election, so it will first be used in the 2022 off-year election and the presidential election of 2024.
Interesting, thanks.
If they'd release the numbers 2 months earlier, they could already use the newly apportioned EV for the 2020 Presidential Election, instead of waiting 4 years.
But I guess calculating the results from the Census takes some time ...
They'd need the numbers well before that. The electors are selected at state party conventions before the national conventions. The follow up Census for those who didn't respond isn't done until the summer, but by then state conventions have already occurred.
Title: Re: Census population estimates 2011-2019
Post by: Nyvin on December 24, 2016, 10:54:16 AM
Question:
The 2020 Census is done on April 1, 2020 (and slightly before and after that).
But the results + apportionment of CD's and EV's are only announced in December 2020.
So, are the new EV numbers already used for the 2020 Presidential election, or only for 2024 ?
The 2020 Census is done on April 1, 2020 (and slightly before and after that).
But the results + apportionment of CD's and EV's are only announced in December 2020.
So, are the new EV numbers already used for the 2020 Presidential election, or only for 2024 ?
The next apportionment comes out after the 2020 election, so it will first be used in the 2022 off-year election and the presidential election of 2024.
Interesting, thanks.
If they'd release the numbers 2 months earlier, they could already use the newly apportioned EV for the 2020 Presidential Election, instead of waiting 4 years.
But I guess calculating the results from the Census takes some time ...
I don't think that would work either, the candidates need to know what district their primary will be in well in advance of the actual election.
Title: Re: Census population estimates 2011-2019
Post by: hopper on December 24, 2016, 12:38:31 PM
States that passed each other in the population rankings in 2016:
Tennessee passed Indiana for 16th most populous state
Colorado passed Minnesota for 21st most populous state
Utah passed Mississippi for 31st most populous state
Nevada passed Kansas for most 34 most populous state(I think that happened this year.)
Tennessee passed Indiana for 16th most populous state
Colorado passed Minnesota for 21st most populous state
Utah passed Mississippi for 31st most populous state
Nevada passed Kansas for most 34 most populous state(I think that happened this year.)
Title: Re: Census population estimates 2011-2019
Post by: hopper on December 24, 2016, 12:57:21 PM
Surprised that PA might overtake IL. Is all this growth in urban areas?
Title: Re: Census population estimates 2011-2019
Post by: Vern on December 24, 2016, 12:57:39 PM
Could NC pass GA in the next few years in population?
Title: Re: Census population estimates 2011-2019
Post by: muon2 on December 24, 2016, 01:29:11 PM
Could NC pass GA in the next few years in population?
GA and NC are both growing at a rate of 1.0%/year. The were 162K apart in pop in 2010 an GA got a favorable rounding to give it one more seat than NC. In the 2016 estimate GA is 172K ahead of NC so GA is actually gaining slightly faster and should stay ahead of NC.
If they maintain the same rate of growth for the whole decade GA will be 181K ahead of NC for the 2020 census. However, this time GA will round down and NC will round up so NC gains a seat to equalize with GA.
Title: Re: Census population estimates 2011-2019
Post by: Torie on December 24, 2016, 06:07:13 PM
In other news, Hudson seems to be on track to fall a tad below 6,000 (excluding the prisoner population). No, I have not crunched the numbers - it was just an eyeball thing. On my block, since the 2010 census, I suspect that the drop has been around 40% - just massive. But I am bring a new unit on line on my block. But I see no abatement to the trend. If anything it is accelerating, and since the local school district is so horrible, the new folks moving in, into refurbished housing, or who refurbish, convert multi family dwellings to single family, etc., are almost always folks with no kids, or with kids who don't live at home (they have achieved the age of majority). So Hudson is moving slowly towards more well to do folks with no kids in school, or in private school, or folks with kids, who are poor.
Quite a toxic combo really, and replicated across the Fruited Plain. We have a problem! Who knew?
Quite a toxic combo really, and replicated across the Fruited Plain. We have a problem! Who knew?
Title: Re: Census population estimates 2011-2019
Post by: Ban my account ffs! on December 24, 2016, 06:56:20 PM
In other news, Hudson seems to be on track to fall a tad below 6,000 (excluding the prisoner population). No, I have not crunched the numbers - it was just an eyeball thing. On my block, since the 2010 census, I suspect that the drop has been around 40% - just massive. But I am bring a new unit on line on my block. But I see no abatement to the trend. If anything it is accelerating, and since the local school district is so horrible, the new folks moving in, into refurbished housing, or who refurbish, convert multi family dwellings to single family, etc., are almost always folks with no kids, or with kids who don't live at home (they have achieved the age of majority). So Hudson is moving slowly towards more well to do folks with no kids in school, or in private school, or folks with kids, who are poor.
Quite a toxic combo really, and replicated across the Fruited Plain. We have a problem! Who knew?
Quite a toxic combo really, and replicated across the Fruited Plain. We have a problem! Who knew?
Upstate New York is in for it... without a new baby boom.. because people tend to have kids in place (as opposed to attracting immigrants)
Title: Re: Census population estimates 2011-2019
Post by: jimrtex on December 24, 2016, 11:38:20 PM
Question:
The 2020 Census is done on April 1, 2020 (and slightly before and after that).
But the results + apportionment of CD's and EV's are only announced in December 2020.
So, are the new EV numbers already used for the 2020 Presidential election, or only for 2024 ?
The 2020 Census is done on April 1, 2020 (and slightly before and after that).
But the results + apportionment of CD's and EV's are only announced in December 2020.
So, are the new EV numbers already used for the 2020 Presidential election, or only for 2024 ?
Based on the 2000 census data, the population of the Bush states and the Gore states was extremely close. Had the 2000 apportion been used, Bush would have won the electoral vote based on winning the greater number of states carried and the two senate-based electors. This would have been true even if thousands of representatives had been apportioned.
The electoral vote was as close as it was, only because it was based on 10+ year old data.
Title: Re: Census population estimates 2011-2019
Post by: jimrtex on December 24, 2016, 11:39:20 PM
Is there any set date when the county estimates come out?
They come out in March, I don't know if there's a public date yet.
Title: Re: Census population estimates 2011-2019
Post by: / on January 23, 2017, 08:19:09 AM
What are NC's chances of getting a 15th district in 2030?
Title: Re: Census population estimates 2011-2019
Post by: muon2 on January 23, 2017, 10:07:39 AM
What are NC's chances of getting a 15th district in 2030?
As I noted above, GA is maintaining its lead over NC this decade. If that continues into the next decade then GA gets its 15th CD before NC. The question you would have to ask is what conditions are needed for both GA and NC to gain in 2030. That requires some guesses about changes in growth in places like TX and FL, and how much the Rust Belt slows compared to the rest of the US. That's hard so far out without a lot of other projection data that isn't in the basic estimate.
Title: Re: Census population estimates 2011-2019
Post by: Kevinstat on January 30, 2017, 07:39:33 PM
In other news, Hudson seems to be on track to fall a tad below 6,000 (excluding the prisoner population). No, I have not crunched the numbers - it was just an eyeball thing. On my block, since the 2010 census, I suspect that the drop has been around 40% - just massive. But I am bring a new unit on line on my block. But I see no abatement to the trend. If anything it is accelerating, and since the local school district is so horrible, the new folks moving in, into refurbished housing, or who refurbish, convert multi family dwellings to single family, etc., are almost always folks with no kids, or with kids who don't live at home (they have achieved the age of majority). So Hudson is moving slowly towards more well to do folks with no kids in school, or in private school, or folks with kids, who are poor.
Quite a toxic combo really, and replicated across the Fruited Plain. We have a problem! Who knew?
Quite a toxic combo really, and replicated across the Fruited Plain. We have a problem! Who knew?
Upstate New York is in for it... without a new baby boom.. because people tend to have kids in place (as opposed to attracting immigrants)
Title: Re: Census population estimates 2011-2019
Post by: Kevinstat on January 30, 2017, 07:44:49 PM
Is there any set date when the county estimates come out?
They come out in March, I don't know if there's a public date yet.
Title: Re: Census population estimates 2011-2019
Post by: Tender Branson on February 03, 2017, 05:23:22 AM
Could NC pass GA in the next few years in population?
Pretty unlikely.
They are having virtually the same growth.
Title: Re: Census population estimates 2011-2019
Post by: Cokeland Chastain on February 12, 2017, 02:42:27 PM
AL = Loser; Montgomery and Birmingham shrinking
AZ = Winner; Area around Phoenix exploding
CA = Winner; Mexicans entering state
CO = Winner
FL = Winner; Cubans + Old people moving to state
GA = Winner; Atlanta growing
IL = Loser; R.I.P. Chicago
MA = Loser; Boston shrinking
MI = Loser; R.I.P. Detroit
MO = Loser; R.I.P. St. Louis
NV = Winner; Las Vegas exploding
NY = Loser; people getting the heck out
etc.
Title: Re: Census population estimates 2011-2019
Post by: Brittain33 on February 12, 2017, 11:09:10 PM
AL = Loser; Montgomery and Birmingham shrinking
AZ = Winner; Area around Phoenix exploding
CA = Winner; Mexicans entering state
CO = Winner
FL = Winner; Cubans + Old people moving to state
GA = Winner; Atlanta growing
IL = Loser; R.I.P. Chicago
MA = Loser; Boston shrinking
MI = Loser; R.I.P. Detroit
MO = Loser; R.I.P. St. Louis
NV = Winner; Las Vegas exploding
NY = Loser; people getting the heck out
etc.
AZ = Winner; Area around Phoenix exploding
CA = Winner; Mexicans entering state
CO = Winner
FL = Winner; Cubans + Old people moving to state
GA = Winner; Atlanta growing
IL = Loser; R.I.P. Chicago
MA = Loser; Boston shrinking
MI = Loser; R.I.P. Detroit
MO = Loser; R.I.P. St. Louis
NV = Winner; Las Vegas exploding
NY = Loser; people getting the heck out
etc.
I'm not sure I understand this post, but Boston is growing in population faster than it has in decades.
Title: Re: Census population estimates 2011-2019
Post by: Nyvin on February 13, 2017, 10:31:31 AM
AL = Loser; Montgomery and Birmingham shrinking
AZ = Winner; Area around Phoenix exploding
CA = Winner; Mexicans entering state
CO = Winner
FL = Winner; Cubans + Old people moving to state
GA = Winner; Atlanta growing
IL = Loser; R.I.P. Chicago
MA = Loser; Boston shrinking
MI = Loser; R.I.P. Detroit
MO = Loser; R.I.P. St. Louis
NV = Winner; Las Vegas exploding
NY = Loser; people getting the heck out
etc.
AZ = Winner; Area around Phoenix exploding
CA = Winner; Mexicans entering state
CO = Winner
FL = Winner; Cubans + Old people moving to state
GA = Winner; Atlanta growing
IL = Loser; R.I.P. Chicago
MA = Loser; Boston shrinking
MI = Loser; R.I.P. Detroit
MO = Loser; R.I.P. St. Louis
NV = Winner; Las Vegas exploding
NY = Loser; people getting the heck out
etc.
In a lot of those cases it's actually the rural/small town area's decline that's causing them to be "losers". NYC and Boston in particular are actually doing pretty good. Upstate NY is where the population loss is happening.
Same goes for Illinois, Chicago itself might be losing people (very recently) but the downstate area is where the real loses are happening as well.
Title: Re: Census population estimates 2011-2019
Post by: Wiz in Wis on February 14, 2017, 04:42:58 PM
AL = Loser; Montgomery and Birmingham shrinking
AZ = Winner; Area around Phoenix exploding
CA = Winner; Mexicans entering state
CO = Winner
FL = Winner; Cubans + Old people moving to state
GA = Winner; Atlanta growing
IL = Loser; R.I.P. Chicago
MA = Loser; Boston shrinking
MI = Loser; R.I.P. Detroit
MO = Loser; R.I.P. St. Louis
NV = Winner; Las Vegas exploding
NY = Loser; people getting the heck out
etc.
AZ = Winner; Area around Phoenix exploding
CA = Winner; Mexicans entering state
CO = Winner
FL = Winner; Cubans + Old people moving to state
GA = Winner; Atlanta growing
IL = Loser; R.I.P. Chicago
MA = Loser; Boston shrinking
MI = Loser; R.I.P. Detroit
MO = Loser; R.I.P. St. Louis
NV = Winner; Las Vegas exploding
NY = Loser; people getting the heck out
etc.
This makes me think the last time you did your research was 1997.
Title: Re: Census population estimates 2011-2019
Post by: Ban my account ffs! on February 14, 2017, 05:59:09 PM
In other news, Hudson seems to be on track to fall a tad below 6,000 (excluding the prisoner population). No, I have not crunched the numbers - it was just an eyeball thing. On my block, since the 2010 census, I suspect that the drop has been around 40% - just massive. But I am bring a new unit on line on my block. But I see no abatement to the trend. If anything it is accelerating, and since the local school district is so horrible, the new folks moving in, into refurbished housing, or who refurbish, convert multi family dwellings to single family, etc., are almost always folks with no kids, or with kids who don't live at home (they have achieved the age of majority). So Hudson is moving slowly towards more well to do folks with no kids in school, or in private school, or folks with kids, who are poor.
Quite a toxic combo really, and replicated across the Fruited Plain. We have a problem! Who knew?
Quite a toxic combo really, and replicated across the Fruited Plain. We have a problem! Who knew?
Upstate New York is in for it... without a new baby boom.. because people tend to have kids in place (as opposed to attracting immigrants)
But if people started having more children, which can happen for myriad reasons that have nothing to do with the economy, it would increase demand for products and services which would push up demand for productivity from the parents, increasing job security. The aggregate effect is a more vibrant economy and community.
Reinforcing this would be that families with children try to avoid picking up and moving far away. A baby boom would likely decrease mobility and there would be a desire for companies to invest where they were rather than somewhere that immigrants or domestic migrants want to go.
At this point, we are so far along in the aging and deindustrialization process, that this would likely not fix the situation... but it would slow the decline.
New England has a top heavy age structure because fertility there is low. In 15 years the largest cohorts of people will be in their early 70s and without a major change in migration, the population will be declining quickly. And the problem is that unlike with growth, which can be directed into neat, new subdivisions one at a time... shrinkage is piecemeal... one older couple dies out down the street, another across the street... now you have two empty houses with no chance of being filled again... and the lawns become overgrown, etc. Empty lots slowly replace the once bustling, tidy neighborhood... this drives the remaining people out... to places like Florida.
Title: Re: Census population estimates 2011-2019
Post by: hopper on February 18, 2017, 11:45:50 PM
AL = Loser; Montgomery and Birmingham shrinking
AZ = Winner; Area around Phoenix exploding
CA = Winner; Mexicans entering state
CO = Winner
FL = Winner; Cubans + Old people moving to state
GA = Winner; Atlanta growing
IL = Loser; R.I.P. Chicago
MA = Loser; Boston shrinking
MI = Loser; R.I.P. Detroit
MO = Loser; R.I.P. St. Louis
NV = Winner; Las Vegas exploding
NY = Loser; people getting the heck out
etc.
AZ = Winner; Area around Phoenix exploding
CA = Winner; Mexicans entering state
CO = Winner
FL = Winner; Cubans + Old people moving to state
GA = Winner; Atlanta growing
IL = Loser; R.I.P. Chicago
MA = Loser; Boston shrinking
MI = Loser; R.I.P. Detroit
MO = Loser; R.I.P. St. Louis
NV = Winner; Las Vegas exploding
NY = Loser; people getting the heck out
etc.
MA-Boston is growing by the way. Its Western Massachusetts that's not gaining much population or maybe losing population.
Title: Re: Census population estimates 2011-2019
Post by: Kevinstat on February 24, 2017, 08:43:44 PM
In other news, Hudson seems to be on track to fall a tad below 6,000 (excluding the prisoner population). No, I have not crunched the numbers - it was just an eyeball thing. On my block, since the 2010 census, I suspect that the drop has been around 40% - just massive. But I am bring a new unit on line on my block. But I see no abatement to the trend. If anything it is accelerating, and since the local school district is so horrible, the new folks moving in, into refurbished housing, or who refurbish, convert multi family dwellings to single family, etc., are almost always folks with no kids, or with kids who don't live at home (they have achieved the age of majority). So Hudson is moving slowly towards more well to do folks with no kids in school, or in private school, or folks with kids, who are poor.
Quite a toxic combo really, and replicated across the Fruited Plain. We have a problem! Who knew?
Quite a toxic combo really, and replicated across the Fruited Plain. We have a problem! Who knew?
Upstate New York is in for it... without a new baby boom.. because people tend to have kids in place (as opposed to attracting immigrants)
But if people started having more children, which can happen for myriad reasons that have nothing to do with the economy, it would increase demand for products and services which would push up demand for productivity from the parents, increasing job security. The aggregate effect is a more vibrant economy and community.
Reinforcing this would be that families with children try to avoid picking up and moving far away. A baby boom would likely decrease mobility and there would be a desire for companies to invest where they were rather than somewhere that immigrants or domestic migrants want to go.
At this point, we are so far along in the aging and deindustrialization process, that this would likely not fix the situation... but it would slow the decline.
New England has a top heavy age structure because fertility there is low. In 15 years the largest cohorts of people will be in their early 70s and without a major change in migration, the population will be declining quickly. And the problem is that unlike with growth, which can be directed into neat, new subdivisions one at a time... shrinkage is piecemeal... one older couple dies out down the street, another across the street... now you have two empty houses with no chance of being filled again... and the lawns become overgrown, etc. Empty lots slowly replace the once bustling, tidy neighborhood... this drives the remaining people out... to places like Florida.
Title: Re: Census population estimates 2011-2019
Post by: nclib on February 25, 2017, 05:10:59 PM
Sorry if this has already been mentioned, but where could I find congressional district data/populations in 2010, and also in 2016 (or most recent estimate)?
Title: Re: Census population estimates 2011-2019
Post by: jimrtex on February 25, 2017, 11:57:55 PM
Sorry if this has already been mentioned, but where could I find congressional district data/populations in 2010, and also in 2016 (or most recent estimate)?
The Census Bureau American Fact Finder.
There was a special compilation of Census Data for the new congressional districts (113th session was after redistricting) (they won't be correct for Florida or Virginia, until they get updated they will be 115th)
The American Community Survey has estimates for congressional districts. Be sure to use 1-year 2015. Otherwise, you get blended data over 5 years - better for social characteristics since there is more data, but less so for a snapshot population. You could get 1-year data for previous years and try to project a trend line.
Title: Re: Census population estimates 2011-2019
Post by: nclib on February 26, 2017, 09:00:43 PM
Sorry if this has already been mentioned, but where could I find congressional district data/populations in 2010, and also in 2016 (or most recent estimate)?
The Census Bureau American Fact Finder.
There was a special compilation of Census Data for the new congressional districts (113th session was after redistricting) (they won't be correct for Florida or Virginia, until they get updated they will be 115th)
The American Community Survey has estimates for congressional districts. Be sure to use 1-year 2015. Otherwise, you get blended data over 5 years - better for social characteristics since there is more data, but less so for a snapshot population. You could get 1-year data for previous years and try to project a trend line.
Somehow it's too big for my computer's memory. Is there another way; I'm mainly looking for actual population estimates for CDs in 2010 and 2015.
Title: Re: Census population estimates 2011-2019
Post by: jimrtex on February 28, 2017, 09:23:54 AM
Sorry if this has already been mentioned, but where could I find congressional district data/populations in 2010, and also in 2016 (or most recent estimate)?
The Census Bureau American Fact Finder.
There was a special compilation of Census Data for the new congressional districts (113th session was after redistricting) (they won't be correct for Florida or Virginia, until they get updated they will be 115th)
The American Community Survey has estimates for congressional districts. Be sure to use 1-year 2015. Otherwise, you get blended data over 5 years - better for social characteristics since there is more data, but less so for a snapshot population. You could get 1-year data for previous years and try to project a trend line.
Somehow it's too big for my computer's memory. Is there another way; I'm mainly looking for actual population estimates for CDs in 2010 and 2015.
Go to American Fact Finder. Do advanced search show all.
Topic > Years > 2010
Topic > Data Set > 2010 113th Congress 100% Data
Geographies (show all radio button)
Geographies > Congressional Districts > All Congressional Districts for United States
Topics > People > Basic Count/Estimate > Total Population
Check P1, View or Download
========
Clear All Selections
Topics > Year > 2015
(no need to select data set since there is only one for 2015)
Geographies > Congressional Districts
Select all congressional districts in United States
Topic > People > Basic Count/Estimate > Total Population
Check total count, using the 2015 1-year estimate.
Title: Re: Census population estimates 2011-2019
Post by: nclib on February 28, 2017, 11:12:38 PM
That works now, thanks.
Title: Re: Census population estimates 2011-2019
Post by: jimrtex on March 20, 2017, 08:13:21 AM
2016 County Estimates will be released on Thursday, March 23 .
Title: Re: Census population estimates 2011-2019
Post by: libertpaulian on March 22, 2017, 07:18:16 PM
2016 County Estimates will be released on Thursday, March 23 .
Title: Re: Census population estimates 2011-2019
Post by: cinyc on March 22, 2017, 07:22:59 PM
I want to see if the (until recently) fast-growing oil counties, like McKenzie and Williams, ND, have started to lose population or are just growing more slowly.
Title: Re: Census population estimates 2011-2019
Post by: Gass3268 on March 22, 2017, 08:58:57 PM
I want to see if the (until recently) fast-growing oil counties, like McKenzie and Williams, ND, have started to lose population or are just growing more slowly.
Based on the state data it will be close.
Title: Re: Census population estimates 2011-2019
Post by: muon2 on March 23, 2017, 06:34:29 AM
I want to see if the (until recently) fast-growing oil counties, like McKenzie and Williams, ND, have started to lose population or are just growing more slowly.
It looks like they are losing:
Quote
North Dakota counties no longer top the list of fastest-growing counties by percentage change.
McKenzie County fell from second-fastest growing by percentage change to 2,858th.
Williams County fell from third to 3,105th.
Mountrail County fell from sixth to 2,375th.
Stark County fell from eighth to 3,103rd.
McKenzie County fell from second-fastest growing by percentage change to 2,858th.
Williams County fell from third to 3,105th.
Mountrail County fell from sixth to 2,375th.
Stark County fell from eighth to 3,103rd.
()
Title: Re: Census population estimates 2011-2019
Post by: cinyc on March 23, 2017, 08:06:57 PM
When do the county subdivision estimates come out? June?
Title: Re: Census population estimates 2011-2019
Post by: jimrtex on March 23, 2017, 08:24:37 PM
When do the county subdivision estimates come out? June?
Technically it is incorporated place and minor civil division (i.e. legal entities).
Title: Re: Census population estimates 2011-2019
Post by: cinyc on March 23, 2017, 09:19:06 PM
When do the county subdivision estimates come out? June?
Technically it is incorporated place and minor civil division (i.e. legal entities).
Great!
Hopefully, I'll find the time to update the maps I made last year, like the 2014-2015 Percentage Change Map (https://cinyc.carto.com/viz/1404d830-21fd-11e6-9f99-0e674067d321/public_map) for those incorporated places, minor civil divisions (and CDPs?).
Title: Re: Census population estimates 2011-2019
Post by: jimrtex on March 23, 2017, 10:16:42 PM
When do the county subdivision estimates come out? June?
Technically it is incorporated place and minor civil division (i.e. legal entities).
Great!
Hopefully, I'll find the time to update the maps I made last year, like the 2014-2015 Percentage Change Map (https://cinyc.carto.com/viz/1404d830-21fd-11e6-9f99-0e674067d321/public_map) for those incorporated places, minor civil divisions (and CDPs?).
Incorporated places only.
The American Community Survey does produce estimates for other census geography down to the Block Group level. The sampling used for the ACS is designed to produce statistically valid results for such small areas - if you use the 5-year sample. So for CDP's you could get an 2011-2015 estimate. Perhaps not so useful for population total, but useful for other social characteristics.
For small population cities (a couple of hundred) the census uses a higher sampling rate for the ACS.
The ACS also produces results for things like congressional districts and legislative districts. For some of these, you may be able to use one-year samples. The census bureau knows where their samples are from and they could produce estimates for a census block, but a 4-household sample for a block with 20 houses is not a very good sample, and would break confidentiality anyhow. But they can aggregate samples for larger areas. For example, they have produced CVAP estimates by race for various congressional district plans in Texas.
Title: Re: Census population estimates 2011-2019
Post by: cinyc on April 27, 2017, 06:19:59 PM
When do the county subdivision estimates come out? June?
Technically it is incorporated place and minor civil division (i.e. legal entities).
According to Census' calendar, the incorporated place and minor civil division population estimates will be released to the public on Thursday, May 25. It looks like there will be an embargoed release to the media on Tuesday, May 23.
Title: Re: Census population estimates 2011-2019
Post by: cinyc on May 10, 2017, 09:49:41 PM
Census has released their November 2016 Voting and Registration Supplement (https://www.census.gov/data/tables/time-series/demo/voting-and-registration/p20-580.html?intcmp=s1_voting).
From what I've read elsewhere on the Internet but not independently verified, overall Hispanic turnout was slightly down in 2016 versus 2012, even though more Hispanics voted due to Hispanic VAP growth.
From what I've read elsewhere on the Internet but not independently verified, overall Hispanic turnout was slightly down in 2016 versus 2012, even though more Hispanics voted due to Hispanic VAP growth.
Title: Re: Census population estimates 2011-2019
Post by: cinyc on May 23, 2017, 11:43:35 AM
2016 city and town population estimates come out on Thursday (an embargoed press release and graphic supposedly went out to the media today). Any predictions or things you want to see?
I'm interested in population declines in Western North Dakota, and how much Upstate New York Cities proper have lost population over the past year.
I'm interested in population declines in Western North Dakota, and how much Upstate New York Cities proper have lost population over the past year.
Title: Re: Census population estimates 2011-2019
Post by: Seattle on May 23, 2017, 01:18:15 PM
Prediction: Seattle tops 700k. It'll be tough, but July 2015-2016 saw around ~7,500 units delivered, a similar, if not slightly greater amount than the previous period. 2016-2017, 2017-2018, and 2018-2019 should be nuts though, with ~10k and ~13k expected in 2017 and 2018 respectively.
I'd also like to see if growth has picked up in Tacoma and Spokane.
Things to look for:
Phoenix passes Philadelphia (4k difference)
San Francisco passes Jacksonville (4k difference)
Columbus passes Indianapolis (3k difference)
DC passes Detroit (5k difference), as Detroit is still declining
I'd also like to see if growth has picked up in Tacoma and Spokane.
Things to look for:
Phoenix passes Philadelphia (4k difference)
San Francisco passes Jacksonville (4k difference)
Columbus passes Indianapolis (3k difference)
DC passes Detroit (5k difference), as Detroit is still declining
Title: Re: Census population estimates 2011-2019
Post by: cinyc on May 24, 2017, 11:20:21 PM
The embargo on the city estimates has been lifted, and various news websites are filing stories on the population estimates. But the database and press release isn't available yet on census.gov.
Here's an alternate link to search for city results from Cleveland.com (http://www.cleveland.com/datacentral/index.ssf/2017/05/2016_census_population_estimat.html).
Yes, Seattle topped 700,000 residents.
The Top 10 U.S. Cities (http://www.azcentral.com/story/news/local/phoenix/2017/05/25/phoenix-overtakes-philadelphia-5th-largest-u-s-city/344047001/)
1. New York: 8,537,673
2. Los Angeles: 3,976,322
3. Chicago: 2,704,958
4. Houston: 2,303,482
5. Phoenix: 1,615,017
6. Philadelphia: 1,567,872
7. San Antonio: 1,492,510
8. San Diego: 1,406,630
9. Dallas: 1,317,929
10. San Jose: 1,025,350
Title: Re: Census population estimates 2011-2019
Post by: cinyc on May 24, 2017, 11:49:57 PM
Census' press release is here (https://www.census.gov/newsroom/press-releases/2017/cb17-81-population-estimates-subcounty.html#fastest-growing). The rest of their press kit is here (https://www.census.gov/newsroom/press-kits/2017/population-estimates-subcounty.html). The actual data will be available in the morning, before 10AM.
From the press release:
Phoenix passed Philadelphia.
San Francisco did not pass Jacksonville.
Columbus passed Indianapolis.
DC passed Detroit, which is still declining. Detroit reportedly fell to 23 or 24, depending on which newspaper you believe.
From the press release:
Quote
Ten of the 15 fastest-growing large cities were located across the South in 2016, with four of the top five in Texas, according to new population estimates released today by the U.S. Census Bureau.
Conroe, Texas (near Houston), was the fastest-growing large city (population of 50,000 or more) between 2015 and 2016 at 7.8 percent, making its growth rate more than 11 times the nations growth rate of 0.7 percent. Some of the other fastest-growing cities were: Frisco, Texas (6.2 percent); McKinney, Texas (5.9 percent); Greenville, S.C. (5.8 percent); and Georgetown, Texas (5.5 percent).
Overall, cities in the South continue to grow at a faster rate than any other U.S region, said Amel Toukabri, a demographer in the Census Bureaus population division. Since the 2010 Census, the population in large southern cities grew by an average of 9.4 percent. In comparison, cities in the West grew 7.3 percent, while cities in the Northeast and Midwest had much lower growth rates at 1.8 percent and 3.0 percent respectively.
Four cities in the West Bend, Ore.; Buckeye, Ariz.; Lehi, Utah; and Meridian, Idaho were among the top 15 fastest growing. Only one city in the Midwest, Ankeny, Iowa, topped the list while no cities in the Northeast were among the nations fastest growing.
--Snip--
Things to look for:
Phoenix passes Philadelphia (4k difference)
San Francisco passes Jacksonville (4k difference)
Columbus passes Indianapolis (3k difference)
DC passes Detroit (5k difference), as Detroit is still declining
Phoenix passes Philadelphia (4k difference)
San Francisco passes Jacksonville (4k difference)
Columbus passes Indianapolis (3k difference)
DC passes Detroit (5k difference), as Detroit is still declining
Phoenix passed Philadelphia.
San Francisco did not pass Jacksonville.
Columbus passed Indianapolis.
DC passed Detroit, which is still declining. Detroit reportedly fell to 23 or 24, depending on which newspaper you believe.
Title: Re: Census population estimates 2011-2019
Post by: Seattle on May 25, 2017, 12:10:19 AM
Thanks for the data scrounging! Very happy to see Seattle reach over 700k. Back in 2010, no one thought the city would reach that mark before 2020, let alone 2016!
Title: Re: Census population estimates 2011-2019
Post by: Gass3268 on May 25, 2017, 09:14:55 AM
Has the data been posted yet?
Title: Re: Census population estimates 2011-2019
Post by: Gass3268 on May 25, 2017, 09:24:41 AM
Nashville passed Memphis to become the largest city in Tennessee.
Charleston passed Columbia to become the largest city in South Carolina.
Charleston passed Columbia to become the largest city in South Carolina.
Title: Re: Census population estimates 2011-2019
Post by: KingSweden on May 25, 2017, 09:39:35 AM
Nashville passed Memphis to become the largest city in Tennessee.
Charleston passed Columbia to become the largest city in South Carolina.
Charleston passed Columbia to become the largest city in South Carolina.
It's always surprised me that Charleston and Nashville weren't previously the largest
Title: Re: Census population estimates 2011-2019
Post by: muon2 on May 25, 2017, 10:02:00 AM
After growing by 23K in the first 3 years of the decade Chicago has joined the rest of IL with population losses, falling by 14K since 2013, 8K just in last estimate year (7/1/15 - 7/1/16).
Title: Re: Census population estimates 2011-2019
Post by: KingSweden on May 25, 2017, 11:19:19 AM
Has the data been posted yet?
I didn't see the raw data anywhere
Title: Re: Census population estimates 2011-2019
Post by: Gass3268 on May 25, 2017, 12:57:54 PM
Has the data been posted yet?
I didn't see the raw data anywhere
Here ya go! (https://www.census.gov/data/tables/2016/demo/popest/total-cities-and-towns.html)
Title: Re: Census population estimates 2011-2019
Post by: Tintrlvr on May 25, 2017, 01:13:52 PM
DC passed Detroit, which is still declining. Detroit reportedly fell to 23 or 24, depending on which newspaper you believe.
#23, apparently. Boston also passed Detroit. Still ahead of Nashville with a gap big enough that Nashville probably won't pass Detroit next year (but obviously will in 2019).
Title: Re: Census population estimates 2011-2019
Post by: jimrtex on May 25, 2017, 02:13:09 PM
Nashville passed Memphis to become the largest city in Tennessee.
Charleston passed Columbia to become the largest city in South Carolina.
Charleston passed Columbia to become the largest city in South Carolina.
Possible future losses would be Cheyenne (to Casper) and Charleston (to Huntington), and a reversal Nashville (to Memphis).
Possible reversals Columbia (from Charleston), Hartford (from Bridgeport and New Haven), and Madison (from Milwaukee)
Title: Re: Census population estimates 2011-2019
Post by: cinyc on May 26, 2017, 03:01:22 AM
I've made my maps using the 2016 Estimates Data. Please let me know if there are any obvious errors. There may be a separate post analyzing trends in the future:
2015-2016 Percentage Change in Cities, Towns, and County Remainders Population (https://cinyc.carto.com/viz/f83928f7-f42c-4ba7-a659-4c4502f5d84b/public_map)
2010-2016 Percentage Change versus 2010 Census (https://cinyc.carto.com/viz/19fb16fa-41d7-11e7-8f7d-0e05a8b3e3d7/public_map)
2010-2016 Percentage Change versus 2010 Estimates Base (https://cinyc.carto.com/viz/2179fb11-c942-4958-b0e8-147324cb395a/public_map) (takes into account annexations and the like)
2015-2016 Numerical Change in Cities, Towns, and County Remainders Population (https://cinyc.carto.com/viz/b2bcd2b7-6090-4cdd-9d5d-04353b466967/public_map)
2010-2016 Numerical Change versus 2010 Census (https://cinyc.carto.com/viz/3e9b0441-a862-46e8-a23c-7065e1c6e568/public_map)
2010-2016 Numerical Change versus 2010 Estimates Base (https://cinyc.carto.com/viz/cdeddf5d-ac4c-45e8-87b8-56860b43e1d5/public_map)
Title: Re: Census population estimates 2011-2019
Post by: ajc0918 on May 26, 2017, 07:30:34 AM
I've made my maps using the 2016 Estimates Data. Please let me know if there are any obvious errors. There may be a separate post analyzing trends in the future:
2015-2016 Percentage Change in Cities, Towns, and County Remainders Population (https://cinyc.carto.com/viz/f83928f7-f42c-4ba7-a659-4c4502f5d84b/public_map)
2010-2016 Percentage Change versus 2010 Census (https://cinyc.carto.com/viz/19fb16fa-41d7-11e7-8f7d-0e05a8b3e3d7/public_map)
2010-2016 Percentage Change versus 2010 Estimates Base (https://cinyc.carto.com/viz/2179fb11-c942-4958-b0e8-147324cb395a/public_map) (takes into account annexations and the like)
2015-2016 Numerical Change in Cities, Towns, and County Remainders Population (https://cinyc.carto.com/viz/b2bcd2b7-6090-4cdd-9d5d-04353b466967/public_map)
2010-2016 Numerical Change versus 2010 Census (https://cinyc.carto.com/viz/3e9b0441-a862-46e8-a23c-7065e1c6e568/public_map)
2010-2016 Numerical Change versus 2010 Estimates Base (https://cinyc.carto.com/viz/cdeddf5d-ac4c-45e8-87b8-56860b43e1d5/public_map)
2015-2016 Percentage Change in Cities, Towns, and County Remainders Population (https://cinyc.carto.com/viz/f83928f7-f42c-4ba7-a659-4c4502f5d84b/public_map)
2010-2016 Percentage Change versus 2010 Census (https://cinyc.carto.com/viz/19fb16fa-41d7-11e7-8f7d-0e05a8b3e3d7/public_map)
2010-2016 Percentage Change versus 2010 Estimates Base (https://cinyc.carto.com/viz/2179fb11-c942-4958-b0e8-147324cb395a/public_map) (takes into account annexations and the like)
2015-2016 Numerical Change in Cities, Towns, and County Remainders Population (https://cinyc.carto.com/viz/b2bcd2b7-6090-4cdd-9d5d-04353b466967/public_map)
2010-2016 Numerical Change versus 2010 Census (https://cinyc.carto.com/viz/3e9b0441-a862-46e8-a23c-7065e1c6e568/public_map)
2010-2016 Numerical Change versus 2010 Estimates Base (https://cinyc.carto.com/viz/cdeddf5d-ac4c-45e8-87b8-56860b43e1d5/public_map)
Wow these are awesome, thank you.
I'm a little biased but I can't help but notice how Florida sticks out so much in the 2015-2016 and 2010-2016 percentage change map. Central Florida both Orlando and Tampa are seeing huge influxes of population. It will be interesting how this changes things politically.
Title: Re: Census population estimates 2011-2019
Post by: JerryArkansas on May 26, 2017, 07:51:54 AM
I've made my maps using the 2016 Estimates Data. Please let me know if there are any obvious errors. There may be a separate post analyzing trends in the future:
2015-2016 Percentage Change in Cities, Towns, and County Remainders Population (https://cinyc.carto.com/viz/f83928f7-f42c-4ba7-a659-4c4502f5d84b/public_map)
2010-2016 Percentage Change versus 2010 Census (https://cinyc.carto.com/viz/19fb16fa-41d7-11e7-8f7d-0e05a8b3e3d7/public_map)
2010-2016 Percentage Change versus 2010 Estimates Base (https://cinyc.carto.com/viz/2179fb11-c942-4958-b0e8-147324cb395a/public_map) (takes into account annexations and the like)
2015-2016 Numerical Change in Cities, Towns, and County Remainders Population (https://cinyc.carto.com/viz/b2bcd2b7-6090-4cdd-9d5d-04353b466967/public_map)
2010-2016 Numerical Change versus 2010 Census (https://cinyc.carto.com/viz/3e9b0441-a862-46e8-a23c-7065e1c6e568/public_map)
2010-2016 Numerical Change versus 2010 Estimates Base (https://cinyc.carto.com/viz/cdeddf5d-ac4c-45e8-87b8-56860b43e1d5/public_map)
2015-2016 Percentage Change in Cities, Towns, and County Remainders Population (https://cinyc.carto.com/viz/f83928f7-f42c-4ba7-a659-4c4502f5d84b/public_map)
2010-2016 Percentage Change versus 2010 Census (https://cinyc.carto.com/viz/19fb16fa-41d7-11e7-8f7d-0e05a8b3e3d7/public_map)
2010-2016 Percentage Change versus 2010 Estimates Base (https://cinyc.carto.com/viz/2179fb11-c942-4958-b0e8-147324cb395a/public_map) (takes into account annexations and the like)
2015-2016 Numerical Change in Cities, Towns, and County Remainders Population (https://cinyc.carto.com/viz/b2bcd2b7-6090-4cdd-9d5d-04353b466967/public_map)
2010-2016 Numerical Change versus 2010 Census (https://cinyc.carto.com/viz/3e9b0441-a862-46e8-a23c-7065e1c6e568/public_map)
2010-2016 Numerical Change versus 2010 Estimates Base (https://cinyc.carto.com/viz/cdeddf5d-ac4c-45e8-87b8-56860b43e1d5/public_map)
Could you possibly combine the two on one of your maps to show that this occurred?
Title: Re: Census population estimates 2011-2019
Post by: Brittain33 on May 26, 2017, 08:52:34 AM
I've made my maps using the 2016 Estimates Data. Please let me know if there are any obvious errors. There may be a separate post analyzing trends in the future:
2010-2016 Percentage Change versus 2010 Census (https://cinyc.carto.com/viz/19fb16fa-41d7-11e7-8f7d-0e05a8b3e3d7/public_map)
2010-2016 Percentage Change versus 2010 Census (https://cinyc.carto.com/viz/19fb16fa-41d7-11e7-8f7d-0e05a8b3e3d7/public_map)
Do annexations cause "Balance of X County" to drop? Looking at Dekalb, GA in particular.
Title: Re: Census population estimates 2011-2019
Post by: cinyc on May 26, 2017, 10:11:35 AM
I've made my maps using the 2016 Estimates Data. Please let me know if there are any obvious errors. There may be a separate post analyzing trends in the future:
2010-2016 Percentage Change versus 2010 Census (https://cinyc.carto.com/viz/19fb16fa-41d7-11e7-8f7d-0e05a8b3e3d7/public_map)
2010-2016 Percentage Change versus 2010 Census (https://cinyc.carto.com/viz/19fb16fa-41d7-11e7-8f7d-0e05a8b3e3d7/public_map)
Do annexations cause "Balance of X County" to drop? Looking at Dekalb, GA in particular.
In the 2010 census version of the map, yes. But not in the version versus 2010 population estimates, which controls for annexations and the like. IIRC, the balance of Dekalb, GA dropped because of the creation of a new city. We had the same issue in the 2010-15 version of the map.
Title: Re: Census population estimates 2011-2019
Post by: cinyc on May 26, 2017, 10:14:42 AM
Cinyc, in Arkansas, what are you going to do with College City located in Lawrence County. It consolidated with Walnut Ridge in May of last year. It was in the final phases of occurring when the data was estimated.
Could you possibly combine the two on one of your maps to show that this occurred?
Could you possibly combine the two on one of your maps to show that this occurred?
I could estimate things manually when I get a chance, but if Census hasn't caught up with the change yet, I'm not going to change the shapefile. I used the most recent Census shapefile for each type (County, MCD and Place).
Title: Re: Census population estimates 2011-2019
Post by: JerryArkansas on May 26, 2017, 11:07:15 AM
Cinyc, in Arkansas, what are you going to do with College City located in Lawrence County. It consolidated with Walnut Ridge in May of last year. It was in the final phases of occurring when the data was estimated.
Could you possibly combine the two on one of your maps to show that this occurred?
Could you possibly combine the two on one of your maps to show that this occurred?
I could estimate things manually when I get a chance, but if Census hasn't caught up with the change yet, I'm not going to change the shapefile. I used the most recent Census shapefile for each type (County, MCD and Place).
Title: Re: Census population estimates 2011-2019
Post by: cinyc on May 26, 2017, 04:31:51 PM
Cinyc, in Arkansas, what are you going to do with College City located in Lawrence County. It consolidated with Walnut Ridge in May of last year. It was in the final phases of occurring when the data was estimated.
Could you possibly combine the two on one of your maps to show that this occurred?
Could you possibly combine the two on one of your maps to show that this occurred?
I could estimate things manually when I get a chance, but if Census hasn't caught up with the change yet, I'm not going to change the shapefile. I used the most recent Census shapefile for each type (County, MCD and Place).
The combined entity gained 3 residents from 2015 to 2016. Its 2016 population is 5180. It has lost 3.08% of its population from 2010, or 165 residents.
If census hasn't gotten around to fixing the shapefile, I'm not going to change the map. It would take more work to do that than you think.
Edited to add: Census is aware of the consolidation (it made their list of entity changes), but it didn't take effect until January 1, 2017. The estimates are 2016 estimates - so it makes sense to show the entities as they existed in 2016, not 2017. I'm sure Census will update their 2017 shapefiles to reflect the consolidation.
Title: Re: Census population estimates 2011-2019
Post by: Kevinstat on May 27, 2017, 03:19:24 AM
In the 2010 census, the State House "quotas" of Maine's largest municipalities (those over 0.9/151 of Maine's population in any one of the three following tables, plus Old Town which would meet that criteria if you added in the Penobscot Reservation where the part where people live is right next to Old Town (they basically make up a State House district now)), were as follows (with instances where the "Estimates Base" (EB) yields a different quota than the official census numbers noted in parentheses):
=7.6 (8*0.95) "cutoff"=
Portland city 7.5245 (State Senate quota* 1.7441, between 1.05 and 1.9 "cutoffs")
=7.35 (7*1.05) "cutoff"=
...
=4.2 (4*1.05) "cutoff"=
Lewiston city 4.1596 (EB 4.1595) (State Senate quota* 0.9641, between 0.95 "cutoff" and 1.0 mark)
=4.0 mark=
=3.8 (4*0.95) "cutoff"=
Bangor city 3.7557 (EB 3.7554)
=3.15 (3*1.05) "cutoff"=
=3.0 mark=
=2.85 (3*0.95) "cutoff"=
South Portland city 2.8421
Auburn city 2.6208 (EB 2.6204)
Biddeford city 2.4186
Sanford city 2.3642 (EB 2.3640)
Brunswick town 2.3051
Augusta city 2.1753 (EB 2.1748)
Scarborough town 2.1506
Saco city 2.1009 (EB 2.1030)
=2.1 (2*1.05) "cutoff"=
=2.0 mark=
Westbrook city 1.9886
Windham town 1.9326 (EB 1.9321)
=1.9 (2*0.95) "cutoff"=
Gorham town 1.8621 (EB 1.8620)
Waterville city 1.7872
York town 1.4242 (EB 1.4231)
Falmouth town 1.2714
Kennebunk town 1.2275 (EB 1.2274)
Orono town 1.1779 (EB 1.1772)
Standish town 1.1224 (EB 1.1222)
Presque Isle city 1.1017
Wells town 1.0900
Kittery town 1.0788
Brewer city 1.0779
=1.05 "cutoff"=
Cape Elizabeth town 1.0248
Lisbon town 1.0241 (EB 1.0242)
=1.0 mark=
Topsham town 0.9985
Old Orchard Beach town 0.9803 (EB 0.9793)
Skowhegan town 0.9763 (EB 0.9766)
Bath city 0.9678
[Old Town city (0.8912 (EB 0.8919)) + Penobscot Indian Island Reservation (0.0693)] 0.9605 (EB 0.9612)
=0.95 "cutoff"=
Yarmouth town 0.9491
Caribou city 0.9309
Buxton town 0.9133 (EB 0.9129)
Freeport town 0.8956
...
Gray town 0.8822
...
Ellsworth city 0.8799
...
Cumberland town 0.8197 (EB 0.8187)
The largest municipalities as and according to the 2016 estimates and their State House "quotas" are as follows:
=7.6 (8*0.95) "cutoff"=
Portland city 7.5912 (State Senate quota* 1.7595, between 1.05 and 1.9 "cutoffs")
=7.35 (7*1.05) "cutoff"=
...
=4.2 (4*1.05) "cutoff"=
Lewiston city 4.0986 (State Senate quota* 0.949996, 0.14 people below 0.95 "cutoff")
=4.0 mark=
=3.8 (4*0.95) "cutoff"=
Bangor city 3.6273
=3.15 (3*1.05) "cutoff"=
=3.0 mark=
South Portland city 2.9006
=2.85 (3*0.95) "cutoff"=
Auburn city 2.6025
Biddeford city 2.4226
Sanford city 2.3745
Brunswick town 2.3413
Scarborough town 2.2708
Saco city 2.1789
=2.1 (2*1.05) "cutoff"=
Augusta city 2.0974
Westbrook city 2.0869
Windham town 2.0417
=2.0 mark=
Gorham town 1.9711
=1.9 (2*0.95) "cutoff"=
Waterville city 1.8606
York town 1.4683
Falmouth town 1.3725
Kennebunk town 1.2838
Orono town 1.2749
Wells town 1.1549
Standish town 1.1538
Kittery town 1.0937
Cape Elizabeth town 1.0580
=1.05 "cutoff"=
Brewer city 1.0328
Presque Isle city 1.0327
Lisbon town 1.0032
=1.0 mark=
Old Orchard Beach town 0.9990
Topsham town 0.9964
Yarmouth town 0.9705
Freeport town 0.9555
=0.95 "cutoff"=
Bath city 0.9416
Skowhegan town 0.9415
Buxton town 0.9294
Gray town 0.9203
[Old Town city (0.8526) + Penobscot Indian Island Reservation (0.0673)] 0.9199
Ellsworth city 0.8972
Cumberland town 0.8895
...
Caribou city 0.8773
Taking the "Estimates base" from April 1, 2010 (usually within a few people of the official numbers) shown in the same Census Bureau tables showing the above estimates, and adding to it the population gains (negative for losses) from that base to July 1, 2016 multiplied by 10/6.25 (I use a linear progression rather than exponential as it has the benefit of municipal projections being the same as county projections), the following are the projected 2020 State House "quotas" for all municipalities (in descending order) with projected (or 2010) quotas above 0.9000:
=8.0 mark=
Portland city 7.6310 (State Senate quota* 1.7688, between 1.05 and 1.9 "cutoffs")
=7.6 (8*0.95) "cutoff"=
...
=4.2 (4*1.05) "cutoff"=
Lewiston city 4.0621 (State Senate quota* 0.9415, below 0.95 "cutoff")
=4.0 mark=
=3.8 (4*0.95) "cutoff"=
Bangor city 3.5508
=3.15 (3*1.05) "cutoff"=
=3.0 mark=
South Portland city 2.9356
=2.85 (3*0.95) "cutoff"=
Auburn city 2.5918
Biddeford city 2.4250
Sanford city 2.3809
Brunswick town 2.3630
Scarborough town 2.3426
Saco city 2.2243
Westbrook city 2.1457
Windham town 2.1072
=2.1 (2*1.05) "cutoff"=
Augusta city 2.0511
Gorham town 2.0364
=2.0 mark=
Waterville city 1.9044
=1.9 (2*0.95) "cutoff"=
York town 1.4953
Falmouth town 1.4328
Orono town 1.3333
Kennebunk town 1.3174
Wells town 1.1938
Standish town 1.1727
Kittery town 1.1026
Cape Elizabeth town 1.0778
=1.05 "cutoff"=
Old Orchard Beach town 1.0108
Brewer city 1.0059
=1.0 mark=
Topsham town 0.9951
Presque Isle city 0.9914
Freeport town 0.9912
Lisbon town 0.9907
Yarmouth town 0.9834
=0.95 "cutoff"=
Gray town 0.9431
Buxton town 0.9392
Cumberland town 0.9318
Bath city 0.9260
Skowhegan town 0.9206
Ellsworth city 0.9075
[Old Town city (0.8291) + Penobscot Indian Island Reservation (0.0660)] 0.8951
...
Caribou city 0.8453
*assuming 35 Senators. With 33 or 31, Lewiston would be too small for a Senate district even under the 2010 Census figures. Portland would still be comfortably between 1.05 and 1.9 State Senate quotas.
Wow, I wouldn't have done this if I didn't enjoy the result of having done it, but that took some work, even though I created the spreadsheet by copying and modifying an existing one and did the same thing with this post.
=7.6 (8*0.95) "cutoff"=
Portland city 7.5245 (State Senate quota* 1.7441, between 1.05 and 1.9 "cutoffs")
=7.35 (7*1.05) "cutoff"=
...
=4.2 (4*1.05) "cutoff"=
Lewiston city 4.1596 (EB 4.1595) (State Senate quota* 0.9641, between 0.95 "cutoff" and 1.0 mark)
=4.0 mark=
=3.8 (4*0.95) "cutoff"=
Bangor city 3.7557 (EB 3.7554)
=3.15 (3*1.05) "cutoff"=
=3.0 mark=
=2.85 (3*0.95) "cutoff"=
South Portland city 2.8421
Auburn city 2.6208 (EB 2.6204)
Biddeford city 2.4186
Sanford city 2.3642 (EB 2.3640)
Brunswick town 2.3051
Augusta city 2.1753 (EB 2.1748)
Scarborough town 2.1506
Saco city 2.1009 (EB 2.1030)
=2.1 (2*1.05) "cutoff"=
=2.0 mark=
Westbrook city 1.9886
Windham town 1.9326 (EB 1.9321)
=1.9 (2*0.95) "cutoff"=
Gorham town 1.8621 (EB 1.8620)
Waterville city 1.7872
York town 1.4242 (EB 1.4231)
Falmouth town 1.2714
Kennebunk town 1.2275 (EB 1.2274)
Orono town 1.1779 (EB 1.1772)
Standish town 1.1224 (EB 1.1222)
Presque Isle city 1.1017
Wells town 1.0900
Kittery town 1.0788
Brewer city 1.0779
=1.05 "cutoff"=
Cape Elizabeth town 1.0248
Lisbon town 1.0241 (EB 1.0242)
=1.0 mark=
Topsham town 0.9985
Old Orchard Beach town 0.9803 (EB 0.9793)
Skowhegan town 0.9763 (EB 0.9766)
Bath city 0.9678
[Old Town city (0.8912 (EB 0.8919)) + Penobscot Indian Island Reservation (0.0693)] 0.9605 (EB 0.9612)
=0.95 "cutoff"=
Yarmouth town 0.9491
Caribou city 0.9309
Buxton town 0.9133 (EB 0.9129)
Freeport town 0.8956
...
Gray town 0.8822
...
Ellsworth city 0.8799
...
Cumberland town 0.8197 (EB 0.8187)
The largest municipalities as and according to the 2016 estimates and their State House "quotas" are as follows:
=7.6 (8*0.95) "cutoff"=
Portland city 7.5912 (State Senate quota* 1.7595, between 1.05 and 1.9 "cutoffs")
=7.35 (7*1.05) "cutoff"=
...
=4.2 (4*1.05) "cutoff"=
Lewiston city 4.0986 (State Senate quota* 0.949996, 0.14 people below 0.95 "cutoff")
=4.0 mark=
=3.8 (4*0.95) "cutoff"=
Bangor city 3.6273
=3.15 (3*1.05) "cutoff"=
=3.0 mark=
South Portland city 2.9006
=2.85 (3*0.95) "cutoff"=
Auburn city 2.6025
Biddeford city 2.4226
Sanford city 2.3745
Brunswick town 2.3413
Scarborough town 2.2708
Saco city 2.1789
=2.1 (2*1.05) "cutoff"=
Augusta city 2.0974
Westbrook city 2.0869
Windham town 2.0417
=2.0 mark=
Gorham town 1.9711
=1.9 (2*0.95) "cutoff"=
Waterville city 1.8606
York town 1.4683
Falmouth town 1.3725
Kennebunk town 1.2838
Orono town 1.2749
Wells town 1.1549
Standish town 1.1538
Kittery town 1.0937
Cape Elizabeth town 1.0580
=1.05 "cutoff"=
Brewer city 1.0328
Presque Isle city 1.0327
Lisbon town 1.0032
=1.0 mark=
Old Orchard Beach town 0.9990
Topsham town 0.9964
Yarmouth town 0.9705
Freeport town 0.9555
=0.95 "cutoff"=
Bath city 0.9416
Skowhegan town 0.9415
Buxton town 0.9294
Gray town 0.9203
[Old Town city (0.8526) + Penobscot Indian Island Reservation (0.0673)] 0.9199
Ellsworth city 0.8972
Cumberland town 0.8895
...
Caribou city 0.8773
Taking the "Estimates base" from April 1, 2010 (usually within a few people of the official numbers) shown in the same Census Bureau tables showing the above estimates, and adding to it the population gains (negative for losses) from that base to July 1, 2016 multiplied by 10/6.25 (I use a linear progression rather than exponential as it has the benefit of municipal projections being the same as county projections), the following are the projected 2020 State House "quotas" for all municipalities (in descending order) with projected (or 2010) quotas above 0.9000:
=8.0 mark=
Portland city 7.6310 (State Senate quota* 1.7688, between 1.05 and 1.9 "cutoffs")
=7.6 (8*0.95) "cutoff"=
...
=4.2 (4*1.05) "cutoff"=
Lewiston city 4.0621 (State Senate quota* 0.9415, below 0.95 "cutoff")
=4.0 mark=
=3.8 (4*0.95) "cutoff"=
Bangor city 3.5508
=3.15 (3*1.05) "cutoff"=
=3.0 mark=
South Portland city 2.9356
=2.85 (3*0.95) "cutoff"=
Auburn city 2.5918
Biddeford city 2.4250
Sanford city 2.3809
Brunswick town 2.3630
Scarborough town 2.3426
Saco city 2.2243
Westbrook city 2.1457
Windham town 2.1072
=2.1 (2*1.05) "cutoff"=
Augusta city 2.0511
Gorham town 2.0364
=2.0 mark=
Waterville city 1.9044
=1.9 (2*0.95) "cutoff"=
York town 1.4953
Falmouth town 1.4328
Orono town 1.3333
Kennebunk town 1.3174
Wells town 1.1938
Standish town 1.1727
Kittery town 1.1026
Cape Elizabeth town 1.0778
=1.05 "cutoff"=
Old Orchard Beach town 1.0108
Brewer city 1.0059
=1.0 mark=
Topsham town 0.9951
Presque Isle city 0.9914
Freeport town 0.9912
Lisbon town 0.9907
Yarmouth town 0.9834
=0.95 "cutoff"=
Gray town 0.9431
Buxton town 0.9392
Cumberland town 0.9318
Bath city 0.9260
Skowhegan town 0.9206
Ellsworth city 0.9075
[Old Town city (0.8291) + Penobscot Indian Island Reservation (0.0660)] 0.8951
...
Caribou city 0.8453
*assuming 35 Senators. With 33 or 31, Lewiston would be too small for a Senate district even under the 2010 Census figures. Portland would still be comfortably between 1.05 and 1.9 State Senate quotas.
Wow, I wouldn't have done this if I didn't enjoy the result of having done it, but that took some work, even though I created the spreadsheet by copying and modifying an existing one and did the same thing with this post.
Title: Re: Census population estimates 2011-2019
Post by: cinyc on May 28, 2017, 01:25:55 AM
I made single-year maps for 2010-11, 2011-12, 2012-13, etc. They're available in my Carto account (https://cinyc.carto.com/me). These are backward looking, so if there was a merger or consolidation, you're only going to get stats for the 2016 entity, and won't get stats for dissolved entities.
Unfortunately, I compared 2011 to the 2010 estimate instead of the estimates base or census, and didn't compare the 2010 estimate to the 2010 EB or census in my spreadsheet. It's way too much of a pain to fix that (I'd have to update all the maps), so it will have to stay that way. At least all of the comparisons are for a one-year period, though.
Unfortunately, I compared 2011 to the 2010 estimate instead of the estimates base or census, and didn't compare the 2010 estimate to the 2010 EB or census in my spreadsheet. It's way too much of a pain to fix that (I'd have to update all the maps), so it will have to stay that way. At least all of the comparisons are for a one-year period, though.
Title: Re: Census population estimates 2011-2019
Post by: True Federalist (진정한 연방 주의자) on August 31, 2017, 09:50:22 PM
Here's my annual projection from the new estimates. I used the July 2016 estimates and the April 2010 Census base to get an annual growth rate. This correctly accounts for the 6 and a quarter year period between the Census and the estimate. I then applied the annual growth rate to the 2010 reapportionment population to get the 2020 projection. This accounts for the extra overseas population used in reapportionment but not for redistricting. Ten years is a long stretch for a simple model like this, but here are the projected changes.
AL -1
AZ +1
CO +1
FL +2
IL -1
MI -1
MN -1
NY -1
NC +1
OH -1
OR +1
PA -1
RI -1
TX +3
WV -1
There is only one change since my projections last year (https://uselectionatlas.org/FORUM/index.php?topic=166668.msg4837582#msg4837582). CA stays unchanged at 53 instead of adding a seat and FL gains 2 instead of 1 up to 29. The bubble seats in this projection are based on the last five awarded and the next five in line.
The last five awarded are IL-17, TX-39, CA-53, AZ-10, and FL-29 (#435).
The next five in line are MT-2, AL-7, CA-54, VA-12, and MN-8.
An alternate projection could use just the last two years of estimates to determine the rate of growth for the rest of the decade. That model gives the same projection as the one above, with changes only in the order of the bubble seats.
AL -1
AZ +1
CO +1
FL +2
IL -1
MI -1
MN -1
NY -1
NC +1
OH -1
OR +1
PA -1
RI -1
TX +3
WV -1
There is only one change since my projections last year (https://uselectionatlas.org/FORUM/index.php?topic=166668.msg4837582#msg4837582). CA stays unchanged at 53 instead of adding a seat and FL gains 2 instead of 1 up to 29. The bubble seats in this projection are based on the last five awarded and the next five in line.
The last five awarded are IL-17, TX-39, CA-53, AZ-10, and FL-29 (#435).
The next five in line are MT-2, AL-7, CA-54, VA-12, and MN-8.
An alternate projection could use just the last two years of estimates to determine the rate of growth for the rest of the decade. That model gives the same projection as the one above, with changes only in the order of the bubble seats.
I think it's fairly safe to say Harvey ended any chance of Texas gaining three seats in the next census. Even if the disruption proves only half as bad as Katrina, there will be a lot of people who otherwise might live in Texas who won't be able to thirty-one months from now.
Title: Re: Census population estimates 2011-2019
Post by: KingSweden on August 31, 2017, 09:59:06 PM
Here's my annual projection from the new estimates. I used the July 2016 estimates and the April 2010 Census base to get an annual growth rate. This correctly accounts for the 6 and a quarter year period between the Census and the estimate. I then applied the annual growth rate to the 2010 reapportionment population to get the 2020 projection. This accounts for the extra overseas population used in reapportionment but not for redistricting. Ten years is a long stretch for a simple model like this, but here are the projected changes.
AL -1
AZ +1
CO +1
FL +2
IL -1
MI -1
MN -1
NY -1
NC +1
OH -1
OR +1
PA -1
RI -1
TX +3
WV -1
There is only one change since my projections last year (https://uselectionatlas.org/FORUM/index.php?topic=166668.msg4837582#msg4837582). CA stays unchanged at 53 instead of adding a seat and FL gains 2 instead of 1 up to 29. The bubble seats in this projection are based on the last five awarded and the next five in line.
The last five awarded are IL-17, TX-39, CA-53, AZ-10, and FL-29 (#435).
The next five in line are MT-2, AL-7, CA-54, VA-12, and MN-8.
An alternate projection could use just the last two years of estimates to determine the rate of growth for the rest of the decade. That model gives the same projection as the one above, with changes only in the order of the bubble seats.
AL -1
AZ +1
CO +1
FL +2
IL -1
MI -1
MN -1
NY -1
NC +1
OH -1
OR +1
PA -1
RI -1
TX +3
WV -1
There is only one change since my projections last year (https://uselectionatlas.org/FORUM/index.php?topic=166668.msg4837582#msg4837582). CA stays unchanged at 53 instead of adding a seat and FL gains 2 instead of 1 up to 29. The bubble seats in this projection are based on the last five awarded and the next five in line.
The last five awarded are IL-17, TX-39, CA-53, AZ-10, and FL-29 (#435).
The next five in line are MT-2, AL-7, CA-54, VA-12, and MN-8.
An alternate projection could use just the last two years of estimates to determine the rate of growth for the rest of the decade. That model gives the same projection as the one above, with changes only in the order of the bubble seats.
I think it's fairly safe to say Harvey ended any chance of Texas gaining three seats in the next census. Even if the disruption proves only half as bad as Katrina, there will be a lot of people who otherwise might live in Texas who won't be able to thirty-one months from now.
So they'll just gain 2, then?
Title: Re: Census population estimates 2011-2019
Post by: True Federalist (진정한 연방 주의자) on August 31, 2017, 11:26:52 PM
The only way I could see Texas not gaining two would be if Republican xenophobia has the side effect of causing a severe undercount of Hispanics in Texas.
Title: Re: Census population estimates 2011-2019
Post by: muon2 on September 01, 2017, 07:09:46 AM
Here's my annual projection from the new estimates. I used the July 2016 estimates and the April 2010 Census base to get an annual growth rate. This correctly accounts for the 6 and a quarter year period between the Census and the estimate. I then applied the annual growth rate to the 2010 reapportionment population to get the 2020 projection. This accounts for the extra overseas population used in reapportionment but not for redistricting. Ten years is a long stretch for a simple model like this, but here are the projected changes.
AL -1
AZ +1
CO +1
FL +2
IL -1
MI -1
MN -1
NY -1
NC +1
OH -1
OR +1
PA -1
RI -1
TX +3
WV -1
There is only one change since my projections last year (https://uselectionatlas.org/FORUM/index.php?topic=166668.msg4837582#msg4837582). CA stays unchanged at 53 instead of adding a seat and FL gains 2 instead of 1 up to 29. The bubble seats in this projection are based on the last five awarded and the next five in line.
The last five awarded are IL-17, TX-39, CA-53, AZ-10, and FL-29 (#435).
The next five in line are MT-2, AL-7, CA-54, VA-12, and MN-8.
An alternate projection could use just the last two years of estimates to determine the rate of growth for the rest of the decade. That model gives the same projection as the one above, with changes only in the order of the bubble seats.
AL -1
AZ +1
CO +1
FL +2
IL -1
MI -1
MN -1
NY -1
NC +1
OH -1
OR +1
PA -1
RI -1
TX +3
WV -1
There is only one change since my projections last year (https://uselectionatlas.org/FORUM/index.php?topic=166668.msg4837582#msg4837582). CA stays unchanged at 53 instead of adding a seat and FL gains 2 instead of 1 up to 29. The bubble seats in this projection are based on the last five awarded and the next five in line.
The last five awarded are IL-17, TX-39, CA-53, AZ-10, and FL-29 (#435).
The next five in line are MT-2, AL-7, CA-54, VA-12, and MN-8.
An alternate projection could use just the last two years of estimates to determine the rate of growth for the rest of the decade. That model gives the same projection as the one above, with changes only in the order of the bubble seats.
I think it's fairly safe to say Harvey ended any chance of Texas gaining three seats in the next census. Even if the disruption proves only half as bad as Katrina, there will be a lot of people who otherwise might live in Texas who won't be able to thirty-one months from now.
Unfortunately we wont have a good estimate of that next year. The date used for next year's estimate release is July 1, 2017 and the impact of Harvey is after that. Until then it will useful to see where displaced Houstonians go. A lot of Katrina victims moved to se TX, but if Harvey victims shift within TX, eg to DFW, it will have minimal impact on the statewide estimates.
Title: Re: Census population estimates 2011-2019
Post by: Brittain33 on September 01, 2017, 09:55:44 AM
I miss jimrtex's table of projected apportionment across multiple decades with three decimal places.
Title: Re: Census population estimates 2011-2019
Post by: jimrtex on September 01, 2017, 12:07:20 PM
I miss jimrtex's table of projected apportionment across multiple decades with three decimal places.
2010 is apportionment based on geometric mean but calculated to three decimal places.
2020 is projected apportionment assuming annual percentage growth rate for 2010-2016 (6.25 years) continues for next 3.75 years.
Change is difference between 2010 and 2020.
For example, Alabama was entitled to 6.737 representatives in 2010, and is projected to be entitled to 6.440 in 2020, a decrease of 0.297 representatives.
2020 is the projected whole number apportionment in 2020 and the change from 2010. It does take into account the list method used by Congress, and is not based on simple independent rounding (though for smaller states simple rounding is reasonably accurate). Alabama is not projected to lose a seat based on 6.440 rounding to 6, but rather the quotient for a 7th seat is projected to rank 438th, and miss the 435 cutoff.
Need is the number (in thousands) necessary to add (avoid loss) or lose (avoid gain) for an additional seat. If Alabama were to gain an additional 39,000 it could keep a 7th seat. This assumes that no other state changes.
Proj is the projected change in population (in thousands) from 2010 to 2020. Alabama is project to increase by 134,000.
10-16 is the estimated annual percentage change for April 2010 (census) to July 2016 (estimate).
16-20 is the estimated annual percentage change from July 2016 (estimate) to April 2020 (census) needed to change the projected apportionment. Alabama is estimated to be growing at a 0.28% growth rate, but could save it 7th seat if it kicked this up to 0.48% for the remainder of the decade.
State 2010 2020 Change 2020 Need Proj 10-16 16-20
Alabama 6.737 6.440 -0.297 6 -1 39 134 0.28% 0.49%
Alaska 1.117 1.114 -0.003 1 = 319 51 0.70% 10.56%
Arizona 8.999 9.520 0.521 10 +1 -60 884 1.30% 1.08%
Arkansas 4.129 3.993 -0.136 4 = -397 117 0.39% -3.30%
California 52.369 52.915 0.546 53 = -566 3245 0.84% 0.46%
Colorado 7.087 7.688 0.601 8 +1 -180 843 1.56% 0.72%
Connecticut 5.049 4.701 -0.348 5 = -176 4 0.01% -1.33%
Delaware 1.358 1.382 0.024 1 = 95 88 0.94% 3.44%
Florida 26.435 28.462 2.026 29 +2 -105 2978 1.48% 1.35%
Georgia 13.627 13.993 0.366 14 = -441 1015 1.00% -0.13%
Hawaii 1.976 1.986 0.010 2 = -395 111 0.79% -7.29%
Idaho 2.260 2.349 0.089 2 = 116 189 1.14% 2.88%
Illinois 18.043 16.710 -1.332 17 -1 -239 -47 -0.04% -0.54%
Indiana 9.128 8.800 -0.328 9 = -270 240 0.36% -0.73%
Iowa 4.312 4.196 -0.116 4 = 230 142 0.46% 2.34%
Kansas 4.042 3.874 -0.168 4 = -305 87 0.30% -2.59%
Kentucky 6.120 5.896 -0.224 6 = -330 157 0.36% -1.66%
Louisiana 6.392 6.256 -0.136 6 = 181 240 0.52% 1.52%
Maine 1.933 1.812 -0.121 2 = -258 5 0.04% -5.53%
Maryland 8.131 8.073 -0.058 8 = 319 394 0.66% 2.02%
Massachusetts 9.217 9.127 -0.090 9 = 276 428 0.63% 1.68%
Michigan 13.902 13.016 -0.886 13 -1 357 72 0.07% 1.02%
Minnesota 7.472 7.404 -0.069 7 -1 66 350 0.64% 0.95%
Mississippi 4.201 3.953 -0.247 4 = -367 34 0.12% -3.30%
Missouri 8.433 8.059 -0.374 8 = 329 167 0.28% 1.68%
Montana 1.478 1.492 0.014 1 = 5 86 0.84% 0.97%
Nebraska 2.615 2.606 -0.010 3 = -94 131 0.69% -0.62%
Nevada 3.829 4.073 0.244 4 = 324 393 1.37% 4.10%
New Hampshire 1.917 1.828 -0.089 2 = -270 29 0.22% -5.59%
New Jersey 12.369 11.818 -0.551 12 = -298 245 0.28% -0.62%
New Mexico 2.937 2.781 -0.156 3 = -231 35 0.17% -2.90%
New York 27.244 26.095 -1.149 26 -1 283 591 0.30% 0.68%
North Carolina 13.413 13.770 0.357 14 +1 -270 997 1.00% 0.30%
North Dakota 1.070 1.176 0.106 1 = 267 142 1.93% 9.93%
Ohio 16.224 15.244 -0.980 15 -1 180 125 0.11% 0.52%
Oklahoma 5.297 5.290 -0.007 5 = 156 279 0.72% 1.75%
Oregon 5.408 5.587 0.179 6 +1 -93 428 1.07% 0.47%
Pennsylvania 17.862 16.775 -1.088 17 -1 -288 131 0.10% -0.50%
Rhode Island 1.562 1.471 -0.091 1 -1 22 6 0.06% 0.61%
South Carolina 6.521 6.779 0.258 7 = -244 549 1.13% -0.17%
South Dakota 1.249 1.275 0.026 1 = 183 84 0.98% 6.11%
Tennessee 8.935 8.952 0.018 9 = -387 495 0.75% -0.80%
Texas 35.350 38.718 3.368 39 +3 -349 4486 1.66% 1.33%
Utah 3.917 4.260 0.343 4 = 181 474 1.60% 3.08%
Vermont 1.012 0.956 -0.055 1 = 457 -2 -0.03% 15.75%
Virginia 11.258 11.336 0.078 11 = 113 667 0.80% 1.15%
Washington 9.466 10.005 0.540 10 = 368 924 1.30% 2.57%
West Virginia 2.652 2.427 -0.225 2 -1 54 -35 -0.19% 0.59%
Wisconsin 8.010 7.639 -0.370 8 = -142 147 0.26% -0.40%
Wyoming 0.937 0.929 -0.008 1 = 482 35 0.61% 17.76%
Title: Re: Census population estimates 2011-2019
Post by: jimrtex on September 01, 2017, 12:41:13 PM
For 2020
Alabama's loss is fairly certain, unless some other states falter.
Arizona is kind of iffy, except the 2010-2016 estimated growth is below more recent increases due to recovery from the housing bubble.
California is pretty solid. In the past they have received a favorable rounding, but now 53 is becoming pretty solid. California with about 1/8 of the nation's population has a hard time growing faster since it is such a large component.
Colorado is solid as it continues to recover from the housing bubble.
Florida is quite iffy, but it is also recovering from the housing bubble.
Montana could gain a 2nd seat, but it doesn't seem to be able to main consistent growth. The slowdown in the Williston Basin may hurt (some spillover of drilling into Montana, and Billings is closest city, excluding Regina (Canadian) and Bismarck (not a city)).
Texas could miss out on a 3rd seat, but the estimates already have factored in the slowdown in Houston growth due to low oil prices. Greater Houston has about 1/4 of the state population, so that 350K dropoff is unlikely, and if people move, they will move to DFW, San Antonio, and Austin. At least for the next couple of years there will be lots of construction work.
Virginia is not that far off, but draining the swamp may have an impact.
Title: Re: Census population estimates 2011-2019
Post by: jimrtex on September 01, 2017, 11:13:44 PM
We can project the decennial change forward (for states that are losing population share, the value will decline, since it really relative to its current population share, and vice versa for gainers).
Alabama: If no loss in 2020, it will lose in 2030. The drop to 5 will occur in 2060, but possibly 2050.
Alaska: No change - Alaska is growing slower than the US as a whole.
Arizona: Will gain a district every 20 years, but this could be quite irregular. For example if it doesn't gain a district in 2020, it could gain in 2030 and 2040.
Arkansas: Drops to 3 in 2060.
California: Could gain 54th in 2030 or 2040.
Colorado: Gains 8th in 2020 and 9th in 2040.
Connecticut: Loses 5th in 2030.
Delaware: Will get its 2nd seat back in 2070 (Wyoming and Alaska are only states that have never had at least two representatives).
Florida: Will gain two representatives per decade, though like Arizona, this may be irregular (1 some decades or 3 others).
Georgia: Gains 15th in 2040 (Georgia is increasing its lead on North Carolina)
Hawaii: No change (at current rate would gain 3rd seat in 2440).
Idaho: 3rd in 2040 (or perhaps 2050).
Illinois: Could lose 2 in 2030. By 2040 will be behind Georgia, and there will be increasing references to Atlantaland as distinguished from Downstate Georgia.
Indiana: Could lose in 2030, but more likely 2040.
Iowa: Loses in 2080. Des Moines in western district?
Kansas: Could lose in 2040, but 2050 is more likely.
Kentucky: Loses 6th in 2040, though 2050 is possible.
Louisiana: Loses 6th in 2080.
Maine: Loses 2nd in 2050, will they change their electoral vote allocation to 3 electoral districts?
Massachusetts: No losses until 2090.
Michigan: One per decade, but may be unchanged in 2040 or 2050. Michigan drops to 10th this decade, passed by Georgia and North Carolina, but won't drop out of top 10 until passed by Washington or Arizona in 2040 or 2050.
Minnesota: Will not lose another for the next century.
Mississippi: Possibly loses 4th in 2040, certainly by 2050.
Missouri: Loses 8th in 2040.
Montana: Regains 2nd in 2030? Montana is like a swimmer swimming against the current. Their position never changes.
Nebraska: May cling to 3rd indefinitely.
Nevada: Could gain 5th in 2040, particularly if housing bubble abates.
New Hampshire: Loses 2nd in 2060.
New Jersey: Loses 12th in 2030, and 11th in 2050.
New Mexico: Could lose 3rd in 2040.
New York: Should continue to lose one district per decade.
North Carolina: Very solid for 14th district in 2020. Could gain 15th in 2040. If not then, 2050.
North Dakota: Could regain 2nd by 2050, but that assumes continued growth in the Williston Basin.
Ohio: Will continue to lose a district per decade.
Oklahoma: Growing only slightly slower than country as a whole. Could have 5 districts forever.
Oregon: Could gain 7th district in 2080.
Pennsylvania: Will continue to lose a district per decade. Could see a loss of two due to rounding in the next few decades.
Rhode Island: Leads the path for Maine and New Hampshire to a single district.
South Carolina: Could gain 8th in 2050, maybe sooner if Charlotte spillover increases.
South Dakota: Regains 2nd in 2110.
Tennessee: Stuck on 9 forever.
Texas: Will add 3 or 4 each decade. Could surpass California by 2070.
Utah: Will likely gain 5th in 2030.
Vermont: Will likely fall below Wyoming by 2030.
Virginia: Possibility of 12 in 2040, but 2050 more likely.
West Virginia: Will keep 2 until at least 2070.
Wisconsin: Will lose 8th in 2030, as it will probably fall behind Minnesota.
Wyoming: One forever.
Title: Re: Census population estimates 2011-2019
Post by: jimrtex on September 01, 2017, 11:17:41 PM
One year ACS estimates for 2016 will be released on September 14. These are statistically valid for entities with greater than 65,000 population, which includes congressional districts. This could provide a clue about redistricting in 2020 for states that don't change the number of representatives.
Title: Re: Census population estimates 2011-2019
Post by: True Federalist (진정한 연방 주의자) on September 25, 2017, 10:39:27 PM
I wonder if the post-Maria exodus from Puerto Rico might keep New York from losing a seat. If you take a look at the Puerto Rican demographics, a lot of the people who left were men who couldn't find work there. Now we're likely to see a lot of women and kids who can't live there as well as those displaced by lack of work. A 10% exodus is probably a bare minimum under current conditions, and many will head to New York. Probably not enuf by itself to keep the Empire State from losing another seat, but it should make it close.
Title: Re: Census population estimates 2011-2019
Post by: KingSweden on September 30, 2017, 07:08:06 PM
We can project the decennial change forward (for states that are losing population share, the value will decline, since it really relative to its current population share, and vice versa for gainers).
Alabama: If no loss in 2020, it will lose in 2030. The drop to 5 will occur in 2060, but possibly 2050.
Alaska: No change - Alaska is growing slower than the US as a whole.
Arizona: Will gain a district every 20 years, but this could be quite irregular. For example if it doesn't gain a district in 2020, it could gain in 2030 and 2040.
Arkansas: Drops to 3 in 2060.
California: Could gain 54th in 2030 or 2040.
Colorado: Gains 8th in 2020 and 9th in 2040.
Connecticut: Loses 5th in 2030.
Delaware: Will get its 2nd seat back in 2070 (Wyoming and Alaska are only states that have never had at least two representatives).
Florida: Will gain two representatives per decade, though like Arizona, this may be irregular (1 some decades or 3 others).
Georgia: Gains 15th in 2040 (Georgia is increasing its lead on North Carolina)
Hawaii: No change (at current rate would gain 3rd seat in 2440).
Idaho: 3rd in 2040 (or perhaps 2050).
Illinois: Could lose 2 in 2030. By 2040 will be behind Georgia, and there will be increasing references to Atlantaland as distinguished from Downstate Georgia.
Indiana: Could lose in 2030, but more likely 2040.
Iowa: Loses in 2080. Des Moines in western district?
Kansas: Could lose in 2040, but 2050 is more likely.
Kentucky: Loses 6th in 2040, though 2050 is possible.
Louisiana: Loses 6th in 2080.
Maine: Loses 2nd in 2050, will they change their electoral vote allocation to 3 electoral districts?
Massachusetts: No losses until 2090.
Michigan: One per decade, but may be unchanged in 2040 or 2050. Michigan drops to 10th this decade, passed by Georgia and North Carolina, but won't drop out of top 10 until passed by Washington or Arizona in 2040 or 2050.
Minnesota: Will not lose another for the next century.
Mississippi: Possibly loses 4th in 2040, certainly by 2050.
Missouri: Loses 8th in 2040.
Montana: Regains 2nd in 2030? Montana is like a swimmer swimming against the current. Their position never changes.
Nebraska: May cling to 3rd indefinitely.
Nevada: Could gain 5th in 2040, particularly if housing bubble abates.
New Hampshire: Loses 2nd in 2060.
New Jersey: Loses 12th in 2030, and 11th in 2050.
New Mexico: Could lose 3rd in 2040.
New York: Should continue to lose one district per decade.
North Carolina: Very solid for 14th district in 2020. Could gain 15th in 2040. If not then, 2050.
North Dakota: Could regain 2nd by 2050, but that assumes continued growth in the Williston Basin.
Ohio: Will continue to lose a district per decade.
Oklahoma: Growing only slightly slower than country as a whole. Could have 5 districts forever.
Oregon: Could gain 7th district in 2080.
Pennsylvania: Will continue to lose a district per decade. Could see a loss of two due to rounding in the next few decades.
Rhode Island: Leads the path for Maine and New Hampshire to a single district.
South Carolina: Could gain 8th in 2050, maybe sooner if Charlotte spillover increases.
South Dakota: Regains 2nd in 2110.
Tennessee: Stuck on 9 forever.
Texas: Will add 3 or 4 each decade. Could surpass California by 2070.
Utah: Will likely gain 5th in 2030.
Vermont: Will likely fall below Wyoming by 2030.
Virginia: Possibility of 12 in 2040, but 2050 more likely.
West Virginia: Will keep 2 until at least 2070.
Wisconsin: Will lose 8th in 2030, as it will probably fall behind Minnesota.
Wyoming: One forever.
Alabama: If no loss in 2020, it will lose in 2030. The drop to 5 will occur in 2060, but possibly 2050.
Alaska: No change - Alaska is growing slower than the US as a whole.
Arizona: Will gain a district every 20 years, but this could be quite irregular. For example if it doesn't gain a district in 2020, it could gain in 2030 and 2040.
Arkansas: Drops to 3 in 2060.
California: Could gain 54th in 2030 or 2040.
Colorado: Gains 8th in 2020 and 9th in 2040.
Connecticut: Loses 5th in 2030.
Delaware: Will get its 2nd seat back in 2070 (Wyoming and Alaska are only states that have never had at least two representatives).
Florida: Will gain two representatives per decade, though like Arizona, this may be irregular (1 some decades or 3 others).
Georgia: Gains 15th in 2040 (Georgia is increasing its lead on North Carolina)
Hawaii: No change (at current rate would gain 3rd seat in 2440).
Idaho: 3rd in 2040 (or perhaps 2050).
Illinois: Could lose 2 in 2030. By 2040 will be behind Georgia, and there will be increasing references to Atlantaland as distinguished from Downstate Georgia.
Indiana: Could lose in 2030, but more likely 2040.
Iowa: Loses in 2080. Des Moines in western district?
Kansas: Could lose in 2040, but 2050 is more likely.
Kentucky: Loses 6th in 2040, though 2050 is possible.
Louisiana: Loses 6th in 2080.
Maine: Loses 2nd in 2050, will they change their electoral vote allocation to 3 electoral districts?
Massachusetts: No losses until 2090.
Michigan: One per decade, but may be unchanged in 2040 or 2050. Michigan drops to 10th this decade, passed by Georgia and North Carolina, but won't drop out of top 10 until passed by Washington or Arizona in 2040 or 2050.
Minnesota: Will not lose another for the next century.
Mississippi: Possibly loses 4th in 2040, certainly by 2050.
Missouri: Loses 8th in 2040.
Montana: Regains 2nd in 2030? Montana is like a swimmer swimming against the current. Their position never changes.
Nebraska: May cling to 3rd indefinitely.
Nevada: Could gain 5th in 2040, particularly if housing bubble abates.
New Hampshire: Loses 2nd in 2060.
New Jersey: Loses 12th in 2030, and 11th in 2050.
New Mexico: Could lose 3rd in 2040.
New York: Should continue to lose one district per decade.
North Carolina: Very solid for 14th district in 2020. Could gain 15th in 2040. If not then, 2050.
North Dakota: Could regain 2nd by 2050, but that assumes continued growth in the Williston Basin.
Ohio: Will continue to lose a district per decade.
Oklahoma: Growing only slightly slower than country as a whole. Could have 5 districts forever.
Oregon: Could gain 7th district in 2080.
Pennsylvania: Will continue to lose a district per decade. Could see a loss of two due to rounding in the next few decades.
Rhode Island: Leads the path for Maine and New Hampshire to a single district.
South Carolina: Could gain 8th in 2050, maybe sooner if Charlotte spillover increases.
South Dakota: Regains 2nd in 2110.
Tennessee: Stuck on 9 forever.
Texas: Will add 3 or 4 each decade. Could surpass California by 2070.
Utah: Will likely gain 5th in 2030.
Vermont: Will likely fall below Wyoming by 2030.
Virginia: Possibility of 12 in 2040, but 2050 more likely.
West Virginia: Will keep 2 until at least 2070.
Wisconsin: Will lose 8th in 2030, as it will probably fall behind Minnesota.
Wyoming: One forever.
Great list, though it appears you missed Washington.
Title: Re: Census population estimates 2011-2019
Post by: jimrtex on October 02, 2017, 01:26:04 AM
We can project the decennial change forward (for states that are losing population share, the value will decline, since it really relative to its current population share, and vice versa for gainers).
Alabama: If no loss in 2020, it will lose in 2030. The drop to 5 will occur in 2060, but possibly 2050.
Alaska: No change - Alaska is growing slower than the US as a whole.
Arizona: Will gain a district every 20 years, but this could be quite irregular. For example if it doesn't gain a district in 2020, it could gain in 2030 and 2040.
Arkansas: Drops to 3 in 2060.
California: Could gain 54th in 2030 or 2040.
Colorado: Gains 8th in 2020 and 9th in 2040.
Connecticut: Loses 5th in 2030.
Delaware: Will get its 2nd seat back in 2070 (Wyoming and Alaska are only states that have never had at least two representatives).
Florida: Will gain two representatives per decade, though like Arizona, this may be irregular (1 some decades or 3 others).
Georgia: Gains 15th in 2040 (Georgia is increasing its lead on North Carolina)
Hawaii: No change (at current rate would gain 3rd seat in 2440).
Idaho: 3rd in 2040 (or perhaps 2050).
Illinois: Could lose 2 in 2030. By 2040 will be behind Georgia, and there will be increasing references to Atlantaland as distinguished from Downstate Georgia.
Indiana: Could lose in 2030, but more likely 2040.
Iowa: Loses in 2080. Des Moines in western district?
Kansas: Could lose in 2040, but 2050 is more likely.
Kentucky: Loses 6th in 2040, though 2050 is possible.
Louisiana: Loses 6th in 2080.
Maine: Loses 2nd in 2050, will they change their electoral vote allocation to 3 electoral districts?
Massachusetts: No losses until 2090.
Michigan: One per decade, but may be unchanged in 2040 or 2050. Michigan drops to 10th this decade, passed by Georgia and North Carolina, but won't drop out of top 10 until passed by Washington or Arizona in 2040 or 2050.
Minnesota: Will not lose another for the next century.
Mississippi: Possibly loses 4th in 2040, certainly by 2050.
Missouri: Loses 8th in 2040.
Montana: Regains 2nd in 2030? Montana is like a swimmer swimming against the current. Their position never changes.
Nebraska: May cling to 3rd indefinitely.
Nevada: Could gain 5th in 2040, particularly if housing bubble abates.
New Hampshire: Loses 2nd in 2060.
New Jersey: Loses 12th in 2030, and 11th in 2050.
New Mexico: Could lose 3rd in 2040.
New York: Should continue to lose one district per decade.
North Carolina: Very solid for 14th district in 2020. Could gain 15th in 2040. If not then, 2050.
North Dakota: Could regain 2nd by 2050, but that assumes continued growth in the Williston Basin.
Ohio: Will continue to lose a district per decade.
Oklahoma: Growing only slightly slower than country as a whole. Could have 5 districts forever.
Oregon: Could gain 7th district in 2080.
Pennsylvania: Will continue to lose a district per decade. Could see a loss of two due to rounding in the next few decades.
Rhode Island: Leads the path for Maine and New Hampshire to a single district.
South Carolina: Could gain 8th in 2050, maybe sooner if Charlotte spillover increases.
South Dakota: Regains 2nd in 2110.
Tennessee: Stuck on 9 forever.
Texas: Will add 3 or 4 each decade. Could surpass California by 2070.
Utah: Will likely gain 5th in 2030.
Vermont: Will likely fall below Wyoming by 2030.
Virginia: Possibility of 12 in 2040, but 2050 more likely.
West Virginia: Will keep 2 until at least 2070.
Wisconsin: Will lose 8th in 2030, as it will probably fall behind Minnesota.
Wyoming: One forever.
Alabama: If no loss in 2020, it will lose in 2030. The drop to 5 will occur in 2060, but possibly 2050.
Alaska: No change - Alaska is growing slower than the US as a whole.
Arizona: Will gain a district every 20 years, but this could be quite irregular. For example if it doesn't gain a district in 2020, it could gain in 2030 and 2040.
Arkansas: Drops to 3 in 2060.
California: Could gain 54th in 2030 or 2040.
Colorado: Gains 8th in 2020 and 9th in 2040.
Connecticut: Loses 5th in 2030.
Delaware: Will get its 2nd seat back in 2070 (Wyoming and Alaska are only states that have never had at least two representatives).
Florida: Will gain two representatives per decade, though like Arizona, this may be irregular (1 some decades or 3 others).
Georgia: Gains 15th in 2040 (Georgia is increasing its lead on North Carolina)
Hawaii: No change (at current rate would gain 3rd seat in 2440).
Idaho: 3rd in 2040 (or perhaps 2050).
Illinois: Could lose 2 in 2030. By 2040 will be behind Georgia, and there will be increasing references to Atlantaland as distinguished from Downstate Georgia.
Indiana: Could lose in 2030, but more likely 2040.
Iowa: Loses in 2080. Des Moines in western district?
Kansas: Could lose in 2040, but 2050 is more likely.
Kentucky: Loses 6th in 2040, though 2050 is possible.
Louisiana: Loses 6th in 2080.
Maine: Loses 2nd in 2050, will they change their electoral vote allocation to 3 electoral districts?
Massachusetts: No losses until 2090.
Michigan: One per decade, but may be unchanged in 2040 or 2050. Michigan drops to 10th this decade, passed by Georgia and North Carolina, but won't drop out of top 10 until passed by Washington or Arizona in 2040 or 2050.
Minnesota: Will not lose another for the next century.
Mississippi: Possibly loses 4th in 2040, certainly by 2050.
Missouri: Loses 8th in 2040.
Montana: Regains 2nd in 2030? Montana is like a swimmer swimming against the current. Their position never changes.
Nebraska: May cling to 3rd indefinitely.
Nevada: Could gain 5th in 2040, particularly if housing bubble abates.
New Hampshire: Loses 2nd in 2060.
New Jersey: Loses 12th in 2030, and 11th in 2050.
New Mexico: Could lose 3rd in 2040.
New York: Should continue to lose one district per decade.
North Carolina: Very solid for 14th district in 2020. Could gain 15th in 2040. If not then, 2050.
North Dakota: Could regain 2nd by 2050, but that assumes continued growth in the Williston Basin.
Ohio: Will continue to lose a district per decade.
Oklahoma: Growing only slightly slower than country as a whole. Could have 5 districts forever.
Oregon: Could gain 7th district in 2080.
Pennsylvania: Will continue to lose a district per decade. Could see a loss of two due to rounding in the next few decades.
Rhode Island: Leads the path for Maine and New Hampshire to a single district.
South Carolina: Could gain 8th in 2050, maybe sooner if Charlotte spillover increases.
South Dakota: Regains 2nd in 2110.
Tennessee: Stuck on 9 forever.
Texas: Will add 3 or 4 each decade. Could surpass California by 2070.
Utah: Will likely gain 5th in 2030.
Vermont: Will likely fall below Wyoming by 2030.
Virginia: Possibility of 12 in 2040, but 2050 more likely.
West Virginia: Will keep 2 until at least 2070.
Wisconsin: Will lose 8th in 2030, as it will probably fall behind Minnesota.
Wyoming: One forever.
Great list, though it appears you missed Washington.
Title: Re: Census population estimates 2011-2019
Post by: KingSweden on October 02, 2017, 09:27:06 AM
We can project the decennial change forward (for states that are losing population share, the value will decline, since it really relative to its current population share, and vice versa for gainers).
Alabama: If no loss in 2020, it will lose in 2030. The drop to 5 will occur in 2060, but possibly 2050.
Alaska: No change - Alaska is growing slower than the US as a whole.
Arizona: Will gain a district every 20 years, but this could be quite irregular. For example if it doesn't gain a district in 2020, it could gain in 2030 and 2040.
Arkansas: Drops to 3 in 2060.
California: Could gain 54th in 2030 or 2040.
Colorado: Gains 8th in 2020 and 9th in 2040.
Connecticut: Loses 5th in 2030.
Delaware: Will get its 2nd seat back in 2070 (Wyoming and Alaska are only states that have never had at least two representatives).
Florida: Will gain two representatives per decade, though like Arizona, this may be irregular (1 some decades or 3 others).
Georgia: Gains 15th in 2040 (Georgia is increasing its lead on North Carolina)
Hawaii: No change (at current rate would gain 3rd seat in 2440).
Idaho: 3rd in 2040 (or perhaps 2050).
Illinois: Could lose 2 in 2030. By 2040 will be behind Georgia, and there will be increasing references to Atlantaland as distinguished from Downstate Georgia.
Indiana: Could lose in 2030, but more likely 2040.
Iowa: Loses in 2080. Des Moines in western district?
Kansas: Could lose in 2040, but 2050 is more likely.
Kentucky: Loses 6th in 2040, though 2050 is possible.
Louisiana: Loses 6th in 2080.
Maine: Loses 2nd in 2050, will they change their electoral vote allocation to 3 electoral districts?
Massachusetts: No losses until 2090.
Michigan: One per decade, but may be unchanged in 2040 or 2050. Michigan drops to 10th this decade, passed by Georgia and North Carolina, but won't drop out of top 10 until passed by Washington or Arizona in 2040 or 2050.
Minnesota: Will not lose another for the next century.
Mississippi: Possibly loses 4th in 2040, certainly by 2050.
Missouri: Loses 8th in 2040.
Montana: Regains 2nd in 2030? Montana is like a swimmer swimming against the current. Their position never changes.
Nebraska: May cling to 3rd indefinitely.
Nevada: Could gain 5th in 2040, particularly if housing bubble abates.
New Hampshire: Loses 2nd in 2060.
New Jersey: Loses 12th in 2030, and 11th in 2050.
New Mexico: Could lose 3rd in 2040.
New York: Should continue to lose one district per decade.
North Carolina: Very solid for 14th district in 2020. Could gain 15th in 2040. If not then, 2050.
North Dakota: Could regain 2nd by 2050, but that assumes continued growth in the Williston Basin.
Ohio: Will continue to lose a district per decade.
Oklahoma: Growing only slightly slower than country as a whole. Could have 5 districts forever.
Oregon: Could gain 7th district in 2080.
Pennsylvania: Will continue to lose a district per decade. Could see a loss of two due to rounding in the next few decades.
Rhode Island: Leads the path for Maine and New Hampshire to a single district.
South Carolina: Could gain 8th in 2050, maybe sooner if Charlotte spillover increases.
South Dakota: Regains 2nd in 2110.
Tennessee: Stuck on 9 forever.
Texas: Will add 3 or 4 each decade. Could surpass California by 2070.
Utah: Will likely gain 5th in 2030.
Vermont: Will likely fall below Wyoming by 2030.
Virginia: Possibility of 12 in 2040, but 2050 more likely.
West Virginia: Will keep 2 until at least 2070.
Wisconsin: Will lose 8th in 2030, as it will probably fall behind Minnesota.
Wyoming: One forever.
Alabama: If no loss in 2020, it will lose in 2030. The drop to 5 will occur in 2060, but possibly 2050.
Alaska: No change - Alaska is growing slower than the US as a whole.
Arizona: Will gain a district every 20 years, but this could be quite irregular. For example if it doesn't gain a district in 2020, it could gain in 2030 and 2040.
Arkansas: Drops to 3 in 2060.
California: Could gain 54th in 2030 or 2040.
Colorado: Gains 8th in 2020 and 9th in 2040.
Connecticut: Loses 5th in 2030.
Delaware: Will get its 2nd seat back in 2070 (Wyoming and Alaska are only states that have never had at least two representatives).
Florida: Will gain two representatives per decade, though like Arizona, this may be irregular (1 some decades or 3 others).
Georgia: Gains 15th in 2040 (Georgia is increasing its lead on North Carolina)
Hawaii: No change (at current rate would gain 3rd seat in 2440).
Idaho: 3rd in 2040 (or perhaps 2050).
Illinois: Could lose 2 in 2030. By 2040 will be behind Georgia, and there will be increasing references to Atlantaland as distinguished from Downstate Georgia.
Indiana: Could lose in 2030, but more likely 2040.
Iowa: Loses in 2080. Des Moines in western district?
Kansas: Could lose in 2040, but 2050 is more likely.
Kentucky: Loses 6th in 2040, though 2050 is possible.
Louisiana: Loses 6th in 2080.
Maine: Loses 2nd in 2050, will they change their electoral vote allocation to 3 electoral districts?
Massachusetts: No losses until 2090.
Michigan: One per decade, but may be unchanged in 2040 or 2050. Michigan drops to 10th this decade, passed by Georgia and North Carolina, but won't drop out of top 10 until passed by Washington or Arizona in 2040 or 2050.
Minnesota: Will not lose another for the next century.
Mississippi: Possibly loses 4th in 2040, certainly by 2050.
Missouri: Loses 8th in 2040.
Montana: Regains 2nd in 2030? Montana is like a swimmer swimming against the current. Their position never changes.
Nebraska: May cling to 3rd indefinitely.
Nevada: Could gain 5th in 2040, particularly if housing bubble abates.
New Hampshire: Loses 2nd in 2060.
New Jersey: Loses 12th in 2030, and 11th in 2050.
New Mexico: Could lose 3rd in 2040.
New York: Should continue to lose one district per decade.
North Carolina: Very solid for 14th district in 2020. Could gain 15th in 2040. If not then, 2050.
North Dakota: Could regain 2nd by 2050, but that assumes continued growth in the Williston Basin.
Ohio: Will continue to lose a district per decade.
Oklahoma: Growing only slightly slower than country as a whole. Could have 5 districts forever.
Oregon: Could gain 7th district in 2080.
Pennsylvania: Will continue to lose a district per decade. Could see a loss of two due to rounding in the next few decades.
Rhode Island: Leads the path for Maine and New Hampshire to a single district.
South Carolina: Could gain 8th in 2050, maybe sooner if Charlotte spillover increases.
South Dakota: Regains 2nd in 2110.
Tennessee: Stuck on 9 forever.
Texas: Will add 3 or 4 each decade. Could surpass California by 2070.
Utah: Will likely gain 5th in 2030.
Vermont: Will likely fall below Wyoming by 2030.
Virginia: Possibility of 12 in 2040, but 2050 more likely.
West Virginia: Will keep 2 until at least 2070.
Wisconsin: Will lose 8th in 2030, as it will probably fall behind Minnesota.
Wyoming: One forever.
Great list, though it appears you missed Washington.
Thanks!
Title: Re: Census population estimates 2011-2019
Post by: Obama-Biden Democrat on November 15, 2017, 10:35:54 PM
We can project the decennial change forward (for states that are losing population share, the value will decline, since it really relative to its current population share, and vice versa for gainers).
Alabama: If no loss in 2020, it will lose in 2030. The drop to 5 will occur in 2060, but possibly 2050.
Alaska: No change - Alaska is growing slower than the US as a whole.
Arizona: Will gain a district every 20 years, but this could be quite irregular. For example if it doesn't gain a district in 2020, it could gain in 2030 and 2040.
Arkansas: Drops to 3 in 2060.
California: Could gain 54th in 2030 or 2040.
Colorado: Gains 8th in 2020 and 9th in 2040.
Connecticut: Loses 5th in 2030.
Delaware: Will get its 2nd seat back in 2070 (Wyoming and Alaska are only states that have never had at least two representatives).
Florida: Will gain two representatives per decade, though like Arizona, this may be irregular (1 some decades or 3 others).
Georgia: Gains 15th in 2040 (Georgia is increasing its lead on North Carolina)
Hawaii: No change (at current rate would gain 3rd seat in 2440).
Idaho: 3rd in 2040 (or perhaps 2050).
Illinois: Could lose 2 in 2030. By 2040 will be behind Georgia, and there will be increasing references to Atlantaland as distinguished from Downstate Georgia.
Indiana: Could lose in 2030, but more likely 2040.
Iowa: Loses in 2080. Des Moines in western district?
Kansas: Could lose in 2040, but 2050 is more likely.
Kentucky: Loses 6th in 2040, though 2050 is possible.
Louisiana: Loses 6th in 2080.
Maine: Loses 2nd in 2050, will they change their electoral vote allocation to 3 electoral districts?
Massachusetts: No losses until 2090.
Michigan: One per decade, but may be unchanged in 2040 or 2050. Michigan drops to 10th this decade, passed by Georgia and North Carolina, but won't drop out of top 10 until passed by Washington or Arizona in 2040 or 2050.
Minnesota: Will not lose another for the next century.
Mississippi: Possibly loses 4th in 2040, certainly by 2050.
Missouri: Loses 8th in 2040.
Montana: Regains 2nd in 2030? Montana is like a swimmer swimming against the current. Their position never changes.
Nebraska: May cling to 3rd indefinitely.
Nevada: Could gain 5th in 2040, particularly if housing bubble abates.
New Hampshire: Loses 2nd in 2060.
New Jersey: Loses 12th in 2030, and 11th in 2050.
New Mexico: Could lose 3rd in 2040.
New York: Should continue to lose one district per decade.
North Carolina: Very solid for 14th district in 2020. Could gain 15th in 2040. If not then, 2050.
North Dakota: Could regain 2nd by 2050, but that assumes continued growth in the Williston Basin.
Ohio: Will continue to lose a district per decade.
Oklahoma: Growing only slightly slower than country as a whole. Could have 5 districts forever.
Oregon: Could gain 7th district in 2080.
Pennsylvania: Will continue to lose a district per decade. Could see a loss of two due to rounding in the next few decades.
Rhode Island: Leads the path for Maine and New Hampshire to a single district.
South Carolina: Could gain 8th in 2050, maybe sooner if Charlotte spillover increases.
South Dakota: Regains 2nd in 2110.
Tennessee: Stuck on 9 forever.
Texas: Will add 3 or 4 each decade. Could surpass California by 2070.
Utah: Will likely gain 5th in 2030.
Vermont: Will likely fall below Wyoming by 2030.
Virginia: Possibility of 12 in 2040, but 2050 more likely.
West Virginia: Will keep 2 until at least 2070.
Wisconsin: Will lose 8th in 2030, as it will probably fall behind Minnesota.
Wyoming: One forever.
Alabama: If no loss in 2020, it will lose in 2030. The drop to 5 will occur in 2060, but possibly 2050.
Alaska: No change - Alaska is growing slower than the US as a whole.
Arizona: Will gain a district every 20 years, but this could be quite irregular. For example if it doesn't gain a district in 2020, it could gain in 2030 and 2040.
Arkansas: Drops to 3 in 2060.
California: Could gain 54th in 2030 or 2040.
Colorado: Gains 8th in 2020 and 9th in 2040.
Connecticut: Loses 5th in 2030.
Delaware: Will get its 2nd seat back in 2070 (Wyoming and Alaska are only states that have never had at least two representatives).
Florida: Will gain two representatives per decade, though like Arizona, this may be irregular (1 some decades or 3 others).
Georgia: Gains 15th in 2040 (Georgia is increasing its lead on North Carolina)
Hawaii: No change (at current rate would gain 3rd seat in 2440).
Idaho: 3rd in 2040 (or perhaps 2050).
Illinois: Could lose 2 in 2030. By 2040 will be behind Georgia, and there will be increasing references to Atlantaland as distinguished from Downstate Georgia.
Indiana: Could lose in 2030, but more likely 2040.
Iowa: Loses in 2080. Des Moines in western district?
Kansas: Could lose in 2040, but 2050 is more likely.
Kentucky: Loses 6th in 2040, though 2050 is possible.
Louisiana: Loses 6th in 2080.
Maine: Loses 2nd in 2050, will they change their electoral vote allocation to 3 electoral districts?
Massachusetts: No losses until 2090.
Michigan: One per decade, but may be unchanged in 2040 or 2050. Michigan drops to 10th this decade, passed by Georgia and North Carolina, but won't drop out of top 10 until passed by Washington or Arizona in 2040 or 2050.
Minnesota: Will not lose another for the next century.
Mississippi: Possibly loses 4th in 2040, certainly by 2050.
Missouri: Loses 8th in 2040.
Montana: Regains 2nd in 2030? Montana is like a swimmer swimming against the current. Their position never changes.
Nebraska: May cling to 3rd indefinitely.
Nevada: Could gain 5th in 2040, particularly if housing bubble abates.
New Hampshire: Loses 2nd in 2060.
New Jersey: Loses 12th in 2030, and 11th in 2050.
New Mexico: Could lose 3rd in 2040.
New York: Should continue to lose one district per decade.
North Carolina: Very solid for 14th district in 2020. Could gain 15th in 2040. If not then, 2050.
North Dakota: Could regain 2nd by 2050, but that assumes continued growth in the Williston Basin.
Ohio: Will continue to lose a district per decade.
Oklahoma: Growing only slightly slower than country as a whole. Could have 5 districts forever.
Oregon: Could gain 7th district in 2080.
Pennsylvania: Will continue to lose a district per decade. Could see a loss of two due to rounding in the next few decades.
Rhode Island: Leads the path for Maine and New Hampshire to a single district.
South Carolina: Could gain 8th in 2050, maybe sooner if Charlotte spillover increases.
South Dakota: Regains 2nd in 2110.
Tennessee: Stuck on 9 forever.
Texas: Will add 3 or 4 each decade. Could surpass California by 2070.
Utah: Will likely gain 5th in 2030.
Vermont: Will likely fall below Wyoming by 2030.
Virginia: Possibility of 12 in 2040, but 2050 more likely.
West Virginia: Will keep 2 until at least 2070.
Wisconsin: Will lose 8th in 2030, as it will probably fall behind Minnesota.
Wyoming: One forever.
Very interesting to see such tepid growth and even the loss of EV's for most of the non sun belt Deep South. I would have assumed that their high black population as well as high levels of religiosity would lead to higher birth rates and levels of population growth than the more secular states. I remember in the 2000's after Bush won a second term, that people said how liberals were losing the demographic war because they were having fewer kids than conservatives.
Title: Re: Census population estimates 2011-2019
Post by: jimrtex on November 16, 2017, 07:22:02 AM
We can project the decennial change forward (for states that are losing population share, the value will decline, since it really relative to its current population share, and vice versa for gainers).
Alabama: If no loss in 2020, it will lose in 2030. The drop to 5 will occur in 2060, but possibly 2050.
Arkansas: Drops to 3 in 2060.
Kentucky: Loses 6th in 2040, though 2050 is possible.
Louisiana: Loses 6th in 2080.
Mississippi: Possibly loses 4th in 2040, certainly by 2050.
Tennessee: Stuck on 9 forever.
Very interesting to see such tepid growth and even the loss of EV's for most of the non sun belt Deep South. I would have assumed that their high black population as well as high levels of religiosity would lead to higher birth rates and levels of population growth than the more secular states. I remember in the 2000's after Bush won a second term, that people said how liberals were losing the demographic war because they were having fewer kids than conservatives.
To move to a new location, requires money. This can be a pension or savings for retirees. But this also needs constant replenishment, as retirees die or move back "home" where their children live. Northwest Arkansas and Tennessee may be attractive based on weather and low cost of living. But why would anyone retire to Alabama or Mississippi?
Someone who has a lot of wealth can live where they want to, but are likely to choose a place based on weather or lifestyle. Some people can make income remotely, but they too are likely to choose a place based on weather or lifestyle. Colorado is much more attractive than Mississippi.
Or you can move for a job. But there are no jobs in rural area, and few in small towns. The number of jobs for school teachers, doctors, grocery workers, etc. is dependent on the underlying population of an area.
Manufacturing jobs are declining. While Alabama has attracted a lot of auto plants, this likely means that the overall decline is slower than in other states (Michigan, Pennsylvania, New York, etc.)
Service jobs based on regional or national economy need large cities. No major corporation is going to relocate their HQ to a small town (Walmart is an anomaly, and the HQ was in Bentonville before it was a big company). If a company grows, they may move away from a smaller city like Jackson or Little Rock. Tennessee has a couple of larger cities (big enough to support major league teams), and unsurprisingly it is the only state in the mid-South holding its own.
Mississippi has the largest decline in relative population share. Jackson is a small city, and when Horn Lake, Southaven, and Pearl are top 10 cities, you don't have cities. Kentucky and Arkansas are quite concentrated. If you were choosing between Louisville, Columbus, and Indianapolis for a regional or national HQ, which do you choose?
Alabama has many cities, but may be held back by Birmingham shedding its image as an aging industrial city.
Title: Re: Census population estimates 2011-2019
Post by: Tender Branson on November 26, 2017, 08:38:50 AM
Update:
The new estimates for Mid-2017 are out in 4 weeks.
Based on preliminary CDC data of births and deaths, the US population growth rate likely dropped to the lowest level on record last year ... => 0.6%
(Not even in the 1930s was population growth so low, but there were no annual estimates back then. Only a decade-long growth rate of 7.5%)
Why ?
Births between July 2016 and June 2017 were only at 3.884 million (vs. 3.976 million in the year before).
Deaths between July 2016 and June 2017 were up at 2.780 million (vs. 2.721 million in the year before).
https://www.cdc.gov/nchs/nvss/vsrr/provisional-tables.htm
So, the natural increase decreased from 1.255 million between 2015-16 to just 1.104 million between 2016-17.
It is likely that the immigration balance is also down slightly from the +1 million in 2015-16, so the population likely increased by about 2 million people (maybe 2.1 million if immigration levels remain stable).
Title: Re: Census population estimates 2011-2019
Post by: jimrtex on November 26, 2017, 03:14:18 PM
Update:
The new estimates for Mid-2017 are out in 4 weeks.
Deaths between July 2016 and June 2017 were up at 2.780 million (vs. 2.721 million in the year before).
The new estimates for Mid-2017 are out in 4 weeks.
Deaths between July 2016 and June 2017 were up at 2.780 million (vs. 2.721 million in the year before).
The earliest baby boomers are now 72. Their death rate is 9.1% higher than a year earlier. They and their younger siblings are driving the 2.2% overall increase in the death rate.
Title: Re: Census population estimates 2011-2019
Post by: Tender Branson on November 26, 2017, 03:36:37 PM
Update:
The new estimates for Mid-2017 are out in 4 weeks.
Deaths between July 2016 and June 2017 were up at 2.780 million (vs. 2.721 million in the year before).
The new estimates for Mid-2017 are out in 4 weeks.
Deaths between July 2016 and June 2017 were up at 2.780 million (vs. 2.721 million in the year before).
The earliest baby boomers are now 72. Their death rate is 9.1% higher than a year earlier. They and their younger siblings are driving the 2.2% overall increase in the death rate.
Yes, this might be a reason.
Also:
Traditionally, some states have already released their own estimates for 2017 and it seems the high growth rates on the West Coast are very stable (WA had 1.7%, OR 1.6% and CA 0.9%) - while CO is also at 1.7%
FL is projected at +335.000, or +1.7% (like the year before).
Metro Atlanta increased by 80.000 people to April 2017, the highest level since before the 2008 recession.
On the other hand, WI's growth is down from 30.000 to about 8.000 within a year - suggesting an increased trend of stagnant/declining population in the Rust Belt/Northeast, with more and more people moving to the South and West Coast + the Mountain West.
Title: Re: Census population estimates 2011-2019
Post by: Tender Branson on December 06, 2017, 02:55:46 PM
A new study estimates that some 470.000 Puerto Ricans have left the island after the hurricane there, with 215.000 heading to Florida (and a sizeable amount to NY of course).
These numbers won't show up in the new release out soon, because the data will be for July 1, 2017 and the hurricane was after that.
But FL should get a significant bump for the 2018 estimates, probably some 350-500K growth (or more than 2%).
NY should be lifted out of stagnation next year, before falling back into stagnation/decline.
http://miami.cbslocal.com/2017/12/05/puerto-rico-immigration-hurricane-maria/
Title: Re: Census population estimates 2011-2019
Post by: Skycraper15 on December 06, 2017, 09:09:06 PM
Isn't Washington State also growing rapidly?
Title: Re: Census population estimates 2011-2019
Post by: President Punxsutawney Phil on December 06, 2017, 09:42:00 PM
NY might wind up losing no seats this decade.
Title: Re: Census population estimates 2011-2019
Post by: Tintrlvr on December 06, 2017, 11:17:07 PM
A new study estimates that some 470.000 Puerto Ricans have left the island after the hurricane there, with 215.000 heading to Florida (and a sizeable amount to NY of course).
These numbers won't show up in the new release out soon, because the data will be for July 1, 2017 and the hurricane was after that.
But FL should get a significant bump for the 2018 estimates, probably some 350-500K growth (or more than 2%).
NY should be lifted out of stagnation next year, before falling back into stagnation/decline.
http://miami.cbslocal.com/2017/12/05/puerto-rico-immigration-hurricane-maria/
These numbers won't show up in the new release out soon, because the data will be for July 1, 2017 and the hurricane was after that.
But FL should get a significant bump for the 2018 estimates, probably some 350-500K growth (or more than 2%).
NY should be lifted out of stagnation next year, before falling back into stagnation/decline.
http://miami.cbslocal.com/2017/12/05/puerto-rico-immigration-hurricane-maria/
So, the question is, which New York-area county will grow faster - the Bronx or Hudson County, New Jersey?
Title: Re: Census population estimates 2011-2019
Post by: Tender Branson on December 07, 2017, 12:09:53 AM
Isn't Washington State also growing rapidly?
Yes, but not because of Puerto Ricans.
(by 1.8% to April 2017 according to their own state estimates.)
Also, UT has released their state estimates recently: +1.9% to July 2017, which is roughly the same growth as the year before.
Title: Re: Census population estimates 2011-2019
Post by: cinyc on December 10, 2017, 11:55:07 PM
Census' 2012-16 ACS estimates came out last week. I have started to map some of the results, and might start a thread here later in the week with #analysis, if I can find the time.
For my first project, I compiled the Seq 23 commuting data. For now, you can see some of the interactive maps I made of that data on my Carto page (http://cinyc.carto.com).
For my first project, I compiled the Seq 23 commuting data. For now, you can see some of the interactive maps I made of that data on my Carto page (http://cinyc.carto.com).
Title: Re: Census population estimates 2011-2019
Post by: heatcharger on December 19, 2017, 06:52:29 PM
Aren't the latest state population estimates set to come out soon? Does anyone know when?
Title: Re: Census population estimates 2011-2019
Post by: Vern on December 19, 2017, 07:03:29 PM
Aren't the latest state population estimates set to come out soon? Does anyone know when?
Tomorrow
Title: Re: Census population estimates 2011-2019
Post by: DINGO Joe on December 20, 2017, 12:38:16 AM
Aren't the latest state population estimates set to come out soon? Does anyone know when?
Tomorrow @9AM I think. Part of the reason I wandered back in (though VA and AL were other reasons).
Title: Re: Census population estimates 2011-2019
Post by: cinyc on December 20, 2017, 10:24:35 AM
The 2017 state estimates are out. It looks like Alaska, Hawaii, Illinois, Louisiana, Mississippi, North Dakota, West Virginia and Wyoming lost population.
The largest numerical gain was in Texas - almost 400,000, followed by Florida.
The largest numerical gain was in Texas - almost 400,000, followed by Florida.
Title: Re: Census population estimates 2011-2019
Post by: cinyc on December 20, 2017, 11:00:04 AM
Census press release is out here:
https://www.census.gov/newsroom/press-releases/2017/estimates-idaho.html?intcmp=s1-popest-state
Idaho, Nevada and Utah had the highest percentage gains year-over-year.
https://www.census.gov/newsroom/press-releases/2017/estimates-idaho.html?intcmp=s1-popest-state
Idaho, Nevada and Utah had the highest percentage gains year-over-year.
Title: Re: Census population estimates 2011-2019
Post by: Brittain33 on December 20, 2017, 11:00:43 AM
Any surprises affecting reapportionment?
Title: Re: Census population estimates 2011-2019
Post by: cinyc on December 20, 2017, 11:08:23 AM
Any surprises affecting reapportionment?
Ill leave that up to the experts.
Pennsylvania passed Illinois and is now the 5th largest state.
Title: Re: Census population estimates 2011-2019
Post by: Brittain33 on December 20, 2017, 11:12:51 AM
It's been an hour and Jim hasn't posted his updated spreadsheet yet.
()
()
Title: Re: Census population estimates 2011-2019
Post by: DINGO Joe on December 20, 2017, 11:13:28 AM
The most annoying thing about the estimates is that they change prior year(s) estimates (which i understand), but don't give you an easy way to see those changes.
Title: Re: Census population estimates 2011-2019
Post by: DINGO Joe on December 20, 2017, 11:14:40 AM
It's been an hour and Jim hasn't posted his updated spreadsheet yet.
()
()
We can only assume the worst--he's in Tender's basement.
Title: Re: Census population estimates 2011-2019
Post by: muon2 on December 20, 2017, 11:19:23 AM
Here's my annual projection from the new estimates. I used the July 2017 estimates and the April 2010 Census base to get an annual growth rate. This correctly accounts for the 7 and a quarter year period between the Census and the estimate. I then applied the annual growth rate to the 2010 reapportionment population to get the 2020 projection. This accounts for the extra overseas population used in reapportionment but not for redistricting. Ten years is a long stretch for a simple model like this, but here are the projected changes.
AL -1
AZ +1
CO +1
FL +2
IL -1
MI -1
MN -1
NY -1
NC +1
OH -1
OR +1
PA -1
RI -1
TX +3
WV -1
There are no changes since my projections last year (https://uselectionatlas.org/FORUM/index.php?topic=166668.msg5441819#msg5441819). The bubble seats in this projection are based on the last five awarded and the next five in line.
The last five awarded are IL-17, TX-39, CA-53, FL-29, and AZ-10 (#435).
The next five in line are MT-2, AL-7, MN-8, NY-36, and CA-54.
An alternate projection could use just the last two years of estimates to determine the rate of growth for the rest of the decade. That model gives an extra seat to MT at the expense of one from CA.
Title: Re: Census population estimates 2011-2019
Post by: America's Sweetheart ❤/𝕿𝖍𝖊 𝕭𝖔𝖔𝖙𝖞 𝖂𝖆𝖗𝖗𝖎𝖔𝖗 on December 20, 2017, 11:34:08 AM
Here's my annual projection from the new estimates. I used the July 2017 estimates and the April 2010 Census base to get an annual growth rate. This correctly accounts for the 7 and a quarter year period between the Census and the estimate. I then applied the annual growth rate to the 2010 reapportionment population to get the 2020 projection. This accounts for the extra overseas population used in reapportionment but not for redistricting. Ten years is a long stretch for a simple model like this, but here are the projected changes.
AL -1
AZ +1
CO +1
FL +2
IL -1
MI -1
MN -1
NY -1
NC +1
OH -1
OR +1
PA -1
RI -1
TX +3
WV -1
There are no changes since my projections last year (https://uselectionatlas.org/FORUM/index.php?topic=166668.msg5441819#msg5441819). The bubble seats in this projection are based on the last five awarded and the next five in line.
The last five awarded are IL-17, TX-39, CA-53, FL-29, and AZ-10 (#435).
The next five in line are MT-2, AL-7, MN-8, NY-36, and CA-54.
An alternate projection could use just the last two years of estimates to determine the rate of growth for the rest of the decade. That model gives an extra seat to MT at the expense of one from CA.
AL -1
AZ +1
CO +1
FL +2
IL -1
MI -1
MN -1
NY -1
NC +1
OH -1
OR +1
PA -1
RI -1
TX +3
WV -1
There are no changes since my projections last year (https://uselectionatlas.org/FORUM/index.php?topic=166668.msg5441819#msg5441819). The bubble seats in this projection are based on the last five awarded and the next five in line.
The last five awarded are IL-17, TX-39, CA-53, FL-29, and AZ-10 (#435).
The next five in line are MT-2, AL-7, MN-8, NY-36, and CA-54.
An alternate projection could use just the last two years of estimates to determine the rate of growth for the rest of the decade. That model gives an extra seat to MT at the expense of one from CA.
Title: Re: Census population estimates 2011-2019
Post by: DINGO Joe on December 20, 2017, 11:41:14 AM
The estimate for Illinois is actually higher than last year's estimate, but they raised last year's estimate by 34,000, so a 1,000 gain becomes a 33,000 loss.
Title: Re: Census population estimates 2011-2019
Post by: Torie on December 20, 2017, 11:41:59 AM
Any surprises affecting reapportionment?
Ill leave that up to the experts.
Pennsylvania passed Illinois and is now the 5th largest state.
It is kind of shocking to read about PA passing another state in this department. When it happens, you know that the "passee" is in a sad state (yeah is
Title: Re: Census population estimates 2011-2019
Post by: muon2 on December 20, 2017, 11:48:41 AM
The estimates this year had few surprises, but next year may be different. The impact of the 2017 hurricanes will show up in the 2018 estimates. For example, a wave from PR to NY might keep NY from losing a seat.
Title: Re: Census population estimates 2011-2019
Post by: KingSweden on December 20, 2017, 12:33:51 PM
The estimates this year had few surprises, but next year may be different. The impact of the 2017 hurricanes will show up in the 2018 estimates. For example, a wave from PR to NY might keep NY from losing a seat.
Think TX might get bounced down to just 2 seats in such a scenario?
Title: Re: Census population estimates 2011-2019
Post by: Starpaul20 on December 20, 2017, 02:09:49 PM
I decided to see what a Wyoming Rule house would look like with the new population estimates. The house membership would expand to 561 seats, an increase of 126 over its current size:
(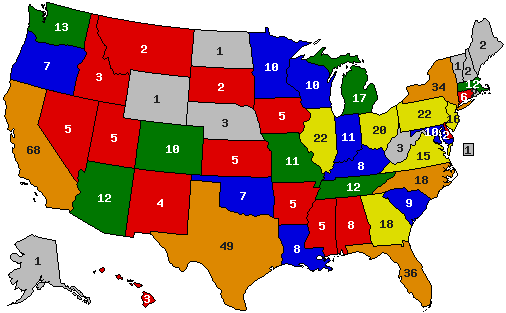 )
)
(States in red gain 1 seat, blue gains 2 seats, green gains 3 seats, yellow gains 4 seats, orange gains 5 or more and gray means no change)
EDIT: For comparison, here's what a Wyoming Rule house would look like with the 2010 census results (547 seats):
(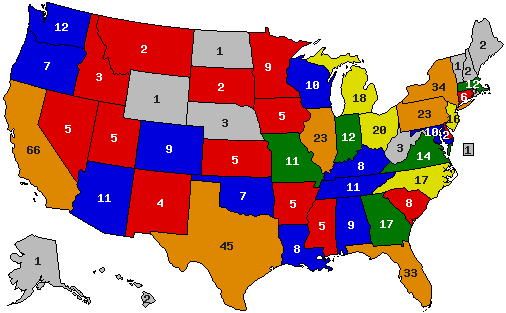 )
)
(
(States in red gain 1 seat, blue gains 2 seats, green gains 3 seats, yellow gains 4 seats, orange gains 5 or more and gray means no change)
EDIT: For comparison, here's what a Wyoming Rule house would look like with the 2010 census results (547 seats):
(
Title: Re: Census population estimates 2011-2019
Post by: Tender Branson on December 20, 2017, 02:40:30 PM
The international immigration surplus to the US was actually 1.1 million to July 2017 (up from less than 1 million in the year before), which is surprising considering Trump's harsh anti-immigrant policies.
When it comes to domestic migration patterns, the top-10 states with the highest domestic migration gains (excl. international migration) are:
FL (by far), TX, NC, WA, AZ, SC, GA, TN, NV and OR.
While NY, CA and IL have by far the largest domestic migration losses.
CA and NY have also the biggest international migration surplus, so this balances their huge domestic losses to other states.
2 states (ME and WV) had more deaths than births last year. CA and TX had the biggest birth surplus.
Title: Re: Census population estimates 2011-2019
Post by: Gass3268 on December 20, 2017, 06:02:19 PM
()
From Election Data Services (https://pbs.twimg.com/media/DRhkjOSXUAAfVj0.jpg)
From Election Data Services (https://pbs.twimg.com/media/DRhkjOSXUAAfVj0.jpg)
Title: Re: Census population estimates 2011-2019
Post by: Brittain33 on December 20, 2017, 06:53:54 PM
Are the only *certain* partisan impacts of the change AL -1R, RI -1D, WV -1R?
Is there any reasonable way Ohio actually eliminates another Dem? I have to imagine they are maxed out, the Trump surge in Ryan's district notwithstanding.
Is there any reasonable way Ohio actually eliminates another Dem? I have to imagine they are maxed out, the Trump surge in Ryan's district notwithstanding.
Title: Re: Census population estimates 2011-2019
Post by: jimrtex on December 21, 2017, 02:01:57 AM
It's been an hour and Jim hasn't posted his updated spreadsheet yet.
The next columns are the additional change needed to get another seat, and the projected change for 2010-2020. Alabama is projected to increase by 132K from 2010 to 2020. It would need an additional 54K to get seven districts (and stave off the loss of a seat). Alabama has been growing at an annual rate at 0.27% from 2010-2017, and would have to kick it into gear at 0.69% for the last three years to keep a seventh seat.
State 2010 2020 10-20 20 Ch. Need Act Rate Need
Alabama 6.737 6.431 -0.307 6 -1 54 132 0.27% 0.67%
Alaska 1.117 1.101 -0.016 1 = 332 41 0.56% 14.89%
Arizona 8.999 9.502 0.503 10 +1 -60 877 1.29% 0.99%
Arkansas 4.129 3.998 -0.131 4 = -406 123 0.41% -4.69%
California 52.369 52.791 0.422 53 = -547 3185 0.82% 0.33%
Colorado 7.087 7.644 0.557 8 +1 -157 814 1.51% 0.51%
Connecticut 5.049 4.718 -0.331 5 = -195 19 0.05% -1.96%
Delaware 1.358 1.383 0.025 1 = 96 89 0.95% 4.42%
Florida 26.435 28.562 2.127 29 +2 -223 3074 1.53% 1.15%
Georgia 13.627 14.010 0.383 14 = 378 1038 1.02% 2.30%
Hawaii 1.976 1.963 -0.014 2 = -379 94 0.67% -9.81%
Idaho 2.260 2.373 0.114 2 = 100 210 1.26% 3.29%
Illinois 18.043 16.705 -1.337 17 -1 -259 -39 -0.03% -0.77%
Indiana 9.128 8.810 -0.318 9 = -290 254 0.38% -1.21%
Iowa 4.312 4.186 -0.126 4 = 242 137 0.44% 3.16%
Kansas 4.042 3.865 -0.176 4 = -304 83 0.29% -3.62%
Kentucky 6.120 5.894 -0.226 6 = -336 159 0.36% -2.44%
Louisiana 6.392 6.212 -0.180 6 = 223 210 0.45% 2.14%
Maine 1.933 1.818 -0.115 2 = -264 10 0.08% -7.61%
Maryland 8.131 8.059 -0.072 8 = 340 388 0.65% 2.64%
Massachusetts 9.217 9.128 -0.089 9 = 287 434 0.64% 2.13%
Michigan 13.902 13.054 -0.848 13 -1 344 109 0.11% 1.35%
Minnesota 7.472 7.436 -0.036 7 -1 50 380 0.69% 1.01%
Mississippi 4.201 3.936 -0.265 4 = -358 23 0.08% -4.46%
Missouri 8.433 8.059 -0.375 8 = 340 173 0.28% 2.26%
Montana 1.478 1.489 0.011 1 = 9 85 0.83% 1.13%
Nebraska 2.615 2.603 -0.012 3 = -96 131 0.69% -1.12%
Nevada 3.829 4.103 0.274 4 = 307 419 1.45% 4.98%
New Hampshire 1.917 1.836 -0.081 2 = -278 36 0.27% -7.78%
New Jersey 12.369 11.874 -0.494 12 = -358 296 0.33% -1.12%
New Mexico 2.937 2.785 -0.152 3 = -238 40 0.19% -4.09%
New York 27.244 26.154 -1.090 26 -1 269 653 0.33% 0.82%
North Carolina 13.413 13.805 0.392 14 +1 -317 1033 1.03% -0.08%
North Dakota 1.070 1.145 0.076 1 = 294 117 1.61% 14.02%
Ohio 16.224 15.288 -0.936 15 -1 164 169 0.15% 0.65%
Oklahoma 5.297 5.247 -0.050 5 = 195 250 0.65% 2.41%
Oregon 5.408 5.593 0.185 6 +1 -105 436 1.08% 0.17%
Pennsylvania 17.862 16.775 -1.087 17 -1 -313 143 0.11% -0.78%
Rhode Island 1.562 1.474 -0.088 1 -1 21 10 0.09% 0.81%
South Carolina 6.521 6.786 0.265 7 = -260 559 1.15% -0.73%
South Dakota 1.249 1.267 0.018 1 = 192 78 0.91% 8.32%
Tennessee 8.935 8.971 0.037 9 = -414 516 0.78% -1.47%
Texas 35.350 38.649 3.299 39 +3 -351 4459 1.65% 1.21%
Utah 3.917 4.260 0.343 4 = 186 477 1.60% 3.69%
Vermont 1.012 0.955 -0.057 1 = 461 -3 -0.05% 22.25%
Virginia 11.258 11.309 0.051 11 = 148 654 0.79% 1.41%
Washington 9.466 10.040 0.575 10 = 354 957 1.34% 3.01%
West Virginia 2.652 2.405 -0.247 2 -1 75 -51 -0.28% 1.21%
Wisconsin 8.010 7.636 -0.373 8 = -151 150 0.26% -0.69%
Wyoming 0.937 0.913 -0.024 1 = 498 22 0.38% 25.57%
Title: Re: Census population estimates 2011-2019
Post by: jimrtex on December 21, 2017, 07:04:25 AM
It's been an hour and Jim hasn't posted his updated spreadsheet yet.
Alabama 6.737 6.431 -0.307 6 -1 54 132 0.27% 0.67%
Alaska 1.117 1.101 -0.016 1 = 332 41 0.56% 14.89%
Arizona 8.999 9.502 0.503 10 +1 -60 877 1.29% 0.99%
Arkansas 4.129 3.998 -0.131 4 = -406 123 0.41% -4.69%
California 52.369 52.791 0.422 53 = -547 3185 0.82% 0.33%
Colorado 7.087 7.644 0.557 8 +1 -157 814 1.51% 0.51%
Connecticut 5.049 4.718 -0.331 5 = -195 19 0.05% -1.96%
Delaware 1.358 1.383 0.025 1 = 96 89 0.95% 4.42%
Florida 26.435 28.562 2.127 29 +2 -223 3074 1.53% 1.15%
Georgia 13.627 14.010 0.383 14 = 378 1038 1.02% 2.30%
Hawaii 1.976 1.963 -0.014 2 = -379 94 0.67% -9.81%
Idaho 2.260 2.373 0.114 2 = 100 210 1.26% 3.29%
Illinois 18.043 16.705 -1.337 17 -1 -259 -39 -0.03% -0.77%
Indiana 9.128 8.810 -0.318 9 = -290 254 0.38% -1.21%
Iowa 4.312 4.186 -0.126 4 = 242 137 0.44% 3.16%
Kansas 4.042 3.865 -0.176 4 = -304 83 0.29% -3.62%
Kentucky 6.120 5.894 -0.226 6 = -336 159 0.36% -2.44%
Louisiana 6.392 6.212 -0.180 6 = 223 210 0.45% 2.14%
Maine 1.933 1.818 -0.115 2 = -264 10 0.08% -7.61%
Maryland 8.131 8.059 -0.072 8 = 340 388 0.65% 2.64%
Massachusetts 9.217 9.128 -0.089 9 = 287 434 0.64% 2.13%
Michigan 13.902 13.054 -0.848 13 -1 344 109 0.11% 1.35%
Minnesota 7.472 7.436 -0.036 7 -1 50 380 0.69% 1.01%
Mississippi 4.201 3.936 -0.265 4 = -358 23 0.08% -4.46%
Missouri 8.433 8.059 -0.375 8 = 340 173 0.28% 2.26%
Montana 1.478 1.489 0.011 1 = 9 85 0.83% 1.13%
Nebraska 2.615 2.603 -0.012 3 = -96 131 0.69% -1.12%
Nevada 3.829 4.103 0.274 4 = 307 419 1.45% 4.98%
New Hampshire 1.917 1.836 -0.081 2 = -278 36 0.27% -7.78%
New Jersey 12.369 11.874 -0.494 12 = -358 296 0.33% -1.12%
New Mexico 2.937 2.785 -0.152 3 = -238 40 0.19% -4.09%
New York 27.244 26.154 -1.090 26 -1 269 653 0.33% 0.82%
North Carolina 13.413 13.805 0.392 14 +1 -317 1033 1.03% -0.08%
North Dakota 1.070 1.145 0.076 1 = 294 117 1.61% 14.02%
Ohio 16.224 15.288 -0.936 15 -1 164 169 0.15% 0.65%
Oklahoma 5.297 5.247 -0.050 5 = 195 250 0.65% 2.41%
Oregon 5.408 5.593 0.185 6 +1 -105 436 1.08% 0.17%
Pennsylvania 17.862 16.775 -1.087 17 -1 -313 143 0.11% -0.78%
Rhode Island 1.562 1.474 -0.088 1 -1 21 10 0.09% 0.81%
South Carolina 6.521 6.786 0.265 7 = -260 559 1.15% -0.73%
South Dakota 1.249 1.267 0.018 1 = 192 78 0.91% 8.32%
Tennessee 8.935 8.971 0.037 9 = -414 516 0.78% -1.47%
Texas 35.350 38.649 3.299 39 +3 -351 4459 1.65% 1.21%
Utah 3.917 4.260 0.343 4 = 186 477 1.60% 3.69%
Vermont 1.012 0.955 -0.057 1 = 461 -3 -0.05% 22.25%
Virginia 11.258 11.309 0.051 11 = 148 654 0.79% 1.41%
Washington 9.466 10.040 0.575 10 = 354 957 1.34% 3.01%
West Virginia 2.652 2.405 -0.247 2 -1 75 -51 -0.28% 1.21%
Wisconsin 8.010 7.636 -0.373 8 = -151 150 0.26% -0.69%
Wyoming 0.937 0.913 -0.024 1 = 498 22 0.38% 25.57%
After 2011, projected gainers were Colorado, Florida, North Carolina, Texas+3, and Virginia.
Projected losers were Alabama, Illinois, Michigan, Minnesota, Ohio, Pennsylvania, and Rhode Island.
In 2011, Arizona and Florida were still shaking off the effects of the housing bubble in 2008, which saw people without jobs upside down on their mortgages, and near-seniors not able to retire and move to Florida. Oregon has been grasping a 6th seat for a long time, but not quite able to keep up with Washington, Nevada, Utah, Arizona, and Colorado. Mid-decade they had an uptick in population increase.
Meanwhile, New York has dropped from a rate that would have kept them losing a whole seat, to much slower growth. West Virginia went from anemic growth to an actual loss, and Virginia has slowed its growth, as the big government boom of the early Obama years has ended.
By 2011, North Carolina had gained a seat, and Minnesota had lost a seat, and if this were Australia, there would have been a redistribution.
By 2002, there were no changes.
By 2003, West Virginia was projected to lose its 3rd district, and Alabama keep its 7th. At the time West Virginia was at zero growth, and could have kept the district if it could only increase its rate of growth to 0.08%. It wasn't anything Alabama was doing, but simply that West Virginia had spun out.
By 2004, Texas would have gained a seat, and Pennsylvania lost a seat, triggering an Australian redistribution. There were no changes in the projections, but Alabama was getting narrowly close to losing a seat.
By 2005, Florida would have gained a seat, and Illinois lost a seat, triggering redistribution. The projections changed significantly. Arizona was projected to gain a seat, as was Oregon. Mid-decade growth in Oregon is roughly twice that of the early decade. California was also projected to gain a seat, but just barely. Virginia had fallen below (it had grown at a 0.86% rate, but if it increased to 0.89% it could keep the gain. Alabama was again projected to lose a seat, and New York to barely lose a seat.
By 2016, Oregon would have gained a seat, and Michigan lost a seat. Florida was now projected to gain a second seat, while California no longer was.
For 2017, Colorado would have gained a seat, and Texas a second seat. We would be busy speculating on the 8-district map in Colorado and 38-district map in Texas for the 2008 election. Meanwhile, New York and West Virginia would have lost a district.
In Australia, if it is too late to draw a full map, the most populous district is split in half, or the least two populous adjacent districts merged.
The projections for 2020 have not changed. There would be speculative maps for Arizona+1, Florida+2, and Texas+3, as well as Alabama-1, Ohio-1, and Rhode Island -1 (no speculation needed here, except who will win the Democratic primary between two incumbents).
Title: Re: Census population estimates 2011-2019
Post by: Brittain33 on December 21, 2017, 08:35:35 AM
Interesting that a Puerto Rican in-migration can't move the needle further in Florida, but a hurricane-driven bust in Texas *could* cost the third seat if sizable enough.
Title: Re: Census population estimates 2011-2019
Post by: Gass3268 on December 21, 2017, 10:27:29 AM
Interesting that a Puerto Rican in-migration can't move the needle further in Florida, but a hurricane-driven bust in Texas *could* cost the third seat if sizable enough.
I believe these estimates are supposed to be from July, 2017. So they would not take into account the Hurricanes. Like Muon said, it will be interesting if the Puerto Rican hurricane diaspora's impact also on New York, along with Florida.
Title: Re: Census population estimates 2011-2019
Post by: Oryxslayer on December 21, 2017, 10:49:06 AM
I doubt the NY migration will have much of an effect, probably the greatest impacts will be forcing the lost seat to be upstate and perhaps giving Velazquez an actual HVAP seat. FL movement will probably lock down their second gain, and perhaps direct both seat towards the I-4, rather then one 1-4 and one Miami metro seat.
The Houston hurricane is perhaps the most interesting. While those with flood insurance were probably secure, a bunch of housing in the region is now covered in mold and other flood related issues. It wouldn't take much to push Texas below their third seat, giving it to Montana. The questions is, will the losses from Houston move the needle for one year enough to temporarily slow the rapid growth of the state,
The Houston hurricane is perhaps the most interesting. While those with flood insurance were probably secure, a bunch of housing in the region is now covered in mold and other flood related issues. It wouldn't take much to push Texas below their third seat, giving it to Montana. The questions is, will the losses from Houston move the needle for one year enough to temporarily slow the rapid growth of the state,
Title: Re: Census population estimates 2011-2019
Post by: Nyvin on December 21, 2017, 10:55:15 AM
Montana gaining a second seat really could be a good outcome for democrats, western Montana has some pretty liberal areas and is actually trending Democratic in some cases. If the state is split in two that seat just might become competitive.
Title: Re: Census population estimates 2011-2019
Post by: Brittain33 on December 21, 2017, 12:13:54 PM
Interesting that a Puerto Rican in-migration can't move the needle further in Florida, but a hurricane-driven bust in Texas *could* cost the third seat if sizable enough.
I believe these estimates are supposed to be from July, 2017. So they would not take into account the Hurricanes. Like Muon said, it will be interesting if the Puerto Rican hurricane diaspora's impact also on New York, along with Florida.
Yeah. Never mind, I misread Jim's spreadsheet as saying Florida needed 3m additional people to get a third seat, but obviously that can't be true.
Title: Re: Census population estimates 2011-2019
Post by: Strudelcutie4427 on December 21, 2017, 12:47:55 PM
Montana gaining a second seat really could be a good outcome for democrats, western Montana has some pretty liberal areas and is actually trending Democratic is cases. If the state is split in two that seat just might become competitive.
Drawing a hook from Missoula along the Canadian border and connecting it with East Montana would result in 2 roughly R+11 districts. It'd be interesting to see what they would do
Title: Re: Census population estimates 2011-2019
Post by: jimrtex on December 23, 2017, 07:00:26 AM
Montana gaining a second seat really could be a good outcome for democrats, western Montana has some pretty liberal areas and is actually trending Democratic is cases. If the state is split in two that seat just might become competitive.
Drawing a hook from Missoula along the Canadian border and connecting it with East Montana would result in 2 roughly R+11 districts. It'd be interesting to see what they would do
Montana has a redistricting commission. It drew two congressional districts in 1980. In the early 1990s when the loss of the 2nd seat was being litigated, the legislature ordered them to draw two districts. They apparently did so, but the final official report only had one district.
You could probably use the 1980 district boundaries, and then adjust them a bit each decade. Great Falls and Billings have probably had enough growth to keep the two districts pretty much in balance, and Silver Bow (Butte) has been in decline.
Maps of historical district boundaries (https://github.com/JeffreyBLewis/congressional-district-boundaries)
The numbers in the map names indicate the Congresses they were in effect. The First Congress began in 1789 (and under modern system would have been elected in 1788). The 51st Congress was elected in 1888, and the 101st in 1988.
Montana gained a second representative in 1912, but did not create two districts until 1918. Those districts were frozen until 'Reynolds v Sims' i.e. 66th (1918) through 89th (1964). It is quite possible that these districts were never equal population, since it appears that geography was more significant, following the Rockies.
90 through 92 (1966-1970) was the first equal-population map, and the boundary had to move eastward.
93 through 97 (1972-1980) and the line went further east, wrapping around Great Falls.
98 through 98 (1982) I'm not sure what changed or not changed. Perhaps there was litigation, and the districts had to made even more equal.
99 (1984) through 102 (1990) The boundary moved back west.
103 (1992) through 112 (2010) This is the single district map.
Perhaps there would have been a need for a larger change, and Gallatin (Bozeman) would put in the east, forcing the northern boundary back to the east around Great Falls.
In 1992, the Democratic and Republican representatives, and the Democrat (Pat Williams) won. Williams did not seek re-election in 1996, and the House seat has been Republican ever since.
With the two universities, the state capital, and Butte, the western district might be at least competitive for Democrats.
Historical Shapefiles (http://cdmaps.polisci.ucla.edu/)
The animation on the first page is pretty cool.
Title: Re: Census population estimates 2011-2019
Post by: jimrtex on December 23, 2017, 07:49:14 AM
Interesting that a Puerto Rican in-migration can't move the needle further in Florida, but a hurricane-driven bust in Texas *could* cost the third seat if sizable enough.
People who moved because their houses flooded, moved to Dallas and San Antonio and Austin, and did not leave the state. As long as oil holds at $60 there will be jobs in Houston. If you have a job and had flood insurance, you can live in an apartment or hotel, while your house is repaired or a new one is built. If you didn't have flood insurance, but have a job, you are still better off, than moving to where you don't have a job. And getting a job in San Francisco and renting a house in Stockton doesn't have a lot of appeal.
Title: Re: Census population estimates 2011-2019
Post by: jimrtex on December 23, 2017, 07:56:34 AM
The most annoying thing about the estimates is that they change prior year(s) estimates (which i understand), but don't give you an easy way to see those changes.
I think the changes are hard to visualize. If the 2016 and 2017 estimates are the same, but the 2017 estimate is that there was an increase, then the 2016 estimate was revised downward. But that wouldn't be because they had missed a block of people dying or moving, but they overestimated some changes. So the growth curve did not change, but was modified. Perhaps an animation might work.
Title: Re: Census population estimates 2011-2019
Post by: jimrtex on December 23, 2017, 12:45:57 PM
An alternate projection could use just the last two years of estimates to determine the rate of growth for the rest of the decade. That model gives an extra seat to MT at the expense of one from CA.
The last two decades there has been an inordinate number of states with fractions under 0.5, that got rounded upward. This benefited larger states, because they can spread their deficit among a large number of districts. So even though California had a bit over 52/435 of the population, they got a 53rd seat. But now the anomaly of states with fractions under 0.5 is disappearing, and though California will be closer to 53/435 of the population they could lose a district.
Title: Re: Census population estimates 2011-2019
Post by: politicallefty on December 24, 2017, 04:43:38 AM
I've been watching the census estimates throughout the decade and I've seen California move around a bit. To those that pay attention more closely, what are the odds or what will it take for the creation of CA-54?
Title: Re: Census population estimates 2011-2019
Post by: Minnesota Mike on December 24, 2017, 09:43:26 AM
I've been watching the census estimates throughout the decade and I've seen California move around a bit. To those that pay attention more closely, what are the odds or what will it take for the creation of CA-54?
Losing a seat is more likely than gaining one.
Title: Re: Census population estimates 2011-2019
Post by: jimrtex on December 30, 2017, 05:59:12 PM
I've been watching the census estimates throughout the decade and I've seen California move around a bit. To those that pay attention more closely, what are the odds or what will it take for the creation of CA-54?
The USA as whole will increase about 7.7% over the decade, and based on projecting the first seven years estimates forward for 10 years, California will grow at 8.5%. But the growth rate in California has dropped the past two years.
In the first five years of the decade, California increased by 345K. 347K, 328K, 354K, and 331K; but in the last two years has only increased by 264K and 240K.
California needed 2.857M increase just to tread water. If the increase for the first five years had been sustained, California would have gained 3.410M, and the surplus of 553K would have gone a long way towards populating another congressional district.
But if we project the growth from the first seven years, then California would only grow 3.156M and the surplus would only be 299K. But if we project the last year's growth over the final three years, California would only have a 2.929M increase and California would just be treading water.
The Census Bureau also estimates the components of change, births, deaths, international migration, and domestic migration. Births and deaths are easy to estimate since most are officially recorded. This is not true for migration. You don't have to tell anyone you are moving, and you might not even know that you are changing residence. You might take a summer vacation, decide you like the location, and find a job.
Births have declined slightly (4%) over the seven years. This might represent a decline in the fertility rate (rate at which women in child-bearing ages have children), or a decline in the number of women of child-bearing ages, or both.
Deaths have increased by about 15% seven years. This is mostly due to aging baby boomers. The oldest baby boomers have aged from 65 to 72 during the first seven years. About 2% of 72-YO die, while only 1% of 65-YO will die.
The combination of the two has meant a decrease in the natural increase (births minus deaths) of about 21%, from 271K to 214K.
International migration has held steady, and actually increased the past three years.
Domestic net migration has increased sharply the last three years. Between 2010 and 2015, 3.2 million Californians left the state, and 2.9 million people moved to the state, for a net outflow of 300K. A lot of these are the same people. It may be exciting to live near the beach, but if the reality is that you have to commute from Barstow or Bakersfield to Los Angeles, you are too tired to go surfing on weekends. Or if you are divorced, you might move back home.
To make a big change in the net, you only need small increases in the inflow and outflow. A 5% decrease in inflow, and 5% increase in outflow, doubles the net flow.
I really don't know the reasons for the change. It could be lower inflows from people who realize that a higher salary does not make California livable if you can't afford housing or face a supercommute. Or perhaps it is retirees, whose home equity has recovered enough since 2008 that they can sell and move to a location where their Social Security and pension will go further.
Western states of WA, OR, ID, NV, MT. UT, and AZ have had their highest domestic inflows in the past two years. It isn't quite true for Colorado, in part because Colorado has had robust inflow throughout the decade. There is also strong inflow along the South Atlantic coastal states from North Carolina to Florida. And there have been small upticks in places like MN, AR, TN, DE, NH, and ME. So there has been an increase in outflow to nearby states.
A more obscure effect is rounding. Imagine that you polled 1000 persons, and 434 said Good, 353 said Bad, and 213 said Otherwise.
So you write an article that says 43% Good, 35% Bad, 21% Otherwise (* percentages do not total 100 because of rounding)
Or perhaps the results were 436 Good, 357 Bad, and 207 Otherwise. This is reported as 44% Good, 36% Bad, and 21% Otherwise. In this case, the percentages add to 101.
It is not because the pollster in one case didn't interview enough people, and in the second case polled too many, it is the effect of rounding error. In other cases, the rounding errors cancel, and the percentages will add to 100 (434 Good, 358 Bad, 208 Otherwise, rounds to 43, 36, 21).
The same thing can happen with the apportionment of representatives, except there are 50 states and 435 representatives. It would be embarrassing for C-SPAN to have vote totals showing *Numbers do not total 435 due to rounding.
One might expect that if you represented each states representation as decimal fraction (e.g. 52.368) 25 of the fractions would be less than 0.500 and 25 would be greater than 0.500, While this is the statistical expectation*, it won't always be true. It is somewhat like flipping a coin 50 times. The most likely outcome is 25 heads and 25 tails, but it can be more or less. It is possible, though extremely improbable that all 50 fractions would be less than 0.5, or all 50 would be more than 0.5.
And even then the total of the fractions might not sum to 25. It is possible for example that the 25 fractions less than 0.5, average 0.4, and sum to 10, while the 25 fractions greater than 0.5 average 0.8 and sum to 20, giving a sum of fractions of 30. If the fractions sum to 30, we have to give an extra seat to 30 states, but only 25 would have fractions greater than 0.5 and "deserve" an extra seat. We would have to give the other five seats to the "least undeserving".
It happens that when "extra" seats are given out, that larger states like California are favored.
On the other hand, it is also possible that the total of the fractions is less than 25, even when there are 25 states with a fraction greater than 0.5. In that case, we don't have enough extra seats to hand out. When this occurs, larger states like California are disfavored.
As it turns out in 2000 and 2010, there were more extra seats to be handed out than there were states clearly deserving them. One of those was California, which received a 53rd seat when it was still closer to 52 than 53. In the earlier part of this decade, California was approaching actually having 53/435 of the population, but with the recent uptick in domestic outflow, could drop back closer to 52.5 or 52.6. And the distribution of fractions appears to be trending back towards the ordinary, and it might be that California could be apportioned 52 seats, even while its population share increased.
*Not exactly, but within a quibble.
Title: Re: Census population estimates 2011-2019
Post by: jimrtex on December 31, 2017, 05:08:36 PM
This is a closer look at the states of interest.
State 2010 2020 10-20 20 Ch. Need Act Rate Need
Alabama 6.737 6.431 -0.307 6 -1 54 132 0.27% 0.67%
Arizona 8.999 9.502 0.503 10 +1 -60 877 1.29% 0.99%
California 52.369 52.791 0.422 53 = -547 3185 0.82% 0.33%
Colorado 7.087 7.644 0.557 8 +1 -157 814 1.51% 0.51%
Florida 26.435 28.562 2.127 29 +2 -223 3074 1.53% 1.15%
Georgia 13.627 14.010 0.383 14 = 378 1038 1.02% 2.30%
Illinois 18.043 16.705 -1.337 17 -1 -259 -39 -0.03% -0.77%
Michigan 13.902 13.054 -0.848 13 -1 344 109 0.11% 1.35%
Minnesota 7.472 7.436 -0.036 7 -1 50 380 0.69% 1.01%
Montana 1.478 1.489 0.011 1 = 9 85 0.83% 1.13%
New York 27.244 26.154 -1.090 26 -1 269 653 0.33% 0.82%
North Carolina 13.413 13.805 0.392 14 +1 -317 1033 1.03% -0.08%
Ohio 16.224 15.288 -0.936 15 -1 164 169 0.15% 0.65%
Oregon 5.408 5.593 0.185 6 +1 -105 436 1.08% 0.17%
Pennsylvania 17.862 16.775 -1.087 17 -1 -313 143 0.11% -0.78%
Rhode Island 1.562 1.474 -0.088 1 -1 21 10 0.09% 0.81%
Texas 35.350 38.649 3.299 39 +3 -351 4459 1.65% 1.21%
Virginia 11.258 11.309 0.051 11 = 148 654 0.79% 1.41%
West Virginia 2.652 2.405 -0.247 2 -1 75 -51 -0.28% 1.21%
Alabama has only added 89K the first seven years, and is projected to add 43K more, but they would need another 54K beyond that to keep the seventh seat, which would require a better than doubling of the growth rate. It is not going to happen.
Arizona appears to be on the edge, but it really isn't. If an annual growth rate of 1.29% decreased to 0.99%, it could miss out. But the growth rate has been increasing, and was 1.56% last year.
Growth in California has dropped off significantly in the last few years. The projection is now whether California will keep its 53rd seat (it will), not whether it will gain a 54th.
Growth in Colorado has been steady to increasing a bit. To miss out on the 8th seat would mean a total collapse in the growth rate from 1.51 to 0.51%.
Florida has increased its growth rate so that is now pretty solid for a second seat. To miss out, it would have to drop down to 1.15% per year. Last year it was at 1.59%. But Florida is a long way from adding a 3rd seat.
Georgia is matching North Carolina, but it got its 14th seat in 2010 while North Carolina missed out.
Illinois is losing population, but only slightly. To lose a second seat would require a mass exodus. Since Illinois is losing at more than one district per decade (1.337) it would be a prime candidate to lose two districts next decade.
For Michigan to keep its 14th seat would require going from tepid growth to people pouring in.
Minnesota continues to drift away from keeping its 8th seat. Minnesota is projected to gain 7.2% this decade, but the country as a whole is gaining 7.7%. Minnesota has averages a gain of 0.69% this decade. Last year was a good year at 0.93%, but this is still short of the 1.01% it will need to catch up. The states that Minnesota is chasing are Arizona and Florida, and they are unlikely to make it easy.
Montana is expected to add 85K this decade, but need 9K extra. When you are a small as Montana, 9K represents an extra year's growth. Montana did gain 1.14% this year, which is a bit better than what is needed. For the decade, Montana is growing 0.9% faster than the country for the decade. At that rate it takes decades if not centuries to gain a seat. Montana may also suffer a bit from lowered activity in the Williston Basin.
The growth rate for New York has sharply dropped during this decade. While the compounded rate for the decade is calculated at 0.33%, the estimate for 2016 to 2017 was 0.07%. While some of this decline may be attributed to Puerto Ricans retiring to the island, there must be many other factors at work, including the decline of people moving into cities. Puerto Ricans returning to the mainland will want to live with relatives. Some who had moved back to Puerto Rico may have done so because their children had moved elsewhere.
North Carolina had barely missed out on its 14th seat and may have already had received it by the time of the July 2010 estimate base.
Ohio is only projected to grow at 1.5% for the decade, enough to cause it to lose a full seat.
Oregon was dawdling along just below the level needed for a sixth seat until 2013, when net domestic inflow increased dramatically to give it a boost. This must be tied to more people moving north from California, and the number moving south remaining steady or declining.
Pennsylvania will only gain 1.1% for the decade, and will lose a seat.
Rhode Island is only gaining 0.9% for the decade, and will be passed by Montana. Rhode Island is more certain of losing its seat, than Montana gaining one (at least one of these must happen).
Texas is on pace to gain three seats. A 17.7% over the decade, which is 10% faster than the national rate, results in a 10% increase in representation (10% of 36 is 3.6). The only reason that Texas is not gaining a fourth seat is that it got a favorable rounding in 2013. Unemployment is at 3.8%, job growth in percentage term was 2nd in the country, and oil prices are at the highest level since 2014.
Virginia was somewhat close to gaining a seat in the early part of the decade, but since then domestic migration has reversed to an outflow. An 8.2% increase is just slightly ahead of the US rate.
West Virginia is one of three states losing population (Illinois and Vermont are the others), and will lose 2.8% of its population. West Virginia is the only state with a natural population decrease (more deaths than births), a result of an aging population, and potential parents leaving the state, or holding off having babies in uncertain times.
Title: Re: Census population estimates 2011-2019
Post by: politicallefty on January 01, 2018, 08:24:28 AM
In general terms, California would have to increase from 53/435 of the total population to 54/435 of the population. This means that California would have to increase at 54/53 - 1 or 1.89% faster than the country as a whole. But California is such a large share of the population (almost 1/8), that an 8% increase in California would produce a 1% increase in the total population, even if all the other states were static.
The USA as whole will increase about 7.7% over the decade, and based on projecting the first seven years estimates forward for 10 years, California will grow at 8.5%. But the growth rate in California has dropped the past two years.
In the first five years of the decade, California increased by 345K. 347K, 328K, 354K, and 331K; but in the last two years has only increased by 264K and 240K.
California needed 2.857M increase just to tread water. If the increase for the first five years had been sustained, California would have gained 3.410M, and the surplus of 553K would have gone a long way towards populating another congressional district.
I appreciate your answer. I did read it all. The reason I asked is because I recall looking at Census estimates maybe 2 years ago and it seemed like California was on track for a 54th seat and now suddenly it could actually lose a seat. I realize that bigger states are more prone to the potential of gaining or losing a certain number of seats (i.e. muon noting that CA-53 would be seat 433 and CA-54 would be seat 440).
Do you have or know of a spreadsheet where one could input population numbers to determine the overall seat apportionment?
One thing I do wonder about is if certain states might make their own efforts to ensure the accuracy of the overall count.
Title: Re: Census population estimates 2011-2019
Post by: President Punxsutawney Phil on January 01, 2018, 08:42:53 AM
So it's quite likely both MT and RI have just 1 CD?
Title: Re: Census population estimates 2011-2019
Post by: Oryxslayer on January 01, 2018, 12:39:12 PM
This is a closer look at the states of interest.
Excellent analysis as always, the only comment I would make is on NY. You actually already did a congressional district evaluation a while ago, and we found that ot was the Upstate CDs dropping pop like a stone. I recall the downstate Cds were a wash (some overpopulated, others underpopulated) whereas the upstate CDs were all between .98 and .92 of a CD in their respective year. It rather is not Puerto Ricans moving, but rather the usual Rust Velt decline we see across the great lakes area.
So it's quite likely both MT and RI have just 1 CD?
What MT is wishing for is radical change from the Hurricanes. Present growth rates are, as jimrtex has shown, are pretty much locked in. TX will probably experience a small slowdown next year as marginal number of families leave the Gulf Coast for other states (The majority stayed in the state), and as the construction market in the region freezes building new homes to repair and clean up the old damaged ones. Probably won't cause a significant downturn, but might be enough - and MT hopes, that they miss CD #3.
The east coast will also go through a shakeup as Puerto Ricans move to the mainland. The majority will no doubt head to NY and FL, locking in CD #2 fr the Sunshine state, and ensuring the cut CD in NY is upstate - probably NY 22 due to its central location. Some however will hed to areas with Puerto Rican communities like Reading PA.
Title: Re: Census population estimates 2011-2019
Post by: Minnesota Mike on January 01, 2018, 12:44:43 PM
So it's quite likely both MT and RI have just 1 CD?
RI will almost certainly lose a seat but MT will be right on the threshold of gaining a seat. Right now the projection using short term trends has them gaining a seat, the projection using long term trends has them staying at one seat (FWIW I prefer using short term trends).
BTW Congress uses a different method of apportioning seats ( the HuntingtonHill method) than jimrtex does (The Vinton or Hamilton method) that can produce slightly different results.
https://en.wikipedia.org/wiki/United_States_congressional_apportionment
Title: Re: Census population estimates 2011-2019
Post by: jimrtex on January 02, 2018, 11:40:41 AM
So it's quite likely both MT and RI have just 1 CD?
RI will almost certainly lose a seat but MT will be right on the threshold of gaining a seat. Right now the projection using short term trends has them gaining a seat, the projection using long term trends has them staying at one seat (FWIW I prefer using short term trends).
BTW Congress uses a different method of apportioning seats ( the HuntingtonHill method) than jimrtex does (The Vinton or Hamilton method) that can produce slightly different results.
https://en.wikipedia.org/wiki/United_States_congressional_apportionment
The divisor methods don't nominally use a quota. We just divide state populations by the successive divisors and rank the quotients.
The divisors for Huntington-Hill are:
sqrt(n*(n+1) = 1.414, 2.449, 3.464, ... 52.498, ...
In 2010, California had a population 37,254,518 (disregarding the overseas population).
For California's 53 seat, we divide the state population by sqrt(52*53) = 52.498
37254518 / 52.498 = 709642.051
If 709642.051 is among the 435 largest quotients then California gets a 53rd seat which it did. But we notice that the quotients near the 435th seat are about equal to the quota for the USA population divided by 435 = 708,408. But for reasons, I'll explain later, I'll divide by 711,428 (Q' adjusted quota).
We divide every state's population by 711,428.
q' = P / Q'
P'(California) = 52.366
We can then divide by the divisors, so 52.366 / 52.498 = 0.997. Values close to one represent states just below or above the 435th seat. We still have to rank these values, to determine which are rounded up or not. If we were doing independent rounding, we could simply look at the value, and since it is less than 1, round down. But if we did independent rounding, we could not guarantee 435 representatives.
Dividing by a positive constant does not change the relationship for ranking purposes:
if a > b and c > 0 then a/c > b/c
For Webster's method, a state with population p is entitled to r representatives, where
Q = PUSA/N, where PUSA is the total population of the 50 states, and N is the number of representatives (435 in this case).
p/Q = r
We can look at the value of R, and say that a state should have r representatives, but that is only true if we are apportioning fractional representatives. But it nonetheless correct for the raw share of the population. If a state has 27.235 / 435 of the population, it should have 27.235 representatives, except for the silly notion that representatives must be whole persons.
For Huntington-Hill
p/Q = sqrt((r-1/2)*(r+1/2))
To simplify our expression, we will use q = p/Q where q is a quotient.
q = sqrt(r-1/2)*(r+1/2))
Squaring both sides and multiplying the two terms under the radical.
q2 = r2 - 1/4
Solving for r,
r = sqrt(q2 +1/4)
This is the raw entitlement under Huntington-Hill. For example, a state with sqrt(2)/435 of the total population is entitled to 1.5 representatives. 1.5 = sqrt(2 + 1/4)
But if we do this for all states, and sum them up, we will end up with 436.841 representatives. But we can adjust our quota, so that it is Q' = PUSA/(435*(435/436.841). This will yield 435.015 representatives. Adjusting to 435/436.856 produces the expected 435 representatives.
So the "raw" numbers
r = sqrt(q'2 +1/4)
Where q' = p/Q'
And Q' is the adjusted quota.
For 2010, it is 711,428. The adjusted quota is dependent on the overall distribution of populations, but it can be calculated easily and converges quite quickly. The adjustment is increasing slightly
436.856/435 for 2010
436.873/435 for 2017 estimate.
436.881/435 for 2020 projected.
This increase indicates a greater small state bias. Not unexpected considering that the 2nd and 3rd most populous states are fast gainers, and the most populous state is an average gainer.
Among states with 3 or fewer representatives:
AK, SD, WY, VT, HI, RI, NH, ME, NM, NE, and WV are losing population share.
MT is staying even
DE, ID, ND* are gaining population share, but ND is quite iffy, and DE is moderate.
While the difference is 0.43%, the cost to California is 0.43% * 52.5 = 0.23 representatives.
Anyhow, the raw numbers provide an estimate of how many representatives a state should have if independent rounding were done and the distribution is based on Huntington-Hill. It is particularly useful for seeing temporal trends (e.g New Jersey is losing about 1/2 a representative per decade).
I do use it as an estimate of the number of seats a state should have. If a state is entitled to n.xxx representatives (as represented by a mixed decimal fraction), then it should have either n or n+1 (with a minimum of one). Summing the values of n, I can calculate the number of guaranteed seats without rounding. For 2020 projections this is 412 seats, leaving 23 seats (435-412) to be apportioned by rounding. I then divide the projected population of each state by the divisor for the next seat; sqrt(n*(n+1)) and assign the 23 final seats based on the largest quotients. This does not determine the 413th-435th seats assigned, but rather that a state will be in the top 435.
Note that the divisor methods do not not guarantee an apportionment of between n and n+1 seats. It may be outside that range, for example n-1 or n+2. This is known as a quota violation, and is a known flaw of Huntington-Hill and other divisor methods. This requires an unusual (rare) distribution of fractions, and modeling for the US indicates that it will be quite rare for the USA, because of the large number (50) of entities getting seats.
It may be quite common when there are only a few entities, and one is relatively quite large. An example is the British House of Commons, where there are only four apportionment entities (England, Scotland, Wales, and Northern Ireland), and England has 80%+ of the population.
Title: Re: Census population estimates 2011-2019
Post by: jimrtex on January 02, 2018, 11:50:38 AM
Interesting that a Puerto Rican in-migration can't move the needle further in Florida, but a hurricane-driven bust in Texas *could* cost the third seat if sizable enough.
I believe these estimates are supposed to be from July, 2017. So they would not take into account the Hurricanes. Like Muon said, it will be interesting if the Puerto Rican hurricane diaspora's impact also on New York, along with Florida.
Interstate migration estimates for 2016 show that a very large share of Puerto Rican migration flow is to Florida (40%). Texas was second, slightly ahead of New York and Pennsylvania.
Florida is solidly gaining its 2nd seat, up from early in the decade when it was projected to only gain one. But it is a long way off from a third seat.
Title: Re: Census population estimates 2011-2019
Post by: Minnesota Mike on January 02, 2018, 12:44:24 PM
So it's quite likely both MT and RI have just 1 CD?
RI will almost certainly lose a seat but MT will be right on the threshold of gaining a seat. Right now the projection using short term trends has them gaining a seat, the projection using long term trends has them staying at one seat (FWIW I prefer using short term trends).
BTW Congress uses a different method of apportioning seats ( the HuntingtonHill method) than jimrtex does (The Vinton or Hamilton method) that can produce slightly different results.
https://en.wikipedia.org/wiki/United_States_congressional_apportionment
The divisor methods don't nominally use a quota. We just divide state populations by the successive divisors and rank the quotients.
The divisors for Huntington-Hill are:
sqrt(n*(n+1) = 1.414, 2.449, 3.464, ... 52.498, ...
In 2010, California had a population 37,254,518 (disregarding the overseas population).
For California's 53 seat, we divide the state population by sqrt(52*53) = 52.498
37254518 / 52.498 = 709642.051
If 709642.051 is among the 435 largest quotients then California gets a 53rd seat which it did. But we notice that the quotients near the 435th seat are about equal to the quota for the USA population divided by 435 = 708,408. But for reasons, I'll explain later, I'll divide by 711,428 (Q' adjusted quota).
We divide every state's population by 711,428.
q' = P / Q'
P'(California) = 52.366
We can then divide by the divisors, so 52.366 / 52.498 = 0.997. Values close to one represent states just below or above the 435th seat. We still have to rank these values, to determine which are rounded up or not. If we were doing independent rounding, we could simply look at the value, and since it is less than 1, round down. But if we did independent rounding, we could not guarantee 435 representatives.
Dividing by a positive constant does not change the relationship for ranking purposes:
if a > b and c > 0 then a/c > b/c
For Webster's method, a state with population p is entitled to r representatives, where
Q = PUSA/N, where PUSA is the total population of the 50 states, and N is the number of representatives (435 in this case).
p/Q = r
We can look at the value of R, and say that a state should have r representatives, but that is only true if we are apportioning fractional representatives. But it nonetheless correct for the raw share of the population. If a state has 27.235 / 435 of the population, it should have 27.235 representatives, except for the silly notion that representatives must be whole persons.
For Huntington-Hill
p/Q = sqrt((r-1/2)*(r+1/2))
To simplify our expression, we will use q = p/Q where q is a quotient.
q = sqrt(r-1/2)*(r+1/2))
Squaring both sides and multiplying the two terms under the radical.
q2 = r2 - 1/4
Solving for r,
r = sqrt(q2 +1/4)
This is the raw entitlement under Huntington-Hill. For example, a state with sqrt(2)/435 of the total population is entitled to 1.5 representatives. 1.5 = sqrt(2 + 1/4)
But if we do this for all states, and sum them up, we will end up with 436.841 representatives. But we can adjust our quota, so that it is Q' = PUSA/(435*(435/436.841). This will yield 435.015 representatives. Adjusting to 435/436.856 produces the expected 435 representatives.
So the "raw" numbers
r = sqrt(q'2 +1/4)
Where q' = p/Q'
And Q' is the adjusted quota.
For 2010, it is 711,428. The adjusted quota is dependent on the overall distribution of populations, but it can be calculated easily and converges quite quickly. The adjustment is increasing slightly
436.856/435 for 2010
436.873/435 for 2017 estimate.
436.881/435 for 2020 projected.
This increase indicates a greater small state bias. Not unexpected considering that the 2nd and 3rd most populous states are fast gainers, and the most populous state is an average gainer.
Among states with 3 or fewer representatives:
AK, SD, WY, VT, HI, RI, NH, ME, NM, NE, and WV are losing population share.
MT is staying even
DE, ID, ND* are gaining population share, but ND is quite iffy, and DE is moderate.
While the difference is 0.43%, the cost to California is 0.43% * 52.5 = 0.23 representatives.
Anyhow, the raw numbers provide an estimate of how many representatives a state should have if independent rounding were done and the distribution is based on Huntington-Hill. It is particularly useful for seeing temporal trends (e.g New Jersey is losing about 1/2 a representative per decade).
I do use it as an estimate of the number of seats a state should have. If a state is entitled to n.xxx representatives (as represented by a mixed decimal fraction), then it should have either n or n+1 (with a minimum of one). Summing the values of n, I can calculate the number of guaranteed seats without rounding. For 2020 projections this is 412 seats, leaving 23 seats (435-412) to be apportioned by rounding. I then divide the projected population of each state by the divisor for the next seat; sqrt(n*(n+1)) and assign the 23 final seats based on the largest quotients. This does not determine the 413th-435th seats assigned, but rather that a state will be in the top 435.
Note that the divisor methods do not not guarantee an apportionment of between n and n+1 seats. It may be outside that range, for example n-1 or n+2. This is known as a quota violation, and is a known flaw of Huntington-Hill and other divisor methods. This requires an unusual (rare) distribution of fractions, and modeling for the US indicates that it will be quite rare for the USA, because of the large number (50) of entities getting seats.
It may be quite common when there are only a few entities, and one is relatively quite large. An example is the British House of Commons, where there are only four apportionment entities (England, Scotland, Wales, and Northern Ireland), and England has 80%+ of the population.
Got it.
Title: Re: Census population estimates 2011-2019
Post by: jimrtex on January 02, 2018, 08:41:15 PM
In general terms, California would have to increase from 53/435 of the total population to 54/435 of the population. This means that California would have to increase at 54/53 - 1 or 1.89% faster than the country as a whole. But California is such a large share of the population (almost 1/8), that an 8% increase in California would produce a 1% increase in the total population, even if all the other states were static.
The USA as whole will increase about 7.7% over the decade, and based on projecting the first seven years estimates forward for 10 years, California will grow at 8.5%. But the growth rate in California has dropped the past two years.
In the first five years of the decade, California increased by 345K. 347K, 328K, 354K, and 331K; but in the last two years has only increased by 264K and 240K.
California needed 2.857M increase just to tread water. If the increase for the first five years had been sustained, California would have gained 3.410M, and the surplus of 553K would have gone a long way towards populating another congressional district.
The USA as whole will increase about 7.7% over the decade, and based on projecting the first seven years estimates forward for 10 years, California will grow at 8.5%. But the growth rate in California has dropped the past two years.
In the first five years of the decade, California increased by 345K. 347K, 328K, 354K, and 331K; but in the last two years has only increased by 264K and 240K.
California needed 2.857M increase just to tread water. If the increase for the first five years had been sustained, California would have gained 3.410M, and the surplus of 553K would have gone a long way towards populating another congressional district.
I appreciate your answer. I did read it all. The reason I asked is because I recall looking at Census estimates maybe 2 years ago and it seemed like California was on track for a 54th seat and now suddenly it could actually lose a seat. I realize that bigger states are more prone to the potential of gaining or losing a certain number of seats (i.e. muon noting that CA-53 would be seat 433 and CA-54 would be seat 440).
Do you have or know of a spreadsheet where one could input population numbers to determine the overall seat apportionment?
One thing I do wonder about is if certain states might make their own efforts to ensure the accuracy of the overall count.
Year Estimate Projection
2010 52.594 52.781
2011 52.689 53.389
2012 52.778 53.426
2013 52.858 53.416
2014 52.947 53.431
2015 52.999 53.370
2016 52.968 53.195
2017 52.914 53.037
2018 52.860 52.918
2019 52.752 52.766
2020 52.590 52.590
In July 2010, California was estimated to have 52.594/435 of the US population. This was up from the 52.589 from the Census. Projected forward for the remainder of the decade this would be projected to reach 52.781 in 2020 (the first estimate was only for one quarter). Through about 2014, the increase in share was about 0.090/435 per year, or about 0.900/435 per decade, enough to likely gain the 54th seat, or put it in the realm of possibility.
The population share increase in 2015 declined to 0.052 in 2016, and the projected 2020 population declined. In 2016 and 2017, California's population share declined. It was growing slightly slower than the country as whole (0.1%). But the projected share for 2020 was greater than the estimate for 2017 which could only happen if the short term trend reversed itself.
Imagine you are on a roller coaster. You are going up the first rise, and have risen 400 feet in four seconds. You project that after 10 seconds you will rise 1000 feet.
You are entering the crest of the rise, and are at 450 feet after five seconds. You quickly calculate 450/5 * 10 = 900 feet after 10 seconds (you can't reach your smartphone and people are screaming, so you don't realize your assumption that the increase is constant and not slowing is wrong).
After you have begun to drop you are at 350 feet after seven seconds, and calculate 350/7 * 10 equals 500 feet after 10 seconds. You don't realize that you are projecting an increase because the projection is decreasing.
That is what is happening in California.
The projected estimates for 2018, 2019, and 2020 assume that the 2016-2017 decline will be repeated, which would get you back to the share in 2010 (i.e. California grew slightly faster than the USA in the first half of the decade, and slightly slower in the second half).
This might not be accurate. The growth rate began to decline in 2015, turned negative in 2016, and became even stronger in 2017. The net domestic outflow which is triggering the decline in share appears to be accelerating.
California had a massive influx of population after WWII, caused by people moving west (and exposure to more of the country during the war). Good economic times, and pent-up demand caused the baby boom. The boomers are now reaching retirement age. Social security is portable, and California has extreme housing costs. If you own a home, now is a good time to cash out (tax free) and move to Arizona/Nevada/Utah/Idaho.
It may also be too expensive for middle or low income persons to live in California. If you live in Kansas and are making $10/hour at Walmart, moving to California and making $15/hour is not an upgrade.
It is also possible that there is chain migration of aliens from California to other states. Many immigrants first move to live with relatives, even if they are somewhat distant. If you don't speak English, living with a second cousin-once removed-in-law, will provide support. If all your relatives live in California, you will locate in California. But over time, people may find jobs elsewhere, and with a bit of English, you might be able to find work in Phoenix or Las Vegas or Salt Lake, and recognize a small community that speaks your native language.
Also, the question that the Census Bureau asks is whether a person had a different residence one year ago. This is not the same as a citizenship question. Someone stationed in Germany with their family who is transferred to the United States, will be living in a new residence, and show up as an international transfer.
In 2016 top domestic interstate inflows were:
Florida 605K
Texas 532K
California 515K
North Carolina 331K
Georgia 305K
Arizona 273K
Virginia 264K
New York 261K
Washington 257K
Pennsylvania 252K
Colorado 223K
Illinois 204K
In 2016 domestic interstate outflows were:
California 658K
New York 450K
Texas 444K
Florida 433K
Illinois 346K
Virginia 275K
Georgia 258K
Pennsylvania 257K
North Carolina 256K
New Jersey 227K
Ohio 212K
Once migration is established it may become two-way. People move to a different state, get homesick, divorced, lose a job, and move home. A couple retires to Florida, after the husband dies, and the widow breaks her hip, she moves back to New York to live with her daughter (23 years later).
In 2016, California had 1173K domestic migrants (in and out), but only 143K net outflow. Small changes in inflow or outflow can have big changes in the net.
If we look at the ratio of inflow to outflow in 2016:
Arizona 1.42
Florida 1.40
Washington 1.34
Nevada 1.33
Oregon 1.30
North Carolina 1.29
South Carolina 1.29
Idaho 1.28
Utah 1.25
Alabama 1.22
Texas 1.20
Montana 1.20
New York 0.58
Illinois 0.59
New Jersey 0.64
Connecticut 0.67
Alaska 0.74
California 0.78
North Dakota 0.79
So California had 4 persons moving in, for every 5 moving out.
Title: Re: Census population estimates 2011-2019
Post by: Brittain33 on January 02, 2018, 09:07:36 PM
Alabama has inflow?!
Title: Re: Census population estimates 2011-2019
Post by: jimrtex on January 03, 2018, 02:00:59 AM
Do you have or know of a spreadsheet where one could input population numbers to determine the overall seat apportionment?
Column A(2:51): State Names
Column B(2:51): Populations (leave out DC and PR, unless you want to experiment)
A52: Cell with number of representatives, set to 435, but you can vary.
B52: Quota =SUM(B2:B51)/A52
Column C(2:51): Estimate. =B2/$B$52, etc.
Column D(2:51): Minimum number of seats. =MAX(INT(C2),1), etc, ensures all states get one representative, and avoids division by zero.
D52: Minimum seats = SUM(D2:D51)
Column E(2:51): Divisor for next seat:
Huntington-Hill: =SQRT(D2*(D2+1)), etc. (Geometric mean of n and n+1)
Webster's = D2 + 0.5 (Arithmetic mean of n and n+1)
Dean's = D2*(D2+1)*2/(D2+D2+1) (Harmonic mean)
Jefferson's = D2+1
Adams's = D2
Webster's is same as St.Lague, Jefferson's the same ad D'Hondt
Column F(2:F51): Quotient = B2/E2, etc. May also use C2/E2, etc.
Column G(2:G51): Quotient Rank = RANK(F2,F$2:F$51), etc.
G52 extra seats to apportion A52-D52
Column H(2:H51):= D2 + IF(G2 <= $G$52, 1, 0), etc. add one for largest quotients.
H52 total apportionment = SUM(H2:H51), should match A52
Title: Re: Census population estimates 2011-2019
Post by: jimrtex on January 03, 2018, 12:13:02 PM
Alabama has inflow?!
The population estimates include estimates of components of change (births, deaths, domestic net migration, international net migration).
Some years this was positive, others negative. Over 7 years, the net was 1153 persons. 2017 had the biggest inflow, but only 3K.
The other number is from the 2016 ACS, and estimates the state-to--state flows. The margin-of-error is quite large 122,220 +/- 9,811 into Alabama, 99,892 +/- 7,271 out of Alabama (90% confidence levels). If you take the smallest differentials 112,409 to 107,163 is a ratio of 105%.
For previous years the ratio would have been 1.13, 0.96, 1.07, 0.96, 1.09. 1.10, which are pretty consistent with not much flow.
Based on the 5-year ACS, the 122K is an outlier (or alternatively, the other 4 years were on the low side. 105, 104, 108, 114, 122 could represent an upward trend, an exaggerated upward trend, or an outlier in the 5th year.
The Census Bureau reports a lot more data about inward flows, since the question asked is whether the person lived in a different residence 1-year ago, and if not where you lived. This gets reported as: same house, same county, same state, not in the US.
Some counties with high interstate movers as percentage of population are Dale and Russell, which are likely tied to Fort Rucker and Fort Benning. Russell will get "interstate" movers who simply crossed the state line from Columbus.
Others include Lee and Tuscaloosa. The Census Bureau considers college students living in dorms to be residing at that location, and the same would be true for students living off campus. Freshmen would report that they had moved in the last year. Upper-classmen might, depending on how they interpreted the question. There may be procedural differences as well. Group quarters at college campuses are only surveyed in January-April, and September-December. The Census Bureau really has no way of knowing whether an apartment is occupied by a seasonal student, or a permanent resident.
There may be biases introduced. If a student does not complete college, they are somewhat likely to return to their hometown. If they are living at their parent's home, Mom when she fills out the census form may not remember that Johnny was "residing" at Auburn 12 months previously.
And the skipping of the summer months may have a bias. Let's say those who would have been surveyed in July were shifted to September/October; August to November/December; May to January/February; and June to March/April. Those who would have been surveyed in July and August, will be surveyed after they have arrived on campus. Those who would have left by May and June, will be surveyed before they have left.
This sort of shifting would also happen for Alabamians who go out of state, but the student flow might be towards Alabama. Where a parent attended school may influence the choice of school for their children. If you graduated from Auburn and lived in Atlanta, you might be willing to pay out-of-state tuition to Auburn, particularly if you viewed Athens as too liberal, and if your child wanted to go to Clemson, you might not only refuse to pay their tuition, you would probably disinherit them. There are likely more Alabama and Auburn graduates in Atlanta, than UGA grads in Birmingham.
Other counties with high domestic inflows are Lauderdale, on the state boundary, and probably with more jobs than adjacent areas of Tennessee or Mississippi; Madison, where Huntsville will actually attract college-educated persons; and Baldwin, next to Pensacola, and actually has a coastline, which would be attractive to retirees. Far southern Alabama may be attractive to retirees who want a warm climate with low housing costs.
If you take the states north from Virginia, Kentucky, Missouri, and Kansas, only ME, NH, DE, SD, and ND had domestic inflows cumulative over the the estimate period. Of the remaining states in the southeast and west, only MS, LA, NM, WY, AK, and HI had domestic outflows. Alabama barely makes it into the positive side because it is in the southeast, and better off than Mississippi and Louisiana.
Title: Re: Census population estimates 2011-2019
Post by: Kevinstat on January 04, 2018, 07:58:45 PM
Do you have or know of a spreadsheet where one could input population numbers to determine the overall seat apportionment?
Column A(2:51): State Names
Column B(2:51): Populations (leave out DC and PR, unless you want to experiment)
A52: Cell with number of representatives, set to 435, but you can vary.
B52: Quota =SUM(B2:B51)/A52
Column C(2:51): Estimate. =B2/$B$52, etc.
Column D(2:51): Minimum number of seats. =MAX(INT(C2),1), etc, ensures all states get one representative, and avoids division by zero.
D52: Minimum seats = SUM(D2:D51)
Column E(2:51): Divisor for next seat:
Huntington-Hill: =SQRT(D2*(D2+1)), etc. (Geometric mean of n and n+1)
Webster's = D2 + 0.5 (Arithmetic mean of n and n+1)
Dean's = D2*(D2+1)*2/(D2+D2+1) (Harmonic mean)
Jefferson's = D2+1
Adams's = D2
Webster's is same as St.Lague, Jefferson's the same ad D'Hondt
Column F(2:F51): Quotient = B2/E2, etc. May also use C2/E2, etc.
Column G(2:G51): Quotient Rank = RANK(F2,F$2:F$51), etc.
G52 extra seats to apportion A52-D52
Column H(2:H51):= D2 + IF(G2 <= $G$52, 1, 0), etc. add one for largest quotients.
H52 total apportionment = SUM(H2:H51), should match A52
Title: Re: Census population estimates 2011-2019
Post by: jimrtex on January 05, 2018, 06:46:25 AM
Do you have or know of a spreadsheet where one could input population numbers to determine the overall seat apportionment?
Column A(2:51): State Names
Column B(2:51): Populations (leave out DC and PR, unless you want to experiment)
A52: Cell with number of representatives, set to 435, but you can vary.
B52: Quota =SUM(B2:B51)/A52
Column C(2:51): Estimate. =B2/$B$52, etc.
Column D(2:51): Minimum number of seats. =MAX(INT(C2),1), etc, ensures all states get one representative, and avoids division by zero.
D52: Minimum seats = SUM(D2:D51)
Column E(2:51): Divisor for next seat:
Huntington-Hill: =SQRT(D2*(D2+1)), etc. (Geometric mean of n and n+1)
Webster's = D2 + 0.5 (Arithmetic mean of n and n+1)
Dean's = D2*(D2+1)*2/(D2+D2+1) (Harmonic mean)
Jefferson's = D2+1
Adams's = D2
Webster's is same as St.Lague, Jefferson's the same ad D'Hondt
Column F(2:F51): Quotient = B2/E2, etc. May also use C2/E2, etc.
Column G(2:G51): Quotient Rank = RANK(F2,F$2:F$51), etc.
G52 extra seats to apportion A52-D52
Column H(2:H51):= D2 + IF(G2 <= $G$52, 1, 0), etc. add one for largest quotients.
H52 total apportionment = SUM(H2:H51), should match A52
I forgot a caveat and a limitation.
The short cut I used assumes there will not be quota violations, where a state would not be apportioned either n or n+1 districts when:
n/435 <= Pstate / PUSA < (n+1)/435
This is estimated to be about a 1/1600 occurrence for the USA (the probability is based on the distribution of state populations, that is effectively random, and can only be simulated). For other uses, such as the apportionment of the British Parliament it is quite likely.
While the shortcut could be regarded as a defect in my implementation, the fact that a quota violation could occur, should be considered a defect of the divisor methods.
The limitation of my method is that it does not identify all the seats near the 435th seat. California should be apportioned roughly every 8th seat. While its quotients will be quite regular and periodic, other states will have different periods, so the rankings will not be periodic. My method will identify the ranking for California's 53rd seat, but not its 54th or 52nd, etc. And some of the rankings of other states will be in error because of this (but not, barring quota violations, whether or not they will be apportioned a particular number of seats).
To generate a full ranking with a spreadsheet requires more of a brute force approach. For example, one could generate, say the first 63 divisors, and calculate the quotients for all 50 states for each divisor. This would produce the top 500 or so rankings.
500/435 * 53 = 60.92 is an estimate of California's representation in a 500 member House. 63 is a fudge of 60.92, to make sure that California's rankings in the top 500 are generated. This method would also produce a lot of extraneous results quotients (e.g that for Wyoming's 63rd seat).
Title: Re: Census population estimates 2011-2019
Post by: jimrtex on January 06, 2018, 03:18:45 PM
If it was desired that 100% of districts be within 5% of the mean, this could be done with a House of 3031. The final piece is Vermont six seats being underpopulated to above 95% of the average of 109,328 persons. CA would have 368 seats, TX 269, FL 201. NY, PA, IL, OH would each have 100+; 15 others (down to CO and MN) would have 50+; 13 others (down to KS) would have 20+; 9 others (down to MT, RI) would have 10+. The final six would be DE 9, SD 8, ND 7, AK 7, VT 6, and WY 5. DC would have 7 electoral votes. 3031 + 50x2 + 7 = 3138 electoral votes. A speculators might want to acquire 3138.com.
Title: Re: Census population estimates 2011-2019
Post by: America Needs a 13-6 Progressive SCOTUS on January 06, 2018, 03:21:56 PM
If it was desired that 100% of districts be within 5% of the mean, this could be done with a House of 3031. The final piece is Vermont six seats being underpopulated to above 95% of the average of 109,328 persons. CA would have 368 seats, TX 269, FL 201. NY, PA, IL, OH would each have 100+; 15 others (down to CO and MN) would have 50+; 13 others (down to KS) would have 20+; 9 others (down to MT, RI) would have 10+. The final six would be DE 9, SD 8, ND 7, AK 7, VT 6, and WY 5. DC would have 7 electoral votes. 3031 + 50x2 + 7 = 3138 electoral votes. A speculators might want to acquire 3138.com.
That is a real website; its a Chinese Chess website.
Title: Re: Census population estimates 2011-2019
Post by: jimrtex on January 06, 2018, 07:01:24 PM
If it was desired that 100% of districts be within 5% of the mean, this could be done with a House of 3031. The final piece is Vermont six seats being underpopulated to above 95% of the average of 109,328 persons. CA would have 368 seats, TX 269, FL 201. NY, PA, IL, OH would each have 100+; 15 others (down to CO and MN) would have 50+; 13 others (down to KS) would have 20+; 9 others (down to MT, RI) would have 10+. The final six would be DE 9, SD 8, ND 7, AK 7, VT 6, and WY 5. DC would have 7 electoral votes. 3031 + 50x2 + 7 = 3138 electoral votes. A speculators might want to acquire 3138.com.
That is a real website; its a Chinese Chess website.
"Volkswagen is not a liar..."
"Enron - Some friends and relatives are worried about their initial investment..."
Title: Re: Census population estimates 2011-2019
Post by: Kevinstat on January 06, 2018, 11:29:22 PM
Do you have or know of a spreadsheet where one could input population numbers to determine the overall seat apportionment?
Column A(2:51): State Names
Column B(2:51): Populations (leave out DC and PR, unless you want to experiment)
A52: Cell with number of representatives, set to 435, but you can vary.
B52: Quota =SUM(B2:B51)/A52
Column C(2:51): Estimate. =B2/$B$52, etc.
Column D(2:51): Minimum number of seats. =MAX(INT(C2),1), etc, ensures all states get one representative, and avoids division by zero.
D52: Minimum seats = SUM(D2:D51)
Column E(2:51): Divisor for next seat:
Huntington-Hill: =SQRT(D2*(D2+1)), etc. (Geometric mean of n and n+1)
Webster's = D2 + 0.5 (Arithmetic mean of n and n+1)
Dean's = D2*(D2+1)*2/(D2+D2+1) (Harmonic mean)
Jefferson's = D2+1
Adams's = D2
Webster's is same as St.Lague, Jefferson's the same ad D'Hondt
Column F(2:F51): Quotient = B2/E2, etc. May also use C2/E2, etc.
Column G(2:G51): Quotient Rank = RANK(F2,F$2:F$51), etc.
G52 extra seats to apportion A52-D52
Column H(2:H51):= D2 + IF(G2 <= $G$52, 1, 0), etc. add one for largest quotients.
H52 total apportionment = SUM(H2:H51), should match A52
I forgot a caveat and a limitation.
The short cut I used assumes there will not be quota violations, where a state would not be apportioned either n or n+1 districts when:
n/435 <= Pstate / PUSA < (n+1)/435
This is estimated to be about a 1/1600 occurrence for the USA (the probability is based on the distribution of state populations, that is effectively random, and can only be simulated). For other uses, such as the apportionment of the British Parliament it is quite likely.
While the shortcut could be regarded as a defect in my implementation, the fact that a quota violation could occur, should be considered a defect of the divisor methods.
The limitation of my method is that it does not identify all the seats near the 435th seat. California should be apportioned roughly every 8th seat. While its quotients will be quite regular and periodic, other states will have different periods, so the rankings will not be periodic. My method will identify the ranking for California's 53rd seat, but not its 54th or 52nd, etc. And some of the rankings of other states will be in error because of this (but not, barring quota violations, whether or not they will be apportioned a particular number of seats).
To generate a full ranking with a spreadsheet requires more of a brute force approach. For example, one could generate, say the first 63 divisors, and calculate the quotients for all 50 states for each divisor. This would produce the top 500 or so rankings.
500/435 * 53 = 60.92 is an estimate of California's representation in a 500 member House. 63 is a fudge of 60.92, to make sure that California's rankings in the top 500 are generated. This method would also produce a lot of extraneous results quotients (e.g that for Wyoming's 63rd seat).
Title: Re: Census population estimates 2011-2019
Post by: jimrtex on January 08, 2018, 01:51:29 PM
Do you have or know of a spreadsheet where one could input population numbers to determine the overall seat apportionment?
Column A(2:51): State Names
Column B(2:51): Populations (leave out DC and PR, unless you want to experiment)
A52: Cell with number of representatives, set to 435, but you can vary.
B52: Quota =SUM(B2:B51)/A52
Column C(2:51): Estimate. =B2/$B$52, etc.
Column D(2:51): Minimum number of seats. =MAX(INT(C2),1), etc, ensures all states get one representative, and avoids division by zero.
D52: Minimum seats = SUM(D2:D51)
Column E(2:51): Divisor for next seat:
Huntington-Hill: =SQRT(D2*(D2+1)), etc. (Geometric mean of n and n+1)
Webster's = D2 + 0.5 (Arithmetic mean of n and n+1)
Dean's = D2*(D2+1)*2/(D2+D2+1) (Harmonic mean)
Jefferson's = D2+1
Adams's = D2
Webster's is same as St.Lague, Jefferson's the same ad D'Hondt
Column F(2:F51): Quotient = B2/E2, etc. May also use C2/E2, etc.
Column G(2:G51): Quotient Rank = RANK(F2,F$2:F$51), etc.
G52 extra seats to apportion A52-D52
Column H(2:H51):= D2 + IF(G2 <= $G$52, 1, 0), etc. add one for largest quotients.
H52 total apportionment = SUM(H2:H51), should match A52
I forgot a caveat and a limitation.
The short cut I used assumes there will not be quota violations, where a state would not be apportioned either n or n+1 districts when:
n/435 <= Pstate / PUSA < (n+1)/435
This is estimated to be about a 1/1600 occurrence for the USA (the probability is based on the distribution of state populations, that is effectively random, and can only be simulated). For other uses, such as the apportionment of the British Parliament it is quite likely.
While the shortcut could be regarded as a defect in my implementation, the fact that a quota violation could occur, should be considered a defect of the divisor methods.
The limitation of my method is that it does not identify all the seats near the 435th seat. California should be apportioned roughly every 8th seat. While its quotients will be quite regular and periodic, other states will have different periods, so the rankings will not be periodic. My method will identify the ranking for California's 53rd seat, but not its 54th or 52nd, etc. And some of the rankings of other states will be in error because of this (but not, barring quota violations, whether or not they will be apportioned a particular number of seats).
To generate a full ranking with a spreadsheet requires more of a brute force approach. For example, one could generate, say the first 63 divisors, and calculate the quotients for all 50 states for each divisor. This would produce the top 500 or so rankings.
500/435 * 53 = 60.92 is an estimate of California's representation in a 500 member House. 63 is a fudge of 60.92, to make sure that California's rankings in the top 500 are generated. This method would also produce a lot of extraneous results quotients (e.g that for Wyoming's 63rd seat).
I messed up. Jefferson's method would give two extra seats to California, and one extra to TX, NY, IL, OH, NC, and NJ; and take one from WA, MN, SC, WV, NE, ME, NH, RI; compared to Huntington-Hill (based on 2010 population).
Huntington-Hill, Webster's, and Dean's method often give the same result. After Congress failed to make an apportionment in 1920, they came up with the current procedure of using a divisor method, and fixing the size of the House, such that Congress could do what it does best, do nothing. But they did not make a decision between Huntington-Hill and Webster's methods. Under the 1930 apportionment they gave the same results. In 1940, there was a different result, with Arkansas gaining a seventh representative at the expense of Michigan. Since Arkansas was a reliable Democratic state at the time, Congress adopted Huntington-Hill on a party line vote (except Democrats from Michigan) and Huntington-Hill has been used ever since.
Huntington-Hill is estimated to have quota violations quite rarely (perhaps once in 1600 apportionments over 16000 years for USA-like population distributions), and I had conflated this to include Jefferson and Adams methods.
Perhaps contributing to this was a recollection of the 1790 apportionment. The initial apportionment based on Webster's method was vetoed, by President Washington, the first ever presidential veto. He did so on the basis of the advice of Secretary of State Thomas Jefferson, who pointed out that some States would have more than one representative per 30,000 persons.
Quote from: US Constitution Article I
... The Number of Representatives shall not exceed one for every thirty Thousand, but each State shall have at Least one Representative; ...
The Constitution is ambiguous. One reading is that the total number of representatives for the United States may not be greater than one per 30,000 - this was the interpretation by Congress. The other was that of Jefferson, which was adopted by Washington, that the limit was on a per state basis. Congress was unwilling to challenge George Washington, who was revered, on so important a subject as the interpretation of the Constitution.
But what they did was to use Jefferson's method, but chose a quota so that it would produce only minimal changes from Webster's method (one representative from Delaware to Virginia).
For my short cut method to work, an estimate of the number of representative to which a state is entitled must be made.
Let w = Pstate/quota, where quota = PUSA/435
Then for Webster's: est = w
For Huntington-Hill: est = sqrt( w2 + 1/4 )
For Dean's: est = ( w + sqrt ( w2 + 1) ) / 2
For Jefferson's: est = w - 1/2
For Adam's: est = w + 1/2
But for all nethod's other than Webster's the estimates would sum to something other than 435.
So we need to adjust the quota. This can be done in an iterative manner:
Where quota1 is the quota from above, and estusa is the total representation for the USA based on a particular quota.
quotan+1 = quotan * estusa(quotan) /435
Convergence is quite fast for Huntington-Hill with estusa ~= 435.000 after two iterations. About 4 iterations are needed for Jefferson's and Adam's methods.
For the 2010 Census (disregarding overseas population) the quota for Webster's method is 708,405; for Huntington-Hill is 711,428; and for Jefferson's method 669,906. Calculate the estimates using these adjusted quotas to to in the form n.xxx. The state will get n or n+1 seats by that method.
Title: Re: Census population estimates 2011-2019
Post by: Cokeland Saxton on January 29, 2018, 09:47:21 AM
If nobody has posted the 2017 estimates yet, I got u fam.
DC - 601,723 --> 693,972; +15.33%
1. TX - 25,145,561 --> 28,304,596; +12.56%
2. ND - 672,591 --> 755,393; +12.31%
3. UT - 2,763,885 --> 3,101,833; +12.23%
4. FL - 18,801,310 -->20,984,400; +11.61%
5. CO - 5,029,196 --> 5,607,154; +11.49%
6. NV - 2,700,551 --> 2,998,039; +11.02%
7. WA - 6,724,540 --> 7,405,743; +10.13%
8. AZ - 6,392,017 --> 7,016,270; +9.77%
9. ID - 1,567,582 --> 1,716,943; +9.53%
10. SC - 4,625,364 --> 5,024,369; +8.63%
11. OR - 3,831,074 --> 4,142,776; +8.14%
12. NC - 9,535,483 --> 10,273,419; +7.74%
13. GA - 9,687,653 --> 10,429,379; +7.66%
14. DE - 897,934 --> 961,939; +7.13%
15. SD - 814,180 --> 869,666; +6.81%
16. MT - 989,415 --> 1,050,493; +6.17%
17. CA - 37,253,956 --> 39,536,653; +6.13%
18. VA - 8,001,024 --> 8,470,020; +5.86%
19. TN - 6,346,105 --> 6,715,984; +5.83%
50 States + DC - 308,745,538 --> 325,719,178; +5.50%
20. MN - 5,303,925 --> 5,576,606; +5.14%
21. NE - 1,826,341 --> 1,920,076; +5.13%
22. HI - 1,360,301 --> 1,427,538; +4.94%
23. MD - 5,773,552 --> 6,052,177; +4.83%
24. OK - 3,751,351 --> 3,930,864; +4.79%
25. MA - 6,547,629 --> 6,859,819; +4.77%
26. AK - 710,231 --> 739,795; +4.16%
27. LA - 4,533,372 --> 4,684,333; +3.33%
28. IA - 3,046,355 --> 3,145,711; +3.26%
29. AR - 2,915,918 --> 3,004,279; +3.03%
30. IN - 6,483,802 --> 6,666,818; +2.82%
31. WY - 563,626 --> 579,315; +2.78%
32. KY - 4,339,367 --> 4,454,189; +2.65%
33. NY - 19,378,102 -> 19,849,399; +2.43%
34. NJ - 8,791,894 --> 9,005,644; +2.43%
35. KS - 2,853,118 --> 2,913,123; +2.10%
36. MO - 5,988,927 --> 6,113,532; +2.08%
37. NH - 1,316,470 --> 1,342,795; +2.00%
38. AL - 4,779,736 --> 4,874,747; +1.99%
39. WI - 5,686,986 --> 5,795,483; +1.91%
40. NM - 2,059,179 --> 2,088,070; +1.40%
41. OH - 11,536,504 --> 11,658,609; +1.06%
42. PA - 12,702,379 --> 12,805,537; +0.81%
43. MI - 9,883,640 --> 9,962,311; +0.80%
44. RI - 1,052,567 --> 1,059,639; +0.67%
45. ME - 1,328,361 --> 1,335,907; +0.57%
46. MS - 2,967,297 --> 2,984,100; +0.57%
47. CT - 3,574,097 --> 3,588,184; +0.39%
48. IL - 12,830,632 --> 12,802,023; −0.22%
49. VT - 625,741 --> 623,657; −0.33%
50. WV - 1,852,994 --> 1,815,857; −2.00%
Title: Re: Census population estimates 2011-2019
Post by: Dr. Arch on January 30, 2018, 12:21:25 AM
If nobody has posted the 2017 estimates yet, I got u fam.
DC - 601,723 --> 693,972; +15.33%
1. TX - 25,145,561 --> 28,304,596; +12.56%
2. ND - 672,591 --> 755,393; +12.31%
3. UT - 2,763,885 --> 3,101,833; +12.23%
4. FL - 18,801,310 -->20,984,400; +11.61%
5. CO - 5,029,196 --> 5,607,154; +11.49%
6. NV - 2,700,551 --> 2,998,039; +11.02%
7. WA - 6,724,540 --> 7,405,743; +10.13%
8. AZ - 6,392,017 --> 7,016,270; +9.77%
9. ID - 1,567,582 --> 1,716,943; +9.53%
10. SC - 4,625,364 --> 5,024,369; +8.63%
11. OR - 3,831,074 --> 4,142,776; +8.14%
12. NC - 9,535,483 --> 10,273,419; +7.74%
13. GA - 9,687,653 --> 10,429,379; +7.66%
14. DE - 897,934 --> 961,939; +7.13%
15. SD - 814,180 --> 869,666; +6.81%
16. MT - 989,415 --> 1,050,493; +6.17%
17. CA - 37,253,956 --> 39,536,653; +6.13%
18. VA - 8,001,024 --> 8,470,020; +5.86%
19. TN - 6,346,105 --> 6,715,984; +5.83%
50 States + DC - 308,745,538 --> 325,719,178; +5.50%
20. MN - 5,303,925 --> 5,576,606; +5.14%
21. NE - 1,826,341 --> 1,920,076; +5.13%
22. HI - 1,360,301 --> 1,427,538; +4.94%
23. MD - 5,773,552 --> 6,052,177; +4.83%
24. OK - 3,751,351 --> 3,930,864; +4.79%
25. MA - 6,547,629 --> 6,859,819; +4.77%
26. AK - 710,231 --> 739,795; +4.16%
27. LA - 4,533,372 --> 4,684,333; +3.33%
28. IA - 3,046,355 --> 3,145,711; +3.26%
29. AR - 2,915,918 --> 3,004,279; +3.03%
30. IN - 6,483,802 --> 6,666,818; +2.82%
31. WY - 563,626 --> 579,315; +2.78%
32. KY - 4,339,367 --> 4,454,189; +2.65%
33. NY - 19,378,102 -> 19,849,399; +2.43%
34. NJ - 8,791,894 --> 9,005,644; +2.43%
35. KS - 2,853,118 --> 2,913,123; +2.10%
36. MO - 5,988,927 --> 6,113,532; +2.08%
37. NH - 1,316,470 --> 1,342,795; +2.00%
38. AL - 4,779,736 --> 4,874,747; +1.99%
39. WI - 5,686,986 --> 5,795,483; +1.91%
40. NM - 2,059,179 --> 2,088,070; +1.40%
41. OH - 11,536,504 --> 11,658,609; +1.06%
42. PA - 12,702,379 --> 12,805,537; +0.81%
43. MI - 9,883,640 --> 9,962,311; +0.80%
44. RI - 1,052,567 --> 1,059,639; +0.67%
45. ME - 1,328,361 --> 1,335,907; +0.57%
46. MS - 2,967,297 --> 2,984,100; +0.57%
47. CT - 3,574,097 --> 3,588,184; +0.39%
48. IL - 12,830,632 --> 12,802,023; −0.22%
49. VT - 625,741 --> 623,657; −0.33%
50. WV - 1,852,994 --> 1,815,857; −2.00%
DC - 601,723 --> 693,972; +15.33%
1. TX - 25,145,561 --> 28,304,596; +12.56%
2. ND - 672,591 --> 755,393; +12.31%
3. UT - 2,763,885 --> 3,101,833; +12.23%
4. FL - 18,801,310 -->20,984,400; +11.61%
5. CO - 5,029,196 --> 5,607,154; +11.49%
6. NV - 2,700,551 --> 2,998,039; +11.02%
7. WA - 6,724,540 --> 7,405,743; +10.13%
8. AZ - 6,392,017 --> 7,016,270; +9.77%
9. ID - 1,567,582 --> 1,716,943; +9.53%
10. SC - 4,625,364 --> 5,024,369; +8.63%
11. OR - 3,831,074 --> 4,142,776; +8.14%
12. NC - 9,535,483 --> 10,273,419; +7.74%
13. GA - 9,687,653 --> 10,429,379; +7.66%
14. DE - 897,934 --> 961,939; +7.13%
15. SD - 814,180 --> 869,666; +6.81%
16. MT - 989,415 --> 1,050,493; +6.17%
17. CA - 37,253,956 --> 39,536,653; +6.13%
18. VA - 8,001,024 --> 8,470,020; +5.86%
19. TN - 6,346,105 --> 6,715,984; +5.83%
50 States + DC - 308,745,538 --> 325,719,178; +5.50%
20. MN - 5,303,925 --> 5,576,606; +5.14%
21. NE - 1,826,341 --> 1,920,076; +5.13%
22. HI - 1,360,301 --> 1,427,538; +4.94%
23. MD - 5,773,552 --> 6,052,177; +4.83%
24. OK - 3,751,351 --> 3,930,864; +4.79%
25. MA - 6,547,629 --> 6,859,819; +4.77%
26. AK - 710,231 --> 739,795; +4.16%
27. LA - 4,533,372 --> 4,684,333; +3.33%
28. IA - 3,046,355 --> 3,145,711; +3.26%
29. AR - 2,915,918 --> 3,004,279; +3.03%
30. IN - 6,483,802 --> 6,666,818; +2.82%
31. WY - 563,626 --> 579,315; +2.78%
32. KY - 4,339,367 --> 4,454,189; +2.65%
33. NY - 19,378,102 -> 19,849,399; +2.43%
34. NJ - 8,791,894 --> 9,005,644; +2.43%
35. KS - 2,853,118 --> 2,913,123; +2.10%
36. MO - 5,988,927 --> 6,113,532; +2.08%
37. NH - 1,316,470 --> 1,342,795; +2.00%
38. AL - 4,779,736 --> 4,874,747; +1.99%
39. WI - 5,686,986 --> 5,795,483; +1.91%
40. NM - 2,059,179 --> 2,088,070; +1.40%
41. OH - 11,536,504 --> 11,658,609; +1.06%
42. PA - 12,702,379 --> 12,805,537; +0.81%
43. MI - 9,883,640 --> 9,962,311; +0.80%
44. RI - 1,052,567 --> 1,059,639; +0.67%
45. ME - 1,328,361 --> 1,335,907; +0.57%
46. MS - 2,967,297 --> 2,984,100; +0.57%
47. CT - 3,574,097 --> 3,588,184; +0.39%
48. IL - 12,830,632 --> 12,802,023; −0.22%
49. VT - 625,741 --> 623,657; −0.33%
50. WV - 1,852,994 --> 1,815,857; −2.00%
Puerto Rico?
Title: Re: Census population estimates 2011-2019
Post by: Cokeland Saxton on January 30, 2018, 08:05:52 AM
I just did the 50 states, DC, and the US as a whole. But here's Puerto Rico and the rest of the territories:
Guam - 159,358 --> 162,742; +2.12%
American Samoa - 55,519 --> 54,194; -2.39%
Northern Mariana Islands - 53,833 --> 52,263; -2.92%
US Virgin Islands - 106,405 --> 102,951; -3.25%
Puerto Rico - 3,725,789 --> 3,337,177; -10.43%
RIP Puerto Rico
Guam - 159,358 --> 162,742; +2.12%
American Samoa - 55,519 --> 54,194; -2.39%
Northern Mariana Islands - 53,833 --> 52,263; -2.92%
US Virgin Islands - 106,405 --> 102,951; -3.25%
Puerto Rico - 3,725,789 --> 3,337,177; -10.43%
RIP Puerto Rico
Title: Re: Census population estimates 2011-2019
Post by: ○∙◄☻¥tπ[╪AV┼cVê└ on January 30, 2018, 08:07:55 AM
I just did the 50 states, DC, and the US as a whole. But here's Puerto Rico and the rest of the territories:
Guam - 159,358 --> 162,742; +2.12%
American Samoa - 55,519 --> 54,194; -2.39%
Northern Mariana Islands - 53,833 --> 52,263; -2.92%
US Virgin Islands - 106,405 --> 102,951; -3.25%
Puerto Rico - 3,725,789 --> 3,337,177; -10.43%
RIP Puerto Rico
Guam - 159,358 --> 162,742; +2.12%
American Samoa - 55,519 --> 54,194; -2.39%
Northern Mariana Islands - 53,833 --> 52,263; -2.92%
US Virgin Islands - 106,405 --> 102,951; -3.25%
Puerto Rico - 3,725,789 --> 3,337,177; -10.43%
RIP Puerto Rico
And that's pre Hurricane Maria.
Title: Re: Census population estimates 2011-2019
Post by: Cokeland Saxton on January 30, 2018, 02:22:27 PM
That is exactly why I said RIP
Title: Re: Census population estimates 2011-2019
Post by: Dr. Arch on February 02, 2018, 02:08:32 AM
I just did the 50 states, DC, and the US as a whole. But here's Puerto Rico and the rest of the territories:
Guam - 159,358 --> 162,742; +2.12%
American Samoa - 55,519 --> 54,194; -2.39%
Northern Mariana Islands - 53,833 --> 52,263; -2.92%
US Virgin Islands - 106,405 --> 102,951; -3.25%
Puerto Rico - 3,725,789 --> 3,337,177; -10.43%
RIP Puerto Rico
Guam - 159,358 --> 162,742; +2.12%
American Samoa - 55,519 --> 54,194; -2.39%
Northern Mariana Islands - 53,833 --> 52,263; -2.92%
US Virgin Islands - 106,405 --> 102,951; -3.25%
Puerto Rico - 3,725,789 --> 3,337,177; -10.43%
RIP Puerto Rico
And that's pre Hurricane Maria.
Sigh... yeah, as I expected. The population right now should be around 2.7 million or so, another 20% drop that's unaccounted for (in terms of months).
Title: Re: Census population estimates 2011-2019
Post by: Young Conservative on February 03, 2018, 02:14:21 PM
1. TX - 25,145,561 --> 28,304,596; +12.56%
2. ND - 672,591 --> 755,393; +12.31%
3. UT - 2,763,885 --> 3,101,833; +12.23%
4. FL - 18,801,310 -->20,984,400; +11.61%
5. CO - 5,029,196 --> 5,607,154; +11.49%
6. NV - 2,700,551 --> 2,998,039; +11.02%
7. WA - 6,724,540 --> 7,405,743; +10.13%
8. AZ - 6,392,017 --> 7,016,270; +9.77%
9. ID - 1,567,582 --> 1,716,943; +9.53%
10. SC - 4,625,364 --> 5,024,369; +8.63%
11. OR - 3,831,074 --> 4,142,776; +8.14%
12. NC - 9,535,483 --> 10,273,419; +7.74%
13. GA - 9,687,653 --> 10,429,379; +7.66%
14. DE - 897,934 --> 961,939; +7.13%
15. SD - 814,180 --> 869,666; +6.81%
16. MT - 989,415 --> 1,050,493; +6.17%
17. CA - 37,253,956 --> 39,536,653; +6.13%
18. VA - 8,001,024 --> 8,470,020; +5.86%
19. TN - 6,346,105 --> 6,715,984; +5.83%
50 States + DC - 308,745,538 --> 325,719,178; +5.50%
All the states growing faster than the US as a whole, by partisan lean.
12/19 Republican.
Title: Re: Census population estimates 2011-2019
Post by: DINGO Joe on February 03, 2018, 02:20:39 PM
1. TX - 25,145,561 --> 28,304,596; +12.56%
2. ND - 672,591 --> 755,393; +12.31%
3. UT - 2,763,885 --> 3,101,833; +12.23%
4. FL - 18,801,310 -->20,984,400; +11.61%
5. CO - 5,029,196 --> 5,607,154; +11.49%
6. NV - 2,700,551 --> 2,998,039; +11.02%
7. WA - 6,724,540 --> 7,405,743; +10.13%
8. AZ - 6,392,017 --> 7,016,270; +9.77%
9. ID - 1,567,582 --> 1,716,943; +9.53%
10. SC - 4,625,364 --> 5,024,369; +8.63%
11. OR - 3,831,074 --> 4,142,776; +8.14%
12. NC - 9,535,483 --> 10,273,419; +7.74%
13. GA - 9,687,653 --> 10,429,379; +7.66%
14. DE - 897,934 --> 961,939; +7.13%
15. SD - 814,180 --> 869,666; +6.81%
16. MT - 989,415 --> 1,050,493; +6.17%
17. CA - 37,253,956 --> 39,536,653; +6.13%
18. VA - 8,001,024 --> 8,470,020; +5.86%
19. TN - 6,346,105 --> 6,715,984; +5.83%
50 States + DC - 308,745,538 --> 325,719,178; +5.50%
All the states growing faster than the US as a whole, by partisan lean.
12/19 Republican.
2. ND - 672,591 --> 755,393; +12.31%
3. UT - 2,763,885 --> 3,101,833; +12.23%
4. FL - 18,801,310 -->20,984,400; +11.61%
5. CO - 5,029,196 --> 5,607,154; +11.49%
6. NV - 2,700,551 --> 2,998,039; +11.02%
7. WA - 6,724,540 --> 7,405,743; +10.13%
8. AZ - 6,392,017 --> 7,016,270; +9.77%
9. ID - 1,567,582 --> 1,716,943; +9.53%
10. SC - 4,625,364 --> 5,024,369; +8.63%
11. OR - 3,831,074 --> 4,142,776; +8.14%
12. NC - 9,535,483 --> 10,273,419; +7.74%
13. GA - 9,687,653 --> 10,429,379; +7.66%
14. DE - 897,934 --> 961,939; +7.13%
15. SD - 814,180 --> 869,666; +6.81%
16. MT - 989,415 --> 1,050,493; +6.17%
17. CA - 37,253,956 --> 39,536,653; +6.13%
18. VA - 8,001,024 --> 8,470,020; +5.86%
19. TN - 6,346,105 --> 6,715,984; +5.83%
50 States + DC - 308,745,538 --> 325,719,178; +5.50%
All the states growing faster than the US as a whole, by partisan lean.
12/19 Republican.
Outside of Utah, and maybe Idaho, the only way states can grow fast is through immigration, so D can flip them all.
Title: Re: Census population estimates 2011-2019
Post by: Nyvin on February 03, 2018, 07:32:27 PM
1. TX - 25,145,561 --> 28,304,596; +12.56%
2. ND - 672,591 --> 755,393; +12.31%
3. UT - 2,763,885 --> 3,101,833; +12.23%
4. FL - 18,801,310 -->20,984,400; +11.61%
5. CO - 5,029,196 --> 5,607,154; +11.49%
6. NV - 2,700,551 --> 2,998,039; +11.02%
7. WA - 6,724,540 --> 7,405,743; +10.13%
8. AZ - 6,392,017 --> 7,016,270; +9.77%
9. ID - 1,567,582 --> 1,716,943; +9.53%
10. SC - 4,625,364 --> 5,024,369; +8.63%
11. OR - 3,831,074 --> 4,142,776; +8.14%
12. NC - 9,535,483 --> 10,273,419; +7.74%
13. GA - 9,687,653 --> 10,429,379; +7.66%
14. DE - 897,934 --> 961,939; +7.13%
15. SD - 814,180 --> 869,666; +6.81%
16. MT - 989,415 --> 1,050,493; +6.17%
17. CA - 37,253,956 --> 39,536,653; +6.13%
18. VA - 8,001,024 --> 8,470,020; +5.86%
19. TN - 6,346,105 --> 6,715,984; +5.83%
50 States + DC - 308,745,538 --> 325,719,178; +5.50%
All the states growing faster than the US as a whole, by partisan lean.
12/19 Republican.
2. ND - 672,591 --> 755,393; +12.31%
3. UT - 2,763,885 --> 3,101,833; +12.23%
4. FL - 18,801,310 -->20,984,400; +11.61%
5. CO - 5,029,196 --> 5,607,154; +11.49%
6. NV - 2,700,551 --> 2,998,039; +11.02%
7. WA - 6,724,540 --> 7,405,743; +10.13%
8. AZ - 6,392,017 --> 7,016,270; +9.77%
9. ID - 1,567,582 --> 1,716,943; +9.53%
10. SC - 4,625,364 --> 5,024,369; +8.63%
11. OR - 3,831,074 --> 4,142,776; +8.14%
12. NC - 9,535,483 --> 10,273,419; +7.74%
13. GA - 9,687,653 --> 10,429,379; +7.66%
14. DE - 897,934 --> 961,939; +7.13%
15. SD - 814,180 --> 869,666; +6.81%
16. MT - 989,415 --> 1,050,493; +6.17%
17. CA - 37,253,956 --> 39,536,653; +6.13%
18. VA - 8,001,024 --> 8,470,020; +5.86%
19. TN - 6,346,105 --> 6,715,984; +5.83%
50 States + DC - 308,745,538 --> 325,719,178; +5.50%
All the states growing faster than the US as a whole, by partisan lean.
12/19 Republican.
Showing partisan trend from 2012 to 2016 for those states would be more useful.
Places like Arizona, North Carolina, Georgia, Florida and Texas are Republican "now" (barely) but that's certainly not a guarantee for the future.
Title: Re: Census population estimates 2011-2019
Post by: Cokeland Saxton on February 28, 2018, 01:32:43 PM
county level estimates from 2017 will be out in a couple weeks. What should we expect to see?
Title: Re: Census population estimates 2011-2019
Post by: krazen1211 on March 03, 2018, 03:44:44 PM
1. TX - 25,145,561 --> 28,304,596; +12.56%
2. ND - 672,591 --> 755,393; +12.31%
3. UT - 2,763,885 --> 3,101,833; +12.23%
4. FL - 18,801,310 -->20,984,400; +11.61%
5. CO - 5,029,196 --> 5,607,154; +11.49%
6. NV - 2,700,551 --> 2,998,039; +11.02%
7. WA - 6,724,540 --> 7,405,743; +10.13%
8. AZ - 6,392,017 --> 7,016,270; +9.77%
9. ID - 1,567,582 --> 1,716,943; +9.53%
10. SC - 4,625,364 --> 5,024,369; +8.63%
11. OR - 3,831,074 --> 4,142,776; +8.14%
12. NC - 9,535,483 --> 10,273,419; +7.74%
13. GA - 9,687,653 --> 10,429,379; +7.66%
14. DE - 897,934 --> 961,939; +7.13%
15. SD - 814,180 --> 869,666; +6.81%
16. MT - 989,415 --> 1,050,493; +6.17%
17. CA - 37,253,956 --> 39,536,653; +6.13%
18. VA - 8,001,024 --> 8,470,020; +5.86%
19. TN - 6,346,105 --> 6,715,984; +5.83%
50 States + DC - 308,745,538 --> 325,719,178; +5.50%
All the states growing faster than the US as a whole, by partisan lean.
12/19 Republican.
2. ND - 672,591 --> 755,393; +12.31%
3. UT - 2,763,885 --> 3,101,833; +12.23%
4. FL - 18,801,310 -->20,984,400; +11.61%
5. CO - 5,029,196 --> 5,607,154; +11.49%
6. NV - 2,700,551 --> 2,998,039; +11.02%
7. WA - 6,724,540 --> 7,405,743; +10.13%
8. AZ - 6,392,017 --> 7,016,270; +9.77%
9. ID - 1,567,582 --> 1,716,943; +9.53%
10. SC - 4,625,364 --> 5,024,369; +8.63%
11. OR - 3,831,074 --> 4,142,776; +8.14%
12. NC - 9,535,483 --> 10,273,419; +7.74%
13. GA - 9,687,653 --> 10,429,379; +7.66%
14. DE - 897,934 --> 961,939; +7.13%
15. SD - 814,180 --> 869,666; +6.81%
16. MT - 989,415 --> 1,050,493; +6.17%
17. CA - 37,253,956 --> 39,536,653; +6.13%
18. VA - 8,001,024 --> 8,470,020; +5.86%
19. TN - 6,346,105 --> 6,715,984; +5.83%
50 States + DC - 308,745,538 --> 325,719,178; +5.50%
All the states growing faster than the US as a whole, by partisan lean.
12/19 Republican.
Trump won 30/51 (DC) states. Big growth in favor of the GOP. Trump was +500k votes in Florida compared to Romney.
Title: Re: Census population estimates 2011-2019
Post by: America Needs a 13-6 Progressive SCOTUS on March 05, 2018, 12:59:31 PM
1. TX - 25,145,561 --> 28,304,596; +12.56%
2. ND - 672,591 --> 755,393; +12.31%
3. UT - 2,763,885 --> 3,101,833; +12.23%
4. FL - 18,801,310 -->20,984,400; +11.61%
5. CO - 5,029,196 --> 5,607,154; +11.49%
6. NV - 2,700,551 --> 2,998,039; +11.02%
7. WA - 6,724,540 --> 7,405,743; +10.13%
8. AZ - 6,392,017 --> 7,016,270; +9.77%
9. ID - 1,567,582 --> 1,716,943; +9.53%
10. SC - 4,625,364 --> 5,024,369; +8.63%
11. OR - 3,831,074 --> 4,142,776; +8.14%
12. NC - 9,535,483 --> 10,273,419; +7.74%
13. GA - 9,687,653 --> 10,429,379; +7.66%
14. DE - 897,934 --> 961,939; +7.13%
15. SD - 814,180 --> 869,666; +6.81%
16. MT - 989,415 --> 1,050,493; +6.17%
17. CA - 37,253,956 --> 39,536,653; +6.13%
18. VA - 8,001,024 --> 8,470,020; +5.86%
19. TN - 6,346,105 --> 6,715,984; +5.83%
50 States + DC - 308,745,538 --> 325,719,178; +5.50%
All the states growing faster than the US as a whole, by partisan lean.
12/19 Republican.
2. ND - 672,591 --> 755,393; +12.31%
3. UT - 2,763,885 --> 3,101,833; +12.23%
4. FL - 18,801,310 -->20,984,400; +11.61%
5. CO - 5,029,196 --> 5,607,154; +11.49%
6. NV - 2,700,551 --> 2,998,039; +11.02%
7. WA - 6,724,540 --> 7,405,743; +10.13%
8. AZ - 6,392,017 --> 7,016,270; +9.77%
9. ID - 1,567,582 --> 1,716,943; +9.53%
10. SC - 4,625,364 --> 5,024,369; +8.63%
11. OR - 3,831,074 --> 4,142,776; +8.14%
12. NC - 9,535,483 --> 10,273,419; +7.74%
13. GA - 9,687,653 --> 10,429,379; +7.66%
14. DE - 897,934 --> 961,939; +7.13%
15. SD - 814,180 --> 869,666; +6.81%
16. MT - 989,415 --> 1,050,493; +6.17%
17. CA - 37,253,956 --> 39,536,653; +6.13%
18. VA - 8,001,024 --> 8,470,020; +5.86%
19. TN - 6,346,105 --> 6,715,984; +5.83%
50 States + DC - 308,745,538 --> 325,719,178; +5.50%
All the states growing faster than the US as a whole, by partisan lean.
12/19 Republican.
Trump won 30/51 (DC) states. Big growth in favor of the GOP. Trump was +500k votes in Florida compared to Romney.
Florida 2012 R: 49.03%
Florida 2016 R: 48.60%
Title: Re: Census population estimates 2011-2019
Post by: Cokeland Saxton on March 06, 2018, 08:28:33 AM
the +500k was like because Florida's population was higher in 2016 than in 2012 :P
Title: Re: Census population estimates 2011-2019
Post by: cvparty on March 06, 2018, 09:05:30 AM
the +500k was like because Florida's population was higher in 2016 than in 2012 :P
Title: Re: Census population estimates 2011-2019
Post by: krazen1211 on March 06, 2018, 10:29:16 PM
the +500k was like because Florida's population was higher in 2016 than in 2012 :P
The Dem party gained half that. Big swing towards the GOP.
Title: Re: Census population estimates 2011-2019
Post by: KingSweden on March 06, 2018, 10:56:11 PM
Krazen is bad at trolling AND math. Who knew.
Title: Re: Census population estimates 2011-2019
Post by: KingSweden on March 12, 2018, 11:24:00 AM
Any predictions for the census county estimates?
Title: Re: Census population estimates 2011-2019
Post by: cinyc on March 12, 2018, 04:08:16 PM
Any predictions for the census county estimates?
The state of Alaska released its own estimates, and Mat-Su Borough was the only county equivalent there that was significantly growing. I suspect that Census will find the same. Alaskas full report is here: http://labor.alaska.gov/trends/mar18.pdf
I also think the Western ND oil counties will show very slow growth or a population decline.
Title: Re: Census population estimates 2011-2019
Post by: KingSweden on March 13, 2018, 10:05:36 AM
Any predictions for the census county estimates?
The state of Alaska released its own estimates, and Mat-Su Borough was the only county equivalent there that was significantly growing. I suspect that Census will find the same. Alaskas full report is here: http://labor.alaska.gov/trends/mar18.pdf
I also think the Western ND oil counties will show very slow growth or a population decline.
On that last point, I suspect you are right
Title: Re: Census population estimates 2011-2019
Post by: Gass3268 on March 13, 2018, 10:52:40 AM
Are they late? They usually are almost always released in the morning.
Title: Re: Census population estimates 2011-2019
Post by: cinyc on March 13, 2018, 12:15:45 PM
Are they late? They usually are almost always released in the morning.
The national projections were released today: https://www.census.gov/data/tables/2017/demo/popproj/2017-summary-tables.html
The county estimates will be released to the public on March 22.
Title: Re: Census population estimates 2011-2019
Post by: cinyc on March 21, 2018, 06:33:43 PM
County estimates come out tomorrow morning, likely around 10AM Eastern. Any guesses on what they will show?
Title: Re: Census population estimates 2011-2019
Post by: KingSweden on March 21, 2018, 06:51:26 PM
County estimates come out tomorrow morning, likely around 10AM Eastern. Any guesses on what they will show?
Im thinking Texas counties still leading the way, and breakneck growth % wise in King (WA), Ada (ID) and the Atlanta counties
Title: Re: Census population estimates 2011-2019
Post by: cinyc on March 21, 2018, 07:02:59 PM
County estimates come out tomorrow morning, likely around 10AM Eastern. Any guesses on what they will show?
Im thinking Texas counties still leading the way, and breakneck growth % wise in King (WA), Ada (ID) and the Atlanta counties
Maricopa, AZ actually had the largest numerical increase last year. Will that continue? Or will it be another county this year?
Title: Re: Census population estimates 2011-2019
Post by: KingSweden on March 21, 2018, 07:08:54 PM
County estimates come out tomorrow morning, likely around 10AM Eastern. Any guesses on what they will show?
Im thinking Texas counties still leading the way, and breakneck growth % wise in King (WA), Ada (ID) and the Atlanta counties
Maricopa, AZ actually had the largest numerical increase last year. Will that continue? Or will it be another county this year?
That honestly wouldnt surprise me but who knows. I could see it slowing with lessened Latino in migration
Title: Re: Census population estimates 2011-2019
Post by: cinyc on March 21, 2018, 11:30:57 PM
We're starting to get a preview of tomorrow's census release from newspaper websites (https://www.reviewjournal.com/local/local-nevada/us-census-bureau-clark-county-added-2nd-most-new-residents-in-2017/). Census' official release is here (https://www.census.gov/newsroom/press-releases/2018/popest-metro-county.html). Data will come in the morning.
The 2016-17 winners and losers:
The Largest-Gaining Counties (Total Population):
1. Maricopa County, Arizona, up 73,650 to 4,307,033, 1.7 percent increase.
2. Clark County, Nevada, up 47,355 to 2,204,079, 2.2 percent.
3. Riverside County, California, up 36,744 to 2,423,266, 1.5 percent
4. Harris County, Texas, up 35,939 to 4,652,980, 0.8 percent.
5. Tarrant County, Texas, up 32,729 to 2,054,475, 1.6 percent.
6. King County, Washington, up 32,687 to 2,188,649, 1.5 percent.
7. Bexar County, Texas, up 30,831 to 1,958,578, 1.6 percent.
8. Dallas County, Texas, up 30,686 to 2,618,148, 1.2 percent.
9. Denton County, Texas, up 27,911 to 836,210, 3.5 percent.
10. Collin County, Texas, up 27,150 to 969,603, 2.9 percent.
Fastest-Growing Counties (Percentage Increase):
1. Falls Church city, VA 5.2%
2. Comal County, TX 5.1%
3. Wasatch County, UT 5.0%
4. Hays County, TX 5.0%
5. Kendall County, TX 4.9%
6. Walton County, FL 4.5%
7. Tooele County, UT 4.4%
8. Morgan County, UT 4.4%
9. Lumpkin County, GA 4.3%
10. Osceola County, FL 4.2%
Biggest total population drops (http://www.cleveland.com/datacentral/index.ssf/2018/03/cuyahoga_county_no_3_nationall.html)
1. Cook County (Chicago): down 20,093 to 5,211,263.
2. Baltimore city: down 5,310 to 611,648.
3. Cuyahoga County: down 4,940 to 1,248,514.
4. St. Louis city: down 4,518 to 308,626.
5. Allegheny County (Pittsburgh): down 4,505 to 1,223,048.
6. Honolulu County, Hawaii: down 4,111 to 988,650.
7. Milwaukee County, Wisconsin: down 3,284 to 952,085.
8. Anchorage County, Alaska: down 3,020 to 294,356.
9. Wayne County (Detroit), Michigan: down 2,982 to 1,753,616.
10. Kanawha County (Charleston), West Virginia: down 2,804 to 183,293.
Largest-Gaining Metro Areas (Total Population):
1. Dallas-Fort Worth-Arlington, TX +146,238
2. Houston-The Woodlands-Sugar Land, TX +94,417
3. Atlanta-Sandy Springs-Roswell, GA +89,013
4. Phoenix-Mesa-Scottsdale, AZ +88,772
5. Washington-Arlington-Alexandria, DC-VA-MD-WV +65,908
6. Seattle-Tacoma-Bellevue, WA +64,386
7. Riverside-San Bernardino-Ontario, CA +57,017
8. Orlando-Kissimmee-Sanford, FL +56,498
9. Austin-Round Rock, TX +55,269
10. Tampa-St. Petersburg-Clearwater, FL +54,874
Fastest-Growing Metros (Percentage Increase):
1. St. George, Utah, 4 percent to 165,662.
2. Myrtle Beach-Conway-North Myrtle Beach, S.C. and N.C., 3.7 percent to 447,793.
3. Greeley, Colo., 3.5 percent to 294,243.
4. Bend-Redmond, Ore., 3.4 percent to 180,675.
5. Coeur d'Alene, Idaho, 2.9 percent to 153,144.
6. Lakeland-Winter Haven, Fla., 2.9 percent to 667,018.
7. Boise City, Idaho, 2.8 percent to 690,810.
8. Provo-Orem, Utah, 2.7 percent to 601,478.
9. Austin-Round Rock, Texas, 2.7 percent to 2,060,558.
10. The Villages, Fla., 2.5 percent to 125,165.
Interactive map from Cleveland.com (http://www.cleveland.com/datacentral/index.ssf/2018/03/cuyahoga_county_no_3_nationall.html)
Title: Re: Census population estimates 2011-2019
Post by: Nyvin on March 22, 2018, 09:00:05 AM
Has all the data been released yet? I just see the top 10 figures they posted, not the excel sheets or maps they usually put out.
Title: Re: Census population estimates 2011-2019
Post by: KingSweden on March 22, 2018, 09:54:27 AM
Cant wait to dive into these numbers
Title: Re: Census population estimates 2011-2019
Post by: DINGO Joe on March 22, 2018, 10:05:49 AM
Has all the data been released yet? I just see the top 10 figures they posted, not the excel sheets or maps they usually put out.
Go to the press kits link and there is a path to get to the estimates from there
Title: Re: Census population estimates 2011-2019
Post by: Nyvin on March 22, 2018, 02:11:13 PM
A lot of rural areas seem to be making a comeback, the declines are nowhere near as widespread as previous years. Some long-term declines remained, like in Appalachia, Mississippi Delta, or northern Maine, but elsewhere things got better.
The entire Chicago metro lost population, including Dupage, Lake IL, and Lake IN.
Only Coos County in NH lost population, all others gained, Carrol growing the fastest (weird!)
The entire Chicago metro lost population, including Dupage, Lake IL, and Lake IN.
Only Coos County in NH lost population, all others gained, Carrol growing the fastest (weird!)
Title: Re: Census population estimates 2011-2019
Post by: jimrtex on March 22, 2018, 03:58:38 PM
As of the July 2017 estimates:
87 counties now have population sufficient for a congressional district (1/435 of the national population). This is up from 83 in 2010. The new giants are Cobb and DeKalb in Georgia, and Denton and Fort Bend in Texas. None have dropped, though Monroe in New York is perilously close.
53 of the giants are gaining at a faster rate than the country as a whole, 34 are losing ground.
6 are losing in absolute numbers: New Haven, CT; Wayne, MI; St. Louis (County), MO; Suffolk, NY; Cuyahoga, OH; and Allegheny, PA.
Title: Re: Census population estimates 2011-2019
Post by: Beet on March 22, 2018, 04:09:57 PM
The Houston metro was growing faster than Dallas earlier in the decade. Now it's reversed. This is all pre-Harvey too. With the Amazon 2nd headquarters likely to move to Dallas with Houston not even on the contender list, and Huntsville being selected for Blue Origin, I wonder if Houston is f---ed. In 30 years with all electric cars, people won't need oil anymore.
Title: Re: Census population estimates 2011-2019
Post by: America's Sweetheart ❤/𝕿𝖍𝖊 𝕭𝖔𝖔𝖙𝖞 𝖂𝖆𝖗𝖗𝖎𝖔𝖗 on March 22, 2018, 04:15:44 PM
Off topic, but it's interesting going back to the first few pages of this thread and seeing Krazen actually posting somewhat intelligent, thoughtful comments. what happened between then and now?
Title: Re: Census population estimates 2011-2019
Post by: KingSweden on March 22, 2018, 04:26:21 PM
Off topic, but it's interesting going back to the first few pages of this thread and seeing Krazen actually posting somewhat intelligent, thoughtful comments. what happened between then and now?
Absolutely outstanding cocaine
Title: Re: Census population estimates 2011-2019
Post by: Oryxslayer on March 22, 2018, 04:32:21 PM
Off topic, but it's interesting going back to the first few pages of this thread and seeing Krazen actually posting somewhat intelligent, thoughtful comments. what happened between then and now?
When I first got here I read all the old 2010 redistricting threads. There, Krazen was an insightful and pleasantly constant presence from the right. It's like a complete 180 if you go and read them.
Title: Re: Census population estimates 2011-2019
Post by: jimrtex on March 22, 2018, 07:13:03 PM
As of the July 2017 estimates:
87 counties now have population sufficient for a congressional district (1/435 of the national population). This is up from 83 in 2010. The new giants are Cobb and DeKalb in Georgia, and Denton and Fort Bend in Texas. None have dropped, though Monroe in New York is perilously close.
53 of the giants are gaining at a faster rate than the country as a whole, 34 are losing ground.
6 are losing in absolute numbers: New Haven, CT; Wayne, MI; St. Louis (County), MO; Suffolk, NY; Cuyahoga, OH; and Allegheny, PA.
87 counties now have population sufficient for a congressional district (1/435 of the national population). This is up from 83 in 2010. The new giants are Cobb and DeKalb in Georgia, and Denton and Fort Bend in Texas. None have dropped, though Monroe in New York is perilously close.
53 of the giants are gaining at a faster rate than the country as a whole, 34 are losing ground.
6 are losing in absolute numbers: New Haven, CT; Wayne, MI; St. Louis (County), MO; Suffolk, NY; Cuyahoga, OH; and Allegheny, PA.
Title: Re: Census population estimates 2011-2019
Post by: jimrtex on March 22, 2018, 07:33:30 PM
22 counties have gained more than 1/10 of a congressional district since 2010:
Harris, TX 0.450
Maricopa, AZ 0.376
King, WA 0.203
Bexar, TX 0.201
Fort Bend, TX 0.197
Travis, TX 0.196
Tarrant, TX 0.196
Clark, NV 0.195
Collin, TX 0.193
Orange, FL 0.188
Denton, TX 0.182
Wake, NC 0.163
Dallas, TX 0.161
Miami-Dade, FL 0.159
Riverside, CA 0.152
Hillsborough, FL 0.150
Mecklenburg, NC 0.141
Williamson, TX 0.136
Broward, FL 0.123
Montgomery, TX 0.121
Lee, FL 0.116
Palm Beach, FL 0.105
5 counties have lost more than 1/10 of a district since 2010.
Cook, IL -0.359
Los Angeles, CA -0.259
Wayne, MI -0.223
Cuyahoga, OH -0.136
Suffolk, NY -0.110
Title: Re: Census population estimates 2011-2019
Post by: henster on March 22, 2018, 07:47:11 PM
The Houston metro was growing faster than Dallas earlier in the decade. Now it's reversed. This is all pre-Harvey too. With the Amazon 2nd headquarters likely to move to Dallas with Houston not even on the contender list, and Huntsville being selected for Blue Origin, I wonder if Houston is f---ed. In 30 years with all electric cars, people won't need oil anymore.
Since when is Amazon HQ2 likely to be in Dallas, I thought the DMV area was the most likely location?
Title: Re: Census population estimates 2011-2019
Post by: Gass3268 on March 23, 2018, 07:19:37 AM
()
Title: Re: Census population estimates 2011-2019
Post by: Tender Branson on March 23, 2018, 01:03:12 PM
http://www.citypopulation.de/USA.html
... has updated with the new 2017 data for states, counties, metros, cities/towns and clickable maps !
... has updated with the new 2017 data for states, counties, metros, cities/towns and clickable maps !
Title: Re: Census population estimates 2011-2019
Post by: jamestroll on March 23, 2018, 06:21:45 PM
Technology will mitigate this but 2020 may be the last census in which the sun belt gains significantly from the north due to climate change and natural disasters.
Title: Re: Census population estimates 2011-2019
Post by: America Needs a 13-6 Progressive SCOTUS on March 25, 2018, 11:59:08 AM
(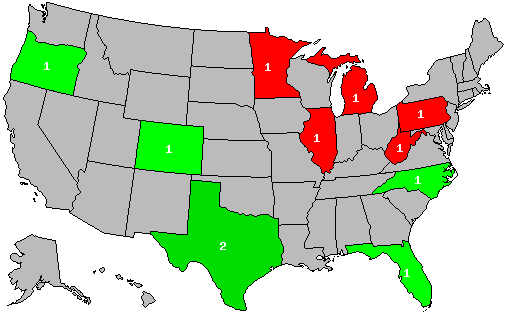 )
)
I threw 2017 estimates into an apportionment calculator and displayed the changes. Note that the total seats calculated was 436, one more than the total.
Alternatively, if we were to decide to have an increase in the House size such that no state would lose a seat, the House would have 447 seats, and this would be the changes:
(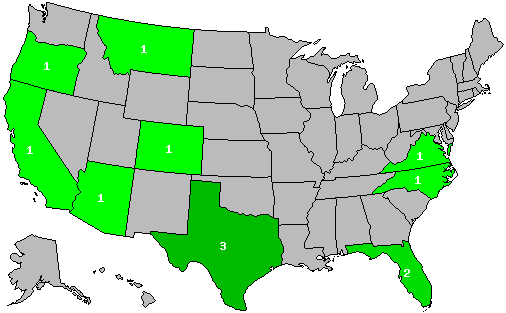 )
)
I threw 2017 estimates into an apportionment calculator and displayed the changes. Note that the total seats calculated was 436, one more than the total.
Alternatively, if we were to decide to have an increase in the House size such that no state would lose a seat, the House would have 447 seats, and this would be the changes:
(
Title: Re: Census population estimates 2011-2019
Post by: Strudelcutie4427 on March 25, 2018, 12:05:16 PM
()
I threw 2017 estimates into an apportionment calculator and displayed the changes. Note that the total seats calculated was 436, one more than the total.
Alternatively, if we were to decide to have an increase in the House size such that no state would lose a seat, the House would have 447 seats, and this would be the changes:
(
How would Rhode Island keep its seat? Doesnt Montana have more people than RI now?
Title: Re: Census population estimates 2011-2019
Post by: America Needs a 13-6 Progressive SCOTUS on March 25, 2018, 12:11:26 PM
()
I threw 2017 estimates into an apportionment calculator and displayed the changes. Note that the total seats calculated was 436, one more than the total.
Alternatively, if we were to decide to have an increase in the House size such that no state would lose a seat, the House would have 447 seats, and this would be the changes:
(
How would Rhode Island keep its seat? Doesnt Montana have more people than RI now?
Rhode Island: 1,059,639
Montana : 1,050,493
about 9000 people difference as of 2017.
Probably going to switch in 2018/2019.
Title: Re: Census population estimates 2011-2019
Post by: Cokeland Saxton on March 25, 2018, 01:42:11 PM
This is probably the most likely scenario:
(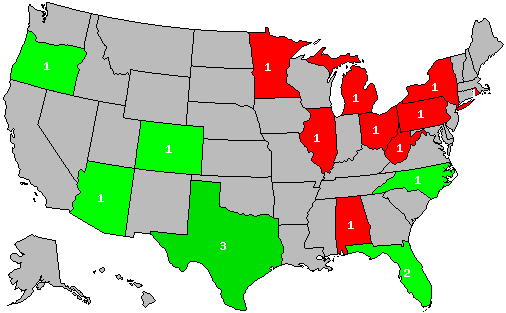 )
)
(
Title: Re: Census population estimates 2011-2019
Post by: muon2 on March 25, 2018, 01:42:15 PM
()
I threw 2017 estimates into an apportionment calculator and displayed the changes. Note that the total seats calculated was 436, one more than the total.
I threw 2017 estimates into an apportionment calculator and displayed the changes. Note that the total seats calculated was 436, one more than the total.
Why the increase to 436, unless it's to give one to DC?
Title: Re: Census population estimates 2011-2019
Post by: America Needs a 13-6 Progressive SCOTUS on March 25, 2018, 02:35:26 PM
()
I threw 2017 estimates into an apportionment calculator and displayed the changes. Note that the total seats calculated was 436, one more than the total.
I threw 2017 estimates into an apportionment calculator and displayed the changes. Note that the total seats calculated was 436, one more than the total.
Why the increase to 436, unless it's to give one to DC?
The apportionment calculator is weird. Sometimes, it has either a few more representatives apportioned than it is supposed to have, or a few less. So the increase was a result of imperfect calculator math.
Title: Re: Census population estimates 2011-2019
Post by: jimrtex on March 25, 2018, 05:14:37 PM
()
I threw 2017 estimates into an apportionment calculator and displayed the changes. Note that the total seats calculated was 436, one more than the total.
I threw 2017 estimates into an apportionment calculator and displayed the changes. Note that the total seats calculated was 436, one more than the total.
Why the increase to 436, unless it's to give one to DC?
The extra seat is NY (-1).
Title: Re: Census population estimates 2011-2019
Post by: Torie on March 28, 2018, 11:30:10 AM
I see that the growth of NYC has come to a grinding halt, with a 7,272 increase from 7-1-16 to 7-1-17 (with the formally relatively dynamic Brooklyn having lost 2,088, perhaps as the worst ratio of income to housing prices in the nation begins to bite). Every county in the state now has a substantially stagnant population. The NYC metro area as defined by Jimrtex drops from 17.92 seats to 17.88 seats as a projection to 2020.
Title: Re: Census population estimates 2011-2019
Post by: Tintrlvr on March 28, 2018, 03:18:48 PM
I see that the growth of NYC has come to a grinding halt, with a 7,272 increase from 7-1-16 to 7-1-17 (with the formally relatively dynamic Brooklyn having lost 2,088, perhaps as the worst ratio of income to housing prices in the nation begins to bite). Every county in the state now has a substantially stagnant population. The NYC metro area as defined by Jimrtex drops from 17.92 seats to 17.88 seats as a projection to 2020.
"Brooklyn" being dynamic was always false. There are large areas of Brooklyn that are nothing like the stereotypes.
All of the population loss in going to be in poor areas in the east and southeast of Brooklyn that remain very inexpensive and certainly not dynamic. The expensive, dynamic parts of Brooklyn in the north and northeast will still have seen gains (perhaps slower ones, but probably not - new construction continues apace in the boom areas of Downtown Brooklyn, Williamsburg, etc. and is the main driver of population growth). The middle-class areas in the south and southwest will probably also have seen some gains, as elderly people living alone are replaced by recent immigrants and ultra-Orthodox Jews, in both cases, with children.
Title: Re: Census population estimates 2011-2019
Post by: The Mikado on March 28, 2018, 03:42:37 PM
TX's new House map is going to be insane. TX-26 and TX-24 will have to be much smaller physically with the way the area northwest of Dallas is growing.
Title: Re: Census population estimates 2011-2019
Post by: Cokeland Saxton on March 28, 2018, 06:49:46 PM
The districts in Miami Metro, FL will likely be squished even smaller too, if the state gains two seats. The Miami metro is growing substantially, as is the Orlando metro. Hillsborough County (part of Tampa metro) too.
Title: Re: Census population estimates 2011-2019
Post by: Kevinstat on May 05, 2018, 09:35:54 AM
Does anyone know when this month the City and Town (incorporated places and I believe all census-designated "county subdivisions", which are generally the same thing in New England) estimates for July 1, 2017 will be released?
Title: Re: Census population estimates 2011-2019
Post by: Torie on May 05, 2018, 10:07:27 AM
You probably already knew this, but sometime this month (https://www.census.gov/programs-surveys/popest/about/schedule.html). Last year, it was May 23 (https://uselectionatlas.org/FORUM/index.php?topic=166668.msg5663149#msg5663149).
Title: Re: Census population estimates 2011-2019
Post by: jimrtex on May 05, 2018, 05:38:08 PM
Does anyone know when this month the City and Town (incorporated places and I believe all census-designated "county subdivisions", which are generally the same thing in New England) estimates for July 1, 2017 will be released?
In practice these are the minor civil divisions in 20 of the 21 states in the Northeast and Midwest divisions (all except Iowa). These are the areas where minor civil divisions (towns and townships) typically have functioning governments.
There are another eight states where there are minor civil divisions recognized by the Census Bureau (and delineated by the state). In some cases, these are used because there are advantages when applying for federal grants.
In another 20 states, the Census Bureau has defined Census County Divisions, which permits the census bureau to present some data at a level equivalent to MCD in other states. Through 1950, the Census Bureau treated all counties as having MCD, though these were often temporary such as election precincts, or electoral districts. CCD are a way to provide statistical consistency from decade to decade, but in practical terms are useless.
In Alaska, the Census Bureau has defined Census Areas and Census Subareas in areas of the state with no local government (the Unorganized Borough). These serve as county equivalents and county subdivisions.
Title: Re: Census population estimates 2011-2019
Post by: DINGO Joe on May 06, 2018, 12:20:06 AM
You probably already knew this, but sometime this month (https://www.census.gov/programs-surveys/popest/about/schedule.html). Last year, it was May 23 (https://uselectionatlas.org/FORUM/index.php?topic=166668.msg5663149#msg5663149).
It looks like the 24th
https://www.calendarwiz.com/calendars/calendar.php?crd=cens1sample&PHPSESSID=1376188eb446e0e6b8ec05b90f763b0f&jsenabled=1&winH=424
Title: Re: Census population estimates 2011-2019
Post by: Kevinstat on May 06, 2018, 08:45:58 AM
In practice these are the minor civil divisions in 20 of the 21 states in the Northeast and Midwest divisions (all except Iowa). These are the areas where minor civil divisions (towns and townships) typically have functioning governments.
There are another eight states where there are minor civil divisions recognized by the Census Bureau (and delineated by the state). In some cases, these are used because there are advantages when applying for federal grants.
In another 20 states, the Census Bureau has defined Census County Divisions, which permits the census bureau to present some data at a level equivalent to MCD in other states. Through 1950, the Census Bureau treated all counties as having MCD, though these were often temporary such as election precincts, or electoral districts. CCD are a way to provide statistical consistency from decade to decade, but in practical terms are useless.
In Alaska, the Census Bureau has defined Census Areas and Census Subareas in areas of the state with no local government (the Unorganized Borough). These serve as county equivalents and county subdivisions.
Title: Re: Census population estimates 2011-2019
Post by: cinyc on May 06, 2018, 01:26:22 PM
You probably already knew this, but sometime this month (https://www.census.gov/programs-surveys/popest/about/schedule.html). Last year, it was May 23 (https://uselectionatlas.org/FORUM/index.php?topic=166668.msg5663149#msg5663149).
It looks like the 24th
https://www.calendarwiz.com/calendars/calendar.php?crd=cens1sample&PHPSESSID=1376188eb446e0e6b8ec05b90f763b0f&jsenabled=1&winH=424
It's almost always the Thursday before Memorial Day weekend. That usually gives me the weekend to make my population change map. Now that I'm a little more adept with QGIS, I might have a quicker turnaround.
Title: Re: Census population estimates 2011-2019
Post by: jimrtex on May 06, 2018, 08:32:22 PM
In practice these are the minor civil divisions in 20 of the 21 states in the Northeast and Midwest divisions (all except Iowa). These are the areas where minor civil divisions (towns and townships) typically have functioning governments.
There are another eight states where there are minor civil divisions recognized by the Census Bureau (and delineated by the state). In some cases, these are used because there are advantages when applying for federal grants.
In another 20 states, the Census Bureau has defined Census County Divisions, which permits the census bureau to present some data at a level equivalent to MCD in other states. Through 1950, the Census Bureau treated all counties as having MCD, though these were often temporary such as election precincts, or electoral districts. CCD are a way to provide statistical consistency from decade to decade, but in practical terms are useless.
In Alaska, the Census Bureau has defined Census Areas and Census Subareas in areas of the state with no local government (the Unorganized Borough). These serve as county equivalents and county subdivisions.
There are another eight states where there are minor civil divisions recognized by the Census Bureau (and delineated by the state). In some cases, these are used because there are advantages when applying for federal grants.
In another 20 states, the Census Bureau has defined Census County Divisions, which permits the census bureau to present some data at a level equivalent to MCD in other states. Through 1950, the Census Bureau treated all counties as having MCD, though these were often temporary such as election precincts, or electoral districts. CCD are a way to provide statistical consistency from decade to decade, but in practical terms are useless.
In Alaska, the Census Bureau has defined Census Areas and Census Subareas in areas of the state with no local government (the Unorganized Borough). These serve as county equivalents and county subdivisions.
Northeast (9) + Midwest (12) + Southeast (8) = Minor Civil Division (29)
Southeast (8) + West (12) = Census County Division (20)
Wesr (1, Alaska) = Census Subarea (1)
Census Estimates: Northeast(9) + Midwest (11, all bu Iowa) = Estimates (20)
Title: Re: Census population estimates 2011-2019
Post by: The Free North on May 12, 2018, 06:46:04 PM
Technology will mitigate this but 2020 may be the last census in which the sun belt gains significantly from the north due to climate change and natural disasters.
This might be the dumbest thing i've read all year.
Title: Re: Census population estimates 2011-2019
Post by: jamestroll on May 13, 2018, 03:03:18 AM
Technology will mitigate this but 2020 may be the last census in which the sun belt gains significantly from the north due to climate change and natural disasters.
This might be the dumbest thing i've read all year.
Lol
Title: Re: Census population estimates 2011-2019
Post by: Brittain33 on May 14, 2018, 02:08:59 AM
Technology will mitigate this but 2020 may be the last census in which the sun belt gains significantly from the north due to climate change and natural disasters.
This might be the dumbest thing i've read all year.
In what year do you predict that climate change and sea level rise will turn on Miami and the rest of south Florida? It is only a matter of time, and Miami Beach is already starting to have problems. The end will start not with a major disaster, but with a collapse in real estate when banks refuse to write mortgages on properties.
Title: Re: Census population estimates 2011-2019
Post by: America Needs a 13-6 Progressive SCOTUS on May 15, 2018, 03:52:10 PM
(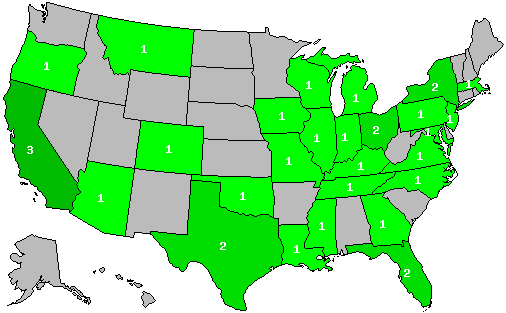 )
)
Posting a map of the next 24 seats that would have been awarded in 2010 apportionment if the House size was larger because why not?
Posting a map of the next 24 seats that would have been awarded in 2010 apportionment if the House size was larger because why not?
Title: Re: Census population estimates 2011-2019
Post by: Torie on May 18, 2018, 05:32:54 AM
May 24 is the date (https://www.census.gov/newsroom/press-releases/2018/estimates-advisory.html) that the masses get to see the locality population estimates.
Title: Re: Census population estimates 2011-2019
Post by: cinyc on May 19, 2018, 08:48:19 PM
May 24 is the date (https://www.census.gov/newsroom/press-releases/2018/estimates-advisory.html) that the masses get to see the locality population estimates.
12:01AM, to be exact. Last year, I think we had to wait until the morning, around 10AM for the actual data. We still might have to this year.
I probably should start updating my shapefiles so I can update the pop estimate maps. The 2016 series is still available on Carto here, for now:
https://cinyc.carto.com/viz/2179fb11-c942-4958-b0e8-147324cb395a/public_map (2016 estimate vs the 2010 Estimates Base).
The 2016 series won't be around after Thursday. I'm going to have to nuke it to make space in my Carto account for the 2017 maps.
Title: Re: Census population estimates 2011-2019
Post by: cinyc on May 23, 2018, 06:22:32 PM
A little under 5 hours until we start getting reports about the fastest-growing incorporated places. Any last guesses as to what was the fastest-growing city with over 10,000 people last year? Will Williston, ND make the list of the biggest percentage losers?
Title: Re: Census population estimates 2011-2019
Post by: cinyc on May 23, 2018, 11:15:03 PM
The list of the fastest-growing cities is out.
The top 10 % gainers (50K+ pop):
1. Frisco, Texas 8.2%
2. New Braunfels, Texas 8.0%
3. Pflugerville, TX 6.5%
4. Ankeny, IA 6.4%
5. Buckeye, AZ 5.9%
6. Georgetown, Texas 5.4%
7. Castle Rock, Colorado 5.1%
8. Franklin, Tennessee 4.9%
9. McKinney, Texas 4.8%
10. Meridian, Idaho 4.7%
The top numerical gainers were San Antonio, Phoenix, Dallas, Fort Worth and Los Angeles.
Fort Worth passed Indianapolis to become the 15th largest city.
More here: https://www.census.gov/newsroom/press-releases/2018/estimates-cities.html
As expected, full data won't be available until morning, supposedly before 10AM.
Title: Re: Census population estimates 2011-2019
Post by: Seattle on May 24, 2018, 12:28:47 AM
And Seattle (+17,500)! Probably one more year of frenzied growth and then both numeric and percentage growth will nosedive like once white hot Austin, Denver, and DC. I guess percentage growth already is.
Title: Re: Census population estimates 2011-2019
Post by: Brittain33 on May 24, 2018, 11:40:57 AM
Random interesting fact: Youngstown, Ohio recorded a gain for the first time since the early days of the Baby Boom.
Title: Re: Census population estimates 2011-2019
Post by: cinyc on May 24, 2018, 04:28:22 PM
Here's the first set of this year's interactive maps:
2016-2017 Percentage Change in Incorporated Places & County Remainders (https://cinyc.carto.com/viz/56f61e01-7dd8-40f1-bc79-12fd82415387/public_map)
2010 Estimates Base - 2017 Percentage Change in Incorporated Places & County Remainders (https://cinyc.carto.com/viz/e9a41c64-c834-4ae6-b09a-a0dd5fa52199/public_map) (takes into account annexations and the like)
2010 Census - 2017 Percentage Change in Incorporated Places & County Remainders (https://cinyc.carto.com/viz/ebd57bde-f085-4376-8dbc-7b8951f24390/public_map)
Title: Re: Census population estimates 2011-2019
Post by: Cokeland Saxton on May 24, 2018, 07:48:21 PM
Charlotte, NC will probably pass Indianapolis next year:
Charlotte: 731,424 (census)/735,688 (est. base 2010) --> 842,051 (2016) --> 859,035 (2017)
Indianapolis: 820,445 (census)/820,443 (est. base 2010) --> 855,164 (2016) -->863,002 (2017)
Charlotte gained 16,984 (+2.02%) last year vs. Indianapolis's gain of just 7,838 (+0.92%).
Although we can't predict what will happen exactly, if both cities maintain their 16-17 growth rate:
Charlotte 2018: 876,662
Indianapolis 2018: 870,911
So unless something crazy happens, Indianapolis will most likely drop to #17 in for 2018.
On a different note, my hometown of Elkhart, IN (52,558 in 2017) started growing again after getting screwed by a housing shortage. :D
Also, Austin, TX's growth slowed dramatically, wow.
Other random facts that occurred last year:
Chicago gained about 12k
The unthinkable happened: Detroit grew
Salt Lake city Joined the 200k club
Denver hit 700k
Cincinnati is back over 300k
Akron grew
That's enough for now.
Title: Re: Census population estimates 2011-2019
Post by: cinyc on May 24, 2018, 10:47:18 PM
Charlotte, NC will probably pass Indianapolis next year:
Charlotte: 731,424 (census)/735,688 (est. base 2010) --> 842,051 (2016) --> 859,035 (2017)
Indianapolis: 820,445 (census)/820,443 (est. base 2010) --> 855,164 (2016) -->863,002 (2017)
Charlotte gained 16,984 (+2.02%) last year vs. Indianapolis's gain of just 7,838 (+0.92%).
Although we can't predict what will happen exactly, if both cities maintain their 16-17 growth rate:
Charlotte 2018: 876,662
Indianapolis 2018: 870,911
So unless something crazy happens, Indianapolis will most likely drop to #17 in for 2018.
On a different note, my hometown of Elkhart, IN (52,558 in 2017) started growing again after getting screwed by a housing shortage. :D
Also, Austin, TX's growth slowed dramatically, wow.
Other random facts that occurred last year:
Chicago gained about 12k
The unthinkable happened: Detroit grew
Salt Lake city Joined the 200k club
Denver hit 700k
Cincinnati is back over 300k
Akron grew
That's enough for now.
Charlotte: 731,424 (census)/735,688 (est. base 2010) --> 842,051 (2016) --> 859,035 (2017)
Indianapolis: 820,445 (census)/820,443 (est. base 2010) --> 855,164 (2016) -->863,002 (2017)
Charlotte gained 16,984 (+2.02%) last year vs. Indianapolis's gain of just 7,838 (+0.92%).
Although we can't predict what will happen exactly, if both cities maintain their 16-17 growth rate:
Charlotte 2018: 876,662
Indianapolis 2018: 870,911
So unless something crazy happens, Indianapolis will most likely drop to #17 in for 2018.
On a different note, my hometown of Elkhart, IN (52,558 in 2017) started growing again after getting screwed by a housing shortage. :D
Also, Austin, TX's growth slowed dramatically, wow.
Other random facts that occurred last year:
Chicago gained about 12k
The unthinkable happened: Detroit grew
Salt Lake city Joined the 200k club
Denver hit 700k
Cincinnati is back over 300k
Akron grew
That's enough for now.
I think Detroit grew because Census back-upgraded its prior year estimates, as it's been known to do. Detroit's population actually fell from this year's 2017 to 2016 estimates.
Indianapolis fell behind Fort Worth this year to end up out of the top 15.
Title: Re: Census population estimates 2011-2019
Post by: KingSweden on May 24, 2018, 11:19:14 PM
In a few years Columbus will be bigger than SF
Title: Re: Census population estimates 2011-2019
Post by: Cokeland Saxton on May 25, 2018, 08:54:01 AM
In a few years Columbus will be bigger than SF
Title: Re: Census population estimates 2011-2019
Post by: DINGO Joe on May 25, 2018, 10:34:33 AM
Very competitive race to be the largest city in WV as Charleston and Huntington both continue to run into reverse. Charleston continues to lead 47900 to 47100 but Charleston lost 800 vs a 500 loss for Huntington last year.
Title: Re: Census population estimates 2011-2019
Post by: DINGO Joe on May 28, 2018, 12:44:52 PM
Something I just figured out, if a state or federal prison opens in a county after the 2010 census, then it doesn't get incorporated into census estimates for the rest of the decade. It's easy to see the demographic impact prisons have on small counties like Gilmer and Summers, WV and Bland, VA and since those prisons existed in the 2010 Census they're captured going forward, but for prisons opened in McDowell WV and Grayson VA after the 2010 census they never show up in Census estimates or American Community Survey data until I guess the Official 2020 Census.
Title: Re: Census population estimates 2011-2019
Post by: Storebought on May 28, 2018, 01:09:29 PM
When do you think San Antonio will replace Philadelphia as the sixth largest city? It has to be within months.
Title: Re: Census population estimates 2011-2019
Post by: Tintrlvr on May 28, 2018, 01:25:30 PM
Charlotte, NC will probably pass Indianapolis next year:
Charlotte: 731,424 (census)/735,688 (est. base 2010) --> 842,051 (2016) --> 859,035 (2017)
Indianapolis: 820,445 (census)/820,443 (est. base 2010) --> 855,164 (2016) -->863,002 (2017)
Charlotte gained 16,984 (+2.02%) last year vs. Indianapolis's gain of just 7,838 (+0.92%).
Although we can't predict what will happen exactly, if both cities maintain their 16-17 growth rate:
Charlotte 2018: 876,662
Indianapolis 2018: 870,911
So unless something crazy happens, Indianapolis will most likely drop to #17 in for 2018.
On a different note, my hometown of Elkhart, IN (52,558 in 2017) started growing again after getting screwed by a housing shortage. :D
Also, Austin, TX's growth slowed dramatically, wow.
Other random facts that occurred last year:
Chicago gained about 12k
The unthinkable happened: Detroit grew
Salt Lake city Joined the 200k club
Denver hit 700k
Cincinnati is back over 300k
Akron grew
That's enough for now.
Charlotte: 731,424 (census)/735,688 (est. base 2010) --> 842,051 (2016) --> 859,035 (2017)
Indianapolis: 820,445 (census)/820,443 (est. base 2010) --> 855,164 (2016) -->863,002 (2017)
Charlotte gained 16,984 (+2.02%) last year vs. Indianapolis's gain of just 7,838 (+0.92%).
Although we can't predict what will happen exactly, if both cities maintain their 16-17 growth rate:
Charlotte 2018: 876,662
Indianapolis 2018: 870,911
So unless something crazy happens, Indianapolis will most likely drop to #17 in for 2018.
On a different note, my hometown of Elkhart, IN (52,558 in 2017) started growing again after getting screwed by a housing shortage. :D
Also, Austin, TX's growth slowed dramatically, wow.
Other random facts that occurred last year:
Chicago gained about 12k
The unthinkable happened: Detroit grew
Salt Lake city Joined the 200k club
Denver hit 700k
Cincinnati is back over 300k
Akron grew
That's enough for now.
I think Detroit grew because Census back-upgraded its prior year estimates, as it's been known to do. Detroit's population actually fell from this year's 2017 to 2016 estimates.
Indianapolis fell behind Fort Worth this year to end up out of the top 15.
Which has quite a history in particular in connection with Detroit, as constant revisions upward to the estimates at the request of local government were proven to be completely unfounded when the population collapsed at the 2010 Census compared to the 2009 ACS estimates. 2020 will probably be similar, if less extreme, and show a continued substantial decline.
Title: Re: Census population estimates 2011-2019
Post by: jimrtex on May 28, 2018, 02:42:43 PM
Something I just figured out, if a state or federal prison opens in a county after the 2010 census, then it doesn't get incorporated into census estimates for the rest of the decade. It's easy to see the demographic impact prisons have on small counties like Gilmer and Summers, WV and Bland, VA and since those prisons existed in the 2010 Census they're captured going forward, but for prisons opened in McDowell WV and Grayson VA after the 2010 census they never show up in Census estimates or American Community Survey data until I guess the Official 2020 Census.
I think that they do. The new unit in Grayson VA opened in September 2013. The estimates are as of July 1. There were population drops before 2014, and after 2014 that makes it look constant.
In a rural area, a prison might not attract workers into the county, since they can easily commute.
Census 2010 15533
Estimate 2010 15498
Estimate 2011 15366
Estimate 2012 15143
Estimate 2013 15131
Estimate 2014 15921
Estimate 2015 15953
Estimate 2016 15869
Estimate 2017 15665
Title: Re: Census population estimates 2011-2019
Post by: Cokeland Saxton on May 28, 2018, 02:44:38 PM
When do you think San Antonio will replace Philadelphia as the sixth largest city? It has to be within months.
Title: Re: Census population estimates 2011-2019
Post by: DINGO Joe on May 29, 2018, 01:22:35 AM
Something I just figured out, if a state or federal prison opens in a county after the 2010 census, then it doesn't get incorporated into census estimates for the rest of the decade. It's easy to see the demographic impact prisons have on small counties like Gilmer and Summers, WV and Bland, VA and since those prisons existed in the 2010 Census they're captured going forward, but for prisons opened in McDowell WV and Grayson VA after the 2010 census they never show up in Census estimates or American Community Survey data until I guess the Official 2020 Census.
I think that they do. The new unit in Grayson VA opened in September 2013. The estimates are as of July 1. There were population drops before 2014, and after 2014 that makes it look constant.
In a rural area, a prison might not attract workers into the county, since they can easily commute.
Census 2010 15533
Estimate 2010 15498
Estimate 2011 15366
Estimate 2012 15143
Estimate 2013 15131
Estimate 2014 15921
Estimate 2015 15953
Estimate 2016 15869
Estimate 2017 15665
Well, I've been using American Fact Finder, specifically via this link
https://business.wvu.edu/centers/bureau-of-business-and-economic-research/data/population-data
And then under the annual estimates of WV counties, I'll click on option 3 or 4 which gives me year by year table with gender or race options. To look at another states counties I'll just use the add geographies button. The population estimates for Grayson don't match the ones you have listed and as far as gender is concerned there not the sudden addition of 1000 males at any point. Same for McDowell.
Also, if I use US census quickfacts it gives me a 2016 estimate of 15107 for Grayson and a 15665 estimate for 2017 (which is an odd increase)
https://www.census.gov/quickfacts/fact/table/graysoncountyvirginia,blandcountyvirginia,gilmercountywestvirginia,mcdowellcountywestvirginia,WV,US/RHI225216
Why are our databases not matching?
Title: Re: Census population estimates 2011-2019
Post by: DINGO Joe on May 29, 2018, 09:29:22 AM
I guess it's possible that the Census did a complete revision for Grayson with this year's estimate and it will all show up when the Gender and Race data are released in June. Still don't see any indication that the Fed prison in McDowell that opened in the fall of 2010 was ever acknowledged.
Title: Re: Census population estimates 2011-2019
Post by: jimrtex on June 01, 2018, 08:27:55 PM
Something I just figured out, if a state or federal prison opens in a county after the 2010 census, then it doesn't get incorporated into census estimates for the rest of the decade. It's easy to see the demographic impact prisons have on small counties like Gilmer and Summers, WV and Bland, VA and since those prisons existed in the 2010 Census they're captured going forward, but for prisons opened in McDowell WV and Grayson VA after the 2010 census they never show up in Census estimates or American Community Survey data until I guess the Official 2020 Census.
I think that they do. The new unit in Grayson VA opened in September 2013. The estimates are as of July 1. There were population drops before 2014, and after 2014 that makes it look constant.
In a rural area, a prison might not attract workers into the county, since they can easily commute.
Census 2010 15533
Estimate 2010 15498
Estimate 2011 15366
Estimate 2012 15143
Estimate 2013 15131
Estimate 2014 15921
Estimate 2015 15953
Estimate 2016 15869
Estimate 2017 15665
Well, I've been using American Fact Finder, specifically via this link
https://business.wvu.edu/centers/bureau-of-business-and-economic-research/data/population-data
And then under the annual estimates of WV counties, I'll click on option 3 or 4 which gives me year by year table with gender or race options. To look at another states counties I'll just use the add geographies button. The population estimates for Grayson don't match the ones you have listed and as far as gender is concerned there not the sudden addition of 1000 males at any point. Same for McDowell.
Also, if I use US census quickfacts it gives me a 2016 estimate of 15107 for Grayson and a 15665 estimate for 2017 (which is an odd increase)
https://www.census.gov/quickfacts/fact/table/graysoncountyvirginia,blandcountyvirginia,gilmercountywestvirginia,mcdowellcountywestvirginia,WV,US/RHI225216
Why are our databases not matching?
For Grayson, the 2015 and 2017 estimates (but not the 2016 vintage) show the step up in 2014.
The components of change are issued each year. They include births and deaths, which have reasonable reporting - but may be misattributed based on place of birth or death being in a different county. Migration is inferred based on Social Security and IRS records. But these don't work for prison populations, since inmates may not have tax liabilities. And while they might show up as moving into a different county after release, it won't show up in the prison county.
I don't know how they handle estimates for institutional population. Probably not that well because it would require a lot of individualized handling (you can's simply feed the IRS and Social Security data into the estimates).
The ACS for Grayson does show an increase in group quarters. The ACS is based on a sample over 5-years. Housing units are assigned to 5 groups so that no household will be surveyed twice in a 5-year period. Each year, roughly one in six housing units for that year's group will be selected randomly, and assigned to one month. Over a five-year period, about 1/6 pf housing units will be surveyed, sufficient for statistically meaningful estimates for block groups. The next year, they throw out the results from the first year, and add in the results for the next year.
When the Census Bureau becomes aware of new housing units they are added in.
For group quarters, they survey chunks of 15 residents. Let's say a prison has 600 inmates, then it will have 40 chunks of 15 (the chunk of 15 does not correspond to any individual inmate or cell). The 40 chunks would be assigned to the 5 year groups (8 per year). Then the number of chunks to be surveyed each year would be determined and assigned to a month. When they make a survey, they get a list of inmates, and randomly select 15.
Under the best of circumstances the ACS will lag population growth since it assumes that there is no change over time, and there were zero population for some of the years in the average.
For McDowell, and the Federal Correctional Institution there has been a definite increase in the group quarters population, and it also shows up in one census tract and city data for Welch (the prison is inside the city limits)..
For Grayson, it only shows up for 2015 and 2016. The 2016 has the correct census tract. It is possible that the Census Bureau was not aware of the prison. This might have to be relayed through some state bureaucracies. River North did not open until fall of 2013. It would not be surprising if a prison opened with lots of guards and few inmates. Rookie guards would not be able to handle the ordinary number of inmates, and you might not want to move a full prison population. If an average sentence is five years (made up number), you could just let the prison fill with new offenders over time.
Title: Re: Census population estimates 2011-2019
Post by: DINGO Joe on June 03, 2018, 02:16:48 PM
Well, to make things more complicated a state prison opened up in Welch in the late 2000s. At this point there should be about 1700 federal and state prisoners in McDowell County and yes they all should be in Welch. In fact, the population at the Federal Prison reached as high as 1660 before sentencing reform brought it down to around 1250 today.
Title: Re: Census population estimates 2011-2019
Post by: danny on June 03, 2018, 07:06:33 PM
These yearly estimates don't seem to even account all of the regular housing. for example based on this article (https://forward.com/news/357030/how-the-hasids-won-the-battle-of-bloomingburg-and-everyone-else-lost/), Bloomingburg, NY must have about doubled in population, but the census bureau shows no change.
Title: Re: Census population estimates 2011-2019
Post by: jimrtex on June 04, 2018, 04:26:42 AM
These yearly estimates don't seem to even account all of the regular housing. for example based on this article (https://forward.com/news/357030/how-the-hasids-won-the-battle-of-bloomingburg-and-everyone-else-lost/), Bloomingburg, NY must have about doubled in population, but the census bureau shows no change.
Title: Re: Census population estimates 2011-2019
Post by: Tintrlvr on June 16, 2018, 03:43:34 PM
These yearly estimates don't seem to even account all of the regular housing. for example based on this article (https://forward.com/news/357030/how-the-hasids-won-the-battle-of-bloomingburg-and-everyone-else-lost/), Bloomingburg, NY must have about doubled in population, but the census bureau shows no change.
Yes, the estimates are notoriously bad at tracking new housing development, as well as abandonment of existing housing, especially when it's outside of historical patterns. They shouldn't really be taken all that seriously at a micro level as a result.
Edit: Although that development seems to be outside of Bloomingburg village proper when you look at Google Maps. Though the Census says Mamakating town, where it is located, has *lost* population, which seems deeply unlikely.
Title: Re: Census population estimates 2011-2019
Post by: America Needs a 13-6 Progressive SCOTUS on August 22, 2018, 07:38:14 PM
So I just calculated the likely changes in 2020 apportionment:
(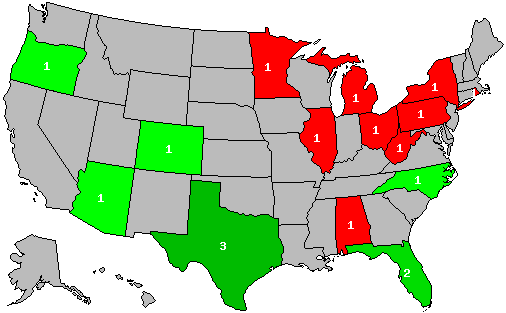 )
)
(
Title: Re: Census population estimates 2011-2019
Post by: America Needs a 13-6 Progressive SCOTUS on August 22, 2018, 07:45:55 PM
Just for fun, this is what would happen if they non-retroactively reinstated the no states can lose a seat rule for 2020:
(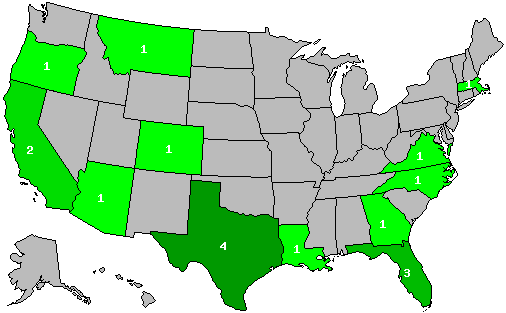 )
)
It increases the House size by 18.
(
It increases the House size by 18.
Title: Re: Census population estimates 2011-2019
Post by: America Needs a 13-6 Progressive SCOTUS on August 22, 2018, 07:55:06 PM
For reference, this is my state by state population projection:
CA 40402290
TX 29502646
FL 21811223
NY 20028164
PA 12844485
IL 12790817
OH 11704839
GA 10710330
NC 10553235
MI 09991966
NJ 09086699
VA 08647908
WA 07664128
AZ 07252945
MA 06978168
TN 06856211
IN 06736115
MO 06160797
MD 06157766
WI 05836522
CO 05826331
MN 05680037
SC 05175709
AL 04910634
LA 04741554
KY 04497752
OR 04261009
OK 03998861
CT 03593521
UT 03230019
IA 03183203
NV 03110826
AR 03037752
MS 02990168
KS 02935879
NM 02099018
NE 01955636
WV 01801766
ID 01773571
HI 01453042
NH 01352784
ME 01338769
MT 01073661
RI 01062178
DE 00986216
SD 00890706
ND 00786803
AK 00751002
VT 00622867
WY 00585213
Title: Re: Census population estimates 2011-2019
Post by: jimrtex on August 23, 2018, 04:35:10 AM
Just for fun, this is what would happen if they non-retroactively reinstated the no states can lose a seat rule for 2020:
()
It increases the House size by 18.
(
It increases the House size by 18.
Title: Re: Census population estimates 2011-2019
Post by: muon2 on August 23, 2018, 04:11:34 PM
Probably not so extreme as one thinks, and the House chamber could accommodate 600 based on discussions I had when visiting there 20 years ago.
Title: Re: Census population estimates 2011-2019
Post by: jimrtex on August 25, 2018, 01:36:14 AM
Probably not so extreme as one thinks, and the House chamber could accommodate 600 based on discussions I had when visiting there 20 years ago.
Iowa has gone from 11 to 4, North Dakota from 3 to 1, and Vermont from 6 to 1.
In general the increase would be proportional to the rate of gain of the US minus the growth rate of the slowest growing (fastest declining) state. So perhaps 45 to 50 per decade.
If the proposed rule had first been applied in 2010, what would the size of the House been in 2010, and what would it be in 2020 if the procedure had been retained?
Title: Re: Census population estimates 2011-2019
Post by: muon2 on August 25, 2018, 09:50:49 AM
Probably not so extreme as one thinks, and the House chamber could accommodate 600 based on discussions I had when visiting there 20 years ago.
Iowa has gone from 11 to 4, North Dakota from 3 to 1, and Vermont from 6 to 1.
In general the increase would be proportional to the rate of gain of the US minus the growth rate of the slowest growing (fastest declining) state. So perhaps 45 to 50 per decade.
If the proposed rule had first been applied in 2010, what would the size of the House been in 2010, and what would it be in 2020 if the procedure had been retained?
We had a thread last May on this topic on another board where we went back to the 1929 decision to fix the size at 435. I made a series of maps (https://uselectionatlas.org/FORUM/index.php?topic=290129.msg6186768#msg6186768) based on the rule that the size was the minimum needed so that no state lost a seat.
1920: 435
1930: 537 +23.4% (the Great Migration to the northern cities fueled this increase)
1940: 586 +9.1%
1950: 642 +9.6% (the 1947 act included the provision that states that lost population could lose seats)
1960: 737 +14.8%
1970: 797 +8.1%
1980: 885 +11.0%
1990: 971 +9.7%
2000: 1068 +10.0%
2010: 1140 +6.7%
Title: Re: Census population estimates 2011-2019
Post by: Virginiá on October 01, 2018, 02:19:02 PM
DailyKos post about changes in CDs:
https://www.dailykos.com/stories/2018/9/30/1799118/-Which-congressional-districts-are-growing-or-shrinking-the-fastest
https://www.dailykos.com/stories/2018/9/30/1799118/-Which-congressional-districts-are-growing-or-shrinking-the-fastest
Title: Re: Census population estimates 2011-2019
Post by: Cokeland Saxton on October 25, 2018, 02:18:34 PM
The release date is not yet in stone, but the national and state-level projections for 2018 will be out in a couple months. What do you guys think the US population will be?
My guess is 327,999,212
My guess is 327,999,212
Title: Re: Census population estimates 2011-2019
Post by: Storr on October 25, 2018, 06:24:46 PM
For reference, this is my state by state population projection:
CA 40402290
TX 29502646
FL 21811223
NY 20028164
PA 12844485
IL 12790817
OH 11704839
GA 10710330
NC 10553235
MI 09991966
NJ 09086699
VA 08647908
WA 07664128
AZ 07252945
MA 06978168
TN 06856211
IN 06736115
MO 06160797
MD 06157766
WI 05836522
CO 05826331
MN 05680037
SC 05175709
AL 04910634
LA 04741554
KY 04497752
OR 04261009
OK 03998861
CT 03593521
UT 03230019
IA 03183203
NV 03110826
AR 03037752
MS 02990168
KS 02935879
NM 02099018
NE 01955636
WV 01801766
ID 01773571
HI 01453042
NH 01352784
ME 01338769
MT 01073661
RI 01062178
DE 00986216
SD 00890706
ND 00786803
AK 00751002
VT 00622867
WY 00585213
CA 40402290
TX 29502646
FL 21811223
NY 20028164
PA 12844485
IL 12790817
OH 11704839
GA 10710330
NC 10553235
MI 09991966
NJ 09086699
VA 08647908
WA 07664128
AZ 07252945
MA 06978168
TN 06856211
IN 06736115
MO 06160797
MD 06157766
WI 05836522
CO 05826331
MN 05680037
SC 05175709
AL 04910634
LA 04741554
KY 04497752
OR 04261009
OK 03998861
CT 03593521
UT 03230019
IA 03183203
NV 03110826
AR 03037752
MS 02990168
KS 02935879
NM 02099018
NE 01955636
WV 01801766
ID 01773571
HI 01453042
NH 01352784
ME 01338769
MT 01073661
RI 01062178
DE 00986216
SD 00890706
ND 00786803
AK 00751002
VT 00622867
WY 00585213
Delaware is getting oh so close to 1,000,000!
Title: Re: Census population estimates 2011-2019
Post by: Cokeland Saxton on October 31, 2018, 02:10:48 PM
My predictions:
California will hit 40 million (only a few hundred k away)
Nevada will hit 3 million (already right there) and pass Arkansas to become the 32nd most populous state.
Utah will pass Iowa to become the 30th most populous state
Montana will pass Rhode Island to become the 43rd most populous state
California will hit 40 million (only a few hundred k away)
Nevada will hit 3 million (already right there) and pass Arkansas to become the 32nd most populous state.
Utah will pass Iowa to become the 30th most populous state
Montana will pass Rhode Island to become the 43rd most populous state
Title: Re: Census population estimates 2011-2019
Post by: DINGO Joe on December 19, 2018, 11:44:21 AM
US Estimate for 2018 is 327,167,434 which is only 1.4 million above last years estimate, but they decreased the 2017 estimate by 600.000 creating a 2.0 million yoy increase.
Not surprising given the declining number of births and steady increase in deaths as boomers age. 8 states lost population--IL, NY, CN, WV, LA, MS, WY, AK maybe more if try to adjust for 2017 original estimates
https://www.census.gov/data/tables/time-series/demo/popest/2010s-national-total.html
Not surprising given the declining number of births and steady increase in deaths as boomers age. 8 states lost population--IL, NY, CN, WV, LA, MS, WY, AK maybe more if try to adjust for 2017 original estimates
https://www.census.gov/data/tables/time-series/demo/popest/2010s-national-total.html
Title: Re: Census population estimates 2011-2019
Post by: DINGO Joe on December 19, 2018, 12:17:05 PM
Nevada is listed in the press release as having the largest % increase yoy (along with Idaho)--2.1%, adding 62,000 people. However, the 2017 estimate was reduced by 26,000 meaning the increase is actually only 36,000 above the original 2017 estimate.
Title: Re: Census population estimates 2011-2019
Post by: Nyvin on December 19, 2018, 12:51:25 PM
US Estimate for 2018 is 327,167,434 which is only 1.4 million above last years estimate, but they decreased the 2017 estimate by 600.000 creating a 2.0 million yoy increase.
Not surprising given the declining number of births and steady increase in deaths as boomers age. 8 states lost population--IL, NY, CN, WV, LA, MS, WY, AK maybe more if try to adjust for 2017 original estimates
https://www.census.gov/data/tables/time-series/demo/popest/2010s-national-total.html
Not surprising given the declining number of births and steady increase in deaths as boomers age. 8 states lost population--IL, NY, CN, WV, LA, MS, WY, AK maybe more if try to adjust for 2017 original estimates
https://www.census.gov/data/tables/time-series/demo/popest/2010s-national-total.html
Didn't Hawaii also lose population?
Title: Re: Census population estimates 2011-2019
Post by: DINGO Joe on December 19, 2018, 01:06:02 PM
US Estimate for 2018 is 327,167,434 which is only 1.4 million above last years estimate, but they decreased the 2017 estimate by 600.000 creating a 2.0 million yoy increase.
Not surprising given the declining number of births and steady increase in deaths as boomers age. 8 states lost population--IL, NY, CN, WV, LA, MS, WY, AK maybe more if try to adjust for 2017 original estimates
https://www.census.gov/data/tables/time-series/demo/popest/2010s-national-total.html
Not surprising given the declining number of births and steady increase in deaths as boomers age. 8 states lost population--IL, NY, CN, WV, LA, MS, WY, AK maybe more if try to adjust for 2017 original estimates
https://www.census.gov/data/tables/time-series/demo/popest/2010s-national-total.html
Didn't Hawaii also lose population?
Yeah, put Hawaii on the list. Kansas also lost population vs original 2017 estimate but with the tweak to 2017 it lost it last year and gained a little this year, subject to future tweaks.
Title: Re: Census population estimates 2011-2019
Post by: muon2 on December 19, 2018, 01:13:26 PM
Here's my annual projection from the new estimates. I used the July 2018 estimates and the April 2010 Census base to get an annual growth rate. This correctly accounts for the 8 and a quarter year period between the Census and the estimate. I then applied the annual growth rate to the 2010 reapportionment population to get the 2020 projection. This accounts for the extra overseas population used in reapportionment but not for redistricting. Ten years is a long stretch for a simple model like this, but here are the projected changes.
AL -1
AZ +1
CA -1
CO +1
FL +2
IL -1
MI -1
MN -1
MT +1
NY -1
NC +1
OH -1
OR +1
PA -1
RI -1
TX +3
WV -1
Compared to last year (https://uselectionatlas.org/FORUM/index.php?topic=166668.msg5968174#msg5968174), CA loses one and MT gains one. That is what my model based on the two years from 2015-2017 projected, so it appears that that short-term trend has continued enough to influence the whole decade. The bubble seats in this projection are based on the last five awarded and the next five in line.
The last five awarded are IL-17, FL-29, TX-39, NY-26, and MT-2 (#435).
The next five in line are CA53, AL-7, MN-8, OH-15, and VA-12.
The alternate projection based on just the prior two years of estimates to determine the rate of growth matches the full decade projection now.
Title: Re: Census population estimates 2011-2019
Post by: America Needs a 13-6 Progressive SCOTUS on December 19, 2018, 01:19:41 PM
We ought to add 270 members to the US House.
Title: Re: Census population estimates 2011-2019
Post by: muon2 on December 19, 2018, 01:49:33 PM
Here's what the 2024 EV map would be like based on my 2020 projections with colors to indicate changes from this decade.
( )
)
(
Title: Re: Census population estimates 2011-2019
Post by: Starpaul20 on December 19, 2018, 01:57:42 PM
Like I did last year, I decided to see what a Wyoming Rule house size would look like with the new population estimates. The house membership would expand to 565 seats, an increase of 130 over its current size:
( )
)
(States in red gain 1 seat, blue gains 2 seats, green gains 3 seats, yellow gains 4 seats, orange gains 5 or more and gray means no change)
Relative to last year, (https://uselectionatlas.org/FORUM/index.php?topic=166668.msg5968395#msg5968395) the house would increase 4 seats, with California, Texas, Florida, Indiana and Utah(!!!) gaining a seat each, and New Jersey (%&*#&!!) losing one.
For comparison, here's what a Wyoming Rule house size looks like with the 2010 census results (547 seats):
()
(
(States in red gain 1 seat, blue gains 2 seats, green gains 3 seats, yellow gains 4 seats, orange gains 5 or more and gray means no change)
Relative to last year, (https://uselectionatlas.org/FORUM/index.php?topic=166668.msg5968395#msg5968395) the house would increase 4 seats, with California, Texas, Florida, Indiana and Utah(!!!) gaining a seat each, and New Jersey (%&*#&!!) losing one.
For comparison, here's what a Wyoming Rule house size looks like with the 2010 census results (547 seats):
(
Title: Re: Census population estimates 2011-2019
Post by: America Needs a 13-6 Progressive SCOTUS on December 19, 2018, 03:57:28 PM
We should have a 705 member US House or something like that.
Title: Re: Census population estimates 2011-2019
Post by: America Needs a 13-6 Progressive SCOTUS on December 19, 2018, 04:13:19 PM
So I just calculated the likely changes in 2020 apportionment:
()
(
My calculations based on these 2018 estimates still suggest that we are on track for this map.
Title: Re: Census population estimates 2011-2019
Post by: America Needs a 13-6 Progressive SCOTUS on December 19, 2018, 04:24:29 PM
Just for fun, this is what would happen if they non-retroactively reinstated the no states can lose a seat rule for 2020:
()
It increases the House size by 18.
(
It increases the House size by 18.
This map changes quite a bit, however, including the consideration of how much the size changes:
(
The size would increase by 22.
Title: Re: Census population estimates 2011-2019
Post by: muon2 on December 19, 2018, 04:25:56 PM
So I just calculated the likely changes in 2020 apportionment:
()
(
My calculations based on these 2018 estimates still suggest that we are on track for this map.
That's where I was two years ago, and reported the same last year. However I saw MT pick up a little more increase over the last two years and now it looks to be on track to beat CA for the last seat.
Title: Re: Census population estimates 2011-2019
Post by: America Needs a 13-6 Progressive SCOTUS on December 19, 2018, 04:33:03 PM
So I just calculated the likely changes in 2020 apportionment:
()
(
My calculations based on these 2018 estimates still suggest that we are on track for this map.
That's where I was two years ago, and reported the same last year. However I saw MT pick up a little more increase over the last two years and now it looks to be on track to beat CA for the last seat.
Based on my 2018 estimate calculations:
California has 40,045,459 people
Montana has 1,077,768 people
CA-53 value: 762,805
MT-02 value: 762,097
CA-53 is still slightly ahead.
Title: Re: Census population estimates 2011-2019
Post by: Cokeland Saxton on December 19, 2018, 05:58:14 PM
The estimates are out today!
The fastest growing states this year are, according to the Census Bureau:
By percent:
1. Nevada - up 2.1% to 3,034,392
2. Idaho - up 2.1% to 1,754,208
3. Utah - up 1.9% to 3,161,105
4. Arizona - up 1.7% to 7,171,646
5. Florida - up 1.5% to 21,299,325
6. Washington - up 1.5% to 7,535,591
7. Colorado - up 1.4% to 5,695,564
8. Texas - up 1.3% to 28,701,845
9. South Carolina - up 1.3% to 5,084,127
10. North Carolina - up 1.1% to 10,383,260
Numeric:
1. Texas - up 379,128 to 28,701,845
2. Florida - up 322,513 to 21,299,325
3. California - up 157,696 to 39,557,045
4. Arizona - up 122,770 to 7,171,646
5. North Carolina - up 112,820 to 10,383,620
6. Washington - up 110,159 to 7,535,591
7. Georgia - up 106,420 to 10,519,475
8. Colorado - up 79,662 to 5,695,564
9. South Carolina - up 62,908 to 5,084,127
10. Nevada - up 61,987 to 3,034,392
Title: Re: Census population estimates 2011-2019
Post by: muon2 on December 19, 2018, 06:00:25 PM
So I just calculated the likely changes in 2020 apportionment:
()
(
My calculations based on these 2018 estimates still suggest that we are on track for this map.
That's where I was two years ago, and reported the same last year. However I saw MT pick up a little more increase over the last two years and now it looks to be on track to beat CA for the last seat.
Based on my 2018 estimate calculations:
California has 40,045,459 people
Montana has 1,077,768 people
CA-53 value: 762,805
MT-02 value: 762,097
CA-53 is still slightly ahead.
You didn't say your method of estimating for 2020. I assume a compounding growth rate averaged either over the full decade or the final 2 years. That growth rate is applied to the apportionment population which is what the Census will use in 2020. The apportionment population is higher than the residential population (the estimate) due to overseas military personnel.
If I project using the entire decade CA has a 2020 apportionment pop of 40.158 M (39.956 M using a 2-year basis; CA's growth rate has slowed considerably the last couple of years).
If I project using the entire decade MT has a 2020 apportionment pop of 1.084 M (1.087 M using a 2-year basis).
The priority value for seat N is a state of population P is P/sqrt(N(N-1)).
The priority value for CA-53 is 765.0 K (761.1 K with the two year basis).
The priority value for MT-02 is 766.4 K (768.6 K with the two year basis).
Either way MT wins, and the short term trend favors MT extending its lead on CA.
Title: Re: Census population estimates 2011-2019
Post by: America Needs a 13-6 Progressive SCOTUS on December 19, 2018, 06:02:32 PM
I used a linear growth rate estimation based on changes across the whole decade.
Title: Re: Census population estimates 2011-2019
Post by: Cokeland Saxton on December 19, 2018, 06:07:45 PM
The estimates are out today!
The fastest growing states this year are, according to the Census Bureau:
By percent:
1. Nevada - up 2.1% to 3,034,392
2. Idaho - up 2.1% to 1,754,208
3. Utah - up 1.9% to 3,161,105
4. Arizona - up 1.7% to 7,171,646
5. Florida - up 1.5% to 21,299,325
6. Washington - up 1.5% to 7,535,591
7. Colorado - up 1.4% to 5,695,564
8. Texas - up 1.3% to 28,701,845
9. South Carolina - up 1.3% to 5,084,127
10. North Carolina - up 1.1% to 10,383,260
Numeric:
1. Texas - up 379,128 to 28,701,845
2. Florida - up 322,513 to 21,299,325
3. California - up 157,696 to 39,557,045
4. Arizona - up 122,770 to 7,171,646
5. North Carolina - up 112,820 to 10,383,620
6. Washington - up 110,159 to 7,535,591
7. Georgia - up 106,420 to 10,519,475
8. Colorado - up 79,662 to 5,695,564
9. South Carolina - up 62,908 to 5,084,127
10. Nevada - up 61,987 to 3,034,392
The fastest growing states this year are, according to the Census Bureau:
By percent:
1. Nevada - up 2.1% to 3,034,392
2. Idaho - up 2.1% to 1,754,208
3. Utah - up 1.9% to 3,161,105
4. Arizona - up 1.7% to 7,171,646
5. Florida - up 1.5% to 21,299,325
6. Washington - up 1.5% to 7,535,591
7. Colorado - up 1.4% to 5,695,564
8. Texas - up 1.3% to 28,701,845
9. South Carolina - up 1.3% to 5,084,127
10. North Carolina - up 1.1% to 10,383,260
Numeric:
1. Texas - up 379,128 to 28,701,845
2. Florida - up 322,513 to 21,299,325
3. California - up 157,696 to 39,557,045
4. Arizona - up 122,770 to 7,171,646
5. North Carolina - up 112,820 to 10,383,620
6. Washington - up 110,159 to 7,535,591
7. Georgia - up 106,420 to 10,519,475
8. Colorado - up 79,662 to 5,695,564
9. South Carolina - up 62,908 to 5,084,127
10. Nevada - up 61,987 to 3,034,392
Also please note that in some of these cases, the 2017 was changed significantly, as is the case with California, whose 2018 estimate is up only 20k over the original 2017 estimate.
Title: Re: Census population estimates 2011-2019
Post by: muon2 on December 19, 2018, 06:11:43 PM
I used a linear growth rate estimation based on changes across the whole decade.
If that's the case you should add the overseas military personnel times the same growth rate to the state populations since the 2020 Census will. MT has about double the participation rate of CA in overseas military - 0.5% compared to 0.24% for CA. When I took the military population out of my projection CA was back on top using the whole decade. However, even without the military adjustment MT still wins using a short term 2 or 3 year average for projection.
Title: Re: Census population estimates 2011-2019
Post by: America Needs a 13-6 Progressive SCOTUS on December 19, 2018, 07:34:10 PM
I used a linear growth rate estimation based on changes across the whole decade.
If that's the case you should add the overseas military personnel times the same growth rate to the state populations since the 2020 Census will. MT has about double the participation rate of CA in overseas military - 0.5% compared to 0.24% for CA. When I took the military population out of my projection CA was back on top using the whole decade. However, even without the military adjustment MT still wins using a short term 2 or 3 year average for projection.
I have no idea where that data exists.
I thought they were already pre-placed into the census data compilations.
Title: Re: Census population estimates 2011-2019
Post by: Tender Branson on December 19, 2018, 10:46:16 PM
The 10 states that had the highest domestic migration surpluses (= intra-US movements between the states) between 2017 and 2018:
FL +133K
AZ +83K
TX +83K
NC +67K
SC +51K
NV +48K
WA +47K
CO +43K
GA +42K
TN +40K
... and the biggest net losses:
NY -180K
CA -156K
PR -123K
IL -114K
NJ -51K
LA -28K
MA -26K
MD -25K
CT -22K
PA -21K
MI -17K
Puerto Rico lost 4% of its population last year (a record) and that was not only because of out-migration (-123K people), but also because a -7K death surplus. A loss of 130K people in total.
Since the Census 2000, more than 1 million Puerto Ricans have left the island - or about 1/4 of the population ...
Title: Re: Census population estimates 2011-2019
Post by: Cokeland Saxton on December 19, 2018, 11:19:05 PM
Much of that was from Hurricane Maria
Title: Re: Census population estimates 2011-2019
Post by: muon2 on December 19, 2018, 11:20:29 PM
I used a linear growth rate estimation based on changes across the whole decade.
If that's the case you should add the overseas military personnel times the same growth rate to the state populations since the 2020 Census will. MT has about double the participation rate of CA in overseas military - 0.5% compared to 0.24% for CA. When I took the military population out of my projection CA was back on top using the whole decade. However, even without the military adjustment MT still wins using a short term 2 or 3 year average for projection.
I have no idea where that data exists.
I thought they were already pre-placed into the census data compilations.
The Census only puts out residential estimates. The residential data is used for grant funding and redistricting, but not for apportionment. There have been SCOTUS cases about who should be counted for apportionment. For instance in Utah vs Evans I (2001) the state argued that their Mormon missionaries should be counted for apportionment which would have given UT a seat at the expense of NC, but they lost.
The data is available through the American Fact Finder tool which has the apportionment data set. However, it's not estimated through the decade so a proper model has to make its own estimate to project to the next apportionment.
Title: Re: Census population estimates 2011-2019
Post by: The Mikado on December 20, 2018, 12:59:09 AM
Imagine how physically tiny NV-01 is going to be in the next set of maps.
Title: Re: Census population estimates 2011-2019
Post by: Brittain33 on December 20, 2018, 08:24:42 AM
Imagine how physically tiny NV-01 is going to be in the next set of maps.
Is Las Vegas getting more densely populated?
Title: Re: Census population estimates 2011-2019
Post by: Strudelcutie4427 on December 20, 2018, 08:33:01 AM
How is MA losing population? I see new obnoxiously tacky looking condos go up every time I drive through Boston
Title: Re: Census population estimates 2011-2019
Post by: Thatkat04 on December 20, 2018, 09:03:40 AM
How is MA losing population? I see new obnoxiously tacky looking condos go up every time I drive through Boston
It's not. It's the fastest growing state in the northeast.
Title: Re: Census population estimates 2011-2019
Post by: Brittain33 on December 20, 2018, 10:12:04 AM
How is MA losing population? I see new obnoxiously tacky looking condos go up every time I drive through Boston
It's funny, I can think of at least three specific neighborhoods near highways you're referring to unless it's a general observation:
- NorthPoint in Cambridge
- South End against I-93
- Chelsea on Rt. 1
Anyway, yeah, MA is the fastest-growing state in the northeast other than possibly Delaware.
Title: Re: Census population estimates 2011-2019
Post by: muon2 on December 20, 2018, 10:12:54 AM
How is MA losing population? I see new obnoxiously tacky looking condos go up every time I drive through Boston
It's not. It's the fastest growing state in the northeast.
MA is growing at 0.6%/year over the decade. That's almost as fast as the nation as a whole.
Title: Re: Census population estimates 2011-2019
Post by: ilikeverin on December 20, 2018, 10:26:57 AM
The last five awarded are IL-17, FL-29, TX-39, NY-26, and MT-2 (#435).
The next five in line are CA53, AL-7, MN-8, OH-15, and VA-12.
The next five in line are CA53, AL-7, MN-8, OH-15, and VA-12.
Wow, that seems new! I thought MN was definitely doomed.
Title: Re: Census population estimates 2011-2019
Post by: muon2 on December 20, 2018, 11:57:15 AM
The last five awarded are IL-17, FL-29, TX-39, NY-26, and MT-2 (#435).
The next five in line are CA53, AL-7, MN-8, OH-15, and VA-12.
The next five in line are CA53, AL-7, MN-8, OH-15, and VA-12.
Wow, that seems new! I thought MN was definitely doomed.
MN is now the fastest growing state in the upper Midwest/Great Lakes region. They've paced the national average for the decade and are slightly ahead of it over the last two years. If they keep up their current pace of the last year or two they have a definite shot at holding their 8th seat.
Title: Re: Census population estimates 2011-2019
Post by: Cokeland Saxton on December 20, 2018, 02:45:35 PM
Imagine how physically tiny NV-01 is going to be in the next set of maps.
Is Las Vegas getting more densely populated?
Clark County is the fastest-growing county in Nevada since 2010, and with 2.2 million people, contains nearly 3/4 of the state's population, and that percentage continues to increase.
Title: Re: Census population estimates 2011-2019
Post by: DINGO Joe on December 20, 2018, 03:19:12 PM
Colorado has added about 660,000 people this decade or more than the actual population of Wyoming (577,000).
Title: Re: Census population estimates 2011-2019
Post by: jimrtex on December 21, 2018, 02:02:24 AM
Here's my annual projection from the new estimates. I used the July 2018 estimates and the April 2010 Census base to get an annual growth rate. This correctly accounts for the 8 and a quarter year period between the Census and the estimate. I then applied the annual growth rate to the 2010 reapportionment population to get the 2020 projection. This accounts for the extra overseas population used in reapportionment but not for redistricting. Ten years is a long stretch for a simple model like this, but here are the projected changes.
AL -1
AZ +1
CA -1
CO +1
FL +2
IL -1
MI -1
MN -1
MT +1
NY -1
NC +1
OH -1
OR +1
PA -1
RI -1
TX +3
WV -1
Compared to last year (https://uselectionatlas.org/FORUM/index.php?topic=166668.msg5968174#msg5968174), CA loses one and MT gains one. That is what my model based on the two years from 2015-2017 projected, so it appears that that short-term trend has continued enough to influence the whole decade. The bubble seats in this projection are based on the last five awarded and the next five in line.
The last five awarded are IL-17, FL-29, TX-39, NY-26, and MT-2 (#435).
The next five in line are CA53, AL-7, MN-8, OH-15, and VA-12.
The alternate projection based on just the prior two years of estimates to determine the rate of growth matches the full decade projection now.
AL -1
AZ +1
CA -1
CO +1
FL +2
IL -1
MI -1
MN -1
MT +1
NY -1
NC +1
OH -1
OR +1
PA -1
RI -1
TX +3
WV -1
Compared to last year (https://uselectionatlas.org/FORUM/index.php?topic=166668.msg5968174#msg5968174), CA loses one and MT gains one. That is what my model based on the two years from 2015-2017 projected, so it appears that that short-term trend has continued enough to influence the whole decade. The bubble seats in this projection are based on the last five awarded and the next five in line.
The last five awarded are IL-17, FL-29, TX-39, NY-26, and MT-2 (#435).
The next five in line are CA53, AL-7, MN-8, OH-15, and VA-12.
The alternate projection based on just the prior two years of estimates to determine the rate of growth matches the full decade projection now.
Based on resident population, projected exponentially for the last 1.75 years, I have California narrowly keeping its 53rd seat, and Montana staying at one seat. But an additional 1000 population for Montana or -30K for California would swap the two.
The exponential projection is quite optimistic for California. Growth in California was quite flat for the first half of the decade through 2015 at 327K per year. The last three years have been 256K, 190K, and 158K. That is, the second derivative has been negative. The exponential growth projection would add 506K over the next 1.75 years. Taking 7/8 of the 2016-2018 increase would only add 305K. Not only is California not going to meet the exponential projection it will miss it badly.
We will likely miss the California Paradox where California's share of population is increasing, while its share of representation is decreasing. Currently, California is slightly above the USA growth rate (projected at 7.3% for the decade), but will likely fall below the national rate by 2020.
So this will give Montana the 435th seat. Montana's growth is not robust, but will increase by about 9.0% during the decade. Montana's growth rate is volatile, subject to energy prices. Expansion of the Williston Basin into Montana depends on sustained higher oil prices, along with a way to transport the oil. Regina is the closest population center to Williston, but Billings is the closest domestic center. Both Billings and Bismarck benefit from rentals to the Williston Basin.
A negative for Montana is it's COLD. But Montana is not going to drop much below its current rate of growth in the next 1.75 years. It could be on the cusp between one and two seats for decades to come. After losing the 2nd seat at the 1990 census, Montana has been just short of gaining it back - at times missing simply because of the timing of the census.
The only realistic contender for the 435th seat is Minnesota. But while its growth has increased a bit the last few years, it should still be short of holding on to its 8th district. Exponentially projected growth would give Minnesota 68K more persons, about 32K short of the needed population. Linear growth based on 2016-2018 would net 77K. This would still leave Minnesota 23K short. It would really need to pop its growth for the next two year, and the increase for 2018 was actually less than 2017.
Realized changes for 2018, were for Arizona to gain its 10th district, and Rhode Island to lose its 2nd. Montana surpassed Rhode Island in population during the year.
Quite likely changes by 2020 are for Florida to gain its 28th and Texas 39th, at the expense of Alabama to 6 and Ohio to 15.
The final change if it happens is Montana 2nd at the expense of California to 52.
Title: Re: Census population estimates 2011-2019
Post by: jimrtex on December 21, 2018, 03:58:37 AM
I used a linear growth rate estimation based on changes across the whole decade.
If that's the case you should add the overseas military personnel times the same growth rate to the state populations since the 2020 Census will. MT has about double the participation rate of CA in overseas military - 0.5% compared to 0.24% for CA. When I took the military population out of my projection CA was back on top using the whole decade. However, even without the military adjustment MT still wins using a short term 2 or 3 year average for projection.
The Census Bureau's rationalization is that military personnel are not living overseas by choice. The real reason is that the Census can easily get records from other federal agencies.
The US government requires that overseas civilian citizens be able to vote in their state of last residence. It is pretty hypocritical to require that they be able to vote for representatives, while not including them in the determination of the number of representatives they may vote for.
The US should maintain voter registration for civilian overseas and all military personnel (this would avoid providing information about location of military personnel to states). Overseas voters should be able to vote at embassies, consulates, other population centers, and military bases.
An overseas voter could go to a federal voting center, prove his identity. The voting center would contact the state of (last) residence and generate a ballot. The voter would vote, and the results would be sent back to the state.
With these registration records, the Census Bureau could contact civilians living overseas and determine the number of associated dependents.
In 2010, about 1,000,000 of 1,048,000 were associated with the military (95%+). About 400,000 were military and 600,000 were dependents.
Since 2010 overseas military has declined by about half. OTOH, there has been little decline in numbers stationed in countries that are suitable for dependents: Japan, Germany, Korea, Italy, UK, Spain and Belgium (countries with more than 1K military personnel).
The DOD administrative records include 3 potential states: home of record - which is generally where someone resided prior to (re)enlistment; legal address - where someone pays state taxes (tends to be heavy on Texas, Florida, Washington, Alaska, Wyoming, and Tennessee which have no income taxes, but have military bases which can be used to establish legal residency); and last duty session.
If available, the Census Bureau uses the home of record, perhaps reasoning that was the last place that was under control of the service member - and likely to produce less distortion of the apportionment population.
If we assume that the distribution of home states has not changed, and that the overseas military has declined by 50%, but not in locations where dependents can live. That means we could take (800/1050)/1.073 which would be ratio of overseas population to resident population in 2020 to that in 2010.
Then for each state take the 2010 ratio of overseas/resident population and multiply by this factor and multiply this by the 2020 projected resident population.
This assumes that factors that lead to enlistment do not vary over time, but the number who do enlist is proportional to the resident population of a state.
Title: Re: Census population estimates 2011-2019
Post by: jimrtex on December 21, 2018, 04:00:34 AM
Imagine how physically tiny NV-01 is going to be in the next set of maps.
Title: Re: Census population estimates 2011-2019
Post by: Brittain33 on December 21, 2018, 08:08:08 AM
Imagine how physically tiny NV-01 is going to be in the next set of maps.
Is Las Vegas getting more densely populated?
Clark County is the fastest-growing county in Nevada since 2010, and with 2.2 million people, contains nearly 3/4 of the state's population, and that percentage continues to increase.
Sure, but since NV-1 consists of fully built-out land and its population is going to have to go up, either the city has gotten more densely populated *or* NV-4 and NV-3 are going to shrink in size while NV-1 stays the same or gets a little bigger.
Title: Re: Census population estimates 2011-2019
Post by: jimrtex on December 21, 2018, 01:16:56 PM
19 states are gaining ground relative to the USA:
Western states (all but AK, HI, NM, and WY): AZ, CA, CO, ID, MT, NV, OR, UT, WA
Central tier: ND, SD, TX
South Atlantic (DE to FL, except MD): DE, FL, GA, NC, SC, VA
Tennessee: TN
These states can gain representation. The other 32 states are losing ground relative to the USA and can lose representation.
The following table is based on exponentially projected 2020 resident population. Above the line it shows the relative quotient for 2020 gainers: AZ(10), CO(8), FL(29), NC(14), OR(6), and TX(39). They will have notched these gains by 2020, and will be moving away from the line. The other states are growing slower than the national average and are at risk of losing additional seats. States like MA and NE are just below the national average in growth, and are potentially decades away from change. It is more likely that there will be a change in trends.
Pretty certain losses for 2030 are CT, IL, NJ, NY(2), PA, and WI. Possible losers are IL(2), IN, MI, and OH. These are based on comparing margin for 2020 and growth rates from 2010 to 2020 relative to the national growth rate of 7.3.
States below the line that lost a seat are AL(6), IL(17), MI(13), MN(7), NY(26), OH(15), PA(17), RI(1), WV(2). These states have notched a loss for 2020, and will be dropping further. With the exception of MN, they won't be making up lost ground.
Other states are growing faster than the national average and have the possibility of gaining seats. Fairly certain gainers for 2030 are FL(2), ID, TX(3), UT, and WA. Possible gainers are AZ, CO, FL(3), GA, NV, TX(4), VA.
Because there are more possible gainers than possible losers, there is a greater chance that the potential losses will occur (more eager contenders to grab the seat away from the sluggards). But it is likely that all the potential gainers will not be realized (too much competition).
Special cases are CA, MN, and MT, which have growth rates near to the national average AND are close to the threshold. They can ping pong back and forth. The MN growth rate is increasing a bit, which could turn it into a gainer by 2030, while CA growth rate is slowing substantially which could turn it into a loser. It likely will already lose its 53rd due to the slowdown, and could lose additional seats. California loses/gains seats for roughly every 2% difference from the national rate. A 5.3% increase vs. a national rate of 7.3% would cost another seat. The MT economy is too resource dependent, and has no major cities to sustain growth (compared to say Boise, Des Moines, or Omaha).
NY 23 1.092
PA 15 1.085
MO 7 1.078
MA 8 1.078
IL 15 1.076 ?
KY 5 1.076
MD 7 1.068
OH 14 1.060 ?
MI 12 1.051 ?
NY 24 1.047 x
CT 4 1.047 x
NE 2 1.044
IN 8 1.040 ?
NC 14 1.027(+)
CO 8 1.024(+)
WI 7 1.023 x
OR 6 1.022(+)
PA 16 1.019 x
NJ 11 1.019 x
CA 51 1.015
AZ 10 1.015(+)
IL 16 1.011 x
NY 25 1.006 x
FL 29 1.006(++)
TX 39 1.005(+++)
CA 52 0.9999
--------------------------------------------------
MT 2 0.9992
MN 7 0.994(-)
AL 6 0.993(-)
OH 15 0.991(-)
VA 12 0.984 ?
CA 54 0.981
RI 1 0.980(-)
TX 40 0.979 x
MI 13 0.973(-)
FL 30 0.971 x
NY 26 0.968(-)
GA 15 0.968 ?
WA 11 0.964 x
ID 3 0.961 x
PA 17 0.961(-)
WV 2 0.961(-)
TX 41 0.955 x
UT 5 0.953 x
IL 17 0.953(-)
TN 10 0.948
NC 15 0.946
FL 31 0.940 x
TX 42 0.932
AZ 11 0.918 ?
NV 4 0.911 ?
DE 2 0.910
TX 43 0.910 ?
FL 32 0.910 ?
SC 8 0.908
VA 13 0.905
GA 16 0.905
CO 9 0.903 ?
States that are losing ground relative to the USA, but are at least 10% above losing a seat.
AR(4), HI(2), IA(4), KS(4), LA(6), ME(2), MS(4), NM(3), OK(5). They won't lose the seat by 2030.
States that are losing ground relative to the USA, and already have the minimum number of seats.
AK(1), VT(1), and WY(1).
States that are gaining ground relative to the USA, but are at least 10% below gaining a seat, and won't gain a seat by 2030 (barring oil going above $100 per barrel).
ND(1) and SD(1)
Title: Re: Census population estimates 2011-2019
Post by: Thatkat04 on December 22, 2018, 08:39:23 PM
So question, was New Jersey adjusted down? In 2017, the population was past 9 million but this 2018 Census states the population is 8.9 million while at the same time showing NJ with population growth of 0.22% from last year. Not that it matters all that much since the twelfth district is safe in 2020 but its just kind of bothering me.
https://www.census.gov/quickfacts/fact/table/nj/IPE120217
https://www.census.gov/quickfacts/fact/table/nj/IPE120217
Title: Re: Census population estimates 2011-2019
Post by: Cokeland Saxton on December 22, 2018, 08:50:11 PM
Yes, New Jersey's was adjusted down, just like New York's was adjusted down by like a quarter million.
Title: Re: Census population estimates 2011-2019
Post by: Starry Eyed Jagaloon on December 23, 2018, 02:32:07 AM
We will likely miss the California Paradox where California's share of population is increasing, while its share of representation is decreasing. Currently, California is slightly above the USA growth rate (projected at 7.3% for the decade), but will likely fall below the national rate by 2020.
Title: Re: Census population estimates 2011-2019
Post by: jimrtex on December 24, 2018, 01:56:07 AM
So question, was New Jersey adjusted down? In 2017, the population was past 9 million but this 2018 Census states the population is 8.9 million while at the same time showing NJ with population growth of 0.22% from last year. Not that it matters all that much since the twelfth district is safe in 2020 but its just kind of bothering me.
https://www.census.gov/quickfacts/fact/table/nj/IPE120217
https://www.census.gov/quickfacts/fact/table/nj/IPE120217
Birth and death estimates are based on birth and death data from the National Heath Sevice (NHS). This lags the estimate date by 1-1/2 years (for the July 1, 2018 estimate is based on data for calendar year 2016). The 2018 estimate is based on a projection of the earlier data.
The estimate made for 2017 did not have 2016 data, so the death and birth data was based on projection from earlier data. But in 2018, we can correct the 2017 estimate. Even with accurate birth and death records, place of residence may be misleading. A widow from Florida who moved to live with he daughter in North Carolina, before she died, will show up as a North Carolinian dying, and a Floridian getting a year older (since no death or move was recorded). Some mothers move after giving birth. If their husband was in Afghanistan, she may have move to be nearer her parents home during the pregnancy, rather than being alone near some military base.
Domestic migration is estimated based on IRS, Medicare, and SSA records - which can apparently be anonymized enough such that you can find where a taxpayer has changed residence, and the number of exemptions and perhaps the age. Since this does not cover those who don't file, they project this to the total population This could be fairly current, since most taxpayers have filed by July 1. It got really complicated for international migration.
METHODOLOGY FOR THE UNITED STATES POPULATION ESTIMATES: VINTAGE 2018 (PDF) (https://www2.census.gov/programs-surveys/popest/technical-documentation/methodology/2010-2018/2018-natstcopr-meth.pdf)
I think they try to track the number of persons from the 2010 Census:
Let's say there are N 47 YO white males in 2010.
X% die,
Y% move to another state.
Z% move to another country.
W% move from another country.
Then for 2011 they have an estimated number of 48 YO white males, etc.
To try to make sense of the estimates, I compared the 2018 vintage annual components of change with the 2017 vintage annual components of change for New York.
The changes in birth and deaths appear just to be noise. But there was a dramatic decrease in the net inflow of international migration, which goes back most of the decade. That is, the Census Bureau now believes that they had been overestimating net international migration. This is close to a 200K difference over the decade.
I don't know the source of the error. Perhaps they were using the ACS and could not find the immigrants. Perhaps there have been people leaving the US. These are hard to detect, because the US government doesn't care if you leave. They, in theory, care if you enter the country.
Of course it is is possible that the ACS does a particularly poor job of counting persons who are illegally in the country, and avoid anything they believe might result in detection.
If there has been a change in methodology with respect to international migration, this would have a particularly profound effect on the estimates for New York and California.
Title: Re: Census population estimates 2011-2019
Post by: Ban my account ffs! on December 24, 2018, 03:02:58 PM
The 10 states that had the highest domestic migration surpluses (= intra-US movements between the states) between 2017 and 2018:
FL +133K
AZ +83K
TX +83K
NC +67K
SC +51K
NV +48K
WA +47K
CO +43K
GA +42K
TN +40K
... and the biggest net losses:
NY -180K
CA -156K
PR -123K
IL -114K
NJ -51K
LA -28K
MA -26K
MD -25K
CT -22K
PA -21K
MI -17K
Puerto Rico lost 4% of its population last year (a record) and that was not only because of out-migration (-123K people), but also because a -7K death surplus. A loss of 130K people in total.
Since the Census 2000, more than 1 million Puerto Ricans have left the island - or about 1/4 of the population ...
FL +133K
AZ +83K
TX +83K
NC +67K
SC +51K
NV +48K
WA +47K
CO +43K
GA +42K
TN +40K
... and the biggest net losses:
NY -180K
CA -156K
PR -123K
IL -114K
NJ -51K
LA -28K
MA -26K
MD -25K
CT -22K
PA -21K
MI -17K
Puerto Rico lost 4% of its population last year (a record) and that was not only because of out-migration (-123K people), but also because a -7K death surplus. A loss of 130K people in total.
Since the Census 2000, more than 1 million Puerto Ricans have left the island - or about 1/4 of the population ...
Title: Re: Census population estimates 2011-2019
Post by: Tender Branson on December 24, 2018, 03:08:12 PM
The 10 states that had the highest domestic migration surpluses (= intra-US movements between the states) between 2017 and 2018:
FL +133K
AZ +83K
TX +83K
NC +67K
SC +51K
NV +48K
WA +47K
CO +43K
GA +42K
TN +40K
... and the biggest net losses:
NY -180K
CA -156K
PR -123K
IL -114K
NJ -51K
LA -28K
MA -26K
MD -25K
CT -22K
PA -21K
MI -17K
Puerto Rico lost 4% of its population last year (a record) and that was not only because of out-migration (-123K people), but also because a -7K death surplus. A loss of 130K people in total.
Since the Census 2000, more than 1 million Puerto Ricans have left the island - or about 1/4 of the population ...
FL +133K
AZ +83K
TX +83K
NC +67K
SC +51K
NV +48K
WA +47K
CO +43K
GA +42K
TN +40K
... and the biggest net losses:
NY -180K
CA -156K
PR -123K
IL -114K
NJ -51K
LA -28K
MA -26K
MD -25K
CT -22K
PA -21K
MI -17K
Puerto Rico lost 4% of its population last year (a record) and that was not only because of out-migration (-123K people), but also because a -7K death surplus. A loss of 130K people in total.
Since the Census 2000, more than 1 million Puerto Ricans have left the island - or about 1/4 of the population ...
https://www.census.gov/newsroom/press-kits/2018/pop-estimates-national-state.html
Table 5, sorted by "domestic".
Title: Re: Census population estimates 2011-2019
Post by: Ban my account ffs! on December 24, 2018, 08:08:43 PM
The 10 states that had the highest domestic migration surpluses (= intra-US movements between the states) between 2017 and 2018:
FL +133K
AZ +83K
TX +83K
NC +67K
SC +51K
NV +48K
WA +47K
CO +43K
GA +42K
TN +40K
... and the biggest net losses:
NY -180K
CA -156K
PR -123K
IL -114K
NJ -51K
LA -28K
MA -26K
MD -25K
CT -22K
PA -21K
MI -17K
Puerto Rico lost 4% of its population last year (a record) and that was not only because of out-migration (-123K people), but also because a -7K death surplus. A loss of 130K people in total.
Since the Census 2000, more than 1 million Puerto Ricans have left the island - or about 1/4 of the population ...
FL +133K
AZ +83K
TX +83K
NC +67K
SC +51K
NV +48K
WA +47K
CO +43K
GA +42K
TN +40K
... and the biggest net losses:
NY -180K
CA -156K
PR -123K
IL -114K
NJ -51K
LA -28K
MA -26K
MD -25K
CT -22K
PA -21K
MI -17K
Puerto Rico lost 4% of its population last year (a record) and that was not only because of out-migration (-123K people), but also because a -7K death surplus. A loss of 130K people in total.
Since the Census 2000, more than 1 million Puerto Ricans have left the island - or about 1/4 of the population ...
https://www.census.gov/newsroom/press-kits/2018/pop-estimates-national-state.html
Table 5, sorted by "domestic".
Title: Re: Census population estimates 2011-2019
Post by: jamestroll on December 24, 2018, 08:17:09 PM
Time to institute my plan in Illinois.
Pritzker is intituting the legal marijuana but I doubt he will institute my other plan.
Abolish all property taxes in the state of Illinois and all sales taxes in opportunity zones in Cook County and parts of downstate.
Edit: Also I would nuke all public sector unions.
That should solve most of the mess in the state is causing people to leave.
Title: Re: Census population estimates 2011-2019
Post by: America Needs a 13-6 Progressive SCOTUS on December 24, 2018, 08:40:15 PM
Time to institute my plan in Illinois.
Pritzker is intituting the legal marijuana but I doubt he will institute my other plan.
Abolish all property taxes in the state of Illinois and all sales taxes in opportunity zones in Cook County and parts of downstate.
Edit: Also I would nuke all public sector unions.
That should solve most of the mess in the state is causing people to leave.
Pritzker is intituting the legal marijuana but I doubt he will institute my other plan.
Abolish all property taxes in the state of Illinois and all sales taxes in opportunity zones in Cook County and parts of downstate.
Edit: Also I would nuke all public sector unions.
That should solve most of the mess in the state is causing people to leave.
()
Title: Re: Census population estimates 2011-2019
Post by: Vern on December 26, 2018, 05:31:03 PM
NC once again grows faster than GA. Watch out GA we right on your heels!
Title: Re: Census population estimates 2011-2019
Post by: muon2 on December 26, 2018, 06:35:27 PM
Time to institute my plan in Illinois.
Pritzker is intituting the legal marijuana but I doubt he will institute my other plan.
Abolish all property taxes in the state of Illinois and all sales taxes in opportunity zones in Cook County and parts of downstate.
Edit: Also I would nuke all public sector unions.
That should solve most of the mess in the state is causing people to leave.
Pritzker is intituting the legal marijuana but I doubt he will institute my other plan.
Abolish all property taxes in the state of Illinois and all sales taxes in opportunity zones in Cook County and parts of downstate.
Edit: Also I would nuke all public sector unions.
That should solve most of the mess in the state is causing people to leave.
The IL sales taxes are pretty much only assessed on purchases of physical items that disproportionately affect lower income groups. The state could earn 2 G$ or more by including services that are primarily used by upper income groups.
Title: Re: Census population estimates 2011-2019
Post by: jamestroll on December 26, 2018, 08:13:05 PM
Time to institute my plan in Illinois.
Pritzker is intituting the legal marijuana but I doubt he will institute my other plan.
Abolish all property taxes in the state of Illinois and all sales taxes in opportunity zones in Cook County and parts of downstate.
Edit: Also I would nuke all public sector unions.
That should solve most of the mess in the state is causing people to leave.
Pritzker is intituting the legal marijuana but I doubt he will institute my other plan.
Abolish all property taxes in the state of Illinois and all sales taxes in opportunity zones in Cook County and parts of downstate.
Edit: Also I would nuke all public sector unions.
That should solve most of the mess in the state is causing people to leave.
The IL sales taxes are pretty much only assessed on purchases of physical items that disproportionately affect lower income groups. The state could earn 2 G$ or more by including services that are primarily used by upper income groups.
We should get together and make a budget plan for Illinois that is fair!
Title: Re: Census population estimates 2011-2019
Post by: Ban my account ffs! on December 26, 2018, 11:08:01 PM
Illinois is a big, hot mess. But I am confident it will do just fine in the long run.
As a good Chicagoan might say "yeah we're hayfe way between a raaaahck an a haaaaahrd place but we've sitch-uh-wated ourselves exeaaactly half way tuh minimize the deaaaahmage"
As a good Chicagoan might say "yeah we're hayfe way between a raaaahck an a haaaaahrd place but we've sitch-uh-wated ourselves exeaaactly half way tuh minimize the deaaaahmage"
Title: Re: Census population estimates 2011-2019
Post by: jimrtex on December 27, 2018, 08:05:09 AM
Puerto Rico lost 4% of its population last year (a record) and that was not only because of out-migration (-123K people), but also because a -7K death surplus. A loss of 130K people in total.
Since the Census 2000, more than 1 million Puerto Ricans have left the island - or about 1/4 of the population ...
Since the Census 2000, more than 1 million Puerto Ricans have left the island - or about 1/4 of the population ...
I suspect those who leave may be disproportionately in child-bearing ages. Yep ...
If we compare numbers in 5-year age groups from 2012 to 2017, when they would have advanced to the next age group.
20-25 in 2012, 25-30 in 2017 84.9% *** groups with largest share of births
25-30 in 2012, 30-34 in 2017 83.8% ***
30-34 in 2012, 35-39 in 2017 87.4%
35-39 in 2013, 40-44 in 2017 90.2%
...
55-59 in 2013, 60-64 in 2017 93.1%
At older ages, you see a sharp decline, but that is because of people dying before they age 5 years. This may have a small effect on those in their 50s.
There is a strong male-female differential.
25-29 in 2012, 30-34 in 2017, male 18.5% left, female 14.1% left.
In a normal population, males outnumber females until in 40s to 50s, when earlier male deaths balance the population. But here you have potential mates leaving the island.
If we look at children, there is also difference.
0-4 in 2012, 5-9 in 2017 86.9%
5-10 in 2012, 10-14 in 2017 89.3%
10-14 in 2012, 15-19 in 2017 89.2%
15-19 in 2012, 20-24 in 2017 86.6%
The youngest are more likely to be living in non-established families, and it is easier to move if you don't have an established career, a house, and the children in school. You likely have family on the mainland, whom you can use for at least temporary housing, and may know of jobs.
Older children, who are in school, and may have more difficulty in transitioning to English-based schools. Migration matches that of those 30 years older (their parents).
The oldest group which were teenagers in 2012, has now entered adulthood and are beginning to migrate.
Title: Re: Census population estimates 2011-2019
Post by: jimrtex on December 28, 2018, 02:47:19 PM
Yes, New Jersey's was adjusted down, just like New York's was adjusted down by like a quarter million.
The changes in international migration were extremely concentrated, with New York (-265K), California (-147K) and New Jersey (-121K) suffering the most.
MD -29
NV -23
FL -14
GA -14
CT -13
LA -13
PA -12
NC -11
There were a few gainers:
TX +36
AZ +33
MI +18
WA +18
OH +11
I suspect that the Census Bureau has refined their estimates of people leaving the US, which would reasonably be the hardest to measure, since they no longer exist in the US. Residents for census purposes include temporary residents such as those attending college or on long-term work assignments, It also includes persons who move to the USA to work and travel, with no intent to permanently reside in the USA.
Some people change their minds. They get their degree(s), find work, and perhaps a spouse, and become permanent residents, perhaps citizens. Others may return for other reasons. With jet travel and the internet it is much easier to maintain a connection with a home country.
In 2016, domestic migration into Texas was 532K, and out of Texas was 444K, but the net was only 88K. That is, the net flow was less than 1/10 of the total number of border crossers.
From the 2016 ACS, roughly 2 million persons were living in the USA, who had resided abroad a year earlier. But the Census Bureau estimates net international migration at half of that.
Mumbly. mumbly, hand wavy, the Census Bureau through 2017 reduced the net international flow from 7.2M to 6.7M. If this is due to increased estimate of out migration, this might only require an increase in the percentage of outflow by less than 10%.
The question is then why is this so concentrated in New York, New Jersey, and California.
Speculation,
New York and California by far have the most diverse immigrants. Perhaps more people have heard of NYC or Los Angeles or San Francisco and move there as part of some fantasy, thinking they can get a job in movies or the theater, etc. It may be more a multi-year visit, than a lifetime migration.
Title: Re: Census population estimates 2011-2019
Post by: The Mikado on December 30, 2018, 06:46:45 PM
It has a lot to do with immigrants wanting to move places where there's a preexisting established community of their ethnic group, and almost literally every ethnic group on Earth has an enclave somewhere in NYC.
Title: Re: Census population estimates 2011-2019
Post by: beesley on January 12, 2019, 07:23:15 AM
Are more people moving out of upstate NY, or NYC? I really can't think why you would want to move out of the latter, but anyway.
Title: Re: Census population estimates 2011-2019
Post by: Zaybay on January 12, 2019, 11:24:19 AM
Are more people moving out of upstate NY, or NYC? I really can't think why you would want to move out of the latter, but anyway.
It appears to be Upstate. NYC is still growing.
Title: Re: Census population estimates 2011-2019
Post by: Gass3268 on January 12, 2019, 12:41:54 PM
Are more people moving out of upstate NY, or NYC? I really can't think why you would want to move out of the latter, but anyway.
It appears to be Upstate. NYC is still growing.
If Democrats have total control in 2021 as I imagine they will, I wonder if they will try to kill two Upstate seats.
Title: Re: Census population estimates 2011-2019
Post by: Zaybay on January 12, 2019, 01:04:56 PM
Are more people moving out of upstate NY, or NYC? I really can't think why you would want to move out of the latter, but anyway.
It appears to be Upstate. NYC is still growing.
If Democrats have total control in 2021 as I imagine they will, I wonder if they will try to kill two Upstate seats.
Based on the fact that the Ds have a trifecta, and the population changes, whats most likely to happen is that Upstate loses 1 or 2 seats, with the possibility of Long Island losing one if Upstate holds. This would mean NYC and its surrounding area would hold much more substantial influence in whats left of Long Island and Upstate, to the point that losing two districts may make it much easier for the Ds to obtain near absolute control of the congressional delegation without the need for extreme gerrymandering and ugly districts.
Title: Re: Census population estimates 2011-2019
Post by: Oryxslayer on January 12, 2019, 01:27:05 PM
Where are these thoughts of NY losing two seats coming from? It seems NY has been on track to lose 1 for 7 years or so. That seat itself has always been likely to be NY22/NY24 as Dems carve up Katko and protect Brindisi or another Dem. I mean of course Dems are going to get messy with the lines in Long Island, Staten Island, and the Hudson Valley, but that is to be expected.
Title: Re: Census population estimates 2011-2019
Post by: Brittain33 on January 12, 2019, 01:32:36 PM
Doesn't NY have a redistricting commission for 2022?
Title: Re: Census population estimates 2011-2019
Post by: America Needs a 13-6 Progressive SCOTUS on January 12, 2019, 01:34:32 PM
Doesn't NY have a redistricting commission for 2022?
The commission is toothless, and can be ignored about as easily as the one in Ohio.
Title: Re: Census population estimates 2011-2019
Post by: Zaybay on January 12, 2019, 02:26:57 PM
Where are these thoughts of NY losing two seats coming from? It seems NY has been on track to lose 1 for 7 years or so. That seat itself has always been likely to be NY22/NY24 as Dems carve up Katko and protect Brindisi or another Dem. I mean of course Dems are going to get messy with the lines in Long Island, Staten Island, and the Hudson Valley, but that is to be expected.
With the addition of the 2018 census, the map has changed.
()
Title: Re: Census population estimates 2011-2019
Post by: Oryxslayer on January 12, 2019, 04:16:59 PM
Where are these thoughts of NY losing two seats coming from? It seems NY has been on track to lose 1 for 7 years or so. That seat itself has always been likely to be NY22/NY24 as Dems carve up Katko and protect Brindisi or another Dem. I mean of course Dems are going to get messy with the lines in Long Island, Staten Island, and the Hudson Valley, but that is to be expected.
With the addition of the 2018 census, the map has changed.
()
Ah ok, the pop adjustments downward shoved the bottom out. Glancing at that map, could someone explain MN? MT and CA are constant bubble seats so that's understandable, but MN I believe lost the pop for MN08 back pre-2015. Is the state growing fast again? Or was it just shoved out of the way by NY?
Redistricting-wise, I suspect the second cut will be one of NY-18/19/20 in the Husdon Valley, or a Long Island seat with the remaining ones all getting shoved that much deeper into NY. Gives the dems a better hand, since there would now be more 'free' voters to mess with.
Title: Re: Census population estimates 2011-2019
Post by: muon2 on January 12, 2019, 06:56:15 PM
Where are these thoughts of NY losing two seats coming from? It seems NY has been on track to lose 1 for 7 years or so. That seat itself has always been likely to be NY22/NY24 as Dems carve up Katko and protect Brindisi or another Dem. I mean of course Dems are going to get messy with the lines in Long Island, Staten Island, and the Hudson Valley, but that is to be expected.
With the addition of the 2018 census, the map has changed.
()
Ah ok, the pop adjustments downward shoved the bottom out. Glancing at that map, could someone explain MN? MT and CA are constant bubble seats so that's understandable, but MN I believe lost the pop for MN08 back pre-2015. Is the state growing fast again? Or was it just shoved out of the way by NY?
Redistricting-wise, I suspect the second cut will be one of NY-18/19/20 in the Husdon Valley, or a Long Island seat with the remaining ones all getting shoved that much deeper into NY. Gives the dems a better hand, since there would now be more 'free' voters to mess with.
I answered the MN question back in Dec. You can see my bubble list in the answer below. I know the owner of the company that produced that map, and we've talked about our respective projections. He uses a slightly different projection model than I do which accounts for the differences in NY and MN. We both use full decade and 3-year averages and compare the results. He has a CA/MN flip based on that which I do not.
The last five awarded are IL-17, FL-29, TX-39, NY-26, and MT-2 (#435).
The next five in line are CA53, AL-7, MN-8, OH-15, and VA-12.
The next five in line are CA53, AL-7, MN-8, OH-15, and VA-12.
Wow, that seems new! I thought MN was definitely doomed.
MN is now the fastest growing state in the upper Midwest/Great Lakes region. They've paced the national average for the decade and are slightly ahead of it over the last two years. If they keep up their current pace of the last year or two they have a definite shot at holding their 8th seat.
Title: Re: Census population estimates 2011-2019
Post by: Oryxslayer on January 12, 2019, 07:32:13 PM
Where are these thoughts of NY losing two seats coming from? It seems NY has been on track to lose 1 for 7 years or so. That seat itself has always been likely to be NY22/NY24 as Dems carve up Katko and protect Brindisi or another Dem. I mean of course Dems are going to get messy with the lines in Long Island, Staten Island, and the Hudson Valley, but that is to be expected.
With the addition of the 2018 census, the map has changed.
()
Ah ok, the pop adjustments downward shoved the bottom out. Glancing at that map, could someone explain MN? MT and CA are constant bubble seats so that's understandable, but MN I believe lost the pop for MN08 back pre-2015. Is the state growing fast again? Or was it just shoved out of the way by NY?
Redistricting-wise, I suspect the second cut will be one of NY-18/19/20 in the Husdon Valley, or a Long Island seat with the remaining ones all getting shoved that much deeper into NY. Gives the dems a better hand, since there would now be more 'free' voters to mess with.
I answered the MN question back in Dec. You can see my bubble list in the answer below. I know the owner of the company that produced that map, and we've talked about our respective projections. He uses a slightly different projection model than I do which accounts for the differences in NY and MN. We both use full decade and 3-year averages and compare the results. He has a CA/MN flip based on that which I do not.
The last five awarded are IL-17, FL-29, TX-39, NY-26, and MT-2 (#435).
The next five in line are CA53, AL-7, MN-8, OH-15, and VA-12.
The next five in line are CA53, AL-7, MN-8, OH-15, and VA-12.
Wow, that seems new! I thought MN was definitely doomed.
MN is now the fastest growing state in the upper Midwest/Great Lakes region. They've paced the national average for the decade and are slightly ahead of it over the last two years. If they keep up their current pace of the last year or two they have a definite shot at holding their 8th seat.
Thanks!
Title: Re: Census population estimates 2011-2019
Post by: cinyc on January 13, 2019, 01:32:17 AM
Doesn't NY have a redistricting commission for 2022?
The commission is toothless, and can be ignored about as easily as the one in Ohio.
The commission is not as toothless as you think, because of the supermajority requirement to reject the commissions map when there is single party government rule.
As for whats losing population in New York, yes, its largely Upstate, but IIRC, some NYC boroughs lost population in the last estimate, too. I dont think the math works to get rid of 2 Upstate seats if NY loses 2 seats. NYC will lose one, too.
Title: Re: Census population estimates 2011-2019
Post by: DINGO Joe on January 13, 2019, 02:49:42 AM
Anybody have a handy link to how far off the final Census estimates were last decade vs the actual census in 2010 by state? Of course with the caveat that past results don't equal future performance.
Title: Re: Census population estimates 2011-2019
Post by: Tender Branson on January 13, 2019, 03:32:46 AM
Anybody have a handy link to how far off the final Census estimates were last decade vs the actual census in 2010 by state? Of course with the caveat that past results don't equal future performance.
I had them once for all states, but the charts seem to have been deleted by imageschak:
https://uselectionatlas.org/FORUM/index.php?topic=128464.msg2755003#msg2755003
Title: Re: Census population estimates 2011-2019
Post by: Tender Branson on January 13, 2019, 03:46:26 AM
Anybody have a handy link to how far off the final Census estimates were last decade vs the actual census in 2010 by state? Of course with the caveat that past results don't equal future performance.
Here is the good stuff:
https://uselectionatlas.org/FORUM/index.php?topic=128464.msg2762803#msg2762803
Title: Re: Census population estimates 2011-2019
Post by: jimrtex on January 13, 2019, 11:54:53 PM
Where are these thoughts of NY losing two seats coming from? It seems NY has been on track to lose 1 for 7 years or so. That seat itself has always been likely to be NY22/NY24 as Dems carve up Katko and protect Brindisi or another Dem. I mean of course Dems are going to get messy with the lines in Long Island, Staten Island, and the Hudson Valley, but that is to be expected.
With the addition of the 2018 census, the map has changed.
()
I think EDS uses a weighted projection. But I was unable to reproduce their projection of the 2020 population, even that based on 2000-2008 estimates.
I did calculate the quotients for the states in the bubble based on the most recent estimate, and I think a more reliable projection would show, California, Minnesota, and New York in contention for the 435th seat.
If New York's decline continues to accelerate it might fall below the others. Minnesota is increasing slightly, while California is slowing down. For 2010-2014 California was growing faster than the US as a whole, while for 2014-2018 it was slower.
By 2020, Florida(+2) and Texas(+3) will have registered their gains, while Alabama and Ohio will have registered their losses.
Illinois and Virginia will just be coming into the picture, but won't see a change before the Census.
Title: Re: Census population estimates 2011-2019
Post by: RussFeingoldWasRobbed on January 15, 2019, 01:34:30 PM
MT-02 is now a possibility again? My how things change. I remember the days when it was so close but missed the mark.
Title: Re: Census population estimates 2011-2019
Post by: Oryxslayer on January 15, 2019, 08:37:07 PM
MT-02 is now a possibility again? My how things change. I remember the days when it was so close but missed the mark.
It has always been like that. It and +1 or -1 for California have always been on the bubble it seems.
Title: Re: Census population estimates 2011-2019
Post by: Vern on January 19, 2019, 08:42:22 PM
Anybody have a handy link to how far off the final Census estimates were last decade vs the actual census in 2010 by state? Of course with the caveat that past results don't equal future performance.
Here is the good stuff:
https://uselectionatlas.org/FORUM/index.php?topic=128464.msg2762803#msg2762803
If GA is off by that much again in 2020 then NC could pass it
Title: Re: Census population estimates 2011-2019
Post by: Nyvin on February 15, 2019, 10:05:12 PM
Is there any set date for the 2018 county estimates?
Title: Re: Census population estimates 2011-2019
Post by: Gass3268 on February 15, 2019, 10:33:07 PM
Is there any set date for the 2018 county estimates?
Generally late March.
Title: Re: Census population estimates 2011-2019
Post by: jimrtex on February 16, 2019, 08:22:34 PM
Is there any set date for the 2018 county estimates?
Title: Re: Census population estimates 2011-2019
Post by: DINGO Joe on February 18, 2019, 10:22:07 PM
Is there any set date for the 2018 county estimates?
I think the shutdown shoved it back quite a bit.
Title: Re: Census population estimates 2011-2019
Post by: America Needs a 13-6 Progressive SCOTUS on February 25, 2019, 11:06:56 PM
I heard something recently that the states of Virginia and Tennessee were shown by some form of new data to have a surprisingly large population drop, and then both states were now on track to lose a Congressional District each in 2020. Only 1 detail I am forgetting: was it a strange dream or was it something real? Can someone please tell me.
Title: Re: Census population estimates 2011-2019
Post by: Zaybay on February 28, 2019, 12:15:44 AM
I heard something recently that the states of Virginia and Tennessee were shown by some form of new data to have a surprisingly large population drop, and then both states were now on track to lose a Congressional District each in 2020. Only 1 detail I am forgetting: was it a strange dream or was it something real? Can someone please tell me.
Dream, VA has been showing an average population growth that is higher than the nation, so its not losing a seat anytime soon.
TN, Im not sure about.
The list is already kinda finalized for what the state that can gain/lose are gonna be.
Title: Re: Census population estimates 2011-2019
Post by: Cokeland Saxton on February 28, 2019, 12:35:23 AM
I heard something recently that the states of Virginia and Tennessee were shown by some form of new data to have a surprisingly large population drop, and then both states were now on track to lose a Congressional District each in 2020. Only 1 detail I am forgetting: was it a strange dream or was it something real? Can someone please tell me.
Virginia and Tennessee are both growing a little above the national average. The last time Tennessee lost a seat was in 1970, only to gain it back in 1980.
Title: Re: Census population estimates 2011-2019
Post by: DINGO Joe on March 05, 2019, 05:08:04 PM
Is there any set date for the 2018 county estimates?
I think the shutdown shoved it back quite a bit.
April 18th is the release date or the 16th if you've got embargoed media access.
Title: Re: Census population estimates 2011-2019
Post by: 💥💥 brandon bro (he/him/his) on April 18, 2019, 08:53:31 AM
Here is a map of change (I think 17 - 18) at the county level.
()
discuss with maps
()
discuss with maps
Title: Re: Census population estimates 2011-2019
Post by: Nyvin on April 18, 2019, 09:44:18 AM
New England as a whole is actually doing moderately well (aside from Connecticut). Surprising to see Coos county actually return to growth (by 5 people).
Here's a link to the tables:
https://www.census.gov/data/datasets/time-series/demo/popest/2010s-counties-total.html
Here's a link to the tables:
https://www.census.gov/data/datasets/time-series/demo/popest/2010s-counties-total.html
Title: Re: Census population estimates 2011-2019
Post by: Annatar on April 18, 2019, 10:39:24 AM
The drop in population growth nationally really seems to have hit a lot of the larger counties. Of the 10 most populous counties, all 10 had positive growth between 2010-2017 and 3 of them lost population between 2017-18. Only Maricopa is still seeing strong growth, even Harris county which grew by 1.9% p.a. in 2010-2017 grew by only 0.7% in 2017-18. Miami-Dade which grew by 1.3% p.a. in 2010-2017 grew by only 0.6%. Dallas county after growing by 1.5% p.a. in 2010-2017 slowed down to 0.6%.
As fertility continues to fall in America and deaths rise as the population ages I expect growth to slow down even further.
As fertility continues to fall in America and deaths rise as the population ages I expect growth to slow down even further.
Title: Re: Census population estimates 2011-2019
Post by: cinyc on April 18, 2019, 02:38:06 PM
The drop in population growth nationally really seems to have hit a lot of the larger counties. Of the 10 most populous counties, all 10 had positive growth between 2010-2017 and 3 of them lost population between 2017-18. Only Maricopa is still seeing strong growth, even Harris county which grew by 1.9% p.a. in 2010-2017 grew by only 0.7% in 2017-18. Miami-Dade which grew by 1.3% p.a. in 2010-2017 grew by only 0.6%. Dallas county after growing by 1.5% p.a. in 2010-2017 slowed down to 0.6%.
As fertility continues to fall in America and deaths rise as the population ages I expect growth to slow down even further.
As fertility continues to fall in America and deaths rise as the population ages I expect growth to slow down even further.
One year trends are always subject to revision.
The exurbs look like they're growing again. Even the Los Angeles Metro lost population 2017-18 - but San Bernardino/Riverside grew.
Title: Re: Census population estimates 2011-2019
Post by: RINO Tom on April 18, 2019, 03:29:05 PM
Here is a map of change (I think 17 - 18) at the county level.
()
discuss with maps
()
discuss with maps
Poor Illinois :(
This is surprising, though. I had thought that Woodford (exurb of Peoria) and Champaign were both growing, as far as Downstate counties.
Title: Re: Census population estimates 2011-2019
Post by: America Needs a 13-6 Progressive SCOTUS on April 18, 2019, 05:16:27 PM
Collin County had the highest raw gain in Texas. For anyone looking at the future battleground area when Texas becomes winnable for Democrats.
Tarrant County is a strong statewide bellwether most of the time (2018 was its only significant miss in a very long time). Collin County is consistently to the right of Tarrant County.
Title: Re: Census population estimates 2011-2019
Post by: cvparty on April 18, 2019, 06:59:20 PM
Collin County had the highest raw gain in Texas. For anyone looking at the future battleground area when Texas becomes winnable for Democrats.
Tarrant County is a strong statewide bellwether most of the time (2018 was its only significant miss in a very long time). Collin County is consistently to the right of Tarrant County.
Title: Re: Census population estimates 2011-2019
Post by: henster on April 18, 2019, 08:49:55 PM
Interesting Fairfax Co. barely grew but it is really the calm before the Amazon storm in the upcoming years. Also Virginia Beach seemed to buck the suburban growth trend with it barely growing and most of the growth going to Chesapeake/Suffolk. RVA area growing at a decent clip with the usual declines in the rural areas.
Title: Re: Census population estimates 2011-2019
Post by: Cokeland Saxton on April 19, 2019, 01:11:23 AM
Hamilton County had the highest numerical gain in Indiana (not surprised)
And RIP Illinois, New Jersey, and New York
And RIP Illinois, New Jersey, and New York
Title: Re: Census population estimates 2011-2019
Post by: Nyvin on April 19, 2019, 09:02:57 AM
Hamilton County had the highest numerical gain in Indiana (not surprised)
And RIP Illinois, New Jersey, and New York
And RIP Illinois, New Jersey, and New York
New Jersey grew last year.
Title: Re: Census population estimates 2011-2019
Post by: Del Tachi on April 19, 2019, 09:33:33 AM
Beautiful to see Nashville, Atlanta, RDU, and Charlotte on that map :)
Title: Re: Census population estimates 2011-2019
Post by: Cokeland Saxton on April 19, 2019, 11:46:27 AM
Hamilton County had the highest numerical gain in Indiana (not surprised)
And RIP Illinois, New Jersey, and New York
And RIP Illinois, New Jersey, and New York
New Jersey grew last year.
It's lower than the original 2017 estimate. Please do not correct me.
Title: Re: Census population estimates 2011-2019
Post by: Thatkat04 on April 19, 2019, 02:15:06 PM
Hamilton County had the highest numerical gain in Indiana (not surprised)
And RIP Illinois, New Jersey, and New York
And RIP Illinois, New Jersey, and New York
New Jersey grew last year.
It's lower than the original 2017 estimate. Please do not correct me.
NJ's population got revised down, but it has yet to suffer negative population growth. So @Nyvin is right to correct you.
Edit:
The official numbers for NJ in the last 3 years are:
2016: 8,874,516
2017: 8,888,543
2018: 8,908,520
https://www.census.gov/data/tables/time-series/demo/popest/2010s-national-total.html#par_textimage_2011805803
Title: Re: Census population estimates 2011-2019
Post by: Nyvin on April 19, 2019, 04:55:14 PM
Hamilton County had the highest numerical gain in Indiana (not surprised)
And RIP Illinois, New Jersey, and New York
And RIP Illinois, New Jersey, and New York
New Jersey grew last year.
It's lower than the original 2017 estimate. Please do not correct me.
I'll correct you if you're wrong.
Title: Re: Census population estimates 2011-2019
Post by: Cokeland Saxton on April 20, 2019, 05:23:59 AM
Hamilton County had the highest numerical gain in Indiana (not surprised)
And RIP Illinois, New Jersey, and New York
And RIP Illinois, New Jersey, and New York
I hate being corrected. I don't care if he's right.
New Jersey grew last year.
It's lower than the original 2017 estimate. Please do not correct me.
NJ's population got revised down, but it has yet to suffer negative population growth. So @Nyvin is right to correct you.
Edit:
The official numbers for NJ in the last 3 years are:
2016: 8,874,516
2017: 8,888,543
2018: 8,908,520
https://www.census.gov/data/tables/time-series/demo/popest/2010s-national-total.html#par_textimage_2011805803
Title: Re: Census population estimates 2011-2019
Post by: Nyvin on April 20, 2019, 08:03:09 AM
Hamilton County had the highest numerical gain in Indiana (not surprised)
And RIP Illinois, New Jersey, and New York
And RIP Illinois, New Jersey, and New York
I hate being corrected. I don't care if he's right.
New Jersey grew last year.
It's lower than the original 2017 estimate. Please do not correct me.
NJ's population got revised down, but it has yet to suffer negative population growth. So @Nyvin is right to correct you.
Edit:
The official numbers for NJ in the last 3 years are:
2016: 8,874,516
2017: 8,888,543
2018: 8,908,520
https://www.census.gov/data/tables/time-series/demo/popest/2010s-national-total.html#par_textimage_2011805803
Wow, you've got to be kidding me. Rather immature I'd say.
I don't care if you don't like it, you don't get a free pass to spew nonsense to other people because your feelings get hurt. If you state something wrong I'm going to correct you so that other people see the truth.
Welcome to the real world.
Title: Re: Census population estimates 2011-2019
Post by: Brittain33 on April 20, 2019, 08:13:04 AM
Brooklyn, Queens, and Bronx all peaked in 2016 after many years of growth and have had small but significant declines since then. Immigration crackdown? I'm really surprised to see Brooklyn losing population.
Title: Re: Census population estimates 2011-2019
Post by: cinyc on April 20, 2019, 08:19:34 PM
Brooklyn, Queens, and Bronx all peaked in 2016 after many years of growth and have had small but significant declines since then. Immigration crackdown? I'm really surprised to see Brooklyn losing population.
It is due to less reported foreign immigration. Whether that is due to a different way of asking the foreign migration question in the ACS (instead of in what year did you last live outside of Brooklyn, did you live in Brooklyn last year, or something like that), illegal immigrants being less likely to fill out the ACS in the age of Trump, or an actual halt in immigration is unclear. That probably won't be answered until after the 2020 Census.
Title: Re: Census population estimates 2011-2019
Post by: Nyvin on April 21, 2019, 05:48:46 PM
So barring some sudden slowdown/decline, Oklahoma county will have enough people for it's own congressional district in 2020. Any chance it gets one or will it get the Salt Lake county treatment?
Title: Re: Census population estimates 2011-2019
Post by: Oryxslayer on April 21, 2019, 05:53:13 PM
So barring some sudden slowdown/decline, Oklahoma county will have enough people for it's own congressional district in 2020. Any chance it gets one or will it get the Salt Lake county treatment?
The only reason the Oklahoma districts look nice right now is because the GOP in 2010 had nothing to fear from the dems - they were winning zero counties after all. Now, its guaranteed Oklahoma City is going to get tricut between her blood red neghbors.
Title: Re: Census population estimates 2011-2019
Post by: America Needs a 13-6 Progressive SCOTUS on April 21, 2019, 06:10:24 PM
So barring some sudden slowdown/decline, Oklahoma county will have enough people for it's own congressional district in 2020. Any chance it gets one or will it get the Salt Lake county treatment?
The only reason the Oklahoma districts look nice right now is because the GOP in 2010 had nothing to fear from the dems - they were winning zero counties after all. Now, its guaranteed Oklahoma City is going to get tricut between her blood red neghbors.
There is a citizens initiation trying to gain signatures in the state that would prevent gerrymandering.
Title: Re: Census population estimates 2011-2019
Post by: Starry Eyed Jagaloon on April 22, 2019, 02:04:17 AM
Brooklyn, Queens, and Bronx all peaked in 2016 after many years of growth and have had small but significant declines since then. Immigration crackdown? I'm really surprised to see Brooklyn losing population.
Title: Re: Census population estimates 2011-2019
Post by: Zaybay on April 22, 2019, 11:40:32 AM
Boston really sticks out here as following a different trend than other old Northern cities.
Boston has a legup against its competition, even against some of the Southern Metros. Its already a bustling hub for 21st century industries, and its proximity to some of the most sought after colleges in the world mean more professionals and businesses(and therefore jobs) move to the bay state. Its also still rather open, unlike NYC. Neither the city nor the suburbs are that crowded, so people arent forced out by a lack of housing or jobs, for example.
Title: Re: Census population estimates 2011-2019
Post by: Suburbia on April 22, 2019, 01:02:52 PM
IL, NY, it is sad.
Illinois won't be trending Republican because a lot of Republican voters are moving to AZ, FL, NC, NM.
Illinois won't be trending Republican because a lot of Republican voters are moving to AZ, FL, NC, NM.
Title: Re: Census population estimates 2011-2019
Post by: The Free North on April 22, 2019, 05:01:26 PM
IL, NY, it is sad.
Illinois won't be trending Republican because a lot of Republican voters are moving to AZ, FL, NC, NM.
Illinois won't be trending Republican because a lot of Republican voters are moving to AZ, FL, NC, NM.
You can't have high taxes and bad weather and keep people around in 21st century America.
Title: Re: Census population estimates 2011-2019
Post by: Brittain33 on April 22, 2019, 09:24:02 PM
Boston really sticks out here as following a different trend than other old Northern cities.
Boston has a legup against its competition, even against some of the Southern Metros. Its already a bustling hub for 21st century industries, and its proximity to some of the most sought after colleges in the world mean more professionals and businesses(and therefore jobs) move to the bay state. Its also still rather open, unlike NYC. Neither the city nor the suburbs are that crowded, so people arent forced out by a lack of housing or jobs, for example.
While Boston and suburbs aren't as dense as NYC, there's certainly a housing crunch here which is driving people away with high housing costs. The suburbs aren't dense, but they are built out with their current sfh-on-large-lot zoning, so they may as well be. The city and neighboring cities (Cambridge, Somerville, Medford, Quincy) are throwing up tons of multi-family housing on brownfield lots which is helping population rise but it's not enough to keep up with demand. Boston is like San Francisco in that population is growing but it could grow even more if there was much more housing.
Title: Re: Census population estimates 2011-2019
Post by: Annatar on April 22, 2019, 09:25:18 PM
What's really slowing down growth in the metro areas and nationally is the rapidly falling fertility rate, that is why natural growth has gone from 0.6% to 0.3% from 2007 to 2017. Fertility in 2017 was 1.77, based off the first 9 months of birth data in 2018 it looks like it will fall to 1.72, a record low and in the states which have released birth data for the first few months of 2019 fertility has continued to fall. I would't be surprised if fertility went below 1.7 this year. The fall is driven in my opinion by cultural factors, there is a real shift among younger Americans towards 1 child families or not having children at all.
Title: Re: Census population estimates 2011-2019
Post by: Brittain33 on April 22, 2019, 09:25:19 PM
Brooklyn, Queens, and Bronx all peaked in 2016 after many years of growth and have had small but significant declines since then. Immigration crackdown? I'm really surprised to see Brooklyn losing population.
Oh, that's interesting. I hadn't connected it to dropping birth rates but I can see how that's a new factor.
Title: Re: Census population estimates 2011-2019
Post by: Cokeland Saxton on April 24, 2019, 01:01:45 AM
The slow growth in the Houston metro, and the Gulf coast of TX could also be connected to Harvey, such as with Aransas County having pretty much all its 2010 - 2017 growth undone.
The growth rebounding in the Permian Basin, such as Ector and Midland, are likely connected with a recovery in oil prices there.
The growth rebounding in the Permian Basin, such as Ector and Midland, are likely connected with a recovery in oil prices there.
Title: Re: Census population estimates 2011-2019
Post by: jamestroll on April 24, 2019, 03:51:04 AM
You can't have high taxes and bad weather and keep people around in 21st century America.
On the other hand you can argue that Chicago has picture perfect from May - October. The reverse of Phoenix essentially. Also there are no natural disasters that could destroy Chicago unlike many of these sun belt cities.
But the extremely harsh winters is literally the reason I never made the jump to move to Chicago.
IL, NY, it is sad.
Illinois won't be trending Republican because a lot of Republican voters are moving to AZ, FL, NC, NM.
Illinois won't be trending Republican because a lot of Republican voters are moving to AZ, FL, NC, NM.
Somewhat mitigated by a loss of black population but overall the state is shrinking and becoming more Democratic at the same time.
Title: Re: Census population estimates 2011-2019
Post by: Kevinstat on May 04, 2019, 09:48:51 AM
Any press release yet on what date this month the 2018 city and town (or "county subdivision") estimates will be released (with likely two days of embargoed media access - they'll list both dates in the press release)?
Title: Re: Census population estimates 2011-2019
Post by: Cokeland Saxton on May 04, 2019, 11:24:45 AM
Probably in a few weeks
Title: Re: Census population estimates 2011-2019
Post by: cinyc on May 07, 2019, 01:13:22 PM
Any press release yet on what date this month the 2018 city and town (or "county subdivision") estimates will be released (with likely two days of embargoed media access - they'll list both dates in the press release)?
They usually come out the Thursday before Memorial Day.
Edited to add: Census most recent tip sheet confirms this. They are scheduled for release on Thursday, May 23 with the media getting them on May 21.
Title: Re: Census population estimates 2011-2019
Post by: Suburbia on May 18, 2019, 09:26:14 PM
What does it say about Louisiana?
Why is Louisiana suffering?
Why is Louisiana suffering?
Title: Re: Census population estimates 2011-2019
Post by: Cokeland Saxton on May 20, 2019, 06:43:08 PM
What does it say about Louisiana?
Why is Louisiana suffering?
Why is Louisiana suffering?
Poverty, poor quality of life, New Orleans being prone to bad weather, a sluggish economy, and a homicide rate ranking in the top 10 of the 50 states
Title: Re: Census population estimates 2011-2019
Post by: danny on May 23, 2019, 04:50:39 AM
The city and town estimates for 2018 are starting to come out: https://www.census.gov/newsroom/press-releases/2019/subcounty-population-estimates.html
Title: Re: Census population estimates 2011-2019
Post by: Gass3268 on May 23, 2019, 08:42:56 AM
Fort Worth passed Columbus and San Francisco to move to the 13th largest city. Charlotte passed Indianapolis for the 16th largest city. Portland, Oregon passed Memphis to go to 25. Colorado Springs and Miami moved into the top 40. Tampa jumped into the top 50, passing New Orleans and Wichita. Henderson, NV topped 300,000 and Reno cracked 250,000.
Title: Re: Census population estimates 2011-2019
Post by: cinyc on May 23, 2019, 12:54:46 PM
Heres the new interactive map with the 18 vintage data. Default is percentage change of 2018 vs the 2010 Estimates base. To change maps, click on 18 Est % and select a year. 2010C-18 is vs. actual census numbers, which doesnt take into account annexations and the like.
2018 Est # show numerical changes. The prior vintage estimates are in 17/16 %# though theyre largely irrelevant now except to track changes in how Census estimated.
Theres also an isolate button on the main menu if you want to isolate a particular type of growth, like cities that increased by >20%.
https://cinycmaps.com/index.php/pop-change
Please let me know if you encounter any errors.
Title: Re: Census population estimates 2011-2019
Post by: Kevinstat on May 23, 2019, 07:41:22 PM
In the 2010 census, the State House "quotas" of Maine's largest municipalities** (those over 0.9/151 of Maine's population in any one of the three following tables), were as follows (with instances where the "Estimates Base" (EB) yields a different quota than the official census numbers noted in parentheses):
=7.6 (8*0.95) "cutoff"=
Portland city 7.5245 (EB 7.5244) (State Senate quota* 1.7441, between 1.05 and 1.9 "cutoffs")
=7.35 (7*1.05) "cutoff"=
...
=4.2 (4*1.05) "cutoff"=
Lewiston city 4.1596 (EB 4.1595) (State Senate quota* 0.9641, between 0.95 "cutoff" and 1.0 mark)
=4.0 mark=
=3.8 (4*0.95) "cutoff"=
Bangor city 3.7557 (EB 3.7539)
=3.15 (3*1.05) "cutoff"=
=3.0 mark=
=2.85 (3*0.95) "cutoff"=
South Portland city 2.8421 (EB 2.8423)
Auburn city 2.6208 (EB 2.6211)
Biddeford city 2.4186 (EB 2.4185)
Sanford city 2.3642 (EB 2.3634)
Brunswick town 2.3051 (EB 2.3052)
Augusta city 2.1753 (EB 2.1755)
Scarborough town 2.1506 (EB 2.1496)
Saco city 2.1009 (EB 2.1031)
=2.1 (2*1.05) "cutoff"=
=2.0 mark=
Westbrook city 1.9886 (EB 1.9910)
Windham town 1.9326 (EB 1.9321)
=1.9 (2*0.95) "cutoff"=
Gorham town 1.8621 (EB 1.8609)
Waterville city 1.7872 (EB 1.7873)
York town 1.4242 (EB 1.4228)
Falmouth town 1.2714 (EB 1.2709)
Kennebunk town 1.2275 (EB 1.2269)
Orono town 1.1779 (EB 1.1775)
Standish town 1.1224 (EB 1.1222)
Presque Isle city 1.1017
Wells town 1.0900
Kittery town 1.0788 (EB 1.0792)
Brewer city 1.0779 (EB 1.0782)
=1.05 "cutoff"=
Cape Elizabeth town 1.0248 (EB 1.0245)
Lisbon town 1.0241 (EB 1.0250)
=1.0 mark=
Topsham town 0.9985 (EB 0.9988)
Old Orchard Beach town 0.9803 (EB 0.9791)
Skowhegan town 0.9763 (EB 0.9758)
Bath city 0.9678
[Old Town city (0.8912 (EB 0.8919)) + Penobscot Indian Island Reservation (0.0693)] 0.9605 (EB 0.9612)
=0.95 "cutoff"=
Yarmouth town 0.9491 (EB 0.9492)
Caribou city 0.9309
Buxton town 0.9133 (EB 0.9134)
Freeport town 0.8956 (EB 0.8955)
...
Gray town 0.8822 (EB 0.8824)
...
Ellsworth city 0.8799
...
Cumberland town 0.8197 (EB 0.8188)
The largest municipalities as and according to the 2018 estimates and their State House "quotas" are as follows:
=7.6 (8*0.95) "cutoff"=
Portland city 7.4932 (State Senate quota* 1.7368, between 1.05 and 1.9 "cutoffs")
=7.35 (7*1.05) "cutoff"=
...
=4.2 (4*1.05) "cutoff"=
Lewiston city 4.0552 (State Senate quota* 0.9400, below 0.95 "cutoff")
=4.0 mark=
=3.8 (4*0.95) "cutoff"=
Bangor city 3.6099
=3.15 (3*1.05) "cutoff"=
=3.0 mark=
South Portland city 2.8889
=2.85 (3*0.95) "cutoff"=
Auburn city 2.6170
Biddeford city 2.4272
Sanford city 2.3899
Brunswick town 2.3107
Scarborough town 2.2961
Saco city 2.2280
Westbrook city 2.1407
Augusta city 2.1076
=2.1 (2*1.05) "cutoff"=
Windham town 2.0803
=2.0 mark=
Gorham town 1.9914
=1.9 (2*0.95) "cutoff"=
Waterville city 1.8780
York town 1.4837
Falmouth town 1.3809
Kennebunk town 1.3007
Orono town 1.2048
Wells town 1.1896
Standish town 1.1376
Kittery town 1.1108
Cape Elizabeth town 1.0507
=1.05 "cutoff"=
Brewer city 1.0211
Presque Isle city 1.0152
Lisbon town 1.0130
Old Orchard Beach town 1.0050
=1.0 mark=
Topsham town 0.9987
Yarmouth town 0.9610
Freeport town 0.9601
=0.95 "cutoff"=
Bath city 0.9397
Buxton town 0.9375
Skowhegan town 0.9312
Gray town 0.9258
Cumberland town 0.9212
Ellsworth city 0.9080
[Old Town city (0.8415) + Penobscot Indian Island Reservation (0.0660)] 0.9075
...
Caribou city 0.8590
Taking the "Estimates base" from April 1, 2010 (usually within a few people of the official numbers) shown in the same Census Bureau tables showing the above estimates, and adding to it the population gains (negative for losses) from that base to July 1, 2018 multiplied by 10/8.25 (I use a linear progression rather than exponential as it has the benefit of municipal projections being the same as county projections), the following are the projected 2020 State House "quotas" for all municipalities (in descending order) with projected (or 2010) quotas above 0.9000:
=7.6 (8*0.95) "cutoff"=
Portland city 7.4867 (State Senate quota* 1.7353, between 1.05 and 1.9 "cutoffs")
=7.35 (7*1.05) "cutoff"=
...
=4.2 (4*1.05) "cutoff"=
Lewiston city 4.0333 (State Senate quota* 0.9349, below 0.95 "cutoff")
=4.0 mark=
=3.8 (4*0.95) "cutoff"=
Bangor city 3.5797
=3.15 (3*1.05) "cutoff"=
=3.0 mark=
South Portland city 2.8987
=2.85 (3*0.95) "cutoff"=
Auburn city 2.6161
Biddeford city 2.4291
Sanford city 2.3955
Scarborough town 2.3269
Brunswick town 2.3118
Saco city 2.2542
Westbrook city 2.1721
Windham town 2.1115
=2.1 (2*1.05) "cutoff"=
Augusta city 2.0933
Gorham town 2.0188
=2.0 mark=
=1.9 (2*0.95) "cutoff"=
Waterville city 1.8971
York town 1.4965
Falmouth town 1.4041
Kennebunk town 1.3162
Orono town 1.2105
Wells town 1.2105
Standish town 1.1408
Kittery town 1.1175
Cape Elizabeth town 1.0562
=1.05 "cutoff"=
Lisbon town 1.0105
Old Orchard Beach town 1.0105
Brewer city 1.0092
=1.0 mark=
Topsham town 0.9987
Presque Isle city 0.9970
Freeport town 0.9737
Yarmouth town 0.9635
=0.95 "cutoff"=
Cumberland town 0.9427
Buxton town 0.9426
Gray town 0.9349
Bath city 0.9338
Skowhegan town 0.9219
Ellsworth city 0.9139
[Old Town city (0.8309) + Penobscot Indian Island Reservation (0.0653)] 0.8962
...
Caribou city 0.8439
*assuming 35 Senators. With 33 or 31, Lewiston would be too small for a Senate district even under the 2010 Census figures. Portland would still be comfortably between 1.05 and 1.9 State Senate quotas.
**I grouped Old Town city and the Penobscot Indian Island Reservation (big enough for a House district in 2010, although there are a couple census blocks (perhaps with no population) outside those two municipalities in that district, I think because they were entirely surrounded by the Penobscot Reservation) together, as technically Old Town doesn't belong in these tables but I thought it should be included.
=7.6 (8*0.95) "cutoff"=
Portland city 7.5245 (EB 7.5244) (State Senate quota* 1.7441, between 1.05 and 1.9 "cutoffs")
=7.35 (7*1.05) "cutoff"=
...
=4.2 (4*1.05) "cutoff"=
Lewiston city 4.1596 (EB 4.1595) (State Senate quota* 0.9641, between 0.95 "cutoff" and 1.0 mark)
=4.0 mark=
=3.8 (4*0.95) "cutoff"=
Bangor city 3.7557 (EB 3.7539)
=3.15 (3*1.05) "cutoff"=
=3.0 mark=
=2.85 (3*0.95) "cutoff"=
South Portland city 2.8421 (EB 2.8423)
Auburn city 2.6208 (EB 2.6211)
Biddeford city 2.4186 (EB 2.4185)
Sanford city 2.3642 (EB 2.3634)
Brunswick town 2.3051 (EB 2.3052)
Augusta city 2.1753 (EB 2.1755)
Scarborough town 2.1506 (EB 2.1496)
Saco city 2.1009 (EB 2.1031)
=2.1 (2*1.05) "cutoff"=
=2.0 mark=
Westbrook city 1.9886 (EB 1.9910)
Windham town 1.9326 (EB 1.9321)
=1.9 (2*0.95) "cutoff"=
Gorham town 1.8621 (EB 1.8609)
Waterville city 1.7872 (EB 1.7873)
York town 1.4242 (EB 1.4228)
Falmouth town 1.2714 (EB 1.2709)
Kennebunk town 1.2275 (EB 1.2269)
Orono town 1.1779 (EB 1.1775)
Standish town 1.1224 (EB 1.1222)
Presque Isle city 1.1017
Wells town 1.0900
Kittery town 1.0788 (EB 1.0792)
Brewer city 1.0779 (EB 1.0782)
=1.05 "cutoff"=
Cape Elizabeth town 1.0248 (EB 1.0245)
Lisbon town 1.0241 (EB 1.0250)
=1.0 mark=
Topsham town 0.9985 (EB 0.9988)
Old Orchard Beach town 0.9803 (EB 0.9791)
Skowhegan town 0.9763 (EB 0.9758)
Bath city 0.9678
[Old Town city (0.8912 (EB 0.8919)) + Penobscot Indian Island Reservation (0.0693)] 0.9605 (EB 0.9612)
=0.95 "cutoff"=
Yarmouth town 0.9491 (EB 0.9492)
Caribou city 0.9309
Buxton town 0.9133 (EB 0.9134)
Freeport town 0.8956 (EB 0.8955)
...
Gray town 0.8822 (EB 0.8824)
...
Ellsworth city 0.8799
...
Cumberland town 0.8197 (EB 0.8188)
The largest municipalities as and according to the 2018 estimates and their State House "quotas" are as follows:
=7.6 (8*0.95) "cutoff"=
Portland city 7.4932 (State Senate quota* 1.7368, between 1.05 and 1.9 "cutoffs")
=7.35 (7*1.05) "cutoff"=
...
=4.2 (4*1.05) "cutoff"=
Lewiston city 4.0552 (State Senate quota* 0.9400, below 0.95 "cutoff")
=4.0 mark=
=3.8 (4*0.95) "cutoff"=
Bangor city 3.6099
=3.15 (3*1.05) "cutoff"=
=3.0 mark=
South Portland city 2.8889
=2.85 (3*0.95) "cutoff"=
Auburn city 2.6170
Biddeford city 2.4272
Sanford city 2.3899
Brunswick town 2.3107
Scarborough town 2.2961
Saco city 2.2280
Westbrook city 2.1407
Augusta city 2.1076
=2.1 (2*1.05) "cutoff"=
Windham town 2.0803
=2.0 mark=
Gorham town 1.9914
=1.9 (2*0.95) "cutoff"=
Waterville city 1.8780
York town 1.4837
Falmouth town 1.3809
Kennebunk town 1.3007
Orono town 1.2048
Wells town 1.1896
Standish town 1.1376
Kittery town 1.1108
Cape Elizabeth town 1.0507
=1.05 "cutoff"=
Brewer city 1.0211
Presque Isle city 1.0152
Lisbon town 1.0130
Old Orchard Beach town 1.0050
=1.0 mark=
Topsham town 0.9987
Yarmouth town 0.9610
Freeport town 0.9601
=0.95 "cutoff"=
Bath city 0.9397
Buxton town 0.9375
Skowhegan town 0.9312
Gray town 0.9258
Cumberland town 0.9212
Ellsworth city 0.9080
[Old Town city (0.8415) + Penobscot Indian Island Reservation (0.0660)] 0.9075
...
Caribou city 0.8590
Taking the "Estimates base" from April 1, 2010 (usually within a few people of the official numbers) shown in the same Census Bureau tables showing the above estimates, and adding to it the population gains (negative for losses) from that base to July 1, 2018 multiplied by 10/8.25 (I use a linear progression rather than exponential as it has the benefit of municipal projections being the same as county projections), the following are the projected 2020 State House "quotas" for all municipalities (in descending order) with projected (or 2010) quotas above 0.9000:
=7.6 (8*0.95) "cutoff"=
Portland city 7.4867 (State Senate quota* 1.7353, between 1.05 and 1.9 "cutoffs")
=7.35 (7*1.05) "cutoff"=
...
=4.2 (4*1.05) "cutoff"=
Lewiston city 4.0333 (State Senate quota* 0.9349, below 0.95 "cutoff")
=4.0 mark=
=3.8 (4*0.95) "cutoff"=
Bangor city 3.5797
=3.15 (3*1.05) "cutoff"=
=3.0 mark=
South Portland city 2.8987
=2.85 (3*0.95) "cutoff"=
Auburn city 2.6161
Biddeford city 2.4291
Sanford city 2.3955
Scarborough town 2.3269
Brunswick town 2.3118
Saco city 2.2542
Westbrook city 2.1721
Windham town 2.1115
=2.1 (2*1.05) "cutoff"=
Augusta city 2.0933
Gorham town 2.0188
=2.0 mark=
=1.9 (2*0.95) "cutoff"=
Waterville city 1.8971
York town 1.4965
Falmouth town 1.4041
Kennebunk town 1.3162
Orono town 1.2105
Wells town 1.2105
Standish town 1.1408
Kittery town 1.1175
Cape Elizabeth town 1.0562
=1.05 "cutoff"=
Lisbon town 1.0105
Old Orchard Beach town 1.0105
Brewer city 1.0092
=1.0 mark=
Topsham town 0.9987
Presque Isle city 0.9970
Freeport town 0.9737
Yarmouth town 0.9635
=0.95 "cutoff"=
Cumberland town 0.9427
Buxton town 0.9426
Gray town 0.9349
Bath city 0.9338
Skowhegan town 0.9219
Ellsworth city 0.9139
[Old Town city (0.8309) + Penobscot Indian Island Reservation (0.0653)] 0.8962
...
Caribou city 0.8439
*assuming 35 Senators. With 33 or 31, Lewiston would be too small for a Senate district even under the 2010 Census figures. Portland would still be comfortably between 1.05 and 1.9 State Senate quotas.
**I grouped Old Town city and the Penobscot Indian Island Reservation (big enough for a House district in 2010, although there are a couple census blocks (perhaps with no population) outside those two municipalities in that district, I think because they were entirely surrounded by the Penobscot Reservation) together, as technically Old Town doesn't belong in these tables but I thought it should be included.
Title: Re: Census population estimates 2011-2019
Post by: Nyvin on May 24, 2019, 07:56:34 PM
What does it say about Louisiana?
Why is Louisiana suffering?
Why is Louisiana suffering?
Poverty, poor quality of life, New Orleans being prone to bad weather, a sluggish economy, and a homicide rate ranking in the top 10 of the 50 states
Also thanks to Bobby Jindal's economy.
Title: Re: Census population estimates 2011-2019
Post by: Cokeland Saxton on May 25, 2019, 12:19:33 AM
150 largest cities as of 2018:
1. New York, NY (8,398,748)
2. Los Angeles, CA (3,990,456)
3. Chicago, IL (2,705,994)
4. Houston, TX (2,325,502)
5. Phoenix, AZ (1,660,272)
6. Philadelphia, PA (1,584,138)
7. San Antonio, TX (1,532,233)
8. San Diego, CA (1,425,976)
9. Dallas, TX (1,345,047)
10. San Jose, CA (1,030,149)
11. Austin, TX (964,254)
12. Jacksonville, FL (903,889)
13. Fort Worth, TX (895,008)
14. Columbus, OH (892,533)
15. San Francisco, CA (883,305)
16. Charlotte, NC (872,498)
17. Indianapolis, IN (867,125)
18. Seattle, WA (744,955)
19. Denver, CO (716,492)
20. Washington, DC (702,455)
21. Boston, MA (694,583)
22. El Paso, TX (682,669)
23. Detroit, MI (672,662)
24. Nashville, TN (669,053)
25. Portland, OR (653,115)
26. Memphis, TN (650,618)
27. Oklahoma City, OK (649,021)
28. Las Vegas, NV (644,644)
29. Louisville, KY (620,118)
30. Baltimore, MD (602,495)
31. Milwaukee, WI (592,025)
32. Albuquerque, NM (560,218)
33. Tucson, AZ (545,975)
34. Fresno, CA (530,093)
35. Mesa, AZ (508,958)
36. Sacramento, CA (508,529)
37. Atlanta, GA (498,044)
38. Kansas City, MO (491,918)
39. Colorado Springs, CO (472,688)
40. Miami, FL (470,914)
41. Raleigh, NC (469,298)
42. Omaha, NE (468,262)
43. Long Beach, CA (467,354)
44. Virginia Beach, VA (450,189)
45. Oakland, CA (429,082)
46. Minneapolis, MN (425,403)
47. Tulsa, OK (400,669)
48. Arlington, TX (398,112)
49. Tampa, FL (392,890)
50. New Orleans, LA (391,006)
51. Wichita, KS (389,255)
52. Cleveland, OH (383,793)
53. Bakersfield, CA (383,579)
54. Aurora, CO (374,114)
55. Anaheim, CA (352,005)
56. Honolulu, HI (347,397)
57. Santa Ana, CA (332,725)
58. Riverside, CA (330,063)
59. Corpus Christi, TX (326,554)
60. Lexington, KY (323,780)
61. Stockton, CA (311,178)
62. Henderson, NV (310,390)
63. St. Paul, MN (307,695)
64. St. Louis, MO (302,838)
65. Cincinnati, OH (302,605)
66. Pittsburgh, PA (301,048)
67. Greensboro, NC (294,722)
68. Anchorage, AK (291,538)
69. Plano, TX (288,061)
70. Lincoln, NE (287,401)
71. Orlando, FL (285,713)
72. Irvine (282,572)
73. Newark, NJ (282,090)
74. Toledo, OH (274,975)
75. Durham, NC (274,291)
76. Chula Vista, CA (271,651)
77. Fort Wayne, IN (267,633)
78. Jersey City, NJ (265,549)
79. St. Petersburg, FL (265,098)
80. Laredo, TX (261,639)
81. Madison, WI (258,054)
82. Chandler, AZ (257,165)
83. Buffalo, NY (256,304)
84. Lubbock, TX (255,885)
85. Scottsdale, AZ (255,310)
86. Reno, NV (250,998)
87. Glendale, AZ (250,702)
88. Gilbert, AZ (248,279)
89. Winston-Salem, NC (246,328)
90. North Las Vegas, NV (245,949)
91. Norfolk, VA (244,076)
92. Chesapeake, VA (242,634)
93. Garland, TX (242,507)
94. Irving, TX (242,242)
95. Hialeah, FL (238,942)
96. Fremont, CA (237,807)
97. Boise, ID (228,790)
98. Richmond, VA (228,783)
99. Baton Rouge, LA (221,599)
100. Spokane, WA (219,190)
101. Des Moines, IA (216,853)
102. Tacoma, WA (216,279)
103. San Bernardino, CA (215,941)
104. Modesto, CA (215,030)
105. Fontana, CA (213,739)
106. Santa Clarita, CA (210,089)
107. Birmingham, AL (209,880)
108. Oxnard, CA (209,877)
109. Fayetteville, NC (209,468)
110. Moreno Valley, CA (209,050)
111. Rochester, NY (206,284)
112. Glendale, CA (201,361)
113. Huntington Beach, CA (200,641)
114. Salt Lake City, UT (200,591)
115. Grand Rapids, MI (200,217)
116. Amarillo, TX (199,924)
117. Yonkers, NY (199,663)
118. Aurora, IL (199,602)
119. Montgomery, AL (198,218)
120. Akron, OH (198,006)
121. Little Rock, AR (197,881)
122. Huntsville, AL (197,318)
123. Augusta, GA (196,939)
124. Port St. Lucie, FL (195,248)
125. Grand Prairie, TX (194,614)
126. Columbus, GA (194,160)
127. Tallahassee, FL (193,551)
128. Overland Park, KS (192,536)
129. Tempe, AZ (192,364)
130. McKinney, TX (191,645)
131. Mobile, AL (189,572)
132. Cape Coral, FL (189,343)
133. Shreveport, LA (188,987)
134. Frisco, TX (188,170)
135. Knoxville, TN (187,500)
136. Worcester, MA (185,877)
137. Brownsville, TX (183,392)
138. Vancouver, WA (183,012)
139. Fort Lauderdale, FL (182,595)
140. Sioux Falls, SD (181,883)
141. Ontario, CA (181,107)
142. Chattanooga, TN (180,557)
143. Providence, RI (179,335)
144. Newport News, VA (178,626)
145. Rancho Cucamonga, CA (177,751)
146. Santa Rosa, CA (177,586)
147. Oceanside, CA (176,080)
148. Salem, OR (173,442)
149. Elk Grove, CA (172,886)
150. Garden Grove, CA (172,646)
Title: Re: Census population estimates 2011-2019
Post by: DINGO Joe on May 26, 2019, 05:39:29 PM
What does it say about Louisiana?
Why is Louisiana suffering?
Why is Louisiana suffering?
Poverty, poor quality of life, New Orleans being prone to bad weather, a sluggish economy, and a homicide rate ranking in the top 10 of the 50 states
Louisiana has been number one for homicides for like a decade now or more. I assumed the recent drop had to do with massive flooding in and around Baton Rouge in 2016 and Baton Rouge proper has lost population when it previously was one of the faster growing areas. For whatever reason, North Louisiana and the Atchafalaya Basin took total beatdowns last year. I can understand that the cost of doing business will erode the population in swamp areas (as the swamps erode themselves) but I don't know any particular reason for the hefty drop in the North (save for Vernon Parish which seems to have some military related decline), It's never been economically vibrant up there, but they really can't even claim to be stagnant right now.
Title: Re: Census population estimates 2011-2019
Post by: Epaminondas on July 25, 2019, 02:52:49 AM
Naive question: which states (outside at-large) wouldn't redistrict if their house seat total was unaffected in 2020 ?
Title: Re: Census population estimates 2011-2019
Post by: Tintrlvr on July 25, 2019, 06:55:58 AM
Naive question: which states (outside at-large) wouldn't redistrict if their house seat total was unaffected in 2020 ?
Every state is required to redistrict for OMOV. Even states like Maine will shuffle a few towns around the edges, as in 2010. It is deeply unlikely that any state would have population changes so uniform that no tweaks to the maps were required.
Title: Re: Census population estimates 2011-2019
Post by: America Needs a 13-6 Progressive SCOTUS on July 26, 2019, 11:59:57 AM
Naive question: which states (outside at-large) wouldn't redistrict if their house seat total was unaffected in 2020 ?
Every state is required to redistrict for OMOV. Even states like Maine will shuffle a few towns around the edges, as in 2010. It is deeply unlikely that any state would have population changes so uniform that no tweaks to the maps were required.
Title: Re: Census population estimates 2011-2019
Post by: Strudelcutie4427 on July 26, 2019, 01:26:21 PM
Naive question: which states (outside at-large) wouldn't redistrict if their house seat total was unaffected in 2020 ?
If any itd be one of the smaller ones like NH, ME, or HI
Title: Re: Census population estimates 2011-2019
Post by: jimrtex on July 27, 2019, 12:34:55 AM
Naive question: which states (outside at-large) wouldn't redistrict if their house seat total was unaffected in 2020 ?
Every state is required to redistrict for OMOV. Even states like Maine will shuffle a few towns around the edges, as in 2010. It is deeply unlikely that any state would have population changes so uniform that no tweaks to the maps were required.
I doubt that there is the political will to put Manchester and Nashua in the same district.
It is quite possible that swapping no single town will make the districts more equal, but I suspect that there is some swap of two or three towns that would be. In any case, NH would make an affirmative decision to re-enact the existing districts, rather than not redistricting.
Title: Re: Census population estimates 2011-2019
Post by: cinyc on September 10, 2019, 12:53:43 AM
This is a work in progress in the beta testing stage, but here's an interactive map of the percentage/numerical change in total population by census tract. There are submaps for 2010-"15", 2000-"15" and 2000-10 (click on Tot Est % or Tot Est #, then the year).
The "2015" data is from the 2013-17 American Community Survey (2015 is the midpoint of that data); the 2000 estimates were based on percentage land area from the 2000-10 tract relationship tables.
https://cinycmaps.com/index.php/population-change/tract-population-change
Red is an increase; blue is a decrease.
Let me know if you encounter any errors or something that looks just plain wrong. Like I said, this is in beta.
Jimrtex - would using percentage population from the relationship tables yield a more accurate result? I'm ultimately going to estimate the changes in racial data, too.
Title: Re: Census population estimates 2011-2019
Post by: jimrtex on September 10, 2019, 05:19:04 AM
This is a work in progress in the beta testing stage, but here's an interactive map of the percentage/numerical change in total population by census tract. There are submaps for 2010-"15", 2000-"15" and 2000-10 (click on Tot Est % or Tot Est #, then the year).
The "2015" data is from the 2013-17 American Community Survey (2015 is the midpoint of that data); the 2000 estimates were based on percentage land area from the 2000-10 tract relationship tables.
https://cinycmaps.com/index.php/population-change/tract-population-change
Red is an increase; blue is a decrease.
Let me know if you encounter any errors or something that looks just plain wrong. Like I said, this is in beta.
Jimrtex - would using percentage population from the relationship tables yield a more accurate result? I'm ultimately going to estimate the changes in racial data, too.
The "2015" data is from the 2013-17 American Community Survey (2015 is the midpoint of that data); the 2000 estimates were based on percentage land area from the 2000-10 tract relationship tables.
https://cinycmaps.com/index.php/population-change/tract-population-change
Red is an increase; blue is a decrease.
Let me know if you encounter any errors or something that looks just plain wrong. Like I said, this is in beta.
Jimrtex - would using percentage population from the relationship tables yield a more accurate result? I'm ultimately going to estimate the changes in racial data, too.
I would look into graying out low-population census tracts - or possibly any of the form
98xxxx (decimal suppressed).
In Texas, most of the dark blue tracts are of this type, and include tracts with airports or military bases outside base housing. The ACS might not even sample these areas. For the census, hotels are asked to report any persons who are resident - it might even be all guests are asked whether they are reported elsewhere, so as to prevent double counting.
I think that for some persons, "usual residence" means where they sleep most often.
A salesman may not have a conventional domicile, or may have established a base in a hotel. There may only be a handful of such persons. Trying to locate them by sample during the ACS may be impossible. Similarly, I doubt that an effort is made to locate persons sleeping rough or in cars.
The census bureau permits delineation of census tracts for areas that are largely non-residential (I think 98xx.xx is the code for these). This might have been new for 2010.
If there is a hotel in (on the edge of) a residential census tract, it might not be counted by the ACS, but this will have little impact on overall population of the tract. But a hotel on an airport might represent most if not all of the population counted in the census, and not be included in the ACS.
I don't understand your last question.
Title: Re: Census population estimates 2011-2019
Post by: cinyc on September 10, 2019, 10:38:28 AM
What minimum population threshold would you suggest? 10? 25? 50? 100?
My other question is this: The 2000-10 Census Relationship file compares the 2000 census tracts to fit into the 2010 a number of ways. One way is by comparing percentage of land area in a given tract, AREALANDPCT00PT. Another is by comparing population, POPPCT00. Which should I be using when guestimating 2000 in the 2010 tracts?
So far in the beta, Ive been using land area. Does Pop make more sense? Eventually, Im going to guestimate change in Hispanic and Non-Hispanic White, etc. populations, too. Neither will be perfect there.
Title: Re: Census population estimates 2011-2019
Post by: jimrtex on September 11, 2019, 10:27:34 AM
What minimum population threshold would you suggest? 10? 25? 50? 100?
My other question is this: The 2000-10 Census Relationship file compares the 2000 census tracts to fit into the 2010 a number of ways. One way is by comparing percentage of land area in a given tract, AREALANDPCT00PT. Another is by comparing population, POPPCT00. Which should I be using when guestimating 2000 in the 2010 tracts?
So far in the beta, Ive been using land area. Does Pop make more sense? Eventually, Im going to guestimate change in Hispanic and Non-Hispanic White, etc. populations, too. Neither will be perfect there.
My other question is this: The 2000-10 Census Relationship file compares the 2000 census tracts to fit into the 2010 a number of ways. One way is by comparing percentage of land area in a given tract, AREALANDPCT00PT. Another is by comparing population, POPPCT00. Which should I be using when guestimating 2000 in the 2010 tracts?
So far in the beta, Ive been using land area. Does Pop make more sense? Eventually, Im going to guestimate change in Hispanic and Non-Hispanic White, etc. populations, too. Neither will be perfect there.
POPPCT00 would show the percentage of the 2010 population that was in a particular 2000 Census Tract???
If a 2000 tract was divided, the 2010 tracts might have similar population since the goal would be to create tracts near the target population of 4000. But that might not reflect the situation in 2000. In an area of rapid development one of the 2010 tracts might have been largely built out by 2000, and the other was newly built.
But using area might be even worse. The more developed area may be ready to be placed in an essentially permanent tract. There is no more space that can be developed, and the newly developed areas also include undeveloped land from when the area was part of a rural census tract.
But there are census tracts of 10,000 that could have or should have been divided in 2010, that only have 12,000 persons in 2015, and if divided for 2020 would to some degree match the 2010 distribution.
The closer the 2000 population of an old 2000 tract matches the combined 2010 population of the new for 2010 tracts, the better the distribution is going to be.
Probably more work than you want to do, but you could use 2000 census blocks with 2010 tract boundaries, but the census blocks have been renumbered, and might not match the 2010 tract boundaries.
Title: Re: Census population estimates 2011-2019
Post by: cinyc on September 11, 2019, 07:39:33 PM
POPPCT00 would show the percentage of the 2010 population that was in a particular 2000 Census Tract???
It shows the PCT Of 2000 population in the new 2010 census tract. I've changed the maps to be based on that instead of land area.
The interactive maps are now all there at the above link - though I might change one thing:
Maps under the Tot Pop tab show change over time in Total Pop, NH Wh change over time in the Non-Hispanic White population, etc. Within those tabs, the default maps set a minimum tract population size to get colored its currently 100 for Total Pop and 50 of the type for races/Hispanic origin. I will probably lower these to 70/35 to solve a problem in Loving County, TX over the next few days.
Within each of those tabs, the maps are sorted by PCT Change or NUMerical change, then by year. Min maps have the minimum threshold; All maps color all tracts without the 100/50 min threshold.
The 10th tab, Pop PCT, contains maps of the overall percentage share of each race. The Top maps show the top race in each tract & PCT for the 8 racial/Hispanic groups. The Race PCT maps map the percentage of the selected race in each tract. The Rel CHG maps map the change from one cycle to another. Unfortunately, I was only able to map NH White, Hispanic, NH Black and NH Asian in the Rel CHG maps due to the size of the data file.
Let me know if you encounter any errors. If some maps arent appearing, you might have to clear your browser cache.
Title: Re: Census population estimates 2011-2019
Post by: cinyc on September 29, 2019, 10:54:10 PM
The 2018 1-year ACS came out last Thursday. The top 10 CDs by population as of 7/1/18 are:
MT-AL 1,062,305
DE-AL 967,171
TX-22 935,386
ID-01 912,950
FL-09 902,812
TX-03 899,784
TX-10 896,798
TX-26 894,192
TX-31 883,347
SD-AL 882,235
RI-01 and 02 are the smallest, followed by WV-03 and WY-AL. RI and WV will likely lose a seat after 2020. MT was estimated to be larger than RI as of 7/1/18 - but we knew that last December.
I'm working on an interactive CD mapping tool. It currently shows estimated population change, racial and ancestry characteristics of each CD. I will eventually add election maps. They're on my website, here (https://cinycmaps.com/index.php/cd-multimap).
Title: Re: Census population estimates 2011-2019
Post by: 🐒Gods of Prosperity🔱🐲💸 on September 29, 2019, 11:20:36 PM
Great job on the website cinyc!
I was looking at the population change map for Norfolk, Va. I saw what I thought must have been a mistake for Census tract 38, a 87% decrease in a nice area that's been pretty stable. Looked around a bit and found this:
https://data.census.gov/cedsci/table?q=virginia%20population&hidePreview=true&table=P1&tid=DECENNIALSF12010.P1&g=0400000US51_1400000US51710003800&vintage=2018&layer=censustract&cid=DP05_0001E&lastDisplayedRow=15
has a note with the revised count and mentions the 2010 Census Count Question Resolution - which is where cities and towns can question what the count was, and the census makes a revision. I don't know if there is data anywhere that incorporates all the revised counts from this.
Title: Re: Census population estimates 2011-2019
Post by: cinyc on September 29, 2019, 11:32:18 PM
Great job on the website cinyc!
I was looking at the population change map for Norfolk, Va. I saw what I thought must have been a mistake for Census tract 38, a 87% decrease in a nice area that's been pretty stable. Looked around a bit and found this:
https://data.census.gov/cedsci/table?q=virginia%20population&hidePreview=true&table=P1&tid=DECENNIALSF12010.P1&g=0400000US51_1400000US51710003800&vintage=2018&layer=censustract&cid=DP05_0001E&lastDisplayedRow=15
has a note with the revised count and mentions the 2010 Census Count Question Resolution - which is where cities and towns can question what the count was, and the census makes a revision. I don't know if there is data anywhere that incorporates all the revised counts from this.
I was looking at the population change map for Norfolk, Va. I saw what I thought must have been a mistake for Census tract 38, a 87% decrease in a nice area that's been pretty stable. Looked around a bit and found this:
https://data.census.gov/cedsci/table?q=virginia%20population&hidePreview=true&table=P1&tid=DECENNIALSF12010.P1&g=0400000US51_1400000US51710003800&vintage=2018&layer=censustract&cid=DP05_0001E&lastDisplayedRow=15
has a note with the revised count and mentions the 2010 Census Count Question Resolution - which is where cities and towns can question what the count was, and the census makes a revision. I don't know if there is data anywhere that incorporates all the revised counts from this.
Yeah - there will be errors in the 2010 Census data that have since been corrected. I downloaded the data from the actual 2010 Census, so the CCQR program has not been taken into account (it probably has in some of my incorporated place pop change maps of using Census' population estimates program maps where I used the 10 Estimates Base, instead of 10 Census).
There's also a known error in some Ancestry tracts that I need to fix because I used the 10 Census CBS 500k tract map, and Census changed the GEOIDs after 2010 to relect mistakes. The 2013-17 ACS uses the corrected GEOIDs. I made all the necessary changes for the Pop Change/Racial CD maps, but not the Ancestry CD maps - yet.
The other minor issue is that the legend/popup says Votes instead of Population/NH Whites/Hispanics, etc. in some places. That's a legacy coding issue (the code was written for election maps) that's on my to-do list to fix- along with allowing you to choose what minimum pop/votes you want to grey out. The latter is going to be a bit more difficult to implement, since it involves math.
The final issue is that I didn't break down tracts that are split between CDs, so the total pop will appear in both. It's not clear to me how to fix that without spending way more time than I'd want to.
Title: Re: Census population estimates 2011-2019
Post by: cinyc on September 30, 2019, 12:01:04 AM
I don't know if there is data anywhere that incorporates all the revised counts from this.
I found Census' 2010 errata notes (https://www2.census.gov/programs-surveys/decennial/2010/technical-documentation/errata-notes/errata.pdf).The reason for the errors in Norfolk (and San Diego, Groton, CT, Portsmouth, NH, Pascagoula, MS & Everett, WA) was... a systematic mistake in determining the placement of Navy vessels.
I'll put a fix on my to-do list.
Title: Re: Census population estimates 2011-2019
Post by: jimrtex on October 02, 2019, 04:30:46 AM
I don't know if there is data anywhere that incorporates all the revised counts from this.
I found Census' 2010 errata notes (https://www2.census.gov/programs-surveys/decennial/2010/technical-documentation/errata-notes/errata.pdf).The reason for the errors in Norfolk (and San Diego, Groton, CT, Portsmouth, NH, Pascagoula, MS & Everett, WA) was... a systematic mistake in determining the placement of Navy vessels.
I'll put a fix on my to-do list.
Even if the ships had been located correctly, it would not reflect the domicile of those assigned to the ship.
Title: Re: Census population estimates 2011-2019
Post by: Tender Branson on October 19, 2019, 05:04:26 AM
*
Title: Re: Census population estimates 2011-2019
Post by: Tender Branson on October 19, 2019, 05:04:40 AM
**
Title: Re: Census population estimates 2011-2019
Post by: Tender Branson on October 19, 2019, 05:04:51 AM
***
Title: Re: Census population estimates 2011-2019
Post by: Tender Branson on October 19, 2019, 05:05:02 AM
****
Title: Re: Census population estimates 2011-2019
Post by: Tender Branson on October 19, 2019, 05:05:49 AM
*****
Title: Re: Census population estimates 2011-2019
Post by: Tender Branson on October 19, 2019, 05:10:43 AM
Some states like FL and WA have released their own estimates for April 1, 2019 already.
Florida has grown by 368.000 people to 21.209.000 this year, or by 1.8% - which is up from 1.7% the year before (+357.000 people).
Link (https://www.bebr.ufl.edu/population/data)
Washington has grown by 119.000 people to 7.546.000 this year, or by 1.6% - which is unchanged from the year before (+117.000 people).
Link (https://www.ofm.wa.gov/washington-data-research/population-demographics/population-estimates/april-1-official-population-estimates)
Title: Re: Census population estimates 2011-2019
Post by: Tender Branson on December 01, 2019, 02:45:13 AM
The mid-2019 estimates will be released on December 19.
Link (https://www.calendarwiz.com/calendars/popup.php?op=view&id=138758137&crd=cens1sample)
Link (https://www.calendarwiz.com/calendars/popup.php?op=view&id=138758137&crd=cens1sample)
Title: Re: Census population estimates 2011-2019
Post by: cinyc on December 03, 2019, 06:32:40 PM
The mid-2019 estimates will be released on December 19.
Link (https://www.calendarwiz.com/calendars/popup.php?op=view&id=138758137&crd=cens1sample)
Link (https://www.calendarwiz.com/calendars/popup.php?op=view&id=138758137&crd=cens1sample)
When is the 2014-18 5-year ACS coming out? The following Thursday?
Title: Re: Census population estimates 2011-2019
Post by: cinyc on December 10, 2019, 11:33:56 PM
The mid-2019 estimates will be released on December 19.
Link (https://www.calendarwiz.com/calendars/popup.php?op=view&id=138758137&crd=cens1sample)
Link (https://www.calendarwiz.com/calendars/popup.php?op=view&id=138758137&crd=cens1sample)
The link now says December 30. The 2014-18 5-year ACS will be released on the 19th.
Title: Re: Census population estimates 2011-2019
Post by: Tender Branson on December 12, 2019, 12:14:35 AM
AZs own mid-2019 estimate:
+112.000 or +1.6%
Link (https://population.az.gov/sites/default/files/documents/files/pop-estimates-1980-2019.xlsx)
+112.000 or +1.6%
Link (https://population.az.gov/sites/default/files/documents/files/pop-estimates-1980-2019.xlsx)
Title: Re: Census population estimates 2011-2019
Post by: Tender Branson on December 12, 2019, 12:20:26 AM
UT:
+54.000, or +1.7%
Link (https://gardner.utah.edu/wp-content/uploads/StateCountyPopEst-Dec2019.pdf)
+54.000, or +1.7%
Link (https://gardner.utah.edu/wp-content/uploads/StateCountyPopEst-Dec2019.pdf)
Title: Re: Census population estimates 2011-2019
Post by: Tender Branson on December 20, 2019, 02:16:20 PM
In the new release today, CA only grew by 0.3% last year, the lowest population growth rate since 1900:
http://www.dof.ca.gov/Forecasting/Demographics/Estimates/E-2/documents/PressReleaseJuly2019.pdf
200.000 more Californians left for other states than moved into the state last year ... (this was compensated by an international immigration surplus and of course a birth surplus).
http://www.dof.ca.gov/Forecasting/Demographics/Estimates/E-2/documents/PressReleaseJuly2019.pdf
200.000 more Californians left for other states than moved into the state last year ... (this was compensated by an international immigration surplus and of course a birth surplus).
Title: Re: Census population estimates 2011-2019
Post by: Starry Eyed Jagaloon on December 20, 2019, 11:11:33 PM
In the new release today, CA only grew by 0.3% last year, the lowest population growth rate since 1900:
http://www.dof.ca.gov/Forecasting/Demographics/Estimates/E-2/documents/PressReleaseJuly2019.pdf
200.000 more Californians left for other states than moved into the state last year ... (this was compensated by an international immigration surplus and of course a birth surplus).
http://www.dof.ca.gov/Forecasting/Demographics/Estimates/E-2/documents/PressReleaseJuly2019.pdf
200.000 more Californians left for other states than moved into the state last year ... (this was compensated by an international immigration surplus and of course a birth surplus).
Title: Re: Census population estimates 2011-2019
Post by: Tender Branson on December 21, 2019, 12:27:23 AM
In the new release today, CA only grew by 0.3% last year, the lowest population growth rate since 1900:
http://www.dof.ca.gov/Forecasting/Demographics/Estimates/E-2/documents/PressReleaseJuly2019.pdf
200.000 more Californians left for other states than moved into the state last year ... (this was compensated by an international immigration surplus and of course a birth surplus).
http://www.dof.ca.gov/Forecasting/Demographics/Estimates/E-2/documents/PressReleaseJuly2019.pdf
200.000 more Californians left for other states than moved into the state last year ... (this was compensated by an international immigration surplus and of course a birth surplus).
Ehhh, this is a good development in fact.
Population growth largely sucks and leads to the destruction of CA and the planet.
Stop being such a growth fetishist.
Title: Re: Census population estimates 2011-2019
Post by: Starry Eyed Jagaloon on December 21, 2019, 12:37:48 AM
In the new release today, CA only grew by 0.3% last year, the lowest population growth rate since 1900:
http://www.dof.ca.gov/Forecasting/Demographics/Estimates/E-2/documents/PressReleaseJuly2019.pdf
200.000 more Californians left for other states than moved into the state last year ... (this was compensated by an international immigration surplus and of course a birth surplus).
http://www.dof.ca.gov/Forecasting/Demographics/Estimates/E-2/documents/PressReleaseJuly2019.pdf
200.000 more Californians left for other states than moved into the state last year ... (this was compensated by an international immigration surplus and of course a birth surplus).
Ehhh, this is a good development in fact.
Population growth largely sucks and leads to the destruction of CA and the planet.
Stop being such a growth fetishist.
Title: Re: Census population estimates 2011-2019
Post by: Tender Branson on December 25, 2019, 01:57:35 AM
In the new release today, CA only grew by 0.3% last year, the lowest population growth rate since 1900:
http://www.dof.ca.gov/Forecasting/Demographics/Estimates/E-2/documents/PressReleaseJuly2019.pdf
200.000 more Californians left for other states than moved into the state last year ... (this was compensated by an international immigration surplus and of course a birth surplus).
http://www.dof.ca.gov/Forecasting/Demographics/Estimates/E-2/documents/PressReleaseJuly2019.pdf
200.000 more Californians left for other states than moved into the state last year ... (this was compensated by an international immigration surplus and of course a birth surplus).
Ehhh, this is a good development in fact.
Population growth largely sucks and leads to the destruction of CA and the planet.
Stop being such a growth fetishist.
Growth fetishists like you dont understand that capitalism and (population) growth cannot go hand in hand with resource limitations ... thats only treating the symptoms, but not the illness itself. You have to bring (population) growth to zero or make it decline like Japan to stop emissions, global natural exploitation and destruction.
Title: Re: Census population estimates 2011-2019
Post by: ○∙◄☻¥tπ[╪AV┼cVê└ on December 25, 2019, 02:12:08 AM
The problem is Prop. 13. Younger people are sick of subsidizing ungrateful older rich people's property taxes.
Title: Re: Census population estimates 2011-2019
Post by: Lord Halifax on December 25, 2019, 04:29:38 AM
In the new release today, CA only grew by 0.3% last year, the lowest population growth rate since 1900:
http://www.dof.ca.gov/Forecasting/Demographics/Estimates/E-2/documents/PressReleaseJuly2019.pdf
200.000 more Californians left for other states than moved into the state last year ... (this was compensated by an international immigration surplus and of course a birth surplus).
http://www.dof.ca.gov/Forecasting/Demographics/Estimates/E-2/documents/PressReleaseJuly2019.pdf
200.000 more Californians left for other states than moved into the state last year ... (this was compensated by an international immigration surplus and of course a birth surplus).
Ehhh, this is a good development in fact.
Population growth largely sucks and leads to the destruction of CA and the planet.
Stop being such a growth fetishist.
The Western lifestyle is extremely resource consuming (if you want to lower global CO2 and methane emissions the last thing you want is more Americans), so it's definitely not a good thing to have population growth in the West instead of Africa or India.
It's a fantasy that population growth will reduce dependency on automobiles, that aint happening in America.
Title: Re: Census population estimates 2011-2019
Post by: Tender Branson on December 25, 2019, 07:10:20 AM
BTW, these were the mid-2018 estimates:
327,167,434
... in case there are any downward/upward revisions in the new estimates on Monday.
327,167,434
... in case there are any downward/upward revisions in the new estimates on Monday.
Title: Re: Census population estimates 2011-2019
Post by: cinyc on December 30, 2019, 12:39:31 AM
The 7/1/19 state estimates weren't released at midnight, best I can tell. The link still says December 30, so I suspect they'll drop in the morning.
Title: Re: Census population estimates 2011-2019
Post by: Tender Branson on December 30, 2019, 03:14:59 AM
The 7/1/19 state estimates weren't released at midnight, best I can tell. The link still says December 30, so I suspect they'll drop in the morning.
From what I remember, they are usually released after 3pm European Time (ca. 9am Eastern).
Title: Re: Census population estimates 2011-2019
Post by: Tender Branson on December 30, 2019, 03:57:59 AM
My guess:
The US population has likely grown by slightly over/under 2 million last year (+0.6%).
It could be the first time it grew by less than 2 million in decades (don't know exactly when it was the last time it was less than 2 million).
My guess is that natural population increase was "just" 980.000, the first time below 1 million, because births declined further. But it also depends on the development of deaths: The 1st half of 2018 had an abnormally high number of deaths, but the first half of 2019 had a large drop. At least in European countries. Which means that deaths in 2018-19 could have dropped by a lot more than births dropped, creating a higher natural population growth rate.
The international immigration surplus was probably around 1 million.
But depending on immigration, anything between 1.7 million to 2.3 million growth is possible (immigration surpluses ranged from 0.7 million in 2010-11 to 1.2 million in 2014-15).
Title: Re: Census population estimates 2011-2019
Post by: Tender Branson on December 30, 2019, 04:05:26 AM
My detailed prediction for mid-2019:
There will be a slight downward revision of the mid-2018 population base to 326.85 million.
The 2018-19 birth/death surplus was 1.03 million (largely unchanged from a year ago).
The international immigration surplus was 1.13 million (up by 150.000 from a year ago).
In total, the US population is up by 2.16 million (thanks to increased immigration from South America), or by 0.66%
My mid-2019 estimate is therefore 329.007.206 (+/- 300.000 people).
Florida, Idaho, Arizona, Utah or Nevada were probably the fastest growing states.
If I had to pick, it was probably UT.
Title: Re: Census population estimates 2011-2019
Post by: jimrtex on December 30, 2019, 06:39:51 AM
The press embargo begins at 10:00 AM EST December 30. T"he public release should be at 12:01 AM on January 1,
Has CSPAN ever covered a New Year's Eve event?
"Its a virtual sea of pocket protectors here as the revelers await the release of the 2019 state population estimates. Lots of cans of Red Bull and Jolt being opened."
(to man in the crowd) "What do you think of this event?"
(man) "I anticipate that California will lose a representative"
(producer) "Let's stay right here. We can cut back to Times Square at 10 after midnight.
Title: Re: Census population estimates 2011-2019
Post by: Tender Branson on December 30, 2019, 06:57:14 AM
The press embargo begins at 10:00 AM EST December 30. T"he public release should be at 12:01 AM on January 1,
Has CSPAN ever covered a New Year's Eve event?
"Its a virtual sea of pocket protectors here as the revelers await the release of the 2019 state population estimates. Lots of cans of Red Bull and Jolt being opened."
(to man in the crowd) "What do you think of this event?"
(man) "I anticipate that California will lose a representative"
(producer) "Let's stay right here. We can cut back to Times Square at 10 after midnight.
Has CSPAN ever covered a New Year's Eve event?
"Its a virtual sea of pocket protectors here as the revelers await the release of the 2019 state population estimates. Lots of cans of Red Bull and Jolt being opened."
(to man in the crowd) "What do you think of this event?"
(man) "I anticipate that California will lose a representative"
(producer) "Let's stay right here. We can cut back to Times Square at 10 after midnight.
I'm pretty sure the numbers will be released in 3 hours or so.
Title: Re: Census population estimates 2011-2019
Post by: Tender Branson on December 30, 2019, 09:37:26 AM
The population has increased by just 1.55 million last year.
+0.47%
+0.47%
Title: Re: Census population estimates 2011-2019
Post by: Tender Branson on December 30, 2019, 09:48:29 AM
BTW, these were the mid-2018 estimates:
327,167,434
... in case there are any downward/upward revisions in the new estimates on Monday.
327,167,434
... in case there are any downward/upward revisions in the new estimates on Monday.
The old mid-2018 estimates were revised down by about half a million to 326,687,501 and the new mid-2019 estimate is 328,239,523.
+1.552.022 people
There were 3.791.712 births and 2.835.038 deaths for a 956.674 natural increase.
Net international immigration surplus was only 595.348 - only half the 2015 and 2016 levels.
Title: Re: Census population estimates 2011-2019
Post by: Annatar on December 30, 2019, 09:53:16 AM
I think that is the first time US growth has gone below 0.5% since the Census Bureau started tracking population estimates year to year.
Also there is a real chance now the US might not reach 330 million by time of the Census which is on April 1 2020 if the 2018-19 population growth rate is what occurs through to April 2020.
Also there is a real chance now the US might not reach 330 million by time of the Census which is on April 1 2020 if the 2018-19 population growth rate is what occurs through to April 2020.
Title: Re: Census population estimates 2011-2019
Post by: Tender Branson on December 30, 2019, 09:59:17 AM
I think that is the first time US growth has gone below 0.5% since the Census Bureau started tracking population estimates year to year.
It has never been that low.
Maybe in the 1920s or 1930s during the Economic Depression.
Title: Re: Census population estimates 2011-2019
Post by: Annatar on December 30, 2019, 10:01:31 AM
I think that is the first time US growth has gone below 0.5% since the Census Bureau started tracking population estimates year to year.
It has never been that low.
Maybe in the 1920s or 1930s during the Economic Depression.
Well even in 1930-1940 the population grew by 0.7% per annum and I doubt it dipped below 0.5% in any year.
Title: Re: Census population estimates 2011-2019
Post by: Tender Branson on December 30, 2019, 10:04:55 AM
I think that is the first time US growth has gone below 0.5% since the Census Bureau started tracking population estimates year to year.
Also there is a real chance now the US might not reach 330 million by time of the Census which is on April 1 2020 if the 2018-19 population growth rate is what occurs through to April 2020.
Also there is a real chance now the US might not reach 330 million by time of the Census which is on April 1 2020 if the 2018-19 population growth rate is what occurs through to April 2020.
As for the estimates projected to April 1, 2020 - it will fall short of 330 million.
But the 2020 Census could count more people than the estimates show.
In the 2000 Census for example, 281 million people were counted but only 274 million were estimated at that time ...
Title: Re: Census population estimates 2011-2019
Post by: Tender Branson on December 30, 2019, 10:08:09 AM
Here are the complete 2019 estimates:
https://www.census.gov/data/tables/time-series/demo/popest/2010s-national-total.html
https://www.census.gov/data/tables/time-series/demo/popest/2010s-national-total.html
Title: Re: Census population estimates 2011-2019
Post by: Tender Branson on December 30, 2019, 10:27:22 AM
Idaho was the fastest growing state between 2018-19 with +2.1%.
Followed by NV, AZ, UT, TX, SC, WA, CO, FL, NC and GA (all above 1%).
10 states lost population, with West Virginia having the biggest decline (-0.7%).
Followed by AK, IL, NY, HI, LA, CT, MS, VT and NJ.
Puerto Rico, after years of massive population losses, was stable last year (+340 people). Maybe a lot went back after going to FL after that Hurricane the year before (Puerto Rico continues to have a huge death surplus of 7.400).
Title: Re: Census population estimates 2011-2019
Post by: Nyvin on December 30, 2019, 10:32:05 AM
The Northeast region as a whole lost population last year. 10 states lost population too, one higher than last year.
New York lost almost 77k people, does that mean it'll lose two congressional districts?
New York lost almost 77k people, does that mean it'll lose two congressional districts?
Title: Re: Census population estimates 2011-2019
Post by: Tender Branson on December 30, 2019, 10:32:46 AM
4 states had more deaths than births last year (WV, ME, NH and VT).
UT had the highest birth rate (15.3 per 100.000 people), NH the lowest (8.8 per 100.000).
If Puerto Rico were a state, it would have the lowest birth rate at 6.7
UT also had the lowest death rate at 5.5, while WV had the highest at 12.5
UT also had the highest natural growth rate [+9.8] while WV had the biggest natural decline (-2.6).
Title: Re: Census population estimates 2011-2019
Post by: Tender Branson on December 30, 2019, 10:35:57 AM
2 states (NV and WV) had international migration losses, while the other 48 states + DC had gains resulting from international migrants.
FL, CA, TX, NY and MA had the largest immigration surpluses among those states.
FL, CA, TX, NY and MA had the largest immigration surpluses among those states.
Title: Re: Census population estimates 2011-2019
Post by: Zaybay on December 30, 2019, 10:40:36 AM
The Northeast region as a whole lost population last year. 10 states lost population too, one higher than last year.
New York lost almost 77k people, does that mean it'll lose two congressional districts?
New York lost almost 77k people, does that mean it'll lose two congressional districts?
Its looking extremely likely at this point.
Title: Re: Census population estimates 2011-2019
Post by: Tender Branson on December 30, 2019, 10:40:44 AM
Domestic migration patterns (2018-19):
23 states had a domestic migration gain from other states.
27 states + DC had a domestic migration loss from other states, meaning more people left for other states than came.
The biggest domestic gainers were FL, TX, AZ, NC, SC, GA, NV, WA, TN and CO - who all had a surplus of at least 30.000 people each.
The states with the biggest domestic losses to other states were CA, NY, IL, NJ, MA, LA, MI, MD, CT and PA.
Title: Re: Census population estimates 2011-2019
Post by: Tender Branson on December 30, 2019, 10:45:29 AM
The Census Bureau has now released a press statement as well:
https://www.census.gov/newsroom/press-releases/2019/popest-nation.html
()
Quote
2019 U.S. Population Estimates Continue to Show the Nations Growth Is Slowing
Natural Increase Drops Below 1 Million for the First Time in Decades Due to Fewer Births and More Deaths
DEC. 30, 2019 According to the U.S. Census Bureaus national and state population estimates released today, forty-two states and the District of Columbia had fewer births in 2019 than 2018, while eight states saw a birth increase. With fewer births in recent years and the number of deaths increasing, natural increase (or births minus deaths) has declined steadily over the past decade.
While natural increase is the biggest contributor to the U.S. population increase, it has been slowing over the last five years, said Dr. Sandra Johnson, a demographer/statistician in the Population Division of the Census Bureau. Natural increase, or when the number of births is greater than the number of deaths, dropped below 1 million in 2019 for the first time in decades.
The nations population was 328,239,523 in 2019, growing by 0.5% between 2018 and 2019, or 1,552,022 people. Annual growth peaked at 0.73% this decade in the period between 2014 and 2015. The growth between 2018 and 2019 is a continuation of a multiyear slowdown since that period.
The South, the largest of the four regions with a population of 125,580,448 in 2019, saw the largest numeric growth (1,011,015) and percentage growth (0.8%) between 2018 and 2019. This growth is driven mainly by natural increase (359,114) and net domestic migration (407,913), which is the movement of people from one area to another within the United States. The Northeast region, the smallest of the four regions with a population of 55,982,803 in 2019, saw population decrease for the first time this decade, declining by 63,817 or -0.1%. This decline was due to net domestic migration (-294,331), which offset population gains from natural increase (97,152) and net international migration (134,145), or the difference between the number of people moving into the country and out of the country.
Forty states and the District of Columbia saw population increases between 2018 and 2019. Ten states lost population between 2018 and 2019, four of which had losses over 10,000 people. The 10 states that lost population were New York (-76,790; -0.4%), Illinois (-51,250; -0.4%), West Virginia (-12,144; -0.7%), Louisiana (-10,896; -0.2%), Connecticut (-6,233; -0.2%), Mississippi (-4,871; -0.2%), Hawaii (-4,721; -0.3%), New Jersey (-3,835; 0.0%), Alaska (-3,594; -0.5%), and Vermont (-369 ; -0.1%).
Also released today were national- and state-level estimates of the components of population change, which include tables on births, deaths and migration.
Puerto Rico Population Estimates
Puerto Ricos population increased by 340 people (0.0%) between 2018 and 2019 after several years of annual population decline. This slight increase is due to total net migration, which was positive for the first time in years (7,733) and large enough to offset the natural decrease (-7,393).
"Though migration between 2018 and 2019 was large enough to increase the population this year, Puerto Ricos population remains below where it was at the start of the decade, explained Johnson.
Additional Highlights:
Nationally, net international migration continues to decrease, falling to 595,348 between 2018 and 2019. Between 2010 and 2019, the year with the highest net international migration was 2016 at 1,046,709; however, since 2016, the net international migration has been gradually decreasing each year.
Between 2018 and 2019, natural increase was 956,674, reflecting 3,791,712 births and 2,835,038 deaths.
42 states and the District of Columbia had fewer births in 2019 than 2018. Eight states saw increases in births - Washington (612), Utah (293), Nevada (232), Arizona (175), Idaho (166), Montana (66), Vermont (44), and Colorado (30).
Twenty-four states and the District of Columbia saw increases in their number of deaths compared to the previous year. Four states had more deaths than births, also called natural decrease: West Virginia (-4,679), Maine (-2,262), New Hampshire (-121) and Vermont (-53).
Twenty-seven states and the District of Columbia lost population through net domestic migration between 2018 and 2019, six of which had losses over 25,000, and three of which experienced losses greater than 100,000. The top states with net domestic migration loss were California (-203,414), New York (-180,649), Illinois (-104,986), New Jersey (-48,946), Massachusetts (-30,274) and Louisiana (-26,045).
Nine states had a population of over 10 million in 2019. Those states were California (39,512,223), Texas (28,995,881), Florida (21,477,737), New York (19,453,561), Pennsylvania (12,801,989), Illinois (12,671,821), Ohio (11,689,100), Georgia (10,617,423) and North Carolina (10,488,084).
During 2020, the Census Bureau will release estimates of the 2019 population for counties, cities and towns, and metropolitan and micropolitan statistical areas, as well as national, state and county population estimates by age, sex, race and Hispanic origin. Population estimates for Puerto Rico and its municipios by age and sex will be released as well. These estimates include counties and cities affected by the 2017 hurricane season. Vintage 2019 estimates will be the last official series of estimates released prior to the 2020 Census.
https://www.census.gov/newsroom/press-releases/2019/popest-nation.html
()
Title: Re: Census population estimates 2011-2019
Post by: Suburbia on December 30, 2019, 10:53:38 AM
Should NY cut taxes in 2020?
Title: Re: Census population estimates 2011-2019
Post by: Zaybay on December 30, 2019, 10:56:40 AM
Just looking at the numbers, it looks like CA will lose the CD, not MN.
Title: Re: Census population estimates 2011-2019
Post by: Tender Branson on December 30, 2019, 11:00:58 AM
If the growth of 2018-19 is projected to Census Day (x 0.75), 1 April 2020, about 329.5 million people should be counted in this operation. Plus around 0.5 million to 1 million military + dependents stationed overseas (who are also used to calculate EVs and CDs).
While the census count in 2010 matched the estimates, there was an overcount of 7 million people relative to the estimates in 2000.
While the census count in 2010 matched the estimates, there was an overcount of 7 million people relative to the estimates in 2000.
Title: Re: Census population estimates 2011-2019
Post by: Brittain33 on December 30, 2019, 11:11:29 AM
Just looking at the numbers, it looks like CA will lose the CD, not MN.
Do you or anyone else have updated projections?
Title: Re: Census population estimates 2011-2019
Post by: Zaybay on December 30, 2019, 11:22:35 AM
Just looking at the numbers, it looks like CA will lose the CD, not MN.
Do you or anyone else have updated projections?
They should be coming out soon.
Just eyeballing the census numbers, it doesnt look like CA is growing fast enough to maintain its current district count.
Title: Re: Census population estimates 2011-2019
Post by: Tender Branson on December 30, 2019, 11:38:22 AM
citypopulation.de has already updated their US page with the new numbers:
http://www.citypopulation.de/en/usa/states/admin/
If you click on the red arrow on the left of the US map, you can hover above the states to see growth rates since Census 2010.
http://www.citypopulation.de/en/usa/states/admin/
If you click on the red arrow on the left of the US map, you can hover above the states to see growth rates since Census 2010.
Title: Re: Census population estimates 2011-2019
Post by: Starpaul20 on December 30, 2019, 11:46:09 AM
Like I did last year, I decided to see what a Wyoming Rule house size would look like with the new population estimates. The house membership would expand to 566 seats, an increase of 131 over its current size:
( )
)
(States in red gain 1 seat, blue gains 2 seats, green gains 3 seats, yellow gains 4 seats, orange gains 5 or more and gray means no change)
Relative to last year, (https://uselectionatlas.org/FORUM/index.php?topic=166668.msg6591922#msg6591922) the house would increase 1 seat, with Arizona and Alabama gaining a seat each, and California losing one.
For comparison, here's what a Wyoming Rule house size looks like with the 2010 census results (547 seats):
()
(
(States in red gain 1 seat, blue gains 2 seats, green gains 3 seats, yellow gains 4 seats, orange gains 5 or more and gray means no change)
Relative to last year, (https://uselectionatlas.org/FORUM/index.php?topic=166668.msg6591922#msg6591922) the house would increase 1 seat, with Arizona and Alabama gaining a seat each, and California losing one.
For comparison, here's what a Wyoming Rule house size looks like with the 2010 census results (547 seats):
(
Title: Re: Census population estimates 2011-2019
Post by: Gass3268 on December 30, 2019, 11:47:47 AM
The Northeast region as a whole lost population last year. 10 states lost population too, one higher than last year.
New York lost almost 77k people, does that mean it'll lose two congressional districts?
New York lost almost 77k people, does that mean it'll lose two congressional districts?
Its looking extremely likely at this point.
And one could make the argument that both seats should come at the expense of Upstate New York.
Title: Re: Census population estimates 2011-2019
Post by: Brittain33 on December 30, 2019, 11:53:20 AM
The Northeast region as a whole lost population last year. 10 states lost population too, one higher than last year.
New York lost almost 77k people, does that mean it'll lose two congressional districts?
New York lost almost 77k people, does that mean it'll lose two congressional districts?
Its looking extremely likely at this point.
And one could make the argument that both seats should come at the expense of Upstate New York.
How does that math work when NYC + LI + Westchester have been growing at half the rate of the country, if even that much? I would think that they can no longer support more than 15 districts.
Title: Re: Census population estimates 2011-2019
Post by: cinyc on December 30, 2019, 12:06:21 PM
The Northeast region as a whole lost population last year. 10 states lost population too, one higher than last year.
New York lost almost 77k people, does that mean it'll lose two congressional districts?
New York lost almost 77k people, does that mean it'll lose two congressional districts?
Its looking extremely likely at this point.
And one could make the argument that both seats should come at the expense of Upstate New York.
How does that math work when NYC + LI + Westchester have been growing at half the rate of the country, if even that much? I would think that they can no longer support more than 15 districts.
It doesnt.
Title: Re: Census population estimates 2011-2019
Post by: Oryxslayer on December 30, 2019, 12:12:59 PM
The Northeast region as a whole lost population last year. 10 states lost population too, one higher than last year.
New York lost almost 77k people, does that mean it'll lose two congressional districts?
New York lost almost 77k people, does that mean it'll lose two congressional districts?
Its looking extremely likely at this point.
And one could make the argument that both seats should come at the expense of Upstate New York.
Well,it's not the city or her immediate suburbs behind the loss, that's been shown during the past counts. Last time I checked the mid-decade CD numbers, the NYC seats balanced each other out between those that had added pop and those that had shrunk. Maybe since the adjustment this year that changed, but it's still mostly the more Appalachian/rust belt upstate behind the losses. Of course, forcing the second cut to come from upstate after she already lost one is a challenge. It's more likely Long Island will bear the loss (probably NY02) since she is also losing pop.
()
Title: Re: Census population estimates 2011-2019
Post by: Gass3268 on December 30, 2019, 12:18:11 PM
The Northeast region as a whole lost population last year. 10 states lost population too, one higher than last year.
New York lost almost 77k people, does that mean it'll lose two congressional districts?
New York lost almost 77k people, does that mean it'll lose two congressional districts?
Its looking extremely likely at this point.
And one could make the argument that both seats should come at the expense of Upstate New York.
Well,it's not the city or her immediate suburbs behind the loss, that's been shown during the past counts. Last time I checked the mid-decade CD numbers, the NYC seats balanced each other out between those that had added pop and those that had shrunk. Maybe since the adjustment this year that changed, but it's still mostly the more Appalachian/rust belt upstate behind the losses. Of course, forcing the second cut to come from upstate after she already lost one is a challenge. It's more likely Long Island will bear the loss (probably NY02) since she is also losing pop.
()
I poorly worded what I wanted to say. Should have been closer that NYC probably shouldn't lose a seat given it's actually grown this decade. Agree with you that Upstate and LI are were the loses will probably take place.
Title: Re: Census population estimates 2011-2019
Post by: Nyvin on December 30, 2019, 12:23:52 PM
The Northeast region as a whole lost population last year. 10 states lost population too, one higher than last year.
New York lost almost 77k people, does that mean it'll lose two congressional districts?
New York lost almost 77k people, does that mean it'll lose two congressional districts?
Its looking extremely likely at this point.
And one could make the argument that both seats should come at the expense of Upstate New York.
How does that math work when NYC + LI + Westchester have been growing at half the rate of the country, if even that much? I would think that they can no longer support more than 15 districts.
NYC + Westchester + Rockland + Long Island is almost exactly 16 districts using 2018 estimates. Considering Upstate NY is declining a lot faster that probably won't change much in the census.
Currently the NYC area has something around 17 districts, but NY-17 doesn't have all of Westchester currently, so it'll probably take the rest of that county and move a bit further north.
Title: Re: Census population estimates 2011-2019
Post by: Zaybay on December 30, 2019, 12:26:50 PM
The Northeast region as a whole lost population last year. 10 states lost population too, one higher than last year.
New York lost almost 77k people, does that mean it'll lose two congressional districts?
New York lost almost 77k people, does that mean it'll lose two congressional districts?
Its looking extremely likely at this point.
And one could make the argument that both seats should come at the expense of Upstate New York.
The math doesnt add up for two upstate losses. The more likely result is that one seat upstate is lost along with one Long Island/East NYC seat.
Title: Re: Census population estimates 2011-2019
Post by: Brittain33 on December 30, 2019, 12:40:08 PM
Since I have 2018 estimates for population, let's (wrongly) assume that losses in 2019 and 2020 are evenly distributed across the state and NY loses 2 districts. 19,530,000 / 25 seats = 781k per district
Nassau + Suffolk = 3.6 seats
Nassau + Suffolk + Queens = 6.5 seats which is pretty much the current map, no?
LI + NYC = 14.3 seats - which is 1 seat overpopulated
LI + NYC + Westchester + Rockland = almost exactly 16 seats, again 1 seat overpopulated
Something's got to go in Brooklyn, Manhattan, or possibly the Bronx.
Title: Re: Census population estimates 2011-2019
Post by: cinyc on December 30, 2019, 12:41:26 PM
The Northeast region as a whole lost population last year. 10 states lost population too, one higher than last year.
New York lost almost 77k people, does that mean it'll lose two congressional districts?
New York lost almost 77k people, does that mean it'll lose two congressional districts?
Its looking extremely likely at this point.
And one could make the argument that both seats should come at the expense of Upstate New York.
The math doesnt add up for two upstate losses. The more likely result is that one seat upstate is lost along with one Long Island/East NYC seat.
The math might not add up to 2 lost seats at all. NY-26 is literally on the bubble in many of the analyses I've seen.
I'd bet that it will lose 2, though.
Title: Re: Census population estimates 2011-2019
Post by: Zaybay on December 30, 2019, 03:11:44 PM
DKE came out with its new reappointment prediction:
As Cinyc points out, NYs 26th seat is on the cusp of being lost, though this is better than the seats previous status as being lost.
As Cinyc points out, NYs 26th seat is on the cusp of being lost, though this is better than the seats previous status as being lost.
Title: Re: Census population estimates 2011-2019
Post by: Sol on December 30, 2019, 03:44:53 PM
Since I have 2018 estimates for population, let's (wrongly) assume that losses in 2019 and 2020 are evenly distributed across the state and NY loses 2 districts. 19,530,000 / 25 seats = 781k per district
Nassau + Suffolk = 3.6 seats
Nassau + Suffolk + Queens = 6.5 seats which is pretty much the current map, no?
LI + NYC = 14.3 seats - which is 1 seat overpopulated
LI + NYC + Westchester + Rockland = almost exactly 16 seats, again 1 seat overpopulated
Something's got to go in Brooklyn, Manhattan, or possibly the Bronx.
Nassau + Suffolk = 3.6 seats
Nassau + Suffolk + Queens = 6.5 seats which is pretty much the current map, no?
LI + NYC = 14.3 seats - which is 1 seat overpopulated
LI + NYC + Westchester + Rockland = almost exactly 16 seats, again 1 seat overpopulated
Something's got to go in Brooklyn, Manhattan, or possibly the Bronx.
Considering the fact that The Establishment in NY hates AOC, NY-14 would probably be the obvious cut no?
Title: Re: Census population estimates 2011-2019
Post by: cinyc on December 30, 2019, 03:57:41 PM
DKE came out with its new reappointment prediction:
As Cinyc points out, NYs 26th seat is on the cusp of being lost, though this is better than the seats previous status as being lost.
As Cinyc points out, NYs 26th seat is on the cusp of being lost, though this is better than the seats previous status as being lost.
New York's problem is that its rate of growth keeps on dropping like a rock. It's almost in a linear nosedive at this point:
Title: Re: Census population estimates 2011-2019
Post by: cinyc on December 30, 2019, 04:29:15 PM
Maps of the relative state change in population vs the nationwide average (a.k.a. the bear). Red = you beat the bear and may gain a seat or two in redistricting. Blue = you lose to the bear and the bear may eat you and one or more of your seats.
All you really need to do to avoid the bear is outrun your peers, though, not necessarily the bear.
All you really need to do to avoid the bear is outrun your peers, though, not necessarily the bear.
Title: Re: Census population estimates 2011-2019
Post by: Tender Branson on December 30, 2019, 04:30:43 PM
Hahaha, the Census Bureau has just released the projected New Year population, but using the old unrevised numbers.
Major fail !
https://www.census.gov/newsroom/press-releases/2019/new-years-2020.html
Major fail !
https://www.census.gov/newsroom/press-releases/2019/new-years-2020.html
Title: Re: Census population estimates 2011-2019
Post by: Tender Branson on December 30, 2019, 04:36:27 PM
Maps of the relative state change in population vs the nationwide average (a.k.a. the bear). Red = you beat the bear and may gain a seat or two in redistricting. Blue = you lose to the bear and the bear may eat you and one or more of your seats.
All you really need to do to avoid the bear is outrun your peers, though, not necessarily the bear.
All you really need to do to avoid the bear is outrun your peers, though, not necessarily the bear.
VA is interesting.
They used to grow faster than the US, but not any longer.
Why is that ?
Are they going the way of CA with skyrocketing property/rent prices that are keeping Americans out of the state (immigrants are still moving there) ?
Title: Re: Census population estimates 2011-2019
Post by: Former Dean Phillips Supporters for Haley (I guess???!?) 👁️ on December 30, 2019, 04:41:39 PM
Considering the fact that The Establishment in NY hates AOC, NY-14 would probably be the obvious cut no?
The 2 biggest issues there are that it is a predominantly Hispanic majority-minority seat (and the Hispanic population has been growing, not shrinking) and if NY-14 were cut, AOC would simply run in whichever district overlapped the most. And I doubt any other incumbents really want to be paired in a primary against her. So they will probably try to find an incumbent that is about ready to retire anyway and just have them retire (there are a bunch in their 70s and even 80s). Jose Serrano is not running for re-election in NY-15 (neighboring Hispanic district).
Another thing to note - a side effect of all this is that Max Rose's NY-11 is going to have to pick up some significant extra population/area, which should be able to make it safe Democratic. In particular if (as they should) they give it some more heavily Dem parts of Brooklyn (Park Slope probably being the most obvious/easy) and give some of the more competitive/R parts to the majority-minority districts that are going to be needing more population.
Title: Re: Census population estimates 2011-2019
Post by: Tender Branson on December 30, 2019, 04:47:32 PM
Maps of the relative state change in population vs the nationwide average (a.k.a. the bear). Red = you beat the bear and may gain a seat or two in redistricting. Blue = you lose to the bear and the bear may eat you and one or more of your seats.
All you really need to do to avoid the bear is outrun your peers, though, not necessarily the bear.
All you really need to do to avoid the bear is outrun your peers, though, not necessarily the bear.
VA is interesting.
They used to grow faster than the US, but not any longer.
Why is that ?
Are they going the way of CA with skyrocketing property/rent prices that are keeping Americans out of the state (immigrants are still moving there) ?
IN is the exact opposite:
It used to grow slower than the US, but now faster.
Why is that ?
Looking at the numbers, IN had a big international migration surplus of +15.000 last year.
Does IN have a lot of military stationed abroad who returned home ?
Because:
Quote
Net international migration for the United States includes the international migration of both native and foreign-born populations. Specifically, it includes: (a) the net international migration of the foreign born, (b) the net migration between the United States and Puerto Rico, (c) the net migration of natives to and from the United States, and (d) the net movement of the Armed Forces population between the United States and overseas. Net international migration for Puerto Rico includes the migration of native and foreign-born populations between the United States and Puerto Rico.
Title: Re: Census population estimates 2011-2019
Post by: Suburbia on December 30, 2019, 04:48:23 PM
People are leaving NY, IL, NJ.
It has been happening since the 1990s, in a sense.
It has been happening since the 1990s, in a sense.
Title: Re: Census population estimates 2011-2019
Post by: cinyc on December 30, 2019, 04:51:09 PM
VA is interesting.
They used to grow faster than the US, but not any longer.
Why is that ?
Are they going the way of CA with skyrocketing property/rent prices that are keeping Americans out of the state (immigrants are still moving there) ?
They used to grow faster than the US, but not any longer.
Why is that ?
Are they going the way of CA with skyrocketing property/rent prices that are keeping Americans out of the state (immigrants are still moving there) ?
DC's growth rate has been trending downwards, too (though it's still net positive compared to the US). It's probably due to the size of the government workforce in the age of Trump.
Title: Re: Census population estimates 2011-2019
Post by: Brittain33 on December 30, 2019, 04:52:11 PM
Considering the fact that The Establishment in NY hates AOC, NY-14 would probably be the obvious cut no?
The 2 biggest issues there are that it is a predominantly Hispanic majority-minority seat (and the Hispanic population has been growing, not shrinking) and if NY-14 were cut, AOC would simply run in whichever district overlapped the most. And I doubt any other incumbents really want to be paired in a primary against her. So they will probably try to find an incumbent that is about ready to retire anyway and just have them retire (there are a bunch in their 70s and even 80s). Jose Serrano is not running for re-election in NY-15 (neighboring Hispanic district).
Another thing to note - a side effect of all this is that Max Rose's NY-11 is going to have to pick up some significant extra population/area, which should be able to make it safe Democratic. In particular if (as they should) they give it some more heavily Dem parts of Brooklyn (Park Slope probably being the most obvious/easy) and give some of the more competitive/R parts to the majority-minority districts that are going to be needing more population.
The easiest path is for Nadler to retire or to have a fair fight with Carolyn Maloney. It feels unlikely theyd be pitted against each other.
The Harlem district isnt really an African-American district any more.
Title: Re: Census population estimates 2011-2019
Post by: Cokeland Saxton on December 30, 2019, 06:27:15 PM
Maps of the relative state change in population vs the nationwide average (a.k.a. the bear). Red = you beat the bear and may gain a seat or two in redistricting. Blue = you lose to the bear and the bear may eat you and one or more of your seats.
All you really need to do to avoid the bear is outrun your peers, though, not necessarily the bear.
All you really need to do to avoid the bear is outrun your peers, though, not necessarily the bear.
VA is interesting.
They used to grow faster than the US, but not any longer.
Why is that ?
Are they going the way of CA with skyrocketing property/rent prices that are keeping Americans out of the state (immigrants are still moving there) ?
IN is the exact opposite:
It used to grow slower than the US, but now faster.
Why is that ?
Looking at the numbers, IN had a big international migration surplus of +15.000 last year.
Does IN have a lot of military stationed abroad who returned home ?
Because:
Quote
Net international migration for the United States includes the international migration of both native and foreign-born populations. Specifically, it includes: (a) the net international migration of the foreign born, (b) the net migration between the United States and Puerto Rico, (c) the net migration of natives to and from the United States, and (d) the net movement of the Armed Forces population between the United States and overseas. Net international migration for Puerto Rico includes the migration of native and foreign-born populations between the United States and Puerto Rico.
Could also be immigrants moving to some of the state's manufacturing centers for work. Could also be the Indianapolis suburbs. Guess we will see what parts grew when county estimates come out in March.
Title: Re: Census population estimates 2011-2019
Post by: cinyc on December 30, 2019, 08:03:33 PM
Could also be immigrants moving to some of the state's manufacturing centers for work. Could also be the Indianapolis suburbs. Guess we will see what parts grew when county estimates come out in March.
My images are currently caught up in Gallery hold purgatory, but yes - a lot of the Indiana population gain so far this decade (up to 2018 - the latest data available) has been centered in Indianapolis and its suburbs.
Edited to add: Indiana Numerical Change Map:
()
Indiana Percentage Change Map:
()
Title: Re: Census population estimates 2011-2019
Post by: 💥💥 brandon bro (he/him/his) on December 30, 2019, 08:43:07 PM
()
Sometimes, you eat the bear, and sometimes, well, the bear, he eats you.
(copyright Universal Pictures, source indiewire)
Really surprised at VA being below average considering the Amazon HQ2 decision in late 2018. Of course, it could be statistical noise - @cinyc do you have at hand the VA growth estimates and the national estimates?
I'm also kinda surprised at the low growth in the last decade in Alabama. I'd love to see a county-level breakdown there. I was under the impression that Madison/Huntsville is exploding and, although I guess the Recession was tough on Birmingham, when I visited I got the impression it was experiencing some growth. Maybe being so close to Atlanta is sucking away a lot of talent.
Title: Re: Census population estimates 2011-2019
Post by: cinyc on December 30, 2019, 08:52:10 PM
Really surprised at VA being below average considering the Amazon HQ2 decision in late 2018. Of course, it could be statistical noise - @cinyc do you have at hand the VA growth estimates and the national estimates?
I'm also kinda surprised at the low growth in the last decade in Alabama. I'd love to see a county-level breakdown there. I was under the impression that Madison/Huntsville is exploding and, although I guess the Recession was tough on Birmingham, when I visited I got the impression it was experiencing some growth. Maybe being so close to Atlanta is sucking away a lot of talent.
I'm also kinda surprised at the low growth in the last decade in Alabama. I'd love to see a county-level breakdown there. I was under the impression that Madison/Huntsville is exploding and, although I guess the Recession was tough on Birmingham, when I visited I got the impression it was experiencing some growth. Maybe being so close to Atlanta is sucking away a lot of talent.
Here's NoVa (DC TV market) vs Rest of VA - as of the 2010-18 County Estimates. These will likely be backwards revised downwards in '19, as the state data generally was:
Upstate vs. Downstate NY (Downstate = NYC + LI + Westchester/Rockland/Putnam/Orange):
Title: Re: Census population estimates 2011-2019
Post by: Non Swing Voter on December 30, 2019, 11:09:15 PM
Maps of the relative state change in population vs the nationwide average (a.k.a. the bear). Red = you beat the bear and may gain a seat or two in redistricting. Blue = you lose to the bear and the bear may eat you and one or more of your seats.
All you really need to do to avoid the bear is outrun your peers, though, not necessarily the bear.
All you really need to do to avoid the bear is outrun your peers, though, not necessarily the bear.
VA is interesting.
They used to grow faster than the US, but not any longer.
Why is that ?
Are they going the way of CA with skyrocketing property/rent prices that are keeping Americans out of the state (immigrants are still moving there) ?
It's definitely not the home prices. There is still a ton of development in Northern Virginia (the expensive region). I drive through Loudoun county often and there are huge developments that keep going up. Even though the prices in NoVa are expensive they are relatively cheap compared to other huge metro areas like SF and NY and there are a lot of people that make similar salaries to those markets. It's Southwest Virginia, which is shrinking rapidly, that's skewing the state average. Most of the rest of the state is flat. This is also why VA is trending blue so fast. Depending how it's defined, NoVa is now about 35% of the statewide vote. If things keep on this pace it could be closer to 40% in 10 years.
Title: Re: Census population estimates 2011-2019
Post by: cinyc on December 30, 2019, 11:47:37 PM
Election Data Services is out with their seat projection:
https://www.electiondataservices.com/wp-content/uploads/2019/12/NR_Appor19wTablesMaps.pdf
They give the 435th seat to Florida. NY keeps its 26th (#432 - so NY is -1). Minnesota and Alabama lose 1 each (#436 & 437). CA loses CA-53 (#439). MT-02 is #434. TX-39 is #433.
They also note this, which may be relevant to any analysis that tries to take into account the overseas military/foreign employee population (which they don't seem to have tried to do):
Overall, their projection is:
States Gaining Districts (7)
Arizona +1 (from 9 to 10)
Colorado +1 (from 7 to 8)
Florida +2 (from 27 to 29)
Montana +1 (from At-large to 2)
North Carolina +1 (from 13 to 14)
Oregon +1 (from 5 to 6)
Texas +3 (from 36 to 39)
States Losing Districts (10)
Alabama -1 (from 7 to 6)
California -1 (from 53 to 52)
Illinois -1 (from 18 to 17)
Michigan -1 (from 14 to 13)
Minnesota -1 (from 8 to 7)
New York -1 (from 27 to 26)
Ohio -1 (from 16 to 15)
Pennsylvania -1 (from 18 to 17)
Rhode Island -1 (from 2 to 1)
West Virginia -1 (from 3 to 2)
https://www.electiondataservices.com/wp-content/uploads/2019/12/NR_Appor19wTablesMaps.pdf
They give the 435th seat to Florida. NY keeps its 26th (#432 - so NY is -1). Minnesota and Alabama lose 1 each (#436 & 437). CA loses CA-53 (#439). MT-02 is #434. TX-39 is #433.
They also note this, which may be relevant to any analysis that tries to take into account the overseas military/foreign employee population (which they don't seem to have tried to do):
Quote from: Election Data Services
For 2020 the Census Bureau has changed the residency rules for counting the military by creating a distinction between personnel who are deployed overseas (usually for short periods of time) compared to those who are stationed or assigned overseas (frequently for longer periods of time). The Bureau will use DODs administrative records to count deployed personnel at their usual residence in the US for both apportionment and redistricting purposes (they will be embedded within the states resident population counts). On the other hand, personnel who are stationed or assigned overseas will be counted to their home state of record for apportionment purposes only and will show up as part of a states total overseas count when the Bureau releases the final and official apportionment data by December, 31, 2020. Military sources have told the Census Bureau that of all overseas military, approximately 15% are deployed personnel and 85% are stationed or assigned overseas.
Overall, their projection is:
States Gaining Districts (7)
Arizona +1 (from 9 to 10)
Colorado +1 (from 7 to 8)
Florida +2 (from 27 to 29)
Montana +1 (from At-large to 2)
North Carolina +1 (from 13 to 14)
Oregon +1 (from 5 to 6)
Texas +3 (from 36 to 39)
States Losing Districts (10)
Alabama -1 (from 7 to 6)
California -1 (from 53 to 52)
Illinois -1 (from 18 to 17)
Michigan -1 (from 14 to 13)
Minnesota -1 (from 8 to 7)
New York -1 (from 27 to 26)
Ohio -1 (from 16 to 15)
Pennsylvania -1 (from 18 to 17)
Rhode Island -1 (from 2 to 1)
West Virginia -1 (from 3 to 2)
Title: Re: Census population estimates 2011-2019
Post by: muon2 on December 30, 2019, 11:52:24 PM
Here's my annual projection from the new estimates. I used the July 2019 estimates and the April 2010 Census base to get an annual growth rate. This correctly accounts for the 9 and a quarter year period between the Census and the estimate. I then applied the annual growth rate to the 2010 reapportionment population to get the 2020 projection. This accounts for the extra overseas population used in reapportionment but not for redistricting (It doesn't adjust for the new distinction between deployed vs stationed).
AL -1
AZ +1
CA -1
CO +1
FL +2
IL -1
MI -1
MN -1
MT +1
NY -1
NC +1
OH -1
OR +1
PA -1
RI -1
TX +3
WV -1
These projections are unchanged from last year (https://uselectionatlas.org/FORUM/index.php?topic=166668.msg6591877#msg6591877). The bubble seats in this projection are based on the last five awarded and the next five in line.
The last five awarded are IL-17, FL-29, TX-39, NY-26, and MT-2 (#435).
The next five in line are AL-7, MN-8, CA-53, OH-16, and RI-2.
I also make an alternate projection based on just the prior two years of estimates to determine the rate of growth. It's more sensitive to recent growth trends, and matches the full decade projection.
Title: Re: Census population estimates 2011-2019
Post by: cinyc on December 31, 2019, 12:08:53 AM
Here's my annual projection from the new estimates. I used the July 2019 estimates and the April 2010 Census base to get an annual growth rate. This correctly accounts for the 9 and a quarter year period between the Census and the estimate. I then applied the annual growth rate to the 2010 reapportionment population to get the 2020 projection. This accounts for the extra overseas population used in reapportionment but not for redistricting (It doesn't adjust for the new distinction between deployed vs stationed).
AL -1
AZ +1
CA -1
CO +1
FL +2
IL -1
MI -1
MN -1
MT +1
NY -1
NC +1
OH -1
OR +1
PA -1
RI -1
TX +3
WV -1
These projections are unchanged from last year (https://uselectionatlas.org/FORUM/index.php?topic=166668.msg6591877#msg6591877). The bubble seats in this projection are based on the last five awarded and the next five in line.
The last five awarded are IL-17, FL-29, TX-39, NY-26, and MT-2 (#435).
The next five in line are AL-7, MN-8, CA-53, OH-16, and RI-2.
I also make an alternate projection based on just the prior two years of estimates to determine the rate of growth. It's more sensitive to recent growth trends, and matches the full decade projection.
AL -1
AZ +1
CA -1
CO +1
FL +2
IL -1
MI -1
MN -1
MT +1
NY -1
NC +1
OH -1
OR +1
PA -1
RI -1
TX +3
WV -1
These projections are unchanged from last year (https://uselectionatlas.org/FORUM/index.php?topic=166668.msg6591877#msg6591877). The bubble seats in this projection are based on the last five awarded and the next five in line.
The last five awarded are IL-17, FL-29, TX-39, NY-26, and MT-2 (#435).
The next five in line are AL-7, MN-8, CA-53, OH-16, and RI-2.
I also make an alternate projection based on just the prior two years of estimates to determine the rate of growth. It's more sensitive to recent growth trends, and matches the full decade projection.
How close is AL from keeping its 7th seat? EDS says they'd need to pick up 10,072 unexpected residents to keep their seat - but I don't think that takes into account the overseas population. AL has more military than most states (2.23% of the 2010 overseas pop vs. 1.55% of the overall 2019 pop) - so I suspect it's closer than that.
Title: Re: Census population estimates 2011-2019
Post by: muon2 on December 31, 2019, 12:31:34 AM
Here's my annual projection from the new estimates. I used the July 2019 estimates and the April 2010 Census base to get an annual growth rate. This correctly accounts for the 9 and a quarter year period between the Census and the estimate. I then applied the annual growth rate to the 2010 reapportionment population to get the 2020 projection. This accounts for the extra overseas population used in reapportionment but not for redistricting (It doesn't adjust for the new distinction between deployed vs stationed).
AL -1
AZ +1
CA -1
CO +1
FL +2
IL -1
MI -1
MN -1
MT +1
NY -1
NC +1
OH -1
OR +1
PA -1
RI -1
TX +3
WV -1
These projections are unchanged from last year (https://uselectionatlas.org/FORUM/index.php?topic=166668.msg6591877#msg6591877). The bubble seats in this projection are based on the last five awarded and the next five in line.
The last five awarded are IL-17, FL-29, TX-39, NY-26, and MT-2 (#435).
The next five in line are AL-7, MN-8, CA-53, OH-16, and RI-2.
I also make an alternate projection based on just the prior two years of estimates to determine the rate of growth. It's more sensitive to recent growth trends, and matches the full decade projection.
AL -1
AZ +1
CA -1
CO +1
FL +2
IL -1
MI -1
MN -1
MT +1
NY -1
NC +1
OH -1
OR +1
PA -1
RI -1
TX +3
WV -1
These projections are unchanged from last year (https://uselectionatlas.org/FORUM/index.php?topic=166668.msg6591877#msg6591877). The bubble seats in this projection are based on the last five awarded and the next five in line.
The last five awarded are IL-17, FL-29, TX-39, NY-26, and MT-2 (#435).
The next five in line are AL-7, MN-8, CA-53, OH-16, and RI-2.
I also make an alternate projection based on just the prior two years of estimates to determine the rate of growth. It's more sensitive to recent growth trends, and matches the full decade projection.
How close is AL from keeping its 7th seat? EDS says they'd need to pick up 10,072 unexpected residents to keep their seat - but I don't think that takes into account the overseas population. AL has more military than most states (2.23% of the 2010 overseas pop vs. 1.55% of the overall 2019 pop) - so I suspect it's closer than that.
According to my spreadsheet it depends on what the projected growth rate will be in the last year of the decade. If I use my full decade projection AL needs about 16K to overtake MT. However, if I use the average of just the last two years of estimates, MT only needs about 5K to overtake NY and about 10K to overtake MT. The effect of the change in DoD classification probably makes it harder for AL to get #435.
Title: Re: Census population estimates 2011-2019
Post by: Oryxslayer on December 31, 2019, 10:35:10 AM
Here's my annual projection from the new estimates. I used the July 2019 estimates and the April 2010 Census base to get an annual growth rate. This correctly accounts for the 9 and a quarter year period between the Census and the estimate. I then applied the annual growth rate to the 2010 reapportionment population to get the 2020 projection. This accounts for the extra overseas population used in reapportionment but not for redistricting (It doesn't adjust for the new distinction between deployed vs stationed).
AL -1
AZ +1
CA -1
CO +1
FL +2
IL -1
MI -1
MN -1
MT +1
NY -1
NC +1
OH -1
OR +1
PA -1
RI -1
TX +3
WV -1
These projections are unchanged from last year (https://uselectionatlas.org/FORUM/index.php?topic=166668.msg6591877#msg6591877). The bubble seats in this projection are based on the last five awarded and the next five in line.
The last five awarded are IL-17, FL-29, TX-39, NY-26, and MT-2 (#435).
The next five in line are AL-7, MN-8, CA-53, OH-16, and RI-2.
I also make an alternate projection based on just the prior two years of estimates to determine the rate of growth. It's more sensitive to recent growth trends, and matches the full decade projection.
AL -1
AZ +1
CA -1
CO +1
FL +2
IL -1
MI -1
MN -1
MT +1
NY -1
NC +1
OH -1
OR +1
PA -1
RI -1
TX +3
WV -1
These projections are unchanged from last year (https://uselectionatlas.org/FORUM/index.php?topic=166668.msg6591877#msg6591877). The bubble seats in this projection are based on the last five awarded and the next five in line.
The last five awarded are IL-17, FL-29, TX-39, NY-26, and MT-2 (#435).
The next five in line are AL-7, MN-8, CA-53, OH-16, and RI-2.
I also make an alternate projection based on just the prior two years of estimates to determine the rate of growth. It's more sensitive to recent growth trends, and matches the full decade projection.
How close is AL from keeping its 7th seat? EDS says they'd need to pick up 10,072 unexpected residents to keep their seat - but I don't think that takes into account the overseas population. AL has more military than most states (2.23% of the 2010 overseas pop vs. 1.55% of the overall 2019 pop) - so I suspect it's closer than that.
According to my spreadsheet it depends on what the projected growth rate will be in the last year of the decade. If I use my full decade projection AL needs about 16K to overtake MT. However, if I use the average of just the last two years of estimates, MT only needs about 5K to overtake NY and about 10K to overtake MT. The effect of the change in DoD classification probably makes it harder for AL to get #435.
There's also NY-26 which as covered elsewhere, is vulnerable to the states growth rate declining over the decade. Overall I would say the last two seats here, NY-26 and MT-02, could end up in any number of states. It could be those two, or it could have one or both swapped out for AL, MT, or CA.
Title: Re: Census population estimates 2011-2019
Post by: Cokeland Saxton on December 31, 2019, 03:05:31 PM
| California Texas Florida New York Pennsylvania Illinois Ohio Georgia North Carolina Michigan New Jersey Virginia Washington Arizona Massachusetts Tennessee Indiana Missouri Maryland Wisconsin Colorado Minnesota South Carolina Alabama Louisiana Kentucky Oregon Oklahoma Connecticut Utah Iowa Nevada Arkansas Mississippi Kansas New Mexico Nebraska West Virginia Idaho Hawaii New Hampshire Maine Montana Rhode Island Delaware South Dakota North Dakota Alaska Vermont Wyoming | 39,512,223 28,995,881 21,477,737 19,453,561 12,801,989 12,671,821 11,689,100 10,617,423 10,488,084 9,986,857 8,882,190 8,535,519 7,614,893 7,278,717 6,892,503 6,829,174 6,732,219 6,137,428 6,045,680 5,822,434 5,758,736 5,639,632 5,148,714 4,903,185 4,648,794 4,467,673 4,217,737 3,956,971 3,565,287 3,205,958 3,155,070 3,080,156 3,017,825 2,976,149 2,913,314 2,096,829 1,934,408 1,792,147 1,787,065 1,415,872 1,359,711 1,344,212 1,068,778 1,059,361 973,764 884,659 762,062 731,545 623,989 578,759 | 52.589 35.497 26.545 27.355 17.932 18.113 16.285 13.677 13.461 13.953 12.411 11.294 9.493 9.024 9.243 8.959 9.153 8.454 8.150 8.028 7.100 7.487 6.529 6.748 6.400 6.126 5.408 5.296 5.045 3.902 4.301 3.812 4.116 4.190 4.028 2.907 2.578 2.616 2.213 1.920 1.858 1.875 1.397 1.486 1.268 1.149 0.949 1.003 0.883 0.796 | 52.476 38.510 28.525 25.836 17.002 16.830 15.524 14.101 13.929 13.264 11.797 11.336 10.113 9.667 9.154 9.070 8.941 8.151 8.029 7.733 7.648 7.490 6.838 6.512 6.174 5.934 5.602 5.255 4.735 4.258 4.190 4.091 4.008 3.953 3.869 2.785 2.569 2.380 2.373 1.880 1.806 1.785 1.419 1.407 1.293 1.175 1.012 0.972 0.829 0.769 | Goodbye 53rd Good for gain of 3 Good for 2 27th is gone, 26th hanging on 18th is gone 18th is long gone Will just slip blow the threshold, goodbye 16th 14th is guaranteed 14th is gone 12th could be lost in 2030 Falls short of 12th 10th is certain Could save 9th in 2030 8th safe for now, but most likely gone in 2030 Guaranteed 8th Highly likely loss of 8th Farewell 7th 6th all but certain 5th could be lost in 2030 3rd safe for now 3rd is history Possible 3rd in 2030 2nd likely Loss of 2nd all but guaranteed |
Title: Re: Census population estimates 2011-2019
Post by: heatcharger on January 01, 2020, 11:50:33 AM
Really surprised at VA being below average considering the Amazon HQ2 decision in late 2018. Of course, it could be statistical noise - @cinyc do you have at hand the VA growth estimates and the national estimates?
Amazon hasn't really begun hiring for their HQ2 campus, and while they've ramped up hiring for the AWS offices, there hasn't been the seismic impact on population the full-fledged campus will have. The HQ2 location in Arlington isn't slated to be fully completed until Q1 2023 (https://www.bizjournals.com/washington/news/2019/10/15/amazon-now-has-a-timeline-for-the-first-hq2-towers.html) so it might be a while to see a noticeable effect.
Title: Re: Census population estimates 2011-2019
Post by: Skill and Chance on January 01, 2020, 11:57:10 AM
Really surprised at VA being below average considering the Amazon HQ2 decision in late 2018. Of course, it could be statistical noise - @cinyc do you have at hand the VA growth estimates and the national estimates?
Amazon hasn't really begun hiring for their HQ2 campus, and while they've ramped up hiring for the AWS offices, there hasn't been the seismic impact on population the full-fledged campus will have. The HQ2 location in Arlington isn't slated to be fully completed until Q1 2023 (https://www.bizjournals.com/washington/news/2019/10/15/amazon-now-has-a-timeline-for-the-first-hq2-towers.html) so it might be a while to see a noticeable effect.
VA now cycles with federal spending/employment growth as a % of the total US economy. That was unusually high during 2010-14 and has fallen dramatically since then as the rest of the economy took off. IMO that's all you need to explain VA last decade.
Title: Re: Census population estimates 2011-2019
Post by: Skill and Chance on January 01, 2020, 12:02:12 PM
One interesting aspect of these estimates is that ID-03 now looks like a serious possibility for 2031. Idaho, like Montana, has a redistricting commission in their state constitution, and the recent growth has overwhelmingly been in Boise, meaning a hypothetical compact ID-03 should be competitive to even Lean Dem by that time.
Title: Re: Census population estimates 2011-2019
Post by: Skill and Chance on January 01, 2020, 12:10:47 PM
| California Texas Florida New York Pennsylvania Illinois Ohio Georgia North Carolina Michigan New Jersey Virginia Washington Arizona Massachusetts Tennessee Indiana Missouri Maryland Wisconsin Colorado Minnesota South Carolina Alabama Louisiana Kentucky Oregon Oklahoma Connecticut Utah Iowa Nevada Arkansas Mississippi Kansas New Mexico Nebraska West Virginia Idaho Hawaii New Hampshire Maine Montana Rhode Island Delaware South Dakota North Dakota Alaska Vermont Wyoming | 39,512,223 28,995,881 21,477,737 19,453,561 12,801,989 12,671,821 11,689,100 10,617,423 10,488,084 9,986,857 8,882,190 8,535,519 7,614,893 7,278,717 6,892,503 6,829,174 6,732,219 6,137,428 6,045,680 5,822,434 5,758,736 5,639,632 5,148,714 4,903,185 4,648,794 4,467,673 4,217,737 3,956,971 3,565,287 3,205,958 3,155,070 3,080,156 3,017,825 2,976,149 2,913,314 2,096,829 1,934,408 1,792,147 1,787,065 1,415,872 1,359,711 1,344,212 1,068,778 1,059,361 973,764 884,659 762,062 731,545 623,989 578,759 | 52.589 35.497 26.545 27.355 17.932 18.113 16.285 13.677 13.461 13.953 12.411 11.294 9.493 9.024 9.243 8.959 9.153 8.454 8.150 8.028 7.100 7.487 6.529 6.748 6.400 6.126 5.408 5.296 5.045 3.902 4.301 3.812 4.116 4.190 4.028 2.907 2.578 2.616 2.213 1.920 1.858 1.875 1.397 1.486 1.268 1.149 0.949 1.003 0.883 0.796 | 52.476 38.510 28.525 25.836 17.002 16.830 15.524 14.101 13.929 13.264 11.797 11.336 10.113 9.667 9.154 9.070 8.941 8.151 8.029 7.733 7.648 7.490 6.838 6.512 6.174 5.934 5.602 5.255 4.735 4.258 4.190 4.091 4.008 3.953 3.869 2.785 2.569 2.380 2.373 1.880 1.806 1.785 1.419 1.407 1.293 1.175 1.012 0.972 0.829 0.769 | Goodbye 53rd Good for gain of 3 Good for 2 27th is gone, 26th hanging on 18th is gone 18th is long gone Will just slip blow the threshold, goodbye 16th 14th is guaranteed 14th is gone 12th could be lost in 2030 Falls short of 12th 10th is certain Could save 9th in 2030 8th safe for now, but most likely gone in 2030 Guaranteed 8th Highly likely loss of 8th Farewell 7th 6th all but certain 5th could be lost in 2030 3rd safe for now 3rd is history Possible 3rd in 2030 2nd likely Loss of 2nd all but guaranteed |
Looks like LA could be at risk of losing LA-06 at the 2030 census?
Title: Re: Census population estimates 2011-2019
Post by: Brittain33 on January 01, 2020, 12:17:26 PM
| California Texas Florida New York Pennsylvania Illinois Ohio Georgia North Carolina Michigan New Jersey Virginia Washington Arizona Massachusetts Tennessee Indiana Missouri Maryland Wisconsin Colorado Minnesota South Carolina Alabama Louisiana Kentucky Oregon Oklahoma Connecticut Utah Iowa Nevada Arkansas Mississippi Kansas New Mexico Nebraska West Virginia Idaho Hawaii New Hampshire Maine Montana Rhode Island Delaware South Dakota North Dakota Alaska Vermont Wyoming | 39,512,223 28,995,881 21,477,737 19,453,561 12,801,989 12,671,821 11,689,100 10,617,423 10,488,084 9,986,857 8,882,190 8,535,519 7,614,893 7,278,717 6,892,503 6,829,174 6,732,219 6,137,428 6,045,680 5,822,434 5,758,736 5,639,632 5,148,714 4,903,185 4,648,794 4,467,673 4,217,737 3,956,971 3,565,287 3,205,958 3,155,070 3,080,156 3,017,825 2,976,149 2,913,314 2,096,829 1,934,408 1,792,147 1,787,065 1,415,872 1,359,711 1,344,212 1,068,778 1,059,361 973,764 884,659 762,062 731,545 623,989 578,759 | 52.589 35.497 26.545 27.355 17.932 18.113 16.285 13.677 13.461 13.953 12.411 11.294 9.493 9.024 9.243 8.959 9.153 8.454 8.150 8.028 7.100 7.487 6.529 6.748 6.400 6.126 5.408 5.296 5.045 3.902 4.301 3.812 4.116 4.190 4.028 2.907 2.578 2.616 2.213 1.920 1.858 1.875 1.397 1.486 1.268 1.149 0.949 1.003 0.883 0.796 | 52.476 38.510 28.525 25.836 17.002 16.830 15.524 14.101 13.929 13.264 11.797 11.336 10.113 9.667 9.154 9.070 8.941 8.151 8.029 7.733 7.648 7.490 6.838 6.512 6.174 5.934 5.602 5.255 4.735 4.258 4.190 4.091 4.008 3.953 3.869 2.785 2.569 2.380 2.373 1.880 1.806 1.785 1.419 1.407 1.293 1.175 1.012 0.972 0.829 0.769 | Goodbye 53rd Good for gain of 3 Good for 2 27th is gone, 26th hanging on 18th is gone 18th is long gone Will just slip blow the threshold, goodbye 16th 14th is guaranteed 14th is gone 12th could be lost in 2030 Falls short of 12th 10th is certain Could save 9th in 2030 8th safe for now, but most likely gone in 2030 Guaranteed 8th Highly likely loss of 8th Farewell 7th 6th all but certain 5th could be lost in 2030 3rd safe for now 3rd is history Possible 3rd in 2030 2nd likely Loss of 2nd all but guaranteed |
Looks like LA could be at risk of losing LA-06 at the 2030 census?
If Oregon is getting a 6th district at 5.602, wouldn't that require a much faster rate of decline in LA than we saw since 2010?
That said, a major hit to New Orleans is a distinct possibility in this decade.
Title: Re: Census population estimates 2011-2019
Post by: jimrtex on January 01, 2020, 01:44:06 PM
There are eight states that are in a band of about 1% of the ideal break point.
Above the line:
NY(26) 1.004
TX(39) 1.003
FL(29) 1.002
MT(2) 1.001
----------------
AL(6) 0.998
MN(7) 0.997
CA (52) 0.995
OH(15) 0.994
At this point, what is more significant is how accurate the estimates are, than the growth trend for the final 9 months of the census period. Overall drops in growth may mean estimates are more accurate. If a state grew at an estimated 30% during a decade, it may be difficult to determine whether it was 29% or 31%. But it is likely an estimated rate of 2.5% is more accurate.
Based on 2009 estimates, Florida and Texas have not yet gained their 39th and 29th seat respectively, while Alabama and Ohio have not lost their 7th and 16th seat respectively.
New York year-to-year change has dropped every year this decade. That is, its second derivative is negative, and its population is in parabolic decline. After the 2011 estimate, it was projected that New York would keep its 27th seat. Since then, smaller increases, which have have become decreases since 2016 put New York at risk of losing two representatives. A projection based on estimates from 2010-2019 would result in a surplus of around 130K. But the average annual gain from 2010 to 2019 was around 6K, while the loss for 2018-2019 was 76K. If we project a loss of 95K for 2020 based on recent trends, that would be a deficit of 100K (75K for nine months) which would eat into more than half of the projected surplus. Much will depend on how accurate the revisions in estimates of international migration were. International emigration is difficult to measure since it depends on measuring persons who no longer exist.
Birth records are accurate. Death records are accurate. Estimates of domestic migration based on IRS and SSA records may be reasonably accurate. If New York keeps a 26th representative it may be lost before the 2020 census results are announced. New York is projected to lose 1.634 representatives (from 27.243 to 25.609). They are in a favorable position for rounding.
Texas year-to-year peaked near mid-decade with $100/bbl oil, and then dropped when the price drop to $30/bbl. By 2019, the price has been around $55/bbl which is profitable in the Permian Basin, but not necessarily elsewhere. The year-to-year increase has recovered to near the decade average, and the Texas increase as a share of the national increase was a decade high of 23.7%. Texas has a 147K surplus for the 39th seat and should maintain that. The caveat is whether the Census estimate of 16.6% (2nd highest to Utah) has been accurate.
Florida started the decade recovering from the housing bubble, but by mid-decade growth in 2016 was almost double that of 2017. Since then growth has dropped rather sharply, with 2019 growth almost back to to 2011 levels. Continuation of the trend would make 2020 less than 2011, eating into Florida's 106K surplus. Florida may benefit from the short 9-month interval to the Census. Again the final determination will largely hinge on the quality of estimates.
Montana has been just below the population necessary for a second seat ever since it lost its second seat. Some years it looked might it gain it back and others not. With an economy highly dependent on natural resources and tourism, growth can be volatile. Population is projected to increase by 8.7%, slightly above the national average of 6.8%, but enough for a gain of 0.023 representatives to put Montana over the cusp. With a surplus of just 3300, Montana may be harmed by the April 1 Census date, as seasonal Montanans may not have returned from Arizona.
Alabama had its peak increase in 2019, but it is projected to be about 15K short of keeping the 7th seat. But its total growth for the decade is only 133K. It would essentially have to double its growth rate of the last decade, or hope that some people have been missed.
Minnesota may illustrate an apportionment paradox. It is projected to increase 6.86% for the decade, versus 6.83% for the US as a whole. It's share of the US population is increasing, while its share of representation is decreasing. The entitlement is an increase from 7.472 to 7.474. In effect, Minnesota was lucky not to have lost its 8th seat in 2010.
Minnesota is projected to be about 23K short of keeping its 8th seat. But that it is about 2/3 of its average annual growth. 2019 was Minnesota's 3rd lowest year. It is not likely to have that much in a 9-month period, so its hope depends on inaccurate estimates over time.
California over the first half of the decade had strong growth of over 300K per year. Since 2015 it has plummeted (249K, 191K, 103K, 51K). Based on recent trends, California may have essentially no population growth this year. California may be experiencing a delayed effect of the recovery from the housing bubble. Home owners who were upside down on mortgages have been able to finally cash out, and move to states with more affordable housing. California is 222K short of keeping a 53rd representative and may pile up as much more in the final 9 months of the decade.
Ohio is 80K short of keeping its 16th seat. It's growth has been meager and sporadic. 80K is equivalent to an average of 5 years growth, and 3 of the best year.
Title: Re: Census population estimates 2011-2019
Post by: Oryxslayer on January 01, 2020, 06:15:06 PM
Good breakdown jimrtex. The only thing that I would add is that CA is pouring in millions to assist the census 'discover' residents. The South Valley has a lot of hard-to-reach migratory groups, and CA is pouring in money to ensure every resident is counted, especially those groups missed in 2010. The margin of error around projections therefore is larger here and in other border states, so it's one thing working in the states favor. In contrast, TX has a lot of hard-to-reach groups as well, but the state is putting aside 0$ to assist in contacting their residents (for political reasons of course) so the MOE around those projections is less in their favor.
Title: Re: Census population estimates 2011-2019
Post by: jimrtex on January 01, 2020, 08:31:53 PM
2020 Pop is projected population in millions for April 2020, based on April 2010 (base) and July 2019 estimate.
2010 Ent is based on geometric mean. sqrt((pop/quota)2 + 0.25). Quota is adjusted so that states sum to 435 (about 0.43%). A state with n.500 will be near the dividing line for gaining a n+1 representative.
2020 Ent is based on geometric mean.
2010-2020 is difference in 2020 entitlement minus 2010 entitlement. For example, Mississippi can be said to have lost about 1/4 a representative.
Rank Val is the ranking quotient, for a state receiving an n+1 district if 2020 entitlement was n.xxxx. pop/sqrt(n*(n+1)). Values are normalized by dividing by the adjusted quota, so that values above 1 will generally indicate that the state will gain the extra seat (since 435 seats are apportioned, it is possible that some states above 1 will not gain a seat, or that some below 1 will gain a seat. In this case it happens that Montana(2) with 1.001 is the 435th seat.
2020 is the projected apportionment for 2020.
Change is change in apportionment from 2010.
Next is guesstimate of next change based on 2010-2020 trend. If blank, no change is expected through 2050. Trends out that far are unreliable anyway.
| State | 2020 Pop | 2010 Ent | 2020 Ent | 2010-2020 | Rank Val | 2020 | Change | Next |
| Hawaii | 1.420 | 1.976 | 1.935 | -0.042 | 1.322 | 2 | 0 | |
| New Hampshire | 1.363 | 1.917 | 1.862 | -0.055 | 1.268 | 2 | 0 | |
| Maine | 1.346 | 1.933 | 1.840 | -0.093 | 1.252 | 2 | 0 | |
| Mississippi | 2.977 | 4.202 | 3.948 | -0.253 | 1.131 | 4 | 0 | L 2040/50 |
| New Mexico | 2.100 | 2.937 | 2.808 | -0.130 | 1.128 | 3 | 0 | L 2040/50 |
| Kansas | 2.918 | 4.041 | 3.872 | -0.169 | 1.108 | 4 | 0 | L 2040/50 |
| Kentucky | 4.478 | 6.120 | 5.913 | -0.207 | 1.076 | 6 | 0 | L 2040/50 |
| Maryland | 6.068 | 8.131 | 8.000 | -0.131 | 1.067 | 8 | 0 | |
| South Carolina | 5.194 | 6.521 | 6.852 | 0.331 | 1.054 | 7 | 0 | G 2040/50 |
| Connecticut | 3.565 | 5.049 | 4.717 | -0.332 | 1.049 | 5 | 0 | L 2030/40 |
| Indiana | 6.753 | 9.128 | 8.899 | -0.229 | 1.047 | 9 | 0 | L 2040/50 |
| Nebraska | 1.943 | 2.615 | 2.605 | -0.010 | 1.044 | 3 | 0 | |
| North Carolina | 10.569 | 13.413 | 13.915 | 0.502 | 1.031 | 14 | +1 | G 2030/40 |
| Wisconsin | 5.834 | 8.010 | 7.692 | -0.318 | 1.026 | 8 | 0 | L2030 |
| Colorado | 5.822 | 7.087 | 7.677 | 0.590 | 1.024 | 8 | +1 | G 2040 |
| Pennsylvania | 12.810 | 17.862 | 16.862 | -1.000 | 1.022 | 17 | -1 | L 2030 |
| Oregon | 4.251 | 5.408 | 5.615 | 0.207 | 1.021 | 6 | +1 | |
| Arizona | 7.356 | 8.999 | 9.691 | 0.692 | 1.020 | 10 | +1 | G 2040 |
| New Jersey | 8.890 | 12.368 | 11.707 | -0.661 | 1.018 | 12 | 0 | L 2030 |
| Illinois | 12.659 | 18.043 | 16.663 | -1.380 | 1.010 | 17 | -1 | LL 2030 |
| New York | 19.460 | 27.243 | 25.609 | -1.634 | 1.004 | 26 | -1 | LL 2030 |
| Texas | 29.333 | 35.349 | 38.597 | 3.248 | 1.003 | 39 | +3 | GGG 2030 |
| Florida | 21.710 | 26.437 | 28.570 | 2.133 | 1.002 | 29 | +2 | GG 2030 |
| Montana | 1.075 | 1.478 | 1.501 | 0.023 | 1.001 | 2 | +1 | |
| Alabama | 4.913 | 6.738 | 6.484 | -0.254 | 0.998 | 6 | -1 | |
| Minnesota | 5.668 | 7.472 | 7.474 | 0.002 | 0.997 | 7 | -1 | |
| California | 39.701 | 52.368 | 52.238 | -0.130 | 0.995 | 52 | -1 | |
| Ohio | 11.702 | 16.224 | 15.404 | -0.820 | 0.994 | 15 | -1 | L 2040 |
| Rhode Island | 1.060 | 1.562 | 1.481 | -0.081 | 0.986 | 1 | -1 | |
| Virginia | 8.580 | 11.258 | 11.301 | 0.043 | 0.983 | 11 | 0 | |
| Michigan | 9.995 | 13.902 | 13.161 | -0.742 | 0.975 | 13 | -1 | L 2030 |
| Georgia | 10.697 | 13.628 | 14.083 | 0.455 | 0.971 | 14 | 0 | G 2030/40 |
| Idaho | 1.806 | 2.260 | 2.428 | 0.169 | 0.970 | 2 | 0 | G 2030 |
| Washington | 7.692 | 9.465 | 10.133 | 0.668 | 0.965 | 10 | 0 | G 2030 |
| West Virginia | 1.787 | 2.652 | 2.404 | -0.248 | 0.960 | 2 | -1 | |
| Massachusetts | 6.921 | 9.217 | 9.120 | -0.097 | 0.960 | 9 | 0 | |
| Oklahoma | 3.974 | 5.297 | 5.253 | -0.044 | 0.955 | 5 | 0 | |
| Utah | 3.245 | 3.917 | 4.298 | 0.381 | 0.955 | 4 | 0 | G 2030 |
| Missouri | 6.150 | 8.433 | 8.107 | -0.326 | 0.954 | 8 | 0 | L 2040/50 |
| Tennessee | 6.870 | 8.934 | 9.053 | 0.118 | 0.953 | 9 | 0 | |
| Louisiana | 4.658 | 6.392 | 6.149 | -0.243 | 0.946 | 6 | 0 | L 2050 |
| Iowa | 3.164 | 4.312 | 4.193 | -0.119 | 0.931 | 4 | 0 | |
| Nevada | 3.113 | 3.829 | 4.126 | 0.298 | 0.916 | 4 | 0 | G 2030/40 |
| Delaware | 0.980 | 1.358 | 1.383 | 0.026 | 0.912 | 1 | 0 | |
| Arkansas | 3.026 | 4.129 | 4.013 | -0.116 | 0.890 | 4 | 0 | |
| South Dakota | 0.891 | 1.249 | 1.274 | 0.025 | 0.829 | 1 | 0 | |
| North Dakota | 0.770 | 1.069 | 1.130 | 0.060 | 0.716 | 1 | 0 | |
| Alaska | 0.733 | 1.117 | 1.087 | -0.030 | 0.682 | 1 | 0 | |
| Vermont | 0.624 | 1.012 | 0.961 | -0.051 | 0.580 | 1 | 0 | |
| Wyoming | 0.580 | 0.937 | 0.912 | -0.025 | 0.540 | 1 | 0 |
Title: Re: Census population estimates 2011-2019
Post by: jimrtex on January 01, 2020, 10:46:02 PM
Good breakdown jimrtex. The only thing that I would add is that CA is pouring in millions to assist the census 'discover' residents. The South Valley has a lot of hard-to-reach migratory groups, and CA is pouring in money to ensure every resident is counted, especially those groups missed in 2010. The margin of error around projections therefore is larger here and in other border states, so it's one thing working in the states favor. In contrast, TX has a lot of hard-to-reach groups as well, but the state is putting aside 0$ to assist in contacting their residents (for political reasons of course) so the MOE around those projections is less in their favor.
Estimates of undercount(PDF) (https://www.google.com/url?sa=t&rct=j&q=&esrc=s&source=web&cd=10&ved=2ahUKEwje5vHj7OPmAhWEW80KHU9vCfQQFjAJegQIBRAC&url=https%3A%2F%2Fwww.census.gov%2Fcoverage_measurement%2Fpdfs%2Fg05.pdf&usg=AOvVaw1pvTAiCmiiEL4C-vo_JVyL)
The undercount for California in 2020 is estimated to be 0.60%, while California is estimated to be short by 0.5% of holding on to its 53rd seat.
There might be areas where the undercount was higher, but also lower such as in Marin. And is the mass outreach effective?
Title: Re: Census population estimates 2011-2019
Post by: Bakersfield Uber Alles on January 02, 2020, 12:37:22 AM
Good breakdown jimrtex. The only thing that I would add is that CA is pouring in millions to assist the census 'discover' residents. The South Valley has a lot of hard-to-reach migratory groups, and CA is pouring in money to ensure every resident is counted, especially those groups missed in 2010. The margin of error around projections therefore is larger here and in other border states, so it's one thing working in the states favor. In contrast, TX has a lot of hard-to-reach groups as well, but the state is putting aside 0$ to assist in contacting their residents (for political reasons of course) so the MOE around those projections is less in their favor.
Estimates of undercount(PDF) (https://www.google.com/url?sa=t&rct=j&q=&esrc=s&source=web&cd=10&ved=2ahUKEwje5vHj7OPmAhWEW80KHU9vCfQQFjAJegQIBRAC&url=https%3A%2F%2Fwww.census.gov%2Fcoverage_measurement%2Fpdfs%2Fg05.pdf&usg=AOvVaw1pvTAiCmiiEL4C-vo_JVyL)
The undercount for California in 2020 is estimated to be 0.60%, while California is estimated to be short by 0.5% of holding on to its 53rd seat.
There might be areas where the undercount was higher, but also lower such as in Marin. And is the mass outreach effective?
Not OP, but Im assuming Oryx means the south part of the Central Valley/San Joaquin Valley, which is a big farming area full of migrants.
Title: Re: Census population estimates 2011-2019
Post by: jimrtex on January 02, 2020, 10:32:04 AM
Based on 2010-2020 change Texas will surpass California in population in late 2053, when both states will have over 49 million.
Title: Re: Census population estimates 2011-2019
Post by: Oryxslayer on January 02, 2020, 10:42:23 AM
Good breakdown jimrtex. The only thing that I would add is that CA is pouring in millions to assist the census 'discover' residents. The South Valley has a lot of hard-to-reach migratory groups, and CA is pouring in money to ensure every resident is counted, especially those groups missed in 2010. The margin of error around projections therefore is larger here and in other border states, so it's one thing working in the states favor. In contrast, TX has a lot of hard-to-reach groups as well, but the state is putting aside 0$ to assist in contacting their residents (for political reasons of course) so the MOE around those projections is less in their favor.
Estimates of undercount(PDF) (https://www.google.com/url?sa=t&rct=j&q=&esrc=s&source=web&cd=10&ved=2ahUKEwje5vHj7OPmAhWEW80KHU9vCfQQFjAJegQIBRAC&url=https%3A%2F%2Fwww.census.gov%2Fcoverage_measurement%2Fpdfs%2Fg05.pdf&usg=AOvVaw1pvTAiCmiiEL4C-vo_JVyL)
The undercount for California in 2020 is estimated to be 0.60%, while California is estimated to be short by 0.5% of holding on to its 53rd seat.
There might be areas where the undercount was higher, but also lower such as in Marin. And is the mass outreach effective?
Not OP, but Im assuming Oryx means the south part of the Central Valley/San Joaquin Valley, which is a big farming area full of migrants.
Yep. I'm not saying the projections will be wrong, this census ACS data is good. However, every state has a MOE around these projections, which you tried to describe. All I'm saying is that some states have smaller or wider MOE's, and certain states and regions are trying their hardest to make the MOE move in their favor.
Generally, hard to count regions are Rural + Residential Minority, be it AA, Canadian, Native, or most notably Hispanic.
Title: Re: Census population estimates 2011-2019
Post by: Del Tachi on January 02, 2020, 11:17:45 AM
Really surprised at VA being below average considering the Amazon HQ2 decision in late 2018. Of course, it could be statistical noise - @cinyc do you have at hand the VA growth estimates and the national estimates?
Amazon hasn't really begun hiring for their HQ2 campus, and while they've ramped up hiring for the AWS offices, there hasn't been the seismic impact on population the full-fledged campus will have. The HQ2 location in Arlington isn't slated to be fully completed until Q1 2023 (https://www.bizjournals.com/washington/news/2019/10/15/amazon-now-has-a-timeline-for-the-first-hq2-towers.html) so it might be a while to see a noticeable effect.
VA now cycles with federal spending/employment growth as a % of the total US economy. That was unusually high during 2010-14 and has fallen dramatically since then as the rest of the economy took off. IMO that's all you need to explain VA last decade.
This. Bad economies are good for government employees + spending, while hot ones are not.
Title: Re: Census population estimates 2011-2019
Post by: Kevinstat on March 21, 2020, 10:36:37 AM
Are county population estimates still expected sometime this month, or are they expected to be delayed due to the COVID-19 outbreak?
Title: Re: Census population estimates 2011-2019
Post by: Tender Branson on March 21, 2020, 10:40:28 AM
Are county population estimates still expected sometime this month, or are they expected to be delayed due to the COVID-19 outbreak?
Still planned for release this Thursday:
https://www.calendarwiz.com/calendars/popup.php?op=view&id=139838361&crd=cens1sample
Title: Re: Census population estimates 2011-2019
Post by: DINGO Joe on March 21, 2020, 10:50:26 AM
Are county population estimates still expected sometime this month, or are they expected to be delayed due to the COVID-19 outbreak?
Still planned for release this Thursday:
https://www.calendarwiz.com/calendars/popup.php?op=view&id=139838361&crd=cens1sample
Probably won't change the release date. The data has probably been ready for a week or two now.
Title: Re: Census population estimates 2011-2019
Post by: EastAnglianLefty on March 24, 2020, 05:07:28 AM
What's the likelihood Coronavirus will have a significant impact on the census? I'm not thinking of the worst-case scenario of massive death tolls, so much as the likelihood that the census response rate is lower and more variable than usual and that the economic dislocation means fewer people move between states.
Title: Re: Census population estimates 2011-2019
Post by: Tender Branson on March 24, 2020, 06:55:02 AM
What's the likelihood Coronavirus will have a significant impact on the census? I'm not thinking of the worst-case scenario of massive death tolls, so much as the likelihood that the census response rate is lower and more variable than usual and that the economic dislocation means fewer people move between states.
The response rate is currently about 9% higher, not lower, than during the early days of 2010.
The question will be: does the trend of favorable internet/mail/phone returns keep up until May/June, or will it drop off later on ?
Also, the process of visiting homes who have not responded is unclear: will they still visit non-responding/remote households, but with protective gear and a 6 feet distance ? Or just remote areas ? Or not at all ? They have time until August to visit. Or they extend into the fall and delay the publishing of the results into next year.
Title: Re: Census population estimates 2011-2019
Post by: EastAnglianLefty on March 24, 2020, 07:06:10 AM
I guess in terms of movement of people, you'd probably expect a similar impact to after the financial crisis hit, but at a higher intensity?
Title: Re: Census population estimates 2011-2019
Post by: Tender Branson on March 24, 2020, 07:22:48 AM
I guess in terms of movement of people, you'd probably expect a similar impact to after the financial crisis hit, but at a higher intensity?
Probably.
For census taking, it is actually better if people are not bouncing and moving around between states and rather stay home.
Title: Re: Census population estimates 2011-2019
Post by: cinyc on March 24, 2020, 01:19:28 PM
I guess in terms of movement of people, you'd probably expect a similar impact to after the financial crisis hit, but at a higher intensity?
Probably.
For census taking, it is actually better if people are not bouncing and moving around between states and rather stay home.
Except, perhaps, for college students who have been kicked out of their dorms. Census says they still should be counted on campus, but parents might be putting them on their home forms. Theres a process for removing duplicates. Its probably more important now than ever.
Title: Re: Census population estimates 2011-2019
Post by: Tender Branson on March 26, 2020, 12:15:40 AM
Are county population estimates still expected sometime this month, or are they expected to be delayed due to the COVID-19 outbreak?
The mid-2019 county and metro area estimates are now out:
https://www.census.gov/newsroom/press-releases/2020/pop-estimates-county-metro.html
https://www.census.gov/newsroom/press-kits/2020/pop-estimates-county-metro.html
Title: Re: Census population estimates 2011-2019
Post by: Cokeland Saxton on March 26, 2020, 08:53:00 AM
Welp, Metro Phoenix just pushed Metro Boston out of the top 10 largest MSAs.
Title: Re: Census population estimates 2011-2019
Post by: Nyvin on March 26, 2020, 11:31:57 AM
Wow, Washtenaw MI lost population last year
Title: Re: Census population estimates 2011-2019
Post by: Starry Eyed Jagaloon on March 26, 2020, 11:37:23 AM
Hurry up and rebound Los Angeles. There is no reason we shouldn't be adding 100k+ annually except for the damn nimbys.
Title: Re: Census population estimates 2011-2019
Post by: Cokeland Saxton on March 26, 2020, 11:50:22 AM
My county grew by about 600.
Title: Re: Census population estimates 2011-2019
Post by: cinyc on March 26, 2020, 03:46:09 PM
Interactive map:
https://cinycmaps.com/index.php/2-uncategorized/51-2019-county-population-change-mutlimap
Default map is 2010EB-2019 Percentage change. Click on Menu to see yearly maps, PCT (percentage) and NUM (numerical change), like 2018-19.
https://cinycmaps.com/index.php/2-uncategorized/51-2019-county-population-change-mutlimap
Default map is 2010EB-2019 Percentage change. Click on Menu to see yearly maps, PCT (percentage) and NUM (numerical change), like 2018-19.
Title: Re: Census population estimates 2011-2019
Post by: Skye on March 26, 2020, 04:51:55 PM
Interactive map:
https://cinycmaps.com/index.php/2-uncategorized/51-2019-county-population-change-mutlimap
Default map is 2010EB-2019 Percentage change. Click on Menu to see yearly maps, PCT (percentage) and NUM (numerical change), like 2018-19.
https://cinycmaps.com/index.php/2-uncategorized/51-2019-county-population-change-mutlimap
Default map is 2010EB-2019 Percentage change. Click on Menu to see yearly maps, PCT (percentage) and NUM (numerical change), like 2018-19.
Title: Re: Census population estimates 2011-2019
Post by: cinyc on March 26, 2020, 05:13:28 PM
Interactive map:
https://cinycmaps.com/index.php/2-uncategorized/51-2019-county-population-change-mutlimap
Default map is 2010EB-2019 Percentage change. Click on Menu to see yearly maps, PCT (percentage) and NUM (numerical change), like 2018-19.
https://cinycmaps.com/index.php/2-uncategorized/51-2019-county-population-change-mutlimap
Default map is 2010EB-2019 Percentage change. Click on Menu to see yearly maps, PCT (percentage) and NUM (numerical change), like 2018-19.
Thanks!
I threw this one together fairly quickly, so please let me know if there are any errors.
Title: Re: Census population estimates 2011-2019
Post by: Nyvin on March 26, 2020, 06:43:44 PM
Florida might not gain it's second seat, and Texas might not get it's third.
Title: Re: Census population estimates 2011-2019
Post by: cinyc on March 26, 2020, 08:45:19 PM
Florida might not gain it's second seat, and Texas might not get it's third.
The state numbers haven't changed at all since the December state estimates release. All we got today was the county breakdown of those state numbers. We'll get the further incorporated place breakdown in May.
Title: Re: Census population estimates 2011-2019
Post by: Obama-Biden Democrat on March 29, 2020, 09:29:41 PM
What's the likelihood Coronavirus will have a significant impact on the census? I'm not thinking of the worst-case scenario of massive death tolls, so much as the likelihood that the census response rate is lower and more variable than usual and that the economic dislocation means fewer people move between states.
Yea the great recession really slowed down the Sun Belt's growth rate.
Title: Re: Census population estimates 2011-2019
Post by: Storr on March 30, 2020, 10:42:04 AM
Florida might not gain it's second seat, and Texas might not get it's third.
Edit: Furthermore, after checking to see what other seats have changed since I last looked at a possible reapportionment map (late 2019), the Alabama GOP must be quite relieved if this holds and they don't lose a seat.
Title: Re: Census population estimates 2011-2019
Post by: AGA on April 05, 2020, 10:42:25 PM
Has California ever lost a seat before?
Title: Re: Census population estimates 2011-2019
Post by: jimrtex on April 05, 2020, 11:43:27 PM
Has California ever lost a seat before?
From 1850 to 2010:
2, 3, 4, 6, 7, 8, 11, -, 20, 23, 30, 38, 43, 45, 52, 53, 53
Current streaks:
FL 11* (since 1890)
TX 7 (since 1940)
AZ 6 (since 1950)
All are expected to extend the streak.
*If there had been an apportionment in 1920, Florida's streak would have broken. It only gained one seat between 1910 and 1930. Thus it would have had the same in 1910 and 1920, or in 1920 and 1940.
Current losing streaks.
PA 9 (since 1910, it lost two between 1910 and 1930, but it is possible those were both between 1920 and 1930).
NY 7 (since 1940)
OH 5 (since 1950)
MI 4 (since 1960)
IL 4 (since 1960)
Other long winning streaks:
CA 14 (1850 to 2000)
IL 9 (1820-1910)
MO 8 (1820-1900)
TX 7 (1850-1930)
NY 5 (1789*-1830)
PA 5 (1789*-1830)
PA 5 (1860-1910)
WI 5 (1850-1900)
1789* apportionment under Constitution, NY and PA gained under 1790 Census.
Other long losing streaks:
VA 6 (1810-1870*)
*Loss in 1870 due to separation of WV.
States that have never lost representatives:
AK, AZ, CA, CO, FL, HI, ID, NV, NM, OR, TX, UT, WA, WY.
Title: Re: Census population estimates 2011-2019
Post by: ProgressiveModerate on April 07, 2020, 01:09:49 PM
I would be shocked if OH didn't lose a congressional seat this cycle. Also, I think VA might actually gain another electoral vote, as NOVA is historically undercounted, but it'll be a close call.
Title: Re: Census population estimates 2011-2019
Post by: Skill and Chance on April 07, 2020, 06:09:09 PM
I would be shocked if OH didn't lose a congressional seat this cycle. Also, I think VA might actually gain another electoral vote, as NOVA is historically undercounted, but it'll be a close call.
It would have to be a massive several 100K undercount for VA to gain. VA actually fell below nationwide growth in the second half of the decade.
Title: Re: Census population estimates 2011-2019
Post by: ProgressiveModerate on April 08, 2020, 08:10:34 AM
I would be shocked if OH didn't lose a congressional seat this cycle. Also, I think VA might actually gain another electoral vote, as NOVA is historically undercounted, but it'll be a close call.
It would have to be a massive several 100K undercount for VA to gain. VA actually fell below nationwide growth in the second half of the decade.
Wow that's actually suprising, I wonder why that was, I thought VA was growing faster than the rest of the country overall, while the NE and Rust Belt were shrinking. If VA didn't gain and Republicans held onto OH-16 and AL-7 this cycle woukd be decent for them. I wonder if DE will ever gain a district because it's growing at a decent rate and is already at 950k people.
Title: Re: Census population estimates 2011-2019
Post by: EastAnglianLefty on April 08, 2020, 09:17:21 AM
Wouldn't be a massive shock in a couple of decades' time. Barring significant change to the current party coalitions, it'd be pretty difficult to make the second seat Democratic without going for some extremely squirrelly lines.
Title: Re: Census population estimates 2011-2019
Post by: Cokeland Saxton on April 08, 2020, 10:57:39 AM
I would be shocked if OH didn't lose a congressional seat this cycle. Also, I think VA might actually gain another electoral vote, as NOVA is historically undercounted, but it'll be a close call.
It would have to be a massive several 100K undercount for VA to gain. VA actually fell below nationwide growth in the second half of the decade.
Wow that's actually suprising, I wonder why that was, I thought VA was growing faster than the rest of the country overall, while the NE and Rust Belt were shrinking. If VA didn't gain and Republicans held onto OH-16 and AL-7 this cycle woukd be decent for them. I wonder if DE will ever gain a district because it's growing at a decent rate and is already at 950k people.
973k, a gain of 76k since the census.
Title: Re: Census population estimates 2011-2019
Post by: Skill and Chance on April 08, 2020, 11:19:59 AM
Wouldn't be a massive shock in a couple of decades' time. Barring significant change to the current party coalitions, it'd be pretty difficult to make the second seat Democratic without going for some extremely squirrelly lines.
Yes, in general any population growth in Western states helps Dems in mapping and any population growth in Southern (and a DE-02 would be very Southern-flavored) areas helps Reps. Texas is ambiguous. This has to do with the prevalence of small towns in outlying areas.
Title: Re: Census population estimates 2011-2019
Post by: 💥💥 brandon bro (he/him/his) on April 08, 2020, 11:40:42 AM
I would be shocked if OH didn't lose a congressional seat this cycle. Also, I think VA might actually gain another electoral vote, as NOVA is historically undercounted, but it'll be a close call.
It would have to be a massive several 100K undercount for VA to gain. VA actually fell below nationwide growth in the second half of the decade.
Wow that's actually suprising, I wonder why that was, I thought VA was growing faster than the rest of the country overall, while the NE and Rust Belt were shrinking.
VA is experiencing growth along the I-95 corridor but Appalachia and the Southside are shrinking. There are still a lot of rural areas of the state; anywhere more than an hour outside of a metro area (Richmond, Roanoke, Charlottesville, Hampton Roads) is not attracting enough people to compensate for brain drain.
Looking at decline in SWVA I bet VA-09 is drawn to include Roanoke. Wouldn't make the seat competitive in a normal year but maybe this would be vulnerable in a D-wave.
Title: Re: Census population estimates 2011-2019
Post by: Obama-Biden Democrat on April 09, 2020, 07:17:16 PM
I would be shocked if OH didn't lose a congressional seat this cycle. Also, I think VA might actually gain another electoral vote, as NOVA is historically undercounted, but it'll be a close call.
Why are people hyping up NOVA's growth when VA has not gained a EV in a very long time? If NOVA was another Atlanta, Phoenix, Dallas or Houston then VA would be gaining EV's like AZ, TX, FL or GA.
Title: Re: Census population estimates 2011-2019
Post by: Skill and Chance on April 09, 2020, 08:13:07 PM
I would be shocked if OH didn't lose a congressional seat this cycle. Also, I think VA might actually gain another electoral vote, as NOVA is historically undercounted, but it'll be a close call.
Why are people hyping up NOVA's growth when VA has not gained a EV in a very long time? If NOVA was another Atlanta, Phoenix, Dallas or Houston then VA would be gaining EV's like AZ, TX, FL or GA.
Well, federal employment there got a major boost from the early 2000's defense buildup and late 2000's stimulus spending and many people (myself included at the time) tried to project that forward indefinitely. In practice, NOVA's growth over and above nationwide growth ended with the sequester. Early Trump admin federal cuts may have turned it to an absolute decline in population by 2018 in some counties. However, it's possible growth could pick up again if there is more federal hiring to respond to the current crisis.
Title: Re: Census population estimates 2011-2019
Post by: Brittain33 on April 09, 2020, 08:27:19 PM
I would be shocked if OH didn't lose a congressional seat this cycle. Also, I think VA might actually gain another electoral vote, as NOVA is historically undercounted, but it'll be a close call.
Why are people hyping up NOVA's growth when VA has not gained a EV in a very long time? If NOVA was another Atlanta, Phoenix, Dallas or Houston then VA would be gaining EV's like AZ, TX, FL or GA.
Consider that those are all major metro areas located entirely in their states while NoVa represents, at best, 50% of one metro area minus the central city.
Title: Re: Census population estimates 2011-2019
Post by: Non Swing Voter on May 05, 2020, 12:23:53 AM
I would be shocked if OH didn't lose a congressional seat this cycle. Also, I think VA might actually gain another electoral vote, as NOVA is historically undercounted, but it'll be a close call.
Why are people hyping up NOVA's growth when VA has not gained a EV in a very long time? If NOVA was another Atlanta, Phoenix, Dallas or Houston then VA would be gaining EV's like AZ, TX, FL or GA.
NOVA is growing pretty fast. Loudoun county is one of the fastest growing counties in the country. But Fairfax has stalled out. Also, I think Virginia always has net domestic out migration more than most other southern states so NOVA has to make up for that while also offsetting population loss. I suspect some of the rural population loss in states like Georgia and NC is just being shifted to other areas of the state whereas rural population loss in Virginia is going elsewhere. But yeah, it's definitely not growing as fast as Atlanta, Phoenix, or the Texas cities.
People tend to hype up NOVA not because it's growth is that massive but because its growth has shifted the politics of the state massively. It's having a more pronounced effect than Atlanta is with respect to Georgia.
Title: Re: Census population estimates 2011-2019
Post by: Skill and Chance on May 09, 2020, 10:48:59 AM
I would be shocked if OH didn't lose a congressional seat this cycle. Also, I think VA might actually gain another electoral vote, as NOVA is historically undercounted, but it'll be a close call.
Why are people hyping up NOVA's growth when VA has not gained a EV in a very long time? If NOVA was another Atlanta, Phoenix, Dallas or Houston then VA would be gaining EV's like AZ, TX, FL or GA.
NOVA is growing pretty fast. Loudoun county is one of the fastest growing counties in the country. But Fairfax has stalled out. Also, I think Virginia always has net domestic out migration more than most other southern states so NOVA has to make up for that while also offsetting population loss. I suspect some of the rural population loss in states like Georgia and NC is just being shifted to other areas of the state whereas rural population loss in Virginia is going elsewhere. But yeah, it's definitely not growing as fast as Atlanta, Phoenix, or the Texas cities.
People tend to hype up NOVA not because it's growth is that massive but because its growth has shifted the politics of the state massively. It's having a more pronounced effect than Atlanta is with respect to Georgia.
To put this in perspective, there are several rural VA counties that had a higher population at the 1st US census in 1790 than they do today.
Title: Re: Census population estimates 2011-2019
Post by: ProgressiveModerate on May 09, 2020, 08:36:55 PM
Could COVID cost NY another EV? People seem to be moving ou of the state, and at least 20k people have died and this number is growing
Title: Re: Census population estimates 2011-2019
Post by: Kevinstat on May 10, 2020, 02:50:25 PM
Does anyone know when in May the 2019 estimates at the municipal level are to come out? Or will that even be in May as planned or will it be delayed due to COVID-19? The March release of county-level estimates wasn't delayed, but those were likely pretty much finalized by the time things started getting crazy.
Title: Re: Census population estimates 2011-2019
Post by: Cokeland Saxton on May 10, 2020, 03:48:56 PM
Does anyone know when in May the 2019 estimates at the municipal level are to come out? Or will that even be in May as planned or will it be delayed due to COVID-19? The March release of county-level estimates wasn't delayed, but those were likely pretty much finalized by the time things started getting crazy.
Title: Re: Census population estimates 2011-2019
Post by: Kevinstat on May 11, 2020, 05:34:30 AM
Does anyone know when in May the 2019 estimates at the municipal level are to come out? Or will that even be in May as planned or will it be delayed due to COVID-19? The March release of county-level estimates wasn't delayed, but those were likely pretty much finalized by the time things started getting crazy.
Title: Re: Census population estimates 2011-2019
Post by: jimrtex on May 15, 2020, 12:47:15 PM
Does anyone know when in May the 2019 estimates at the municipal level are to come out? Or will that even be in May as planned or will it be delayed due to COVID-19? The March release of county-level estimates wasn't delayed, but those were likely pretty much finalized by the time things started getting crazy.
12:01 AM EDT, 21 May 2020.
Title: Re: Census population estimates 2011-2019
Post by: lfromnj on May 15, 2020, 01:57:30 PM
I would be shocked if OH didn't lose a congressional seat this cycle. Also, I think VA might actually gain another electoral vote, as NOVA is historically undercounted, but it'll be a close call.
Why are people hyping up NOVA's growth when VA has not gained a EV in a very long time? If NOVA was another Atlanta, Phoenix, Dallas or Houston then VA would be gaining EV's like AZ, TX, FL or GA.
NOVA is growing pretty fast. Loudoun county is one of the fastest growing counties in the country. But Fairfax has stalled out. Also, I think Virginia always has net domestic out migration more than most other southern states so NOVA has to make up for that while also offsetting population loss. I suspect some of the rural population loss in states like Georgia and NC is just being shifted to other areas of the state whereas rural population loss in Virginia is going elsewhere. But yeah, it's definitely not growing as fast as Atlanta, Phoenix, or the Texas cities.
People tend to hype up NOVA not because it's growth is that massive but because its growth has shifted the politics of the state massively. It's having a more pronounced effect than Atlanta is with respect to Georgia.
Title: Re: Census population estimates 2011-2019
Post by: Kevinstat on May 16, 2020, 12:32:19 AM
Does anyone know when in May the 2019 estimates at the municipal level are to come out? Or will that even be in May as planned or will it be delayed due to COVID-19? The March release of county-level estimates wasn't delayed, but those were likely pretty much finalized by the time things started getting crazy.
12:01 AM EDT, 21 May 2020.
Title: Re: Census population estimates 2011-2019
Post by: cinyc on May 18, 2020, 07:14:21 AM
Does anyone know when in May the 2019 estimates at the municipal level are to come out? Or will that even be in May as planned or will it be delayed due to COVID-19? The March release of county-level estimates wasn't delayed, but those were likely pretty much finalized by the time things started getting crazy.
12:01 AM EDT, 21 May 2020.
Thats when the press embargo will be lifted and the press kit released.
Usually, Census doesnt release the actual data until the morning, around 10AM. Well see if this time is any different.
My interactive maps will be updated some time on Thursday.
Title: Re: Census population estimates 2011-2019
Post by: DINGO Joe on May 18, 2020, 11:39:08 AM
Wonder what it takes to qualify as "media" these days. If you were a representative of the Talk Elections Blog, would that qualify?
Title: Re: Census population estimates 2011-2019
Post by: cinyc on May 18, 2020, 02:18:54 PM
Wonder what it takes to qualify as "media" these days. If you were a representative of the Talk Elections Blog, would that qualify?
I dont know, but I wouldnt want to use my real name and would be worried about inadvertently violating the embargo.
I think the media gets access to the data tomorrow so they can write their stories midnight Thursday.
Title: Re: Census population estimates 2011-2019
Post by: jimrtex on May 19, 2020, 09:12:42 AM
Wonder what it takes to qualify as "media" these days. If you were a representative of the Talk Elections Blog, would that qualify?
Guidelines for Embargo Access to Media Embargo Site (https://www.census.gov/newsroom/embargo/accreditation.html)
The key would be the primary purpose of the website is dissemination of the news. Research and publication of election results might be considered news. Conceivably if Dave Leip actively participated with presenting two bylined stories per month, he might qualify.
Embargo access is granted to individuals, with the condition that they not share the data with colleagues. This would like disqualify anyone here.
Title: Re: Census population estimates 2011-2019
Post by: cinyc on May 20, 2020, 11:49:25 PM
The 2019 city estimate press release is out:
https://www.census.gov/newsroom/press-releases/2020/south-west-fastest-growing.html
Leander, TX, Apex, NC and Chico, CA were the fastest-growing cities with a 2018 population over 50k year-over-year.
Phoenix and San Antonio added the most new residents from July 1, 2018-19.
As expected, the actual data won't be available until around 10AM tomorrow, so no new maps tonight.
Title: Re: Census population estimates 2011-2019
Post by: cinyc on May 21, 2020, 12:19:11 PM
The 2019 version of the town (incorporated place, minor civil division & county remainder) pop change map is now live:
https://cinycmaps.com/index.php/population-change/pop-change
Default map is 2010-19. Click on Menu to change what's mapped. 19% = PCT change; 19# = Numerical change. Even the old 2016-18 vintage estimates are there under the 16-18 tabs.
Paradise, CA's loss was really Chico's gain. Paradise, devastated by wildfires, lost over 80% of its population year-over-year.
Title: Re: Census population estimates 2011-2019
Post by: Tender Branson on May 21, 2020, 12:33:19 PM
What are the fastest growing cities in your state (2010-2019) ? (https://public.tableau.com/profile/us.census.bureau#!/vizhome/Fastest-GrowingCityorTowninYourState/dashboard_map)
Title: Re: Census population estimates 2011-2019
Post by: Storr on May 21, 2020, 07:16:48 PM
Quickly looking through the population maps, the big cities (100k+) with declines in population since 2010 seem to all be rust belt cities (Chicago, Detroit, Buffalo, Milwaukee, Cleveland, Pittsburgh, St. Louis, Toledo, Dayton, Paterson, Rochester NY, Syracuse, Springfield IL, Peoria, while Flint has gone below 100k), smaller Southern cities that have long been on a slow decline (Jackson, Mobile, Birmingham, Montgomery, Memphis, Beaumont, Norfolk, Shreveport), or inner ring Los Angeles County suburbs (Downey, Inglewood, West Covina, Torrance, Norwalk, Burbank) .
Just for fun, it looks like Loving County Texas grew by 106.1%.....from 82 to 169 residents. lol
Just for fun, it looks like Loving County Texas grew by 106.1%.....from 82 to 169 residents. lol
Title: Re: Census population estimates 2011-2019
Post by: Starry Eyed Jagaloon on May 21, 2020, 07:22:55 PM
inner ring Los Angeles County suburbs (Downey, Inglewood, West Covina, Torrance, Norwalk, Burbank)
Title: Re: Census population estimates 2011-2019
Post by: Cokeland Saxton on May 22, 2020, 12:30:47 PM
Carmel, Indiana broke 100k, becoming the fifth city in Indiana to do so.
Title: Re: Census population estimates 2011-2019
Post by: Tender Branson on May 22, 2020, 02:31:52 PM
citypopulation.de out with their new, sortable 2010-19 maps/tables for states + cities + counties + CSAs:
Click on the arrow/dots on the left of the map to get growth/decline rates + population density.
States + cities: https://www.citypopulation.de/en/usa/cities/
Counties: https://www.citypopulation.de/en/usa/admin/
CSAs (metro areas): https://www.citypopulation.de/en/usa/combmetro/
Click on the arrow/dots on the left of the map to get growth/decline rates + population density.
States + cities: https://www.citypopulation.de/en/usa/cities/
Counties: https://www.citypopulation.de/en/usa/admin/
CSAs (metro areas): https://www.citypopulation.de/en/usa/combmetro/
Title: Re: Census population estimates 2011-2019
Post by: Storr on May 22, 2020, 03:31:10 PM
According to the new 2019 estimates, the states that have lost population since 2010 are: Connecticut, Illinois, Vermont, and West Virginia.
The one that's most concerning is Illinois. All other Rust Belt states are at least barely growing in population, even Michigan which lost population from 2000-2010!
The one that's most concerning is Illinois. All other Rust Belt states are at least barely growing in population, even Michigan which lost population from 2000-2010!
Title: Re: Census population estimates 2011-2019
Post by: Starry Eyed Jagaloon on May 22, 2020, 05:04:51 PM
Hmm. DC-Baltimore is definitely passing Chicago next year and San Francisco-San Jose should pass Chicago by 2022 at the latest. Weird seeing Chicago slip from 3rd to 5th place so fast.
Title: Re: Census population estimates 2011-2019
Post by: cinyc on May 22, 2020, 05:24:05 PM
Hmm. DC-Baltimore is definitely passing Chicago next year and San Francisco-San Jose should pass Chicago by 2022 at the latest. Weird seeing Chicago slip from 3rd to 5th place so fast.
Chicago will still the the 3rd largest Metropolitan Area for a while. But yes, the DC-Baltimore-Arlington CSA will pass Chicago-Naperville this year. It might have already done so.
Title: Re: Census population estimates 2011-2019
Post by: Tender Branson on May 22, 2020, 11:37:06 PM
Hmm. DC-Baltimore is definitely passing Chicago next year and San Francisco-San Jose should pass Chicago by 2022 at the latest. Weird seeing Chicago slip from 3rd to 5th place so fast.
Both the DC-Baltimore and San Francisco Metro areas will pass Chicagoland pretty soon (they grow at 0.8% per year while Chicago is flat).
All 3 will have ca. 10 million people by 2022.
But Chicago is the more densely populated of the 3: the metro area has 27.500 square km, while DC-Baltimore has 33.000 and the Bay Area 35.000
For comparison: London has 9 million people, but only 1.600 square kilometers ...
Title: Re: Census population estimates 2011-2019
Post by: Starry Eyed Jagaloon on May 22, 2020, 11:58:58 PM
Hmm. DC-Baltimore is definitely passing Chicago next year and San Francisco-San Jose should pass Chicago by 2022 at the latest. Weird seeing Chicago slip from 3rd to 5th place so fast.
Both the DC-Baltimore and San Francisco Metro areas will pass Chicagoland pretty soon (they grow at 0.8% per year while Chicago is flat).
All 3 will have ca. 10 million people by 2022.
But Chicago is the more densely populated of the 3: the metro area has 27.500 square km, while DC-Baltimore has 33.000 and the Bay Area 35.000
For comparison: London has 9 million people, but only 1.600 square kilometers ...
Kind of an awkward metric. Since it's based off of counties, DC-Baltimore, for example, contains a lot of rural areas.
A more apt comparison is 9.0 million person Greater London (606 square miles) to 5.1 million person Washington urban area (1,321 square miles).
Otherwise, you have to compare all of Metropolitan London (Greater London+Buckinghamshire+Hertfordshire+Essex+Kent+Surrey+Berkshire+Hampshire+Sussex+Oxfordshire) with 20.9 million people and 10,404 square miles against the DC-Baltimore CSA with 9.8 million people across 33,000 square miles. Even this is crude because American CSAs include any county with 5% of its workforce commuting to any county in the CSA, which adds parts of the Delmarva peninsula, West Virginia, and South-Central Pennsylvania to the metro area even when they're obviously undeveloped. It would be like having Metropolitan London stretch from Ipswich to Swindon.
Title: Re: Census population estimates 2011-2019
Post by: Gass3268 on May 23, 2020, 12:22:36 AM
Combining Washington and Baltimore into one CSA makes me wonder if they'd ever do the same with Chicago and Milwaukee.
Also, what cities go over 1 million in the next Decade? Austin appears to be a certainty and might even go over the top with the upcoming census. Do Jacksonville, Fort Worth, Columbus and/or Charlotte get there?
Also, what cities go over 1 million in the next Decade? Austin appears to be a certainty and might even go over the top with the upcoming census. Do Jacksonville, Fort Worth, Columbus and/or Charlotte get there?
Title: Re: Census population estimates 2011-2019
Post by: Starry Eyed Jagaloon on May 23, 2020, 12:26:57 AM
Combining Washington and Baltimore into one CSA makes me wonder if they'd ever do the same with Chicago and Milwaukee.
Definitely a possibility, although I'm not sure if commuting between Lake County and Kenosha/Racine is increasing.. A more intriguing possibility is New York-Philadelphia. Last census, Mercer county hit the commuting threshold to combine the two but it was overridden. At some point or another, the two will be attached, which will be weird. I guess we'll have to call the area Greater Jersey.
Title: Re: Census population estimates 2011-2019
Post by: Cokeland Saxton on May 23, 2020, 12:59:33 AM
Combining Washington and Baltimore into one CSA makes me wonder if they'd ever do the same with Chicago and Milwaukee.
Also, what cities go over 1 million in the next Decade? Austin appears to be a certainty and might even go over the top with the upcoming census. Do Jacksonville, Fort Worth, Columbus and/or Charlotte get there?
Also, what cities go over 1 million in the next Decade? Austin appears to be a certainty and might even go over the top with the upcoming census. Do Jacksonville, Fort Worth, Columbus and/or Charlotte get there?
Austin will get there first for sure, and Fort Worth, Columbus, and Charlotte will follow. Jacksonville isn't growing nearly as fast, so probably will be a while for it.
Title: Re: Census population estimates 2011-2019
Post by: Oryxslayer on May 23, 2020, 06:44:37 AM
Combining Washington and Baltimore into one CSA makes me wonder if they'd ever do the same with Chicago and Milwaukee.
Definitely a possibility, although I'm not sure if commuting between Lake County and Kenosha/Racine is increasing.. A more intriguing possibility is New York-Philadelphia. Last census, Mercer county hit the commuting threshold to combine the two but it was overridden. At some point or another, the two will be attached, which will be weird. I guess we'll have to call the area Greater Jersey.
Eventually the Northeast CSA will just be the entire Acela corridor, linked by the businessmen who crisscross the cities on their daily commutes. Efficient changes in car design or increased development of commuter networks will probably be needed, but those seem inevitable given the progress of time.
Title: Re: Census population estimates 2011-2019
Post by: Im not Stu on May 24, 2020, 10:22:25 AM
I just signed up for DRA. What should be the "target population" for each district on a CA map with 52 districts?
Title: Re: Census population estimates 2011-2019
Post by: Starry Eyed Jagaloon on May 24, 2020, 01:28:15 PM
I just signed up for DRA. What should be the "target population" for each district on a CA map with 52 districts?
Set the population to 2018 figures and divide by 52. Also, this is the wrong thread for this.
Title: Re: Census population estimates 2011-2019
Post by: Torie on June 23, 2020, 02:03:37 PM
The Northeast region as a whole lost population last year. 10 states lost population too, one higher than last year.
New York lost almost 77k people, does that mean it'll lose two congressional districts?
New York lost almost 77k people, does that mean it'll lose two congressional districts?
Its looking extremely likely at this point.
And one could make the argument that both seats should come at the expense of Upstate New York.
The math doesnt add up for two upstate losses. The more likely result is that one seat upstate is lost along with one Long Island/East NYC seat.
The math might not add up to 2 lost seats at all. NY-26 is literally on the bubble in many of the analyses I've seen.
I'd bet that it will lose 2, though.
Cinyc, what odds do you place on NY losing 2 seats rather than 1? Whether NY loses two CD's or one has a big impact on the options for the border of the current NY-19 given NY's funnel shape. NY clearly has the oddest shape of all 50 states in my opinion.
How accurate is the census when it asks where one lived on April 1 four months later? Is there any data that addresses that issue? I assume there will be more late responses this year than in the past.
Title: Re: Census population estimates 2011-2019
Post by: cinyc on June 23, 2020, 02:41:37 PM
Cinyc, what odds do you place on NY losing 2 seats rather than 1? Whether NY loses two CD's or one has a big impact on the options for the border of the current NY-19 given NY's funnel shape. NY clearly has the oddest shape of all 50 states in my opinion.
How accurate is the census when it asks where one lived on April 1 four months later? Is there any data that addresses that issue? I assume there will be more late responses this year than in the past.
How accurate is the census when it asks where one lived on April 1 four months later? Is there any data that addresses that issue? I assume there will be more late responses this year than in the past.
Given the COVID-related escape from NYC (especially Manhattan), I think NYC losing 2 seats is a lot more likely than the 2019 estimates and forecasts say. I'd almost bet on it.
There's a thread on the General board about Census' efforts. I haven't updated my interactive map vs 2010 in a while, but areas of NYC - especially on the Upper East Side near Central Park - were really lagging their 2010 response rates in mid-May. Response rates haven't increased much since.
Title: Re: Census population estimates 2011-2019
Post by: Torie on June 23, 2020, 03:05:08 PM
Cinyc, what odds do you place on NY losing 2 seats rather than 1? Whether NY loses two CD's or one has a big impact on the options for the border of the current NY-19 given NY's funnel shape. NY clearly has the oddest shape of all 50 states in my opinion.
How accurate is the census when it asks where one lived on April 1 four months later? Is there any data that addresses that issue? I assume there will be more late responses this year than in the past.
How accurate is the census when it asks where one lived on April 1 four months later? Is there any data that addresses that issue? I assume there will be more late responses this year than in the past.
Given the COVID-related escape from NYC (especially Manhattan), I think NYC losing 2 seats is a lot more likely than the 2019 estimates and forecasts say. I'd almost bet on it.
There's a thread on the General board about Census' efforts. I haven't updated my interactive map vs 2010 in a while, but areas of NYC - especially on the Upper East Side near Central Park - were really lagging their 2010 response rates in mid-May. Response rates haven't increased much since.
Thank you. Except isn't most of the great escape from NYC after April 1? Is your opinion in part premised that those who fled will not fill out the form stating that they lived in NY on April 1 even if they did? Due to the great escape the Hudson rental market is doing very well these days. A lot of over priced listings also appeared as property owners try to cash in. Whether or not their pecuniary dreams come true remains to be seen.
Title: Re: Census population estimates 2011-2019
Post by: cinyc on June 23, 2020, 03:34:16 PM
Cinyc, what odds do you place on NY losing 2 seats rather than 1? Whether NY loses two CD's or one has a big impact on the options for the border of the current NY-19 given NY's funnel shape. NY clearly has the oddest shape of all 50 states in my opinion.
How accurate is the census when it asks where one lived on April 1 four months later? Is there any data that addresses that issue? I assume there will be more late responses this year than in the past.
How accurate is the census when it asks where one lived on April 1 four months later? Is there any data that addresses that issue? I assume there will be more late responses this year than in the past.
Given the COVID-related escape from NYC (especially Manhattan), I think NYC losing 2 seats is a lot more likely than the 2019 estimates and forecasts say. I'd almost bet on it.
There's a thread on the General board about Census' efforts. I haven't updated my interactive map vs 2010 in a while, but areas of NYC - especially on the Upper East Side near Central Park - were really lagging their 2010 response rates in mid-May. Response rates haven't increased much since.
Thank you. Except isn't most of the great escape from NYC after April 1? Is your opinion in part premised that those who fled will not fill out the form stating that they lived in NY on April 1 even if they did? Due to the great escape the Hudson rental market is doing very well these days. A lot of over priced listings also appeared as property owners try to cash in. Whether or not their pecuniary dreams come true remains to be seen.
If people aren't home to get their forms/Internet invitations, how are they going to respond? I suspect many won't.
This map is a little old, but just zoom into NYC here:
https://cinycmaps.com/index.php/20-census/may-response-rate-maps
As of mid-May, response rates in parts of Manhattan were in the blue range, meaning 20-40 points worse than 2010's final self-response rate. Most others were dark green (-15 to -20). Whether that's due to the virus or people buying trophy properties, I don't know for sure. But compare to the rest of the country, which is usually near - and sometimes above - its 2010 final self-response rate.
Census has some work to do in NYC.
Title: Re: Census population estimates 2011-2019
Post by: jimrtex on July 02, 2020, 12:07:28 PM
The Northeast region as a whole lost population last year. 10 states lost population too, one higher than last year.
New York lost almost 77k people, does that mean it'll lose two congressional districts?
New York lost almost 77k people, does that mean it'll lose two congressional districts?
Its looking extremely likely at this point.
And one could make the argument that both seats should come at the expense of Upstate New York.
The math doesnt add up for two upstate losses. The more likely result is that one seat upstate is lost along with one Long Island/East NYC seat.
The math might not add up to 2 lost seats at all. NY-26 is literally on the bubble in many of the analyses I've seen.
I'd bet that it will lose 2, though.
Cinyc, what odds do you place on NY losing 2 seats rather than 1? Whether NY loses two CD's or one has a big impact on the options for the border of the current NY-19 given NY's funnel shape. NY clearly has the oddest shape of all 50 states in my opinion.
How accurate is the census when it asks where one lived on April 1 four months later? Is there any data that addresses that issue? I assume there will be more late responses this year than in the past.
Quote
New York year-to-year change has dropped every year this decade. That is, its second derivative is negative, and its population is in parabolic decline. After the 2011 estimate, it was projected that New York would keep its 27th seat. Since then, smaller increases, which have have become decreases since 2016 put New York at risk of losing two representatives. A projection based on estimates from 2010-2019 would result in a surplus of around 130K. But the average annual gain from 2010 to 2019 was around 6K, while the loss for 2018-2019 was 76K. If we project a loss of 95K for 2020 based on recent trends, that would be a deficit of 100K (75K for nine months) which would eat into more than half of the projected surplus. Much will depend on how accurate the revisions in estimates of international migration were. International emigration is difficult to measure since it depends on measuring persons who no longer exist.
Birth records are accurate. Death records are accurate. Estimates of domestic migration based on IRS and SSA records may be reasonably accurate. If New York keeps a 26th representative it may be lost before the 2020 census results are announced. New York is projected to lose 1.634 representatives (from 27.243 to 25.609). They are in a favorable position for rounding.
Birth records are accurate. Death records are accurate. Estimates of domestic migration based on IRS and SSA records may be reasonably accurate. If New York keeps a 26th representative it may be lost before the 2020 census results are announced. New York is projected to lose 1.634 representatives (from 27.243 to 25.609). They are in a favorable position for rounding.
Our estimates of seats lost or gained are based on projections of the census estimates. Assuming that census estimates are accurate, our projections become more accurate as the decade wears on because we are projecting over a shorter period of time, in this case for the 9 months between July 2019 and April 2020.
But our projections are simple-minded. We assume that the trend from 2010-2019 will continue. Or we assume the trend from 2017-2019 will continue. But in New York, the estimated loss from 2018-2019 was greater than for 2017-2018, and in the early part of the decade, New York was gaining. Cities in general were gaining population post recession, as people were having to defer retirement or a move to the suburbs. Some were having to remain at their parents house, or stay coupled, even if not married.
The census estimates have to account for emigration. While immigration to NYC is very high, emigration is also high. Someone who is overstaying their visa might be included in an estimate. But if they move back to Tajikistan will it be noticed? Refinements of census estimates had a particular effect on New York. It has lots of immigrants from lots of places, but they may return to those places as well. The effect was smaller in California and Texas because immigrants from Latin America are less likely to return.
And finally, apportionment of representatives is among the states. For New York to lose a second seat, another state has to gain it. There are eight states vying for the final four seats.
NY(26) 1.004
TX(39) 1.003
FL(29) 1.002
MT(2) 1.001
----------------
AL(6) 0.998
MN(7) 0.997
CA (52) 0.995
OH(15) 0.994
New York has been faltering as has California. Texas has been OK, not as strong as earlier but not slowing to a halt. Florida has been strengthening since recovering from the housing bubble, and is gaining Puerto Ricans, as well as Venezuelans who can escape.
That leaves perhaps New York, Montana, Alabama, and Minnesota competing for the last two. None are really grabbing those last two.
As you probably know, half the New York population is insular: Long, Staten, and Manhattan; and half on the mainland Bronx, Westchester and points north and west. If there an odd number of districts, then you will have a district spanning from either Manhattan or Queens to the Bronx, with 5-1/2 districts south of the 19th. If there is an even number, then there will be 5 districts south of the 19th, which will yank the district south.
Assuming that the new districts will be drawn by a federal judge, or the redistricting commission produces something reasonable, NY-23 is the odd man out.
You aren't going to push districts out of Buffalo, Rochester, Syracuse, Albany or the North Country. NY-23 and NY-27 might seem to be available but that can only be done with adding fingers into their territory.
So NY-27 slides east taking Binghamton, perhaps losing Chautauqua. It will be quite vulnerable in 2030 as the four districts to the north will need to expand. NY-24 shifts eastward while remaining anchored in Syracuse (Wayne is a better fit with Rochester anyway). NY-21 will take Utica, becoming less and less a North Country district, but still identified as such. NY-19 may push a bit west.
Delays due to COVID-19 have pushed the announcement of congressional apportionment to March 2021, and release of the block-level number to June 2021 (this is not official because the deadlines are set in statute, but there is zero chance of this not happening).
In New York, there is also the prison-adjustment. This will make it almost impossible to re-ward Hudson before the July 2021 primary. Perhaps partisan primaries can be eliminated and go with a non-partisan general election in November, with a runoff if necessary.
Title: Re: Census population estimates 2011-2019
Post by: Oryxslayer on July 08, 2020, 05:42:41 PM
https://www.mercurynews.com/2020/07/08/study-in-a-first-california-poised-to-lose-house-seats/?utm_source=twitter.com&utm_campaign=socialflow&utm_medium=social&utm_content=tw-mercnews
It smells like clickbait, but at the same time California has a large number of 'hard to count' census regions, mostly areas in the valley with Rural Hispanic populations. The article mostly talks about the effects and why it might happen, corona and ensuing response rates, rather than the math behind it - typical of puff pieces. So, could our resident calculators like Jimrtex and Cinyc voice in on the scenario outlined about California losing two seats.
It smells like clickbait, but at the same time California has a large number of 'hard to count' census regions, mostly areas in the valley with Rural Hispanic populations. The article mostly talks about the effects and why it might happen, corona and ensuing response rates, rather than the math behind it - typical of puff pieces. So, could our resident calculators like Jimrtex and Cinyc voice in on the scenario outlined about California losing two seats.
Title: Re: Census population estimates 2011-2019
Post by: Cokeland Saxton on July 08, 2020, 10:38:16 PM
That would likely guarantee Montana a seat and save either Minnesota or Alabama's seat.
Title: Re: Census population estimates 2011-2019
Post by: cinyc on July 10, 2020, 11:51:10 PM
https://www.mercurynews.com/2020/07/08/study-in-a-first-california-poised-to-lose-house-seats/?utm_source=twitter.com&utm_campaign=socialflow&utm_medium=social&utm_content=tw-mercnews
It smells like clickbait, but at the same time California has a large number of 'hard to count' census regions, mostly areas in the valley with Rural Hispanic populations. The article mostly talks about the effects and why it might happen, corona and ensuing response rates, rather than the math behind it - typical of puff pieces. So, could our resident calculators like Jimrtex and Cinyc voice in on the scenario outlined about California losing two seats.
It smells like clickbait, but at the same time California has a large number of 'hard to count' census regions, mostly areas in the valley with Rural Hispanic populations. The article mostly talks about the effects and why it might happen, corona and ensuing response rates, rather than the math behind it - typical of puff pieces. So, could our resident calculators like Jimrtex and Cinyc voice in on the scenario outlined about California losing two seats.
It's certainly possible. There are areas near downtown and Westside LA that are currently severely under-reporting compared to 2010, though. Like worse than Upper East Side Manhattan levels of bad. I have no clue why. In Manhattan, it's likely due to the virus exodus. OC is in much better shape - and there's a stark divide that nearly mirrors the county line.
I tried to find the relevant study mentioned in the article and came up with nothing more substantive than the article. I can't find any more recent ESRI report than what was put out last year.
Title: Re: Census population estimates 2011-2019
Post by: jimrtex on July 16, 2020, 11:52:33 AM
https://www.mercurynews.com/2020/07/08/study-in-a-first-california-poised-to-lose-house-seats/?utm_source=twitter.com&utm_campaign=socialflow&utm_medium=social&utm_content=tw-mercnews
It smells like clickbait, but at the same time California has a large number of 'hard to count' census regions, mostly areas in the valley with Rural Hispanic populations. The article mostly talks about the effects and why it might happen, corona and ensuing response rates, rather than the math behind it - typical of puff pieces. So, could our resident calculators like Jimrtex and Cinyc voice in on the scenario outlined about California losing two seats.
It smells like clickbait, but at the same time California has a large number of 'hard to count' census regions, mostly areas in the valley with Rural Hispanic populations. The article mostly talks about the effects and why it might happen, corona and ensuing response rates, rather than the math behind it - typical of puff pieces. So, could our resident calculators like Jimrtex and Cinyc voice in on the scenario outlined about California losing two seats.
Here is the news release that the article is based on.
Southern California Faces Loss of One Congressional District, May narrowly hold on to second (https://roseinstitute.org/southern-california-faces-loss-of-one-congressional-district-may-narrowly-hold-on-to-second/)
Note that like the news article bungles Southern California and California together.
This may be the report underlying the news release. Note if you click on Download you can get the report in PDF format.
Winners and Losers: The 2020 Census and California's 2021 Redistricting (https://issuu.com/roseinstitutecmc/docs/winners-and-losers_2020-census)
The underlying estimates are based on the 2017 one-year estimates projected forward to 2020. They make a small error by not accounting for estimates being based on July 1, and the census occurring on April 1. The ACS is a year-round collection, with July 1 being midpoint of the year.
A better projection would use the 2019 county estimates dividing by 9.25 and projecting forward by adding 0.75 per year.
They divide Los Angeles into 5 regions. You could make projections based on the 2018 ACS, project forward to 2020, and then control the regional populations to the countywide projection.
Their estimates for congressional representation take into account a loss of one representative for California, but due to rounding to 0.1 districts, the 2010 counts total 52.8, leaving the loss of 0.2 districts unaccounted for.
The only ESRI report suggesting a loss of another seat that I could find was based on a supposition of 4 seats being apportioned to a state of Puerto Rico.
Apportionment for California is kind of weird. It gains/loses a seat for about every 2% gain or loss relative to the US (1/52 = 1.92%). But apportionment is among all 50 states, so while the quotients for California are evenly spaced, that of the collective 50 states is not. So on the priority list California might be 435th, 431st, and 419th, rather than a regular spacing of every 8th or 9th seat.
The story is naive about losing a particular district. Imagine that if in 2010, California had been informed they only had 52 seats, but had already completed their 53-district plan.
Every district would have to gain about 15,000 persons. So you start working south from the Golden Gate bridge, and Oregon and converging around Stockton. The first district nibbles 15,000 from a neighbor, which takes 30,000 from its neighbor and so on. By the time you get to Bakersfield, Palmdale, Apple Valley, you are shifting half a district around, pairing incumbents, and creating open seats.
Title: Re: Census population estimates 2011-2019
Post by: jimrtex on July 18, 2020, 08:48:01 AM
https://www.mercurynews.com/2020/07/08/study-in-a-first-california-poised-to-lose-house-seats/?utm_source=twitter.com&utm_campaign=socialflow&utm_medium=social&utm_content=tw-mercnews
It smells like clickbait, but at the same time California has a large number of 'hard to count' census regions, mostly areas in the valley with Rural Hispanic populations. The article mostly talks about the effects and why it might happen, corona and ensuing response rates, rather than the math behind it - typical of puff pieces. So, could our resident calculators like Jimrtex and Cinyc voice in on the scenario outlined about California losing two seats.
It smells like clickbait, but at the same time California has a large number of 'hard to count' census regions, mostly areas in the valley with Rural Hispanic populations. The article mostly talks about the effects and why it might happen, corona and ensuing response rates, rather than the math behind it - typical of puff pieces. So, could our resident calculators like Jimrtex and Cinyc voice in on the scenario outlined about California losing two seats.
Here is the news release that the article is based on.
Southern California Faces Loss of One Congressional District, May narrowly hold on to second (https://roseinstitute.org/southern-california-faces-loss-of-one-congressional-district-may-narrowly-hold-on-to-second/)
Quote from: Rose Institute
while narrowly holding onto the 52nd district by only 1,324 people over Arizona and 3,248 over Minnesota.
I think what they have done here is used the quotient for the 51st seat. For example, my projections show that California is 222,000 below the number needed to keep a 53rd seat, but the quotient would be 4,228 below that needed. The report would lead you to believe that California would only need to lose 1,324 persons, but it would actually be 51.497 (sqrt(51*52) times that. My estimate assumes continuation of the average 2010-2019 rate for the last 3/4 of a year before the census. This is not likely given the slowdown in California growth/increase in domestic outflow. But it is over a short period. As we approach the census, errors in projection become less significant (and we don't really have the capability to make better estimates than the census bureau). I still, assuming the 2019 estimate is reasonably accurate, believe California will have 52 seats, but this assumes an error of less than 1% in the Census estimate.Note that like the news article bungles Southern California and California together.
This may be the report underlying the news release. Note if you click on Download you can get the report in PDF format.
Winners and Losers: The 2020 Census and California's 2021 Redistricting (https://issuu.com/roseinstitutecmc/docs/winners-and-losers_2020-census)
The underlying estimates are based on the 2017 one-year estimates projected forward to 2020. They make a small error by not accounting for estimates being based on July 1, and the census occurring on April 1. The ACS is a year-round collection, with July 1 being midpoint of the year.
A better projection would use the 2019 county estimates dividing by 9.25 and projecting forward by adding 0.75 per year.
They divide Los Angeles into 5 regions. You could make projections based on the 2018 ACS, project forward to 2020, and then control the regional populations to the countywide projection.
Their estimates for congressional representation take into account a loss of one representative for California, but due to rounding to 0.1 districts, the 2010 counts total 52.8, leaving the loss of 0.2 districts unaccounted for.
The only ESRI report suggesting a loss of another seat that I could find was based on a supposition of 4 seats being apportioned to a state of Puerto Rico.
Apportionment for California is kind of weird. It gains/loses a seat for about every 2% gain or loss relative to the US (1/52 = 1.92%). But apportionment is among all 50 states, so while the quotients for California are evenly spaced, that of the collective 50 states is not. So on the priority list California might be 435th, 431st, and 419th, rather than a regular spacing of every 8th or 9th seat.
The story is naive about losing a particular district. Imagine that if in 2010, California had been informed they only had 52 seats, but had already completed their 53-district plan.
Every district would have to gain about 15,000 persons. So you start working south from the Golden Gate bridge, and Oregon and converging around Stockton. The first district nibbles 15,000 from a neighbor, which takes 30,000 from its neighbor and so on. By the time you get to Bakersfield, Palmdale, Apple Valley, you are shifting half a district around, pairing incumbents, and creating open seats.
I reworked the estimates in the report, using the 2019 county estimates, linearly projected forward. The reports districts within Los Angeles county are based on assembly districts. I used the 2012 and 2018 5-year ACS which are used as approximations of the July 2010 and July 2016 populations. which were projected forward to 2020, and then controlled to the Los Angeles county estimate. 6 assembly districts cross county lines, and the report gave a 2010 estimate of their population in Los Angeles County. I prorated the 2020 projections on that basis. The projections of the areas in Los Angeles County are a bit dicey, but don't really effect the overall distribution.
| Area | 2010 (53) | 2020 (52) | Change |
| North | 2.514 | 2.418 | -0.096 |
| San Francisco Bay | 10.547 | 10.560 | 0.013 |
| Central Coast | 2.827 | 2.724 | -0.103 |
| Central Valley | 8.198 | 8.171 | -0.027 |
| Southern | 14.943 | 14.952 | 0.009 |
| Los Angeles | 13.970 | 13.174 | -0.796 |
| Westside | 2.681 | 2.479 | -0.202 |
| Downtown/Gateway | 4.626 | 4.360 | -0.266 |
| San Gabriel | 2.953 | 2.758 | -0.195 |
| San Fernando/Antelope | 3.710 | 3.577 | -0.133 |
So 8/10 of the loss of the 53rd district is accounted for in Los Angeles county, and the other 2/10 in the northern part of the state (Ventura, Kern, Inyo and other points north).
The 24 northern districts can be retained with a shift of about 100,000 out of western Los Angeles, or northern Los Angeles, or northwestern San Bernardino.
Riverside is the only county in southern California that has increased in district share, but San Diego and Imperial are basically static and on the edge of the state. There would be no reason to change those districts unless the commission decided to do a wholesale reshuffle (it is a legal requirement to not take into consideration existing districts or incumbents, but if the demographic facts are about the same, it is not unreasonable to come to the same conclusions).
I assume the commission will not cross the mountains between Orange and Riverside, particularly to grab a small bit on the other side of the mountains. So the Orange districts will add a bit from Los Angeles, Los Angeles will take some from San Bernardino, and Riverside will move some into San Bernardino. (these adjustment are relative small, around 100K).
The loss of a seat in Los Angeles is distributed throughout the county, which will force the district that disappears to be in the center among (CA-34, 37, 38, 40, 43, 44). In 2011, there were not Section 2 VRA seats drawn for a black district (i.e. black voters participate in greater numbers than non-citizen Hispanic voters). In 2021, there may be an emphasis on creating a districts that would be by a Hispanic candidate, essentially pairing Karen Bass and Maxine Waters.
Title: Re: Census population estimates 2011-2019
Post by: Brittain33 on July 18, 2020, 11:23:47 AM
Quote
In 2021, there may be an emphasis on creating a districts that would be by a Hispanic candidate, essentially pairing Karen Bass and Maxine Waters.
By which we mean a candidate of the Hispanic community's choice, not necessarily a Hispanic candidate.
Title: Re: Census population estimates 2011-2019
Post by: Oryxslayer on July 18, 2020, 11:47:01 AM
Quote
In 2021, there may be an emphasis on creating a districts that would be by a Hispanic candidate, essentially pairing Karen Bass and Maxine Waters.
By which we mean a candidate of the Hispanic community's choice, not necessarily a Hispanic candidate.
Unfortunately, the commission having three AA commissioners make such action unlikely. We have discussed this at length in the CA thread. However, I thank jimrtex for doing the math regarding the article in question.
Title: Re: Census population estimates 2011-2019
Post by: jimrtex on July 18, 2020, 09:05:47 PM
Quote
In 2021, there may be an emphasis on creating a districts that would be by a Hispanic candidate, essentially pairing Karen Bass and Maxine Waters.
By which we mean a candidate of the Hispanic community's choice, not necessarily a Hispanic candidate.
The California Constitution says: "communities of interest shall not include relationships with political parties, incumbents, or political candidates" For example, a claim that Hispanic voters in a particular area happen to prefer Maxine Waters is irrelevant. It might not even be possible to use endogenous congressional results to determine the candidate of choice for a particular racial or ethnic group. Instead you might have to use an election such as Feinstein-DeLeon to determine if the group prefers different candidates. You might also use county supervisor or city elections. California Top 2 and non-partisan elections may be particularly useful in this regard.
The first step in a VRA analysis is to determine compact areas where a group constitutes a majority of the CVAP. If the 2020 census shows an expanded footprint for Hispanic voters, which it almost certainly will, it may be necessary to maintain 5 Hispanic districts to the east of one Black plurality district.
The reason that the redistricting commission is being organized earlier is to help define and delineate communities of interest prior to the line drawing process. The delay in the census data should help even more.
In 2011, the lawyers for the commission advised that the commission should take the word of local experts or advocates, since the commission did not have the time to do this. Many of these advocates may have been political plants, who were suggesting communities of interest where they wanted lines drawn or not drawn.
Title: Re: Census population estimates 2011-2019
Post by: ProgressiveModerate on October 05, 2020, 09:12:22 PM
Any updated estimates on the electoral reappointments? So far, the only things that seem set in stone are that OR, AZ, CO, NC will gain 1, FL will gain at least 1, and TX will gain at least 2 while, While NY loses at least 1, PA, IL, RI, WV, MI all lose 1. The big question marks seem to be CA, MT, AL, OH, MN, VA, NY (2nd district), FL (2nd district), TX (3rd district). Is this an accurate summary of where things stand?
Title: Re: Census population estimates 2011-2019
Post by: Coastal Elitist on October 06, 2020, 12:03:29 AM
Any updated estimates on the electoral reappointments? So far, the only things that seem set in stone are that OR, AZ, CO, NC will gain 1, FL will gain at least 1, and TX will gain at least 2 while, While NY loses at least 1, PA, IL, RI, WV, MI all lose 1. The big question marks seem to be CA, MT, AL, OH, MN, VA, NY (2nd district), FL (2nd district), TX (3rd district). Is this an accurate summary of where things stand?
Title: Re: Census population estimates 2011-2019
Post by: Non Swing Voter on December 03, 2020, 09:55:33 PM
Any updated estimates on the electoral reappointments? So far, the only things that seem set in stone are that OR, AZ, CO, NC will gain 1, FL will gain at least 1, and TX will gain at least 2 while, While NY loses at least 1, PA, IL, RI, WV, MI all lose 1. The big question marks seem to be CA, MT, AL, OH, MN, VA, NY (2nd district), FL (2nd district), TX (3rd district). Is this an accurate summary of where things stand?
I wasn't aware that Virginia is on the cusp... hasn't population growth in VA slowed substantially.
Title: Re: Census population estimates 2011-2019
Post by: ProgressiveModerate on December 04, 2020, 08:20:18 AM
Any updated estimates on the electoral reappointments? So far, the only things that seem set in stone are that OR, AZ, CO, NC will gain 1, FL will gain at least 1, and TX will gain at least 2 while, While NY loses at least 1, PA, IL, RI, WV, MI all lose 1. The big question marks seem to be CA, MT, AL, OH, MN, VA, NY (2nd district), FL (2nd district), TX (3rd district). Is this an accurate summary of where things stand?
I wasn't aware that Virginia is on the cusp... hasn't population growth in VA slowed substantially.
I think at the start of the decade it seemed well on track to gain a 12th district but population growth has slowed a bit since then. With that being said, NOVA is historically undercounted so there's still a small chance it gains, but more likely than not it just stays at 11 for now.
Title: Re: Census population estimates 2011-2019
Post by: muon2 on December 04, 2020, 08:48:23 AM
Any updated estimates on the electoral reappointments? So far, the only things that seem set in stone are that OR, AZ, CO, NC will gain 1, FL will gain at least 1, and TX will gain at least 2 while, While NY loses at least 1, PA, IL, RI, WV, MI all lose 1. The big question marks seem to be CA, MT, AL, OH, MN, VA, NY (2nd district), FL (2nd district), TX (3rd district). Is this an accurate summary of where things stand?
There are no new estimates from the Census Bureau. Here's my post from last year after the 2019 estimates were released.
Here's my annual projection from the new estimates. I used the July 2019 estimates and the April 2010 Census base to get an annual growth rate. This correctly accounts for the 9 and a quarter year period between the Census and the estimate. I then applied the annual growth rate to the 2010 reapportionment population to get the 2020 projection. This accounts for the extra overseas population used in reapportionment but not for redistricting (It doesn't adjust for the new distinction between deployed vs stationed).
AL -1
AZ +1
CA -1
CO +1
FL +2
IL -1
MI -1
MN -1
MT +1
NY -1
NC +1
OH -1
OR +1
PA -1
RI -1
TX +3
WV -1
These projections are unchanged from last year (https://uselectionatlas.org/FORUM/index.php?topic=166668.msg6591877#msg6591877). The bubble seats in this projection are based on the last five awarded and the next five in line.
The last five awarded are IL-17, FL-29, TX-39, NY-26, and MT-2 (#435).
The next five in line are AL-7, MN-8, CA-53, OH-16, and RI-2.
I also make an alternate projection based on just the prior two years of estimates to determine the rate of growth. It's more sensitive to recent growth trends, and matches the full decade projection.
AL -1
AZ +1
CA -1
CO +1
FL +2
IL -1
MI -1
MN -1
MT +1
NY -1
NC +1
OH -1
OR +1
PA -1
RI -1
TX +3
WV -1
These projections are unchanged from last year (https://uselectionatlas.org/FORUM/index.php?topic=166668.msg6591877#msg6591877). The bubble seats in this projection are based on the last five awarded and the next five in line.
The last five awarded are IL-17, FL-29, TX-39, NY-26, and MT-2 (#435).
The next five in line are AL-7, MN-8, CA-53, OH-16, and RI-2.
I also make an alternate projection based on just the prior two years of estimates to determine the rate of growth. It's more sensitive to recent growth trends, and matches the full decade projection.
Title: Re: Census population estimates 2011-2019
Post by: Tender Branson on December 04, 2020, 09:05:36 AM
So, Trump states would gain a net of 4 EV, Biden states would lose 4.
Title: Re: Census population estimates 2011-2019
Post by: Biden his time on December 11, 2020, 08:08:22 AM
Does anyone want to take any guesses as to what the biggest and most surprising differences will be between the 2019 Population Estimates (or the way things are headed based on those) and the 2020 Census Results? Such as perhaps a state with a far higher or lower population than projected in the several hundreds of thousands?
Like happened with Georgia between 2009 and 2010:
At the time of the 2000 Census (April 1, 2010), Georgia had a population of 8,186,453.
The U.S. Census Bureau projected that Georgia had a population of 9,829,211 on July 1, 2009.
The 2010 Census (April 1, 2010) showed that Georgia actually had a population of 9,687,653.
It isn't likely that Georgia actually lost 150,000 people between 2009 and 2010, and when the Census Bureau released its final intercensal tables (showing their population estimates of every state between 2000 and 2010), they estimated Georgia's actual population in 2009 was 9,620,846 (208,365 lower than the initial 2009 estimate released before the census).
What are the chances these estimates turn out to miss the mark by such high amounts?
Title: Re: Census population estimates 2011-2019
Post by: Sol on December 11, 2020, 11:56:52 AM
Does anyone want to take any guesses as to what the biggest and most surprising differences will be between the 2019 Population Estimates (or the way things are headed based on those) and the 2020 Census Results? Such as perhaps a state with a far higher or lower population than projected in the several hundreds of thousands?
Like happened with Georgia between 2009 and 2010:
At the time of the 2000 Census (April 1, 2010), Georgia had a population of 8,186,453.
The U.S. Census Bureau projected that Georgia had a population of 9,829,211 on July 1, 2019.
The 2010 Census (April 1, 2010) showed that Georgia actually had a population of 9,687,653.
It isn't likely that Georgia actually lost 150,000 people between 2009 and 2010, and when the Census Bureau released its final intercensal tables (showing their population estimates of every state between 2000 and 2010), they estimated Georgia's actual population in 2009 was 9,620,846 (208,365 lower than the initial 2009 estimate released before the census).
What are the chances these estimates turn out to miss the mark by such high amounts?
New York probably will be lower than estimated, due to Covid/rich people filling out the census in the places they fled to.
Title: Re: Census population estimates 2011-2019
Post by: Clarko95 📚💰📈 on December 11, 2020, 12:15:16 PM
What are the chances these estimates turn out to miss the mark by such high amounts?
Not exactly answering your question, but I do know of two big Census estimate misses regarding Chicago:
The 2000 Census showed Chicago's population at 2.896 million, while in the run-up to the 2010 Census, estimates predicted a small decline to 2.853 million (so loss of just 43,000) people. When the actual numbers came out, it was...2.695 million, a loss of 201,000 people. I distinctly remember the media storm in Chicago-area media about this.
But it wasn't the first time they missed so badly regarding Chicago. In 1950, Chicago's population was 3.620 million, and in 1960, it was 3.550 million, a loss of just 70,000 people. Estimates between 1966 and 1969 predicted it would fall to close to 3.520 million, since they thought that the urban renewal projects would help stem some losses while the Great Migration Part II continued to bring in new residents, but the official numbers from the 1970 Census showed the population had dropped to 3.366 million, a loss of 184,000 people.
So I think these happen quite often, actually. I just know these two examples, however.
Title: Re: Census population estimates 2011-2019
Post by: Biden his time on December 11, 2020, 01:35:50 PM
Does anyone want to take any guesses as to what the biggest and most surprising differences will be between the 2019 Population Estimates (or the way things are headed based on those) and the 2020 Census Results? Such as perhaps a state with a far higher or lower population than projected in the several hundreds of thousands?
Like happened with Georgia between 2009 and 2010:
At the time of the 2000 Census (April 1, 2010), Georgia had a population of 8,186,453.
The U.S. Census Bureau projected that Georgia had a population of 9,829,211 on July 1, 2019.
The 2010 Census (April 1, 2010) showed that Georgia actually had a population of 9,687,653.
It isn't likely that Georgia actually lost 150,000 people between 2009 and 2010, and when the Census Bureau released its final intercensal tables (showing their population estimates of every state between 2000 and 2010), they estimated Georgia's actual population in 2009 was 9,620,846 (208,365 lower than the initial 2009 estimate released before the census).
What are the chances these estimates turn out to miss the mark by such high amounts?
Like happened with Georgia between 2009 and 2010:
At the time of the 2000 Census (April 1, 2010), Georgia had a population of 8,186,453.
The U.S. Census Bureau projected that Georgia had a population of 9,829,211 on July 1, 2019.
The 2010 Census (April 1, 2010) showed that Georgia actually had a population of 9,687,653.
It isn't likely that Georgia actually lost 150,000 people between 2009 and 2010, and when the Census Bureau released its final intercensal tables (showing their population estimates of every state between 2000 and 2010), they estimated Georgia's actual population in 2009 was 9,620,846 (208,365 lower than the initial 2009 estimate released before the census).
What are the chances these estimates turn out to miss the mark by such high amounts?
New York probably will be lower than estimated, due to Covid/rich people filling out the census in the places they fled to.
So our 29th congressional seat is a lock, eh? Maybe even 30th?
Title: Re: Census population estimates 2011-2019
Post by: Starry Eyed Jagaloon on December 11, 2020, 01:40:37 PM
Does anyone want to take any guesses as to what the biggest and most surprising differences will be between the 2019 Population Estimates (or the way things are headed based on those) and the 2020 Census Results? Such as perhaps a state with a far higher or lower population than projected in the several hundreds of thousands?
Like happened with Georgia between 2009 and 2010:
At the time of the 2000 Census (April 1, 2010), Georgia had a population of 8,186,453.
The U.S. Census Bureau projected that Georgia had a population of 9,829,211 on July 1, 2019.
The 2010 Census (April 1, 2010) showed that Georgia actually had a population of 9,687,653.
It isn't likely that Georgia actually lost 150,000 people between 2009 and 2010, and when the Census Bureau released its final intercensal tables (showing their population estimates of every state between 2000 and 2010), they estimated Georgia's actual population in 2009 was 9,620,846 (208,365 lower than the initial 2009 estimate released before the census).
What are the chances these estimates turn out to miss the mark by such high amounts?
Like happened with Georgia between 2009 and 2010:
At the time of the 2000 Census (April 1, 2010), Georgia had a population of 8,186,453.
The U.S. Census Bureau projected that Georgia had a population of 9,829,211 on July 1, 2019.
The 2010 Census (April 1, 2010) showed that Georgia actually had a population of 9,687,653.
It isn't likely that Georgia actually lost 150,000 people between 2009 and 2010, and when the Census Bureau released its final intercensal tables (showing their population estimates of every state between 2000 and 2010), they estimated Georgia's actual population in 2009 was 9,620,846 (208,365 lower than the initial 2009 estimate released before the census).
What are the chances these estimates turn out to miss the mark by such high amounts?
New York probably will be lower than estimated, due to Covid/rich people filling out the census in the places they fled to.
I think you a) overestimate how many people left the city and b) overestimate how many left the state as opposed to going upstate/to Long Island.
NY could lose 2 districts, but I doubt a massive share of the variance is covid-related.
Title: Re: Census population estimates 2011-2019
Post by: Sol on December 11, 2020, 01:44:55 PM
Does anyone want to take any guesses as to what the biggest and most surprising differences will be between the 2019 Population Estimates (or the way things are headed based on those) and the 2020 Census Results? Such as perhaps a state with a far higher or lower population than projected in the several hundreds of thousands?
Like happened with Georgia between 2009 and 2010:
At the time of the 2000 Census (April 1, 2010), Georgia had a population of 8,186,453.
The U.S. Census Bureau projected that Georgia had a population of 9,829,211 on July 1, 2019.
The 2010 Census (April 1, 2010) showed that Georgia actually had a population of 9,687,653.
It isn't likely that Georgia actually lost 150,000 people between 2009 and 2010, and when the Census Bureau released its final intercensal tables (showing their population estimates of every state between 2000 and 2010), they estimated Georgia's actual population in 2009 was 9,620,846 (208,365 lower than the initial 2009 estimate released before the census).
What are the chances these estimates turn out to miss the mark by such high amounts?
Like happened with Georgia between 2009 and 2010:
At the time of the 2000 Census (April 1, 2010), Georgia had a population of 8,186,453.
The U.S. Census Bureau projected that Georgia had a population of 9,829,211 on July 1, 2019.
The 2010 Census (April 1, 2010) showed that Georgia actually had a population of 9,687,653.
It isn't likely that Georgia actually lost 150,000 people between 2009 and 2010, and when the Census Bureau released its final intercensal tables (showing their population estimates of every state between 2000 and 2010), they estimated Georgia's actual population in 2009 was 9,620,846 (208,365 lower than the initial 2009 estimate released before the census).
What are the chances these estimates turn out to miss the mark by such high amounts?
New York probably will be lower than estimated, due to Covid/rich people filling out the census in the places they fled to.
I think you a) overestimate how many people left the city and b) overestimate how many left the state as opposed to going upstate/to Long Island.
NY could lose 2 districts, but I doubt a massive share of the variance is covid-related.
Well that was also meant to include people dying. :(
Title: Re: Census population estimates 2011-2019
Post by: ultraviolet on December 20, 2020, 09:29:55 PM
Remember at the beginning of the decade, NY was projected to hold on to all its districts for the first time since like 1940? Its honestly a little disheartening, all the slowing growth and whatnot
Also, muons predictions look accurate, thats what I think will happen too
Also, muons predictions look accurate, thats what I think will happen too
Title: Re: Census population estimates 2011-2019
Post by: Coastal Elitist on December 21, 2020, 01:08:55 PM
What does everyone think the latest estimate for California means:
Are these estimates usually accurate?
Are these estimates usually accurate?
Title: Re: Census population estimates 2011-2019
Post by: Tender Branson on December 21, 2020, 01:12:45 PM
What does everyone think the latest estimate for California means:
[tweet]
Are these estimates usually accurate?
[tweet]
Are these estimates usually accurate?
CA produces its own estimates 2x per year, by their Dept. of Finance.
They use different methods, for example drivers licenses, whereas the US Census Bureau uses tax data for migrations between the 50 states.
Historically, the US Census Bureau estimates were closer to the Census Count. Last time, the CA Dept. of Finance estimates were about 1.5 million too high.
This time, the estimates from the CB for CA and their own DOF estmimates are not that far apart though ...
Title: Re: Census population estimates 2011-2019
Post by: Mike Thick on December 22, 2020, 12:00:45 PM
Title: Re: Census population estimates 2011-2019
Post by: Tender Branson on December 22, 2020, 01:05:17 PM
Here are the full mid-2020 population estimates by state, released today:
329.5 million (+1.2 million vs. last year, +0.4%)
https://www2.census.gov/programs-surveys/popest/tables/2010-2020/state/totals/nst-est2020.xlsx
Based on those estimates, the April 1 Census count should come in at around 329.2 million.
329.5 million (+1.2 million vs. last year, +0.4%)
https://www2.census.gov/programs-surveys/popest/tables/2010-2020/state/totals/nst-est2020.xlsx
Based on those estimates, the April 1 Census count should come in at around 329.2 million.
Title: Re: Census population estimates 2011-2019
Post by: Skill and Chance on December 22, 2020, 02:32:42 PM
So New York takes a second loss instead of Alabama, and Florida's second gain is confirmed. Overall, Republicans did about as well as they possibly could have.
Title: Re: Census population estimates 2011-2019
Post by: muon2 on December 22, 2020, 02:39:26 PM
Normally the Census would be releasing the actual 2020 Census apportionment data next week, and not the Jul 1, 2020 estimates. Due to the expected delay in the release of the apportionment data, we can look at these estimates that do not include any 2020 Census data. It will be interesting to compare this to the actual Census population when they are released.
So, here's my annual projection from the new estimates. I used these July 2020 estimates and the April 2010 Census base to get an annual growth rate. This accounts for a 10 and a quarter year period between the 2010 Census and the estimate. I then applied the annual growth rate to the 2010 reapportionment population to get the 2020 projection. This accounts for the extra overseas population used in reapportionment but not for redistricting (It doesn't adjust for the new distinction between deployed vs stationed).
AZ +1
CA -1
CO +1
FL +2
IL -1
MI -1
MN -1
MT +1
NY -2
NC +1
OH -1
OR +1
PA -1
RI -1
TX +3
WV -1
AL and NY have switched seats compared to last year (https://talkelections.org/FORUM/index.php?topic=166668.msg7109615#msg7109615), so that AL would have no change and NY would lose 2 seats. I tested the possibility that inclusion of the Covid-19 fatalities in NY between April 1 and July 1 would affect the result. I added the July 1 NY fatality count to my April 1 projection, and it made NY closer to AL but did not change the overall projection.
The bubble seats in this projection are based on the last five awarded and the next five in line.
The last five awarded are IL-17, CA-52, FL-29, TX-39, and AL-7 (#435).
The next five in line are NY-26, OH-16, MN-8, CA-53, and VA-12.
Title: Re: Census population estimates 2011-2019
Post by: Skill and Chance on December 22, 2020, 02:40:53 PM
Normally the Census would be releasing the actual 2020 Census apportionment data next week, and not the Jul 1, 2020 estimates. Due to the expected delay in the release of the apportionment data, we can look at these estimates that do not include any 2020 Census data. It will be interesting to compare this to the actual Census population when they are released.
So, here's my annual projection from the new estimates. I used these July 2020 estimates and the April 2010 Census base to get an annual growth rate. This accounts for a 10 and a quarter year period between the 2010 Census and the estimate. I then applied the annual growth rate to the 2010 reapportionment population to get the 2020 projection. This accounts for the extra overseas population used in reapportionment but not for redistricting (It doesn't adjust for the new distinction between deployed vs stationed).
AZ +1
CA -1
CO +1
FL +2
IL -1
MI -1
MN -1
MT +1
NY -2
NC +1
OH -1
OR +1
PA -1
RI -1
TX +3
WV -1
AL and NY have switched seats compared to last year (https://talkelections.org/FORUM/index.php?topic=166668.msg7109615#msg7109615), so that AL would have no change and NY would lose 2 seats. I tested the possibility that inclusion of the Covid-19 fatalities in NY between April 1 and July 1 would affect the result. I added the July 1 NY fatality count to my April 1 projection, and it made NY closer to AL but did not change the overall projection.
The bubble seats in this projection are based on the last five awarded and the next five in line.
The last five awarded are IL-17, CA-52, FL-29, TX-39, and AL-7 (#435).
The next five in line are NY-26, OH-16, MN-8, CA-53, and VA-14.
Hmmm... so VA-12 could be back in the game for 2030? It's interesting how countercyclical VA is.
Title: Re: Census population estimates 2011-2019
Post by: Tender Branson on December 22, 2020, 03:49:13 PM
Normally the Census would be releasing the actual 2020 Census apportionment data next week, and not the Jul 1, 2020 estimates. Due to the expected delay in the release of the apportionment data, we can look at these estimates that do not include any 2020 Census data. It will be interesting to compare this to the actual Census population when they are released.
So, here's my annual projection from the new estimates. I used these July 2020 estimates and the April 2010 Census base to get an annual growth rate. This accounts for a 10 and a quarter year period between the 2010 Census and the estimate. I then applied the annual growth rate to the 2010 reapportionment population to get the 2020 projection. This accounts for the extra overseas population used in reapportionment but not for redistricting (It doesn't adjust for the new distinction between deployed vs stationed).
AZ +1
CA -1
CO +1
FL +2
IL -1
MI -1
MN -1
MT +1
NY -2
NC +1
OH -1
OR +1
PA -1
RI -1
TX +3
WV -1
AL and NY have switched seats compared to last year (https://talkelections.org/FORUM/index.php?topic=166668.msg7109615#msg7109615), so that AL would have no change and NY would lose 2 seats. I tested the possibility that inclusion of the Covid-19 fatalities in NY between April 1 and July 1 would affect the result. I added the July 1 NY fatality count to my April 1 projection, and it made NY closer to AL but did not change the overall projection.
The bubble seats in this projection are based on the last five awarded and the next five in line.
The last five awarded are IL-17, CA-52, FL-29, TX-39, and AL-7 (#435).
The next five in line are NY-26, OH-16, MN-8, CA-53, and VA-12.
Using your apportionment, Biden states would lose 5 EV, Trump states gain 5.
Biden would have won 301-237 (retroactively).
Title: Re: Census population estimates 2011-2019
Post by: Biden his time on December 22, 2020, 03:54:29 PM
This is also interesting because this is the first time California has ever lost population, having gone down by 69,532 people (between July 01, 2019 and July 01, 2020).
Title: Re: Census population estimates 2011-2019
Post by: Tender Branson on December 22, 2020, 03:57:18 PM
IL it seems had a higher population decline last year than WV, at -80.000, or -0.7%
WV was only at -0.5%
WV was only at -0.5%
Title: Re: Census population estimates 2011-2019
Post by: Biden his time on December 22, 2020, 04:12:38 PM
Texas, Florida, and Arizona all experienced accelerations in their population growth as well, interestingly.
Title: Re: Census population estimates 2011-2019
Post by: Torie on December 22, 2020, 04:47:05 PM
Normally the Census would be releasing the actual 2020 Census apportionment data next week, and not the Jul 1, 2020 estimates. Due to the expected delay in the release of the apportionment data, we can look at these estimates that do not include any 2020 Census data. It will be interesting to compare this to the actual Census population when they are released.
So, here's my annual projection from the new estimates. I used these July 2020 estimates and the April 2010 Census base to get an annual growth rate. This accounts for a 10 and a quarter year period between the 2010 Census and the estimate. I then applied the annual growth rate to the 2010 reapportionment population to get the 2020 projection. This accounts for the extra overseas population used in reapportionment but not for redistricting (It doesn't adjust for the new distinction between deployed vs stationed).
AZ +1
CA -1
CO +1
FL +2
IL -1
MI -1
MN -1
MT +1
NY -2
NC +1
OH -1
OR +1
PA -1
RI -1
TX +3
WV -1
AL and NY have switched seats compared to last year (https://talkelections.org/FORUM/index.php?topic=166668.msg7109615#msg7109615), so that AL would have no change and NY would lose 2 seats. I tested the possibility that inclusion of the Covid-19 fatalities in NY between April 1 and July 1 would affect the result. I added the July 1 NY fatality count to my April 1 projection, and it made NY closer to AL but did not change the overall projection.
The bubble seats in this projection are based on the last five awarded and the next five in line.
The last five awarded are IL-17, CA-52, FL-29, TX-39, and AL-7 (#435).
The next five in line are NY-26, OH-16, MN-8, CA-53, and VA-12.
So, here's my annual projection from the new estimates. I used these July 2020 estimates and the April 2010 Census base to get an annual growth rate. This accounts for a 10 and a quarter year period between the 2010 Census and the estimate. I then applied the annual growth rate to the 2010 reapportionment population to get the 2020 projection. This accounts for the extra overseas population used in reapportionment but not for redistricting (It doesn't adjust for the new distinction between deployed vs stationed).
AZ +1
CA -1
CO +1
FL +2
IL -1
MI -1
MN -1
MT +1
NY -2
NC +1
OH -1
OR +1
PA -1
RI -1
TX +3
WV -1
AL and NY have switched seats compared to last year (https://talkelections.org/FORUM/index.php?topic=166668.msg7109615#msg7109615), so that AL would have no change and NY would lose 2 seats. I tested the possibility that inclusion of the Covid-19 fatalities in NY between April 1 and July 1 would affect the result. I added the July 1 NY fatality count to my April 1 projection, and it made NY closer to AL but did not change the overall projection.
The bubble seats in this projection are based on the last five awarded and the next five in line.
The last five awarded are IL-17, CA-52, FL-29, TX-39, and AL-7 (#435).
The next five in line are NY-26, OH-16, MN-8, CA-53, and VA-12.
What numbers are we talking about for AL and NY to switch back with this estimate vis a vis the actual census figures? Is it 5,000 people or 15,000 people? Yes I know the final numbers for all the states matter.
Title: Re: Census population estimates 2011-2019
Post by: muon2 on December 22, 2020, 05:17:17 PM
Normally the Census would be releasing the actual 2020 Census apportionment data next week, and not the Jul 1, 2020 estimates. Due to the expected delay in the release of the apportionment data, we can look at these estimates that do not include any 2020 Census data. It will be interesting to compare this to the actual Census population when they are released.
So, here's my annual projection from the new estimates. I used these July 2020 estimates and the April 2010 Census base to get an annual growth rate. This accounts for a 10 and a quarter year period between the 2010 Census and the estimate. I then applied the annual growth rate to the 2010 reapportionment population to get the 2020 projection. This accounts for the extra overseas population used in reapportionment but not for redistricting (It doesn't adjust for the new distinction between deployed vs stationed).
AZ +1
CA -1
CO +1
FL +2
IL -1
MI -1
MN -1
MT +1
NY -2
NC +1
OH -1
OR +1
PA -1
RI -1
TX +3
WV -1
AL and NY have switched seats compared to last year (https://talkelections.org/FORUM/index.php?topic=166668.msg7109615#msg7109615), so that AL would have no change and NY would lose 2 seats. I tested the possibility that inclusion of the Covid-19 fatalities in NY between April 1 and July 1 would affect the result. I added the July 1 NY fatality count to my April 1 projection, and it made NY closer to AL but did not change the overall projection.
The bubble seats in this projection are based on the last five awarded and the next five in line.
The last five awarded are IL-17, CA-52, FL-29, TX-39, and AL-7 (#435).
The next five in line are NY-26, OH-16, MN-8, CA-53, and VA-12.
So, here's my annual projection from the new estimates. I used these July 2020 estimates and the April 2010 Census base to get an annual growth rate. This accounts for a 10 and a quarter year period between the 2010 Census and the estimate. I then applied the annual growth rate to the 2010 reapportionment population to get the 2020 projection. This accounts for the extra overseas population used in reapportionment but not for redistricting (It doesn't adjust for the new distinction between deployed vs stationed).
AZ +1
CA -1
CO +1
FL +2
IL -1
MI -1
MN -1
MT +1
NY -2
NC +1
OH -1
OR +1
PA -1
RI -1
TX +3
WV -1
AL and NY have switched seats compared to last year (https://talkelections.org/FORUM/index.php?topic=166668.msg7109615#msg7109615), so that AL would have no change and NY would lose 2 seats. I tested the possibility that inclusion of the Covid-19 fatalities in NY between April 1 and July 1 would affect the result. I added the July 1 NY fatality count to my April 1 projection, and it made NY closer to AL but did not change the overall projection.
The bubble seats in this projection are based on the last five awarded and the next five in line.
The last five awarded are IL-17, CA-52, FL-29, TX-39, and AL-7 (#435).
The next five in line are NY-26, OH-16, MN-8, CA-53, and VA-12.
What numbers are we talking about for AL and NY to switch back with this estimate vis a vis the actual census figures? Is it 5,000 people or 15,000 people? Yes I know the final numbers for all the states matter.
On the NY side I added 32K to see what the effect of the pandemic would be on these July estimates. It cut the margin with AL in half, so another 32K would get it ahead on April 1. On the AL side if they have 8K fewer, assuming the 32K added to NY for covid then NY would get seat 435. These projections assume the same relative overseas military populations. In 2010 that adjustment was 23K for AL and 43K for NY. Census 2020 is changing this so that the adjustment I described would apply to those stationed outside the US, but those deployed outside the US while stationed in the US will count at their station address. I don't know how that split is for different states.
Title: Re: Census population estimates 2011-2019
Post by: Biden his time on December 22, 2020, 05:19:53 PM
On a side note, one rank change did occur. Idaho's population surpassed West Virginia's.
Title: Re: Census population estimates 2011-2019
Post by: Brittain33 on December 22, 2020, 06:20:22 PM
Do we really believe North Dakota's population hasn't declined at all since its surge?
Title: Re: Census population estimates 2011-2019
Post by: muon2 on December 22, 2020, 07:10:34 PM
Do we really believe North Dakota's population hasn't declined at all since its surge?
Since 2015 its average growth rate is less than 0.3%/year. That's much slower than SD and less than other plains states other than KS (0.2%/year this decade).
Title: Re: Census population estimates 2011-2019
Post by: jimrtex on December 22, 2020, 08:03:28 PM
Normally the Census would be releasing the actual 2020 Census apportionment data next week, and not the Jul 1, 2020 estimates. Due to the expected delay in the release of the apportionment data, we can look at these estimates that do not include any 2020 Census data. It will be interesting to compare this to the actual Census population when they are released.
So, here's my annual projection from the new estimates. I used these July 2020 estimates and the April 2010 Census base to get an annual growth rate. This accounts for a 10 and a quarter year period between the 2010 Census and the estimate. I then applied the annual growth rate to the 2010 reapportionment population to get the 2020 projection. This accounts for the extra overseas population used in reapportionment but not for redistricting (It doesn't adjust for the new distinction between deployed vs stationed).
AZ +1
CA -1
CO +1
FL +2
IL -1
MI -1
MN -1
MT +1
NY -2
NC +1
OH -1
OR +1
PA -1
RI -1
TX +3
WV -1
AL and NY have switched seats compared to last year (https://talkelections.org/FORUM/index.php?topic=166668.msg7109615#msg7109615), so that AL would have no change and NY would lose 2 seats. I tested the possibility that inclusion of the Covid-19 fatalities in NY between April 1 and July 1 would affect the result. I added the July 1 NY fatality count to my April 1 projection, and it made NY closer to AL but did not change the overall projection.
The bubble seats in this projection are based on the last five awarded and the next five in line.
The last five awarded are IL-17, CA-52, FL-29, TX-39, and AL-7 (#435).
The next five in line are NY-26, OH-16, MN-8, CA-53, and VA-12.
So, here's my annual projection from the new estimates. I used these July 2020 estimates and the April 2010 Census base to get an annual growth rate. This accounts for a 10 and a quarter year period between the 2010 Census and the estimate. I then applied the annual growth rate to the 2010 reapportionment population to get the 2020 projection. This accounts for the extra overseas population used in reapportionment but not for redistricting (It doesn't adjust for the new distinction between deployed vs stationed).
AZ +1
CA -1
CO +1
FL +2
IL -1
MI -1
MN -1
MT +1
NY -2
NC +1
OH -1
OR +1
PA -1
RI -1
TX +3
WV -1
AL and NY have switched seats compared to last year (https://talkelections.org/FORUM/index.php?topic=166668.msg7109615#msg7109615), so that AL would have no change and NY would lose 2 seats. I tested the possibility that inclusion of the Covid-19 fatalities in NY between April 1 and July 1 would affect the result. I added the July 1 NY fatality count to my April 1 projection, and it made NY closer to AL but did not change the overall projection.
The bubble seats in this projection are based on the last five awarded and the next five in line.
The last five awarded are IL-17, CA-52, FL-29, TX-39, and AL-7 (#435).
The next five in line are NY-26, OH-16, MN-8, CA-53, and VA-12.
The number stationed overseas is now under 200,000. Most are in areas where dependents can be resident (Europe, Japan, Korea). The share of dependents is likely about the same, with long-term trend towards career military (old enough to have acquired dependents), but perhaps balanced by long-term decline in marriages and child-bearing.
I think I will just use 3/4 of the change from 2019 to 2020 for my April 1, 2020 estimate.
What would you use for 2030 projections? I'm thinking perhaps getting a growth rate from 2015 to 2020.
Title: Re: Census population estimates 2011-2019
Post by: Skill and Chance on December 22, 2020, 08:04:30 PM
On a side note, one rank change did occur. Idaho's population surpassed West Virginia's.
ID-03 here we come in 2031? They have a commission so an all-Boise seat is basically assured.
Title: Re: Census population estimates 2011-2019
Post by: muon2 on December 22, 2020, 08:16:17 PM
I think the federal overseas population will be about half of what it was in 2010, even without the distinction between deployed and stationed. In 2010, 96% of the federal overseas population was military, with about 60% of that dependents.
The number stationed overseas is now under 200,000. Most are in areas where dependents can be resident (Europe, Japan, Korea). The share of dependents is likely about the same, with long-term trend towards career military (old enough to have acquired dependents), but perhaps balanced by long-term decline in marriages and child-bearing.
I think I will just use 3/4 of the change from 2019 to 2020 for my April 1, 2020 estimate.
What would you use for 2030 projections? I'm thinking perhaps getting a growth rate from 2015 to 2020.
Extending the recent growth rate is one approach. However, I suspect that there will be long-term sociological changes due to the pandemic. The rapid shift to remote work won't all go back to pre-2020 levels. That will likely change where people choose to live in ways that are not captured by rates in the last decade. I think it may take 5 years to clearly see any new trends that will cause shifts to the 2030 forecasts.
Title: Re: Census population estimates 2011-2019
Post by: Torie on December 22, 2020, 09:18:10 PM
Thank you for your skilled number crunching Muon2.
Title: Re: Census population estimates 2011-2019
Post by: Annatar on December 22, 2020, 11:52:47 PM
Population decline in New York and Illinois is now approaching levels you see in Eastern Europe, both states lost over 0.6% of their population in 2019-20, kind of amazing NY once had 45 districts and now will have 25 after 2020, just a complete collapse in the post ww2 era.
Title: Re: Census population estimates 2011-2019
Post by: Biden his time on December 23, 2020, 10:19:11 AM
Do you all think Minnesota has a good chance to regain the seat it lost in 2020 at the time of the 2030 census?
Title: Re: Census population estimates 2011-2019
Post by: muon2 on December 23, 2020, 11:27:02 AM
Do you all think Minnesota has a good chance to regain the seat it lost in 2020 at the time of the 2030 census?
MN has had a growth rate very close to the nation as a whole this decade. It was on the bubble in 2010 and it still on the bubble in 2020. If MN loses its 8th seat this cycle and continues to match or slightly exceed the national growth rate, they will stay on the bubble for an 8th seat in 2030.
Title: Re: Census population estimates 2011-2019
Post by: Suburbia on December 23, 2020, 01:00:28 PM
New York is losing population, but it is still the place for a lot of people.
NY has the lowest homeownership rate in the country, home prices should be lower, but NY is a hard place to buy a home, especially NYC/LI/Westchester suburbs.
Upstate NY, not so bad---
Some people say that NYers are moving to red states like GA, NC, and bringing their liberal politics with them.
We will see.
https://www.usatoday.com/story/news/politics/2020/12/23/new-york-population-decline-coronavirus-house-seats/4023477001/
Title: Re: Census population estimates 2011-2019
Post by: Skill and Chance on December 23, 2020, 01:08:07 PM
Population decline in New York and Illinois is now approaching levels you see in Eastern Europe, both states lost over 0.6% of their population in 2019-20, kind of amazing NY once had 45 districts and now will have 25 after 2020, just a complete collapse in the post ww2 era.
How does it compare to the exodus from the Great Plains states during the 1930's and 40's?
Title: Re: Census population estimates 2011-2019
Post by: Starry Eyed Jagaloon on December 23, 2020, 01:11:51 PM
Do you all think Minnesota has a good chance to regain the seat it lost in 2020 at the time of the 2030 census?
Yes and I also think it'll pass Wisconsin in population so MN will gain back an 8th seat even as WI loses one.
Title: Re: Census population estimates 2011-2019
Post by: Skill and Chance on December 23, 2020, 01:14:47 PM
Do you all think Minnesota has a good chance to regain the seat it lost in 2020 at the time of the 2030 census?
Yes and I also think it'll pass Wisconsin in population so MN will gain back an 8th seat even as WI loses one.
Which states are in most danger of losing seats in 2031 if current growth/loss continues?
Title: Re: Census population estimates 2011-2019
Post by: Starry Eyed Jagaloon on December 23, 2020, 01:20:23 PM
Do you all think Minnesota has a good chance to regain the seat it lost in 2020 at the time of the 2030 census?
Yes and I also think it'll pass Wisconsin in population so MN will gain back an 8th seat even as WI loses one.
Which states are in most danger of losing seats in 2031 if current growth/loss continues?
New York, Illinois, Pennsylvania, Ohio, Michigan, New Jersey, Wisconsin, Connecticut, maybe California.
Title: Re: Census population estimates 2011-2019
Post by: DINGO Joe on December 23, 2020, 01:39:00 PM
If it hasn't been noted yet, it should be noted that the estimates don't incorporate any data from the Census done this year. It merely utilizes the same tools it has all decade.
Having said that, the slow down in natural population growth can easily be viewed by the CDC/NCHS monthly provisional numbers for births-deaths(which I'm sure is used by the Census for estimates)
https://www.cdc.gov/nchs/nvss/vsrr/provisional-tables.htm
Of course the first wave of COVID becomes quite noticeable in the APR-JUN months especially in the Ground Zero states.
Quite a few states will go natural growth negative this year, I guess the most surprising being Florida (which probably would have done it without the COVID or else they're way understating their COVID deaths). They really are quite dependent on importing old people.
Looks like Louisiana and Mississippi are poised for multi-year declines in population with Alabama a couple of steps behind.
Title: Re: Census population estimates 2011-2019
Post by: Biden his time on December 23, 2020, 03:25:47 PM
Do you all think Minnesota has a good chance to regain the seat it lost in 2020 at the time of the 2030 census?
Yes and I also think it'll pass Wisconsin in population so MN will gain back an 8th seat even as WI loses one.
Which states are in most danger of losing seats in 2031 if current growth/loss continues?
New York, Illinois, Pennsylvania, Ohio, Michigan, New Jersey, Wisconsin, Connecticut, maybe California.
and a little bit of Alabama too.
Title: Re: Census population estimates 2011-2019
Post by: Obama-Biden Democrat on December 23, 2020, 10:30:16 PM
New York is losing population, but it is still the place for a lot of people.
NY has the lowest homeownership rate in the country, home prices should be lower, but NY is a hard place to buy a home, especially NYC/LI/Westchester suburbs.
Upstate NY, not so bad---
Some people say that NYers are moving to red states like GA, NC, and bringing their liberal politics with them.
We will see.
https://www.usatoday.com/story/news/politics/2020/12/23/new-york-population-decline-coronavirus-house-seats/4023477001/
NY has the lowest homeownership rate in the country, home prices should be lower, but NY is a hard place to buy a home, especially NYC/LI/Westchester suburbs.
Upstate NY, not so bad---
Some people say that NYers are moving to red states like GA, NC, and bringing their liberal politics with them.
We will see.
https://www.usatoday.com/story/news/politics/2020/12/23/new-york-population-decline-coronavirus-house-seats/4023477001/
People from NJ/NY have been moving in large numbers to FL for decades, yet FL is trending right. There always huge amounts of Yankees fans at any FL baseball game.
Title: Re: Census population estimates 2011-2019
Post by: Suburbia on December 23, 2020, 10:45:00 PM
New York is losing population, but it is still the place for a lot of people.
NY has the lowest homeownership rate in the country, home prices should be lower, but NY is a hard place to buy a home, especially NYC/LI/Westchester suburbs.
Upstate NY, not so bad---
Some people say that NYers are moving to red states like GA, NC, and bringing their liberal politics with them.
We will see.
https://www.usatoday.com/story/news/politics/2020/12/23/new-york-population-decline-coronavirus-house-seats/4023477001/
NY has the lowest homeownership rate in the country, home prices should be lower, but NY is a hard place to buy a home, especially NYC/LI/Westchester suburbs.
Upstate NY, not so bad---
Some people say that NYers are moving to red states like GA, NC, and bringing their liberal politics with them.
We will see.
https://www.usatoday.com/story/news/politics/2020/12/23/new-york-population-decline-coronavirus-house-seats/4023477001/
People from NJ/NY have been moving in large numbers to FL for decades, yet FL is trending right. There always huge amounts of Yankees fans at any FL baseball game.
Yes, they are George Steinbrenner leftovers. In Florida, the Rays and Marlins are not even popular. Yankees, Mets, Cardinals are all popular because those are the fans from the NY/NJ/MO area
Title: Re: Census population estimates 2011-2019
Post by: Tender Branson on December 24, 2020, 12:53:58 AM
It looks like 3.7 million births this year in the US and 3.2 to 3.3 million deaths.
Birth rate: 1.1%
Death rate: 0.95 to 1%
That would be the lowest birth rate and the highest death rate on record, but still a natural balance of +400.000 to +500.000, but down from about 1 million in recent years and down from +1.5 million in the mid-90s to mid-00s.
Birth rate: 1.1%
Death rate: 0.95 to 1%
That would be the lowest birth rate and the highest death rate on record, but still a natural balance of +400.000 to +500.000, but down from about 1 million in recent years and down from +1.5 million in the mid-90s to mid-00s.
Title: Re: Census population estimates 2011-2019
Post by: Tender Branson on December 26, 2020, 03:13:04 AM
The 10 fastest growing states between mid-2019 and mid-2020 were:
2.1% ID
1.8% AZ
1.5% NV
1.5% UT
1.3% TX
1.2% SC
1.1% FL
1.1% WA
1.0% DE
1.0% MT
The 10 fastest declining states between mid-2019 and mid-2020 were:
-0.2% CA
-0.2% MI
-0.3% CT
-0.3% LA
-0.3% AK
-0.4% MS
-0.6% WV
-0.6% HI
-0.6% IL
-0.7% NY
https://www.census.gov/newsroom/press-releases/2020/estimates-population-housing-units.html
Maybe a result of wealthy NYers and preppers moving to ID and MT because they think the apocalypse is coming ?
Title: Re: Census population estimates 2011-2019
Post by: Skill and Chance on December 29, 2020, 01:10:20 PM
The 10 fastest growing states between mid-2019 and mid-2020 were:
2.1% ID
1.8% AZ
1.5% NV
1.5% UT
1.3% TX
1.2% SC
1.1% FL
1.1% WA
1.0% DE
1.0% MT
The 10 fastest declining states between mid-2019 and mid-2020 were:
-0.2% CA
-0.2% MI
-0.3% CT
-0.3% LA
-0.3% AK
-0.4% MS
-0.6% WV
-0.6% HI
-0.6% IL
-0.7% NY
https://www.census.gov/newsroom/press-releases/2020/estimates-population-housing-units.html
Maybe a result of wealthy NYers and preppers moving to ID and MT because they think the apocalypse is coming ?
2.1% ID
1.8% AZ
1.5% NV
1.5% UT
1.3% TX
1.2% SC
1.1% FL
1.1% WA
1.0% DE
1.0% MT
The 10 fastest declining states between mid-2019 and mid-2020 were:
-0.2% CA
-0.2% MI
-0.3% CT
-0.3% LA
-0.3% AK
-0.4% MS
-0.6% WV
-0.6% HI
-0.6% IL
-0.7% NY
https://www.census.gov/newsroom/press-releases/2020/estimates-population-housing-units.html
Maybe a result of wealthy NYers and preppers moving to ID and MT because they think the apocalypse is coming ?
The biggest decliners include some states that have been stable in congressional apportionment for a while. How close are MS, HI, and CT to losing a CD?
Title: Re: Census population estimates 2011-2019
Post by: Skill and Chance on December 29, 2020, 01:11:44 PM
Normally the Census would be releasing the actual 2020 Census apportionment data next week, and not the Jul 1, 2020 estimates. Due to the expected delay in the release of the apportionment data, we can look at these estimates that do not include any 2020 Census data. It will be interesting to compare this to the actual Census population when they are released.
So, here's my annual projection from the new estimates. I used these July 2020 estimates and the April 2010 Census base to get an annual growth rate. This accounts for a 10 and a quarter year period between the 2010 Census and the estimate. I then applied the annual growth rate to the 2010 reapportionment population to get the 2020 projection. This accounts for the extra overseas population used in reapportionment but not for redistricting (It doesn't adjust for the new distinction between deployed vs stationed).
AZ +1
CA -1
CO +1
FL +2
IL -1
MI -1
MN -1
MT +1
NY -2
NC +1
OH -1
OR +1
PA -1
RI -1
TX +3
WV -1
AL and NY have switched seats compared to last year (https://talkelections.org/FORUM/index.php?topic=166668.msg7109615#msg7109615), so that AL would have no change and NY would lose 2 seats. I tested the possibility that inclusion of the Covid-19 fatalities in NY between April 1 and July 1 would affect the result. I added the July 1 NY fatality count to my April 1 projection, and it made NY closer to AL but did not change the overall projection.
The bubble seats in this projection are based on the last five awarded and the next five in line.
The last five awarded are IL-17, CA-52, FL-29, TX-39, and AL-7 (#435).
The next five in line are NY-26, OH-16, MN-8, CA-53, and VA-12.
So, here's my annual projection from the new estimates. I used these July 2020 estimates and the April 2010 Census base to get an annual growth rate. This accounts for a 10 and a quarter year period between the 2010 Census and the estimate. I then applied the annual growth rate to the 2010 reapportionment population to get the 2020 projection. This accounts for the extra overseas population used in reapportionment but not for redistricting (It doesn't adjust for the new distinction between deployed vs stationed).
AZ +1
CA -1
CO +1
FL +2
IL -1
MI -1
MN -1
MT +1
NY -2
NC +1
OH -1
OR +1
PA -1
RI -1
TX +3
WV -1
AL and NY have switched seats compared to last year (https://talkelections.org/FORUM/index.php?topic=166668.msg7109615#msg7109615), so that AL would have no change and NY would lose 2 seats. I tested the possibility that inclusion of the Covid-19 fatalities in NY between April 1 and July 1 would affect the result. I added the July 1 NY fatality count to my April 1 projection, and it made NY closer to AL but did not change the overall projection.
The bubble seats in this projection are based on the last five awarded and the next five in line.
The last five awarded are IL-17, CA-52, FL-29, TX-39, and AL-7 (#435).
The next five in line are NY-26, OH-16, MN-8, CA-53, and VA-12.
What numbers are we talking about for AL and NY to switch back with this estimate vis a vis the actual census figures? Is it 5,000 people or 15,000 people? Yes I know the final numbers for all the states matter.
On the NY side I added 32K to see what the effect of the pandemic would be on these July estimates. It cut the margin with AL in half, so another 32K would get it ahead on April 1. On the AL side if they have 8K fewer, assuming the 32K added to NY for covid then NY would get seat 435. These projections assume the same relative overseas military populations. In 2010 that adjustment was 23K for AL and 43K for NY. Census 2020 is changing this so that the adjustment I described would apply to those stationed outside the US, but those deployed outside the US while stationed in the US will count at their station address. I don't know how that split is for different states.
Also, how much of a sure thing is TX-39 with the higher than usual uncertainty this year?
Title: Re: Census population estimates 2011-2019
Post by: muon2 on December 30, 2020, 03:32:53 PM
Normally the Census would be releasing the actual 2020 Census apportionment data next week, and not the Jul 1, 2020 estimates. Due to the expected delay in the release of the apportionment data, we can look at these estimates that do not include any 2020 Census data. It will be interesting to compare this to the actual Census population when they are released.
So, here's my annual projection from the new estimates. I used these July 2020 estimates and the April 2010 Census base to get an annual growth rate. This accounts for a 10 and a quarter year period between the 2010 Census and the estimate. I then applied the annual growth rate to the 2010 reapportionment population to get the 2020 projection. This accounts for the extra overseas population used in reapportionment but not for redistricting (It doesn't adjust for the new distinction between deployed vs stationed).
AZ +1
CA -1
CO +1
FL +2
IL -1
MI -1
MN -1
MT +1
NY -2
NC +1
OH -1
OR +1
PA -1
RI -1
TX +3
WV -1
AL and NY have switched seats compared to last year (https://talkelections.org/FORUM/index.php?topic=166668.msg7109615#msg7109615), so that AL would have no change and NY would lose 2 seats. I tested the possibility that inclusion of the Covid-19 fatalities in NY between April 1 and July 1 would affect the result. I added the July 1 NY fatality count to my April 1 projection, and it made NY closer to AL but did not change the overall projection.
The bubble seats in this projection are based on the last five awarded and the next five in line.
The last five awarded are IL-17, CA-52, FL-29, TX-39, and AL-7 (#435).
The next five in line are NY-26, OH-16, MN-8, CA-53, and VA-12.
So, here's my annual projection from the new estimates. I used these July 2020 estimates and the April 2010 Census base to get an annual growth rate. This accounts for a 10 and a quarter year period between the 2010 Census and the estimate. I then applied the annual growth rate to the 2010 reapportionment population to get the 2020 projection. This accounts for the extra overseas population used in reapportionment but not for redistricting (It doesn't adjust for the new distinction between deployed vs stationed).
AZ +1
CA -1
CO +1
FL +2
IL -1
MI -1
MN -1
MT +1
NY -2
NC +1
OH -1
OR +1
PA -1
RI -1
TX +3
WV -1
AL and NY have switched seats compared to last year (https://talkelections.org/FORUM/index.php?topic=166668.msg7109615#msg7109615), so that AL would have no change and NY would lose 2 seats. I tested the possibility that inclusion of the Covid-19 fatalities in NY between April 1 and July 1 would affect the result. I added the July 1 NY fatality count to my April 1 projection, and it made NY closer to AL but did not change the overall projection.
The bubble seats in this projection are based on the last five awarded and the next five in line.
The last five awarded are IL-17, CA-52, FL-29, TX-39, and AL-7 (#435).
The next five in line are NY-26, OH-16, MN-8, CA-53, and VA-12.
What numbers are we talking about for AL and NY to switch back with this estimate vis a vis the actual census figures? Is it 5,000 people or 15,000 people? Yes I know the final numbers for all the states matter.
On the NY side I added 32K to see what the effect of the pandemic would be on these July estimates. It cut the margin with AL in half, so another 32K would get it ahead on April 1. On the AL side if they have 8K fewer, assuming the 32K added to NY for covid then NY would get seat 435. These projections assume the same relative overseas military populations. In 2010 that adjustment was 23K for AL and 43K for NY. Census 2020 is changing this so that the adjustment I described would apply to those stationed outside the US, but those deployed outside the US while stationed in the US will count at their station address. I don't know how that split is for different states.
Also, how much of a sure thing is TX-39 with the higher than usual uncertainty this year?
It's seat number 434 in this projection of mine. There are a lot of hard to count populations in TX and this was a tough year for counting in states that did not put in extra resources. It's not hard to imagine that undercounts of the Latino population result in TX missing out on its third additional seat.
Title: Re: Census population estimates 2011-2019
Post by: Tender Branson on December 31, 2020, 01:25:37 AM
Fresh 2020 Census Count numbers would be out today, by law, usually.
But not this year.
The Bureau said yesterday that the deadline will not be met and while not mentioning a date of release, the new numbers will likely be out between February and April.
But not this year.
The Bureau said yesterday that the deadline will not be met and while not mentioning a date of release, the new numbers will likely be out between February and April.
Title: Re: Census population estimates 2011-2019
Post by: Non Swing Voter on January 04, 2021, 02:20:01 AM
if the new numbers aren't out til February or later then doesn't that mean Trump's little scheme to steal congressional apportionment based on citizenship is screwed? presumably then Biden could make the decision whether or not to include non-citizens as it's been done in the past.
Title: Re: Census population estimates 2011-2019
Post by: StateBoiler on January 04, 2021, 12:54:02 PM
Fresh 2020 Census Count numbers would be out today, by law, usually.
But not this year.
The Bureau said yesterday that the deadline will not be met and while not mentioning a date of release, the new numbers will likely be out between February and April.
But not this year.
The Bureau said yesterday that the deadline will not be met and while not mentioning a date of release, the new numbers will likely be out between February and April.
Just talking for my state, there's a big problem with that.
State legislature shuts up shop for business in April, meaning if the Census doesn't release data until April, you'd have to wait until the 2022 session for the legislature to pass a bill with the new districts for federal and state. But people are required to file for primaries in January and February.
Title: Re: Census population estimates 2011-2019
Post by: MaxQue on January 04, 2021, 12:56:41 PM
Fresh 2020 Census Count numbers would be out today, by law, usually.
But not this year.
The Bureau said yesterday that the deadline will not be met and while not mentioning a date of release, the new numbers will likely be out between February and April.
But not this year.
The Bureau said yesterday that the deadline will not be met and while not mentioning a date of release, the new numbers will likely be out between February and April.
Just talking for my state, there's a big problem with that.
State legislature shuts up shop for business in April, meaning if the Census doesn't release data until April, you'd have to wait until the 2022 session for the legislature to pass a bill with the new districts for federal and state. But people are required to file for primaries in January and February.
Well, the issue there is a sloppily written law and/or constitution with no flexibility.
Title: Re: Census population estimates 2011-2019
Post by: Tender Branson on January 04, 2021, 01:06:00 PM
Fresh 2020 Census Count numbers would be out today, by law, usually.
But not this year.
The Bureau said yesterday that the deadline will not be met and while not mentioning a date of release, the new numbers will likely be out between February and April.
But not this year.
The Bureau said yesterday that the deadline will not be met and while not mentioning a date of release, the new numbers will likely be out between February and April.
Just talking for my state, there's a big problem with that.
State legislature shuts up shop for business in April, meaning if the Census doesn't release data until April, you'd have to wait until the 2022 session for the legislature to pass a bill with the new districts for federal and state. But people are required to file for primaries in January and February.
Thats really not the Census Bureaus problem .... (They had enough on their own).
Its Indianas problem.
IN and its legislature could also work in September, right ? Other people have to work the whole year as well and not stop in April.
Title: Re: Census population estimates 2011-2019
Post by: jimrtex on January 04, 2021, 02:04:39 PM
if the new numbers aren't out til February or later then doesn't that mean Trump's little scheme to steal congressional apportionment based on citizenship is screwed? presumably then Biden could make the decision whether or not to include non-citizens as it's been done in the past.
(1) Persons in ICE detention facilities.
(2) Persons in final deportation orders.
(3) DACA enrollees.
I suspect that they may end up with those in ICE detention facilities that might cost Texas its 39th representative.
Title: Re: Census population estimates 2011-2019
Post by: StateBoiler on January 04, 2021, 02:07:28 PM
Fresh 2020 Census Count numbers would be out today, by law, usually.
But not this year.
The Bureau said yesterday that the deadline will not be met and while not mentioning a date of release, the new numbers will likely be out between February and April.
But not this year.
The Bureau said yesterday that the deadline will not be met and while not mentioning a date of release, the new numbers will likely be out between February and April.
Just talking for my state, there's a big problem with that.
State legislature shuts up shop for business in April, meaning if the Census doesn't release data until April, you'd have to wait until the 2022 session for the legislature to pass a bill with the new districts for federal and state. But people are required to file for primaries in January and February.
Thats really not the Census Bureaus problem .... (They had enough on their own).
Its Indianas problem.
IN and its legislature could also work in September, right ? Other people have to work the whole year as well and not stop in April.
Well how it always worked in the past is the Census was released on time and they released new districts in a year that ends in 1, all complete by April.
They could have a special session later in the year to do it, but that means the state has to spend extra money not previously earmarked because the federal government bureaucrats can't meet a date of release. It's okay, we can just send the Census Bureau a bill for the costs, right?
Title: Re: Census population estimates 2011-2019
Post by: MaxQue on January 04, 2021, 02:41:20 PM
Fresh 2020 Census Count numbers would be out today, by law, usually.
But not this year.
The Bureau said yesterday that the deadline will not be met and while not mentioning a date of release, the new numbers will likely be out between February and April.
But not this year.
The Bureau said yesterday that the deadline will not be met and while not mentioning a date of release, the new numbers will likely be out between February and April.
Just talking for my state, there's a big problem with that.
State legislature shuts up shop for business in April, meaning if the Census doesn't release data until April, you'd have to wait until the 2022 session for the legislature to pass a bill with the new districts for federal and state. But people are required to file for primaries in January and February.
Thats really not the Census Bureaus problem .... (They had enough on their own).
Its Indianas problem.
IN and its legislature could also work in September, right ? Other people have to work the whole year as well and not stop in April.
Well how it always worked in the past is the Census was released on time and they released new districts in a year that ends in 1, all complete by April.
They could have a special session later in the year to do it, but that means the state has to spend extra money not previously earmarked because the federal government bureaucrats can't meet a date of release. It's okay, we can just send the Census Bureau a bill for the costs, right?
Will you send the bill to Chinese government for any extra sittings caused by COVID in 2020?
Title: Re: Census population estimates 2011-2019
Post by: Sol on January 04, 2021, 03:09:03 PM
Fresh 2020 Census Count numbers would be out today, by law, usually.
But not this year.
The Bureau said yesterday that the deadline will not be met and while not mentioning a date of release, the new numbers will likely be out between February and April.
But not this year.
The Bureau said yesterday that the deadline will not be met and while not mentioning a date of release, the new numbers will likely be out between February and April.
Just talking for my state, there's a big problem with that.
State legislature shuts up shop for business in April, meaning if the Census doesn't release data until April, you'd have to wait until the 2022 session for the legislature to pass a bill with the new districts for federal and state. But people are required to file for primaries in January and February.
Thats really not the Census Bureaus problem .... (They had enough on their own).
Its Indianas problem.
IN and its legislature could also work in September, right ? Other people have to work the whole year as well and not stop in April.
Well how it always worked in the past is the Census was released on time and they released new districts in a year that ends in 1, all complete by April.
They could have a special session later in the year to do it, but that means the state has to spend extra money not previously earmarked because the federal government bureaucrats can't meet a date of release. It's okay, we can just send the Census Bureau a bill for the costs, right?
What was the census bureau supposed to do? Do a rushed job and give the states messed up census data?
Title: Re: Census population estimates 2011-2019
Post by: jimrtex on January 04, 2021, 08:33:20 PM
Fresh 2020 Census Count numbers would be out today, by law, usually.
But not this year.
The Bureau said yesterday that the deadline will not be met and while not mentioning a date of release, the new numbers will likely be out between February and April.
But not this year.
The Bureau said yesterday that the deadline will not be met and while not mentioning a date of release, the new numbers will likely be out between February and April.
Just talking for my state, there's a big problem with that.
State legislature shuts up shop for business in April, meaning if the Census doesn't release data until April, you'd have to wait until the 2022 session for the legislature to pass a bill with the new districts for federal and state. But people are required to file for primaries in January and February.
When the Census Bureau could not do field enumeration they came up with an alternative plan that would slip those back about 3 or 4 months. These plans assumed that Congress would adjust the statutory limits.
When Congress failed to act, the Census Bureau came up with the so-called Replan that would attempt to complete processing by the deadlines in statute. The district court in California interfered with this plan until finally stopped by the SCOTUS.
In the past, the Census Bureau has endeavored to release redistricting data earlier for states with earlier deadlines. So that it might come out in February rather than on March 31. I think the Census Bureau has released their 2020 Census geography, so that state legislature staff can be loading up the data other than population.
My guess is that the apportionment numbers will be out around the end of this month, and that the redistricting data will be out by May.
This might result in some states calling a special session for redistricting. Practically anybody would have standing to file an equal protection lawsuit against the state of Indiana for failing to adjust legislature and congressional districts (e.g. Democratic Front Organizations For Fair Redistricting v. Eric Holcomb). The Indiana AG will claim that the suit is not ripe, and the court will withhold acting on the lawsuit until it is absolutely necessary, probably November 2021.
Holcomb will call a special session. It will be easy to do congressional redistricting, you just need to shift some population around maintaining IN-1 and IN-7 as Democratic vote sinks, and taking care to not make IN-2 and IN-5 competitive.
Legislative redistricting may be harder. With 100 House districts you will end up shifting districts around. If you can find an incumbent ready to retire, you may be able to divide up his district. But in other cases, you will end up pissing off incumbents who will suspect all kinds of nefarious plots. If the legislature gets into trouble, they will move the primary, and call another special session. There is zero chance the legislature won't get it done.
The DFFOFR will add a bunch of claims based on the VRA which the district court will eventually dismiss and the SCOTUS will not take up.
Title: Re: Census population estimates 2011-2019
Post by: StateBoiler on January 04, 2021, 10:37:35 PM
Fresh 2020 Census Count numbers would be out today, by law, usually.
But not this year.
The Bureau said yesterday that the deadline will not be met and while not mentioning a date of release, the new numbers will likely be out between February and April.
But not this year.
The Bureau said yesterday that the deadline will not be met and while not mentioning a date of release, the new numbers will likely be out between February and April.
Just talking for my state, there's a big problem with that.
State legislature shuts up shop for business in April, meaning if the Census doesn't release data until April, you'd have to wait until the 2022 session for the legislature to pass a bill with the new districts for federal and state. But people are required to file for primaries in January and February.
Thats really not the Census Bureaus problem .... (They had enough on their own).
Its Indianas problem.
IN and its legislature could also work in September, right ? Other people have to work the whole year as well and not stop in April.
Well how it always worked in the past is the Census was released on time and they released new districts in a year that ends in 1, all complete by April.
They could have a special session later in the year to do it, but that means the state has to spend extra money not previously earmarked because the federal government bureaucrats can't meet a date of release. It's okay, we can just send the Census Bureau a bill for the costs, right?
What was the census bureau supposed to do? Do a rushed job and give the states messed up census data?
On December 31st Tender Branson stated in the census thread on page 51 that the Census Bureau said the data quality was high as he posted a press release from them saying as much. If releasing now is a rush job with messed up census data, then the press release was incredibly premature.
Title: Re: Census population estimates 2011-2019
Post by: Tender Branson on January 05, 2021, 08:53:47 AM
Fresh 2020 Census Count numbers would be out today, by law, usually.
But not this year.
The Bureau said yesterday that the deadline will not be met and while not mentioning a date of release, the new numbers will likely be out between February and April.
But not this year.
The Bureau said yesterday that the deadline will not be met and while not mentioning a date of release, the new numbers will likely be out between February and April.
Just talking for my state, there's a big problem with that.
State legislature shuts up shop for business in April, meaning if the Census doesn't release data until April, you'd have to wait until the 2022 session for the legislature to pass a bill with the new districts for federal and state. But people are required to file for primaries in January and February.
Thats really not the Census Bureaus problem .... (They had enough on their own).
Its Indianas problem.
IN and its legislature could also work in September, right ? Other people have to work the whole year as well and not stop in April.
Well how it always worked in the past is the Census was released on time and they released new districts in a year that ends in 1, all complete by April.
They could have a special session later in the year to do it, but that means the state has to spend extra money not previously earmarked because the federal government bureaucrats can't meet a date of release. It's okay, we can just send the Census Bureau a bill for the costs, right?
What was the census bureau supposed to do? Do a rushed job and give the states messed up census data?
On December 31st Tender Branson stated in the census thread on page 51 that the Census Bureau said the data quality was high as he posted a press release from them saying as much. If releasing now is a rush job with messed up census data, then the press release was incredibly premature.
Why ?
They can assess data quality on what has been processed so far ...
Processing the data and quality checks take 5 months after completing the Census.
They were only ready in October this time, instead of the summer.
Title: Re: Census population estimates 2011-2019
Post by: jimrtex on January 07, 2021, 01:45:33 PM
Fresh 2020 Census Count numbers would be out today, by law, usually.
But not this year.
The Bureau said yesterday that the deadline will not be met and while not mentioning a date of release, the new numbers will likely be out between February and April.
But not this year.
The Bureau said yesterday that the deadline will not be met and while not mentioning a date of release, the new numbers will likely be out between February and April.
Just talking for my state, there's a big problem with that.
State legislature shuts up shop for business in April, meaning if the Census doesn't release data until April, you'd have to wait until the 2022 session for the legislature to pass a bill with the new districts for federal and state. But people are required to file for primaries in January and February.
Thats really not the Census Bureaus problem .... (They had enough on their own).
Its Indianas problem.
IN and its legislature could also work in September, right ? Other people have to work the whole year as well and not stop in April.
Well how it always worked in the past is the Census was released on time and they released new districts in a year that ends in 1, all complete by April.
They could have a special session later in the year to do it, but that means the state has to spend extra money not previously earmarked because the federal government bureaucrats can't meet a date of release. It's okay, we can just send the Census Bureau a bill for the costs, right?
What was the census bureau supposed to do? Do a rushed job and give the states messed up census data?
On December 31st Tender Branson stated in the census thread on page 51 that the Census Bureau said the data quality was high as he posted a press release from them saying as much. If releasing now is a rush job with messed up census data, then the press release was incredibly premature.
Why ?
They can assess data quality on what has been processed so far ...
Processing the data and quality checks take 5 months after completing the Census.
They were only ready in October this time, instead of the summer.
Title: Re: Census population estimates 2011-2019
Post by: Tender Branson on January 09, 2021, 04:03:23 AM
Fresh 2020 Census Count numbers would be out today, by law, usually.
But not this year.
The Bureau said yesterday that the deadline will not be met and while not mentioning a date of release, the new numbers will likely be out between February and April.
But not this year.
The Bureau said yesterday that the deadline will not be met and while not mentioning a date of release, the new numbers will likely be out between February and April.
Just talking for my state, there's a big problem with that.
State legislature shuts up shop for business in April, meaning if the Census doesn't release data until April, you'd have to wait until the 2022 session for the legislature to pass a bill with the new districts for federal and state. But people are required to file for primaries in January and February.
Thats really not the Census Bureaus problem .... (They had enough on their own).
Its Indianas problem.
IN and its legislature could also work in September, right ? Other people have to work the whole year as well and not stop in April.
Well how it always worked in the past is the Census was released on time and they released new districts in a year that ends in 1, all complete by April.
They could have a special session later in the year to do it, but that means the state has to spend extra money not previously earmarked because the federal government bureaucrats can't meet a date of release. It's okay, we can just send the Census Bureau a bill for the costs, right?
What was the census bureau supposed to do? Do a rushed job and give the states messed up census data?
On December 31st Tender Branson stated in the census thread on page 51 that the Census Bureau said the data quality was high as he posted a press release from them saying as much. If releasing now is a rush job with messed up census data, then the press release was incredibly premature.
Why ?
They can assess data quality on what has been processed so far ...
Processing the data and quality checks take 5 months after completing the Census.
They were only ready in October this time, instead of the summer.
True.
But they have other problems that were not the case in 2000 or 2010, slowing down the publication of the numbers:
* ongoing sabotage attempts by Trump
* a pandemic, which cuts staff and work hours due to quarantine of staff, protection measures
* Christmas, New Year and other holidays in the fall
Processing census data in 2000 and 2010 started in the summer of those years, there were hardly any holidays.
Because data collection ended in late October this year, we can still expect 4 months of data processing despite better IT systems because of the factors above.
Mid-February to End-March looks most likely for the release.
Title: Re: Census population estimates 2011-2019
Post by: jimrtex on January 09, 2021, 12:59:08 PM
Why ?
They can assess data quality on what has been processed so far ...
Processing the data and quality checks take 5 months after completing the Census.
They were only ready in October this time, instead of the summer.
True.
But they have other problems that were not the case in 2000 or 2010, slowing down the publication of the numbers:
* ongoing sabotage attempts by Trump
* a pandemic, which cuts staff and work hours due to quarantine of staff, protection measures
* Christmas, New Year and other holidays in the fall
Processing census data in 2000 and 2010 started in the summer of those years, there were hardly any holidays.
Because data collection ended in late October this year, we can still expect 4 months of data processing despite better IT systems because of the factors above.
Mid-February to End-March looks most likely for the release.
As you may know, the counting of overseas federal affiliated persons and their dependents is not actually an enumeration, and is done under an executive order rather than statute. The Census Bureau simply receives the numbers from federal agencies (the overwhelming majority are DOD, with a minority of State Department employees, and smattering of other agencies). There is probably some processing to avoid duplicates (e.g. The wife of a soldier stationed in Germany, may have remained stateside, and included her husband when she filled out her census form).
Enumeration ended in mid-October. They have added weekend processing which more than makes up for any losses due to holidays. I suspect they were running their computers on Veterans Day, Thanksgiving, Christmas, and New Years Day.
They are way past the need for huge numbers of temporary workers in call centers and paper forms processing that were slowed because of COVID-19 mitigation.
Three-1/2 months would be the end of January.
Title: Re: Census population estimates 2011-2019
Post by: StateBoiler on January 12, 2021, 01:44:21 PM
Fresh 2020 Census Count numbers would be out today, by law, usually.
But not this year.
The Bureau said yesterday that the deadline will not be met and while not mentioning a date of release, the new numbers will likely be out between February and April.
But not this year.
The Bureau said yesterday that the deadline will not be met and while not mentioning a date of release, the new numbers will likely be out between February and April.
Just talking for my state, there's a big problem with that.
State legislature shuts up shop for business in April, meaning if the Census doesn't release data until April, you'd have to wait until the 2022 session for the legislature to pass a bill with the new districts for federal and state. But people are required to file for primaries in January and February.
Thats really not the Census Bureaus problem .... (They had enough on their own).
Its Indianas problem.
IN and its legislature could also work in September, right ? Other people have to work the whole year as well and not stop in April.
Well how it always worked in the past is the Census was released on time and they released new districts in a year that ends in 1, all complete by April.
They could have a special session later in the year to do it, but that means the state has to spend extra money not previously earmarked because the federal government bureaucrats can't meet a date of release. It's okay, we can just send the Census Bureau a bill for the costs, right?
State politics journalist Abdul Hakim-Shabazz on Rob Kendall's Statehouse Happenings podcast at wibc.com says either they'll have to do a special session later this year or will wait until the 2022 session to redraw districts (which strikes me as creating problems when you file for races in January).
Title: Re: Census population estimates 2011-2019
Post by: jimrtex on January 19, 2021, 02:52:02 PM
Normally the Census would be releasing the actual 2020 Census apportionment data next week, and not the Jul 1, 2020 estimates. Due to the expected delay in the release of the apportionment data, we can look at these estimates that do not include any 2020 Census data. It will be interesting to compare this to the actual Census population when they are released.
So, here's my annual projection from the new estimates. I used these July 2020 estimates and the April 2010 Census base to get an annual growth rate. This accounts for a 10 and a quarter year period between the 2010 Census and the estimate. I then applied the annual growth rate to the 2010 reapportionment population to get the 2020 projection. This accounts for the extra overseas population used in reapportionment but not for redistricting (It doesn't adjust for the new distinction between deployed vs stationed).
AZ +1
CA -1
CO +1
FL +2
IL -1
MI -1
MN -1
MT +1
NY -2
NC +1
OH -1
OR +1
PA -1
RI -1
TX +3
WV -1
AL and NY have switched seats compared to last year (https://talkelections.org/FORUM/index.php?topic=166668.msg7109615#msg7109615), so that AL would have no change and NY would lose 2 seats. I tested the possibility that inclusion of the Covid-19 fatalities in NY between April 1 and July 1 would affect the result. I added the July 1 NY fatality count to my April 1 projection, and it made NY closer to AL but did not change the overall projection.
The bubble seats in this projection are based on the last five awarded and the next five in line.
The last five awarded are IL-17, CA-52, FL-29, TX-39, and AL-7 (#435).
The next five in line are NY-26, OH-16, MN-8, CA-53, and VA-12.
So, here's my annual projection from the new estimates. I used these July 2020 estimates and the April 2010 Census base to get an annual growth rate. This accounts for a 10 and a quarter year period between the 2010 Census and the estimate. I then applied the annual growth rate to the 2010 reapportionment population to get the 2020 projection. This accounts for the extra overseas population used in reapportionment but not for redistricting (It doesn't adjust for the new distinction between deployed vs stationed).
AZ +1
CA -1
CO +1
FL +2
IL -1
MI -1
MN -1
MT +1
NY -2
NC +1
OH -1
OR +1
PA -1
RI -1
TX +3
WV -1
AL and NY have switched seats compared to last year (https://talkelections.org/FORUM/index.php?topic=166668.msg7109615#msg7109615), so that AL would have no change and NY would lose 2 seats. I tested the possibility that inclusion of the Covid-19 fatalities in NY between April 1 and July 1 would affect the result. I added the July 1 NY fatality count to my April 1 projection, and it made NY closer to AL but did not change the overall projection.
The bubble seats in this projection are based on the last five awarded and the next five in line.
The last five awarded are IL-17, CA-52, FL-29, TX-39, and AL-7 (#435).
The next five in line are NY-26, OH-16, MN-8, CA-53, and VA-12.
I think the federal overseas population will be about 1/2 of what it was in 2010, but I did not include it.
432 MT 1.005
433 FL 1.003
434 TX 1.002
435 NY 1.002
-------------
436 AL 1.001
437 MN 0.996
438 OH 0.995
439 RI 0.985
The bolded states can be considered bubble states. NY is at risk of losing a second seat, while FL would be limited to +1, and TX would be limited to +2, while AL would stay at 7.
CA shot off the table making it certain that it will lose a seat, and for 2030 we may be looking at loss of multiple seats. CA gained +300K every year for the first five years, but has gone +245K, +188K, +100K, 0K, -69K for the last 5.
NY started of +100K in 2011, but gradually lost steam and has been (increasingly negative for the last five years). The loss of -127K for 2020 was almost equal to the combined loss of 130K for 2018+2019. The loss for 2020 also put NY negative for the decade.
AL had a "U" shape pattern, with perhaps enough to hold on to the 7th seat. It could be a state that benefits by inclusion the federal overseas population is overwhelmingly military and dependents, compared to NY.
Title: Re: Census population estimates 2011-2019
Post by: Brittain33 on January 19, 2021, 05:11:05 PM
The idea of California shedding multiple seats to other states is quite a paradigm shift but I can see how it could happen. Especially since its one of the first states to start to suffer significantly from climate change.
Title: Re: Census population estimates 2011-2019
Post by: Torie on January 19, 2021, 05:22:24 PM
Normally the Census would be releasing the actual 2020 Census apportionment data next week, and not the Jul 1, 2020 estimates. Due to the expected delay in the release of the apportionment data, we can look at these estimates that do not include any 2020 Census data. It will be interesting to compare this to the actual Census population when they are released.
So, here's my annual projection from the new estimates. I used these July 2020 estimates and the April 2010 Census base to get an annual growth rate. This accounts for a 10 and a quarter year period between the 2010 Census and the estimate. I then applied the annual growth rate to the 2010 reapportionment population to get the 2020 projection. This accounts for the extra overseas population used in reapportionment but not for redistricting (It doesn't adjust for the new distinction between deployed vs stationed).
AZ +1
CA -1
CO +1
FL +2
IL -1
MI -1
MN -1
MT +1
NY -2
NC +1
OH -1
OR +1
PA -1
RI -1
TX +3
WV -1
AL and NY have switched seats compared to last year (https://talkelections.org/FORUM/index.php?topic=166668.msg7109615#msg7109615), so that AL would have no change and NY would lose 2 seats. I tested the possibility that inclusion of the Covid-19 fatalities in NY between April 1 and July 1 would affect the result. I added the July 1 NY fatality count to my April 1 projection, and it made NY closer to AL but did not change the overall projection.
The bubble seats in this projection are based on the last five awarded and the next five in line.
The last five awarded are IL-17, CA-52, FL-29, TX-39, and AL-7 (#435).
The next five in line are NY-26, OH-16, MN-8, CA-53, and VA-12.
So, here's my annual projection from the new estimates. I used these July 2020 estimates and the April 2010 Census base to get an annual growth rate. This accounts for a 10 and a quarter year period between the 2010 Census and the estimate. I then applied the annual growth rate to the 2010 reapportionment population to get the 2020 projection. This accounts for the extra overseas population used in reapportionment but not for redistricting (It doesn't adjust for the new distinction between deployed vs stationed).
AZ +1
CA -1
CO +1
FL +2
IL -1
MI -1
MN -1
MT +1
NY -2
NC +1
OH -1
OR +1
PA -1
RI -1
TX +3
WV -1
AL and NY have switched seats compared to last year (https://talkelections.org/FORUM/index.php?topic=166668.msg7109615#msg7109615), so that AL would have no change and NY would lose 2 seats. I tested the possibility that inclusion of the Covid-19 fatalities in NY between April 1 and July 1 would affect the result. I added the July 1 NY fatality count to my April 1 projection, and it made NY closer to AL but did not change the overall projection.
The bubble seats in this projection are based on the last five awarded and the next five in line.
The last five awarded are IL-17, CA-52, FL-29, TX-39, and AL-7 (#435).
The next five in line are NY-26, OH-16, MN-8, CA-53, and VA-12.
I think the federal overseas population will be about 1/2 of what it was in 2010, but I did not include it.
432 MT 1.005
433 FL 1.003
434 TX 1.002
435 NY 1.002
-------------
436 AL 1.001
437 MN 0.996
438 OH 0.995
439 RI 0.985
The bolded states can be considered bubble states. NY is at risk of losing a second seat, while FL would be limited to +1, and TX would be limited to +2, while AL would stay at 7.
CA shot off the table making it certain that it will lose a seat, and for 2030 we may be looking at loss of multiple seats. CA gained +300K every year for the first five years, but has gone +245K, +188K, +100K, 0K, -69K for the last 5.
NY started of +100K in 2011, but gradually lost steam and has been (increasingly negative for the last five years). The loss of -127K for 2020 was almost equal to the combined loss of 130K for 2018+2019. The loss for 2020 also put NY negative for the decade.
AL had a "U" shape pattern, with perhaps enough to hold on to the 7th seat. It could be a state that benefits by inclusion the federal overseas population is overwhelmingly military and dependents, compared to NY.
"I used 3/4 of the difference between the July 1, 2019 and July 1, 2020 estimates. The growth assumption in your method assumes that the 2020 is reliable for calculating the annual growth rate, but that the 2019 estimate was not accurate and should be ignored."
If the July, 2019 estimate is bad, why are you apparently also using it?
I myself was hesitant on projecting forward from a rate that was over a period of close to a decade, when more recent trends may have been quite different. But then covid hit, and what had happened recently before might not be very useful at all as a rate line.
Title: Re: Census population estimates 2011-2019
Post by: jimrtex on January 19, 2021, 10:59:58 PM
Normally the Census would be releasing the actual 2020 Census apportionment data next week, and not the Jul 1, 2020 estimates. Due to the expected delay in the release of the apportionment data, we can look at these estimates that do not include any 2020 Census data. It will be interesting to compare this to the actual Census population when they are released.
So, here's my annual projection from the new estimates. I used these July 2020 estimates and the April 2010 Census base to get an annual growth rate. This accounts for a 10 and a quarter year period between the 2010 Census and the estimate. I then applied the annual growth rate to the 2010 reapportionment population to get the 2020 projection. This accounts for the extra overseas population used in reapportionment but not for redistricting (It doesn't adjust for the new distinction between deployed vs stationed).
AZ +1
CA -1
CO +1
FL +2
IL -1
MI -1
MN -1
MT +1
NY -2
NC +1
OH -1
OR +1
PA -1
RI -1
TX +3
WV -1
AL and NY have switched seats compared to last year (https://talkelections.org/FORUM/index.php?topic=166668.msg7109615#msg7109615), so that AL would have no change and NY would lose 2 seats. I tested the possibility that inclusion of the Covid-19 fatalities in NY between April 1 and July 1 would affect the result. I added the July 1 NY fatality count to my April 1 projection, and it made NY closer to AL but did not change the overall projection.
The bubble seats in this projection are based on the last five awarded and the next five in line.
The last five awarded are IL-17, CA-52, FL-29, TX-39, and AL-7 (#435).
The next five in line are NY-26, OH-16, MN-8, CA-53, and VA-12.
So, here's my annual projection from the new estimates. I used these July 2020 estimates and the April 2010 Census base to get an annual growth rate. This accounts for a 10 and a quarter year period between the 2010 Census and the estimate. I then applied the annual growth rate to the 2010 reapportionment population to get the 2020 projection. This accounts for the extra overseas population used in reapportionment but not for redistricting (It doesn't adjust for the new distinction between deployed vs stationed).
AZ +1
CA -1
CO +1
FL +2
IL -1
MI -1
MN -1
MT +1
NY -2
NC +1
OH -1
OR +1
PA -1
RI -1
TX +3
WV -1
AL and NY have switched seats compared to last year (https://talkelections.org/FORUM/index.php?topic=166668.msg7109615#msg7109615), so that AL would have no change and NY would lose 2 seats. I tested the possibility that inclusion of the Covid-19 fatalities in NY between April 1 and July 1 would affect the result. I added the July 1 NY fatality count to my April 1 projection, and it made NY closer to AL but did not change the overall projection.
The bubble seats in this projection are based on the last five awarded and the next five in line.
The last five awarded are IL-17, CA-52, FL-29, TX-39, and AL-7 (#435).
The next five in line are NY-26, OH-16, MN-8, CA-53, and VA-12.
I think the federal overseas population will be about 1/2 of what it was in 2010, but I did not include it.
432 MT 1.005
433 FL 1.003
434 TX 1.002
435 NY 1.002
-------------
436 AL 1.001
437 MN 0.996
438 OH 0.995
439 RI 0.985
The bolded states can be considered bubble states. NY is at risk of losing a second seat, while FL would be limited to +1, and TX would be limited to +2, while AL would stay at 7.
CA shot off the table making it certain that it will lose a seat, and for 2030 we may be looking at loss of multiple seats. CA gained +300K every year for the first five years, but has gone +245K, +188K, +100K, 0K, -69K for the last 5.
NY started of +100K in 2011, but gradually lost steam and has been (increasingly negative for the last five years). The loss of -127K for 2020 was almost equal to the combined loss of 130K for 2018+2019. The loss for 2020 also put NY negative for the decade.
AL had a "U" shape pattern, with perhaps enough to hold on to the 7th seat. It could be a state that benefits by inclusion the federal overseas population is overwhelmingly military and dependents, compared to NY.
"I used 3/4 of the difference between the July 1, 2019 and July 1, 2020 estimates. The growth assumption in your method assumes that the 2020 is reliable for calculating the annual growth rate, but that the 2019 estimate was not accurate and should be ignored."
If the July, 2019 estimate is bad, why are you apparently also using it?
I myself was hesitant on projecting forward from a rate that was over a period of close to a decade, when more recent trends may have been quite different. But then covid hit, and what had happened recently before might not be very useful at all as a rate line.
Now repeat using the July 2020 estimate, but back up 0.25 of an inch. The 2020 estimate was 10.25 years after the 2010 census, and 0.25 years after the 2020 Census.
Most of our estimate is not due to change in that last 0.25 years but over the entire period.
So for New York, the 2020 estimate was 19.337M, which was less than the 2010 Census Population of 19.378M, but only by 41K. That is about 4K per year, or 1K for that last quarter between April 2020 and July 2020. The estimated population would be 19.338M.
But the 2019 estimate was 19.463M. The Census Bureau says that New York lost 126K last year (July 2019-July 2020). We can estimate that 126K was evenly divided over the last year, or about 32K. So my estimate was 19.369M, just a bit more than one based on assuming constant change over the decade.
New York's yearly estimated change over the decade was:
+100K, +75K, +52K, +27K, +4K, -21K, -43K, -49K, -81K, -127K.
It was not
-4K, -4K, ..., -4K, -4K even though the net effect was the same.
It happens that my adding the extra 31K may have saved New York from losing a second seat. That is sure coincidence. If Alabama has 5K extra people after a decade increase of 138K, or New York has -20K fewer after losing 127K in the last year (and those 20K may have gone missing), then Alabama and New York flip. It could be even closer when federal overseas population is added in. Most of this is military and dependents (military and families stationed in Germany, Japan, and Korea).
In 2010, this increased Alabama's population by 0.49%; while New York's only increased by 0.22%.
COVID will be barely reflected in the estimates. Estimates for interstate migration are based on lagging indicators such as income tax records. They only had access to 2019 taxes when they made the estimate for 2020. That gives a measure of migration between 2018 and 2019 which must be projected forward. Birth and death records are more current.
Title: Re: Census population estimates 2011-2019
Post by: Biden his time on January 25, 2021, 03:45:11 PM
Comparing the beginning of the 2010s with the end
Simple map of the United States by projected population
growth between July 01, 2010 and July 01, 2011
growth between July 01, 2010 and July 01, 2011
(
DARK GREEN: States which grew faster than the world average (+1.21%)
GREEN: States which grew faster than the national average (+0.73%)
ORANGE: States which grew slower than the national average (+0.73%)
RED: States which shrank in population
---
Simple map of the United States by projected population
growth between July 01, 2019 and July 01, 2020
growth between July 01, 2019 and July 01, 2020
(
DARK GREEN: States which grew faster than the world average (+1.05%)
GREEN: States which grew faster than the national average (+0.35%)
ORANGE: States which grew slower than the national average (+0.35%)
RED: States which shrank in population
Title: Re: Census population estimates 2011-2019
Post by: ProgressiveModerate on February 06, 2021, 02:43:09 PM
According to my calculations
Seat 420 is NY-25
Seat 421 is NC-14
Seat 422 is TX-38
Seat 423 is AZ-10
Seat 424 is CA-51
Seat 425 is WI-8
Seat 426 is CO-8
Seat 427 is PA-17
Seat 428 is OR-6
Seat 429 is NJ-12
Seat 430 is CA-52
Seat 431 is MT-2
Seat 432 is IL-17
Seat 433 is FL-29
Seat 434 is TX-39
Seat 435 is AL-7
----------
Seat 436 is NY-26
Seat 437 is MN-8
Seat 438 is OH-16
Seat 439 is CA-53
Seat 440 is VA-12
Seat 441 is RI-2
Seat 442 is ID-3
Seat 443 is TX-40
Seat 444 is GA-15
Seat 445 is MI-14
Seat 446 is FL-30
Seat 447 is CA-54
Seat 448 is WA-11
Seat 449 is NC-15
Seat 450 is PA-18
Title: Re: Census population estimates 2011-2020
Post by: Biden his time on February 15, 2021, 02:43:44 PM
According to my calculations
Seat 420 is NY-25
Seat 421 is NC-14
Seat 422 is TX-38
Seat 423 is AZ-10
Seat 424 is CA-51
Seat 425 is WI-8
Seat 426 is CO-8
Seat 427 is PA-17
Seat 428 is OR-6
Seat 429 is NJ-12
Seat 430 is CA-52
Seat 431 is MT-2
Seat 432 is IL-17
Seat 433 is FL-29
Seat 434 is TX-39
Seat 435 is AL-7
----------
Seat 436 is NY-26
Seat 437 is MN-8
Seat 438 is OH-16
Seat 439 is CA-53
Seat 440 is VA-12
Seat 441 is RI-2
Seat 442 is ID-3
Seat 443 is TX-40
Seat 444 is GA-15
Seat 445 is MI-14
Seat 446 is FL-30
Seat 447 is CA-54
Seat 448 is WA-11
Seat 449 is NC-15
Seat 450 is PA-18
Seat 420 is NY-25
Seat 421 is NC-14
Seat 422 is TX-38
Seat 423 is AZ-10
Seat 424 is CA-51
Seat 425 is WI-8
Seat 426 is CO-8
Seat 427 is PA-17
Seat 428 is OR-6
Seat 429 is NJ-12
Seat 430 is CA-52
Seat 431 is MT-2
Seat 432 is IL-17
Seat 433 is FL-29
Seat 434 is TX-39
Seat 435 is AL-7
----------
Seat 436 is NY-26
Seat 437 is MN-8
Seat 438 is OH-16
Seat 439 is CA-53
Seat 440 is VA-12
Seat 441 is RI-2
Seat 442 is ID-3
Seat 443 is TX-40
Seat 444 is GA-15
Seat 445 is MI-14
Seat 446 is FL-30
Seat 447 is CA-54
Seat 448 is WA-11
Seat 449 is NC-15
Seat 450 is PA-18
Idaho's third district has become a virtual certainty by 2030, and it's actually shockingly close to getting one this cycle!
Only 30k people away from getting a third seat, and this is while it gained an average of 26k people every year this decade, and also gained 35k people every year during the last five years!
Title: Re: Census population estimates 2011-2020
Post by: ProgressiveModerate on February 15, 2021, 02:49:35 PM
According to my calculations
Seat 420 is NY-25
Seat 421 is NC-14
Seat 422 is TX-38
Seat 423 is AZ-10
Seat 424 is CA-51
Seat 425 is WI-8
Seat 426 is CO-8
Seat 427 is PA-17
Seat 428 is OR-6
Seat 429 is NJ-12
Seat 430 is CA-52
Seat 431 is MT-2
Seat 432 is IL-17
Seat 433 is FL-29
Seat 434 is TX-39
Seat 435 is AL-7
----------
Seat 436 is NY-26
Seat 437 is MN-8
Seat 438 is OH-16
Seat 439 is CA-53
Seat 440 is VA-12
Seat 441 is RI-2
Seat 442 is ID-3
Seat 443 is TX-40
Seat 444 is GA-15
Seat 445 is MI-14
Seat 446 is FL-30
Seat 447 is CA-54
Seat 448 is WA-11
Seat 449 is NC-15
Seat 450 is PA-18
Seat 420 is NY-25
Seat 421 is NC-14
Seat 422 is TX-38
Seat 423 is AZ-10
Seat 424 is CA-51
Seat 425 is WI-8
Seat 426 is CO-8
Seat 427 is PA-17
Seat 428 is OR-6
Seat 429 is NJ-12
Seat 430 is CA-52
Seat 431 is MT-2
Seat 432 is IL-17
Seat 433 is FL-29
Seat 434 is TX-39
Seat 435 is AL-7
----------
Seat 436 is NY-26
Seat 437 is MN-8
Seat 438 is OH-16
Seat 439 is CA-53
Seat 440 is VA-12
Seat 441 is RI-2
Seat 442 is ID-3
Seat 443 is TX-40
Seat 444 is GA-15
Seat 445 is MI-14
Seat 446 is FL-30
Seat 447 is CA-54
Seat 448 is WA-11
Seat 449 is NC-15
Seat 450 is PA-18
Idaho's third district has become a virtual certainty by 2030, and it's actually shockingly close to getting one this cycle!
Only 30k people away from getting a third seat, and this is while it gained an average of 26k people every year this decade, and also gained 35k people every year during the last five years!
I know, I was pretty shocked too when I realized how close ID had come. If somehow the estimates are way off and ID did pull an upset in 2020 and gain a 3rd seat, that would be pretty epic, though from a political standpoint, that would likely be another GOP seat. By 2030 though, a 3rd district would likely have to be Boise based.
Title: Re: Census population estimates 2011-2020
Post by: Biden his time on February 15, 2021, 04:05:15 PM
According to my calculations
Seat 420 is NY-25
Seat 421 is NC-14
Seat 422 is TX-38
Seat 423 is AZ-10
Seat 424 is CA-51
Seat 425 is WI-8
Seat 426 is CO-8
Seat 427 is PA-17
Seat 428 is OR-6
Seat 429 is NJ-12
Seat 430 is CA-52
Seat 431 is MT-2
Seat 432 is IL-17
Seat 433 is FL-29
Seat 434 is TX-39
Seat 435 is AL-7
----------
Seat 436 is NY-26
Seat 437 is MN-8
Seat 438 is OH-16
Seat 439 is CA-53
Seat 440 is VA-12
Seat 441 is RI-2
Seat 442 is ID-3
Seat 443 is TX-40
Seat 444 is GA-15
Seat 445 is MI-14
Seat 446 is FL-30
Seat 447 is CA-54
Seat 448 is WA-11
Seat 449 is NC-15
Seat 450 is PA-18
Seat 420 is NY-25
Seat 421 is NC-14
Seat 422 is TX-38
Seat 423 is AZ-10
Seat 424 is CA-51
Seat 425 is WI-8
Seat 426 is CO-8
Seat 427 is PA-17
Seat 428 is OR-6
Seat 429 is NJ-12
Seat 430 is CA-52
Seat 431 is MT-2
Seat 432 is IL-17
Seat 433 is FL-29
Seat 434 is TX-39
Seat 435 is AL-7
----------
Seat 436 is NY-26
Seat 437 is MN-8
Seat 438 is OH-16
Seat 439 is CA-53
Seat 440 is VA-12
Seat 441 is RI-2
Seat 442 is ID-3
Seat 443 is TX-40
Seat 444 is GA-15
Seat 445 is MI-14
Seat 446 is FL-30
Seat 447 is CA-54
Seat 448 is WA-11
Seat 449 is NC-15
Seat 450 is PA-18
Idaho's third district has become a virtual certainty by 2030, and it's actually shockingly close to getting one this cycle!
Only 30k people away from getting a third seat, and this is while it gained an average of 26k people every year this decade, and also gained 35k people every year during the last five years!
I know, I was pretty shocked too when I realized how close ID had come. If somehow the estimates are way off and ID did pull an upset in 2020 and gain a 3rd seat, that would be pretty epic, though from a political standpoint, that would likely be another GOP seat. By 2030 though, a 3rd district would likely have to be Boise based.
I agree with you in saying that it would definitely be epic. I seriously hope that it happens lol.
While a third Idaho seat likely would be an R seat, are you sure that it wouldn't be Boise-based, though? With the latest estimates, approximately 40% of Idaho's population is in the Boise Metropolitan area. That sounds like more than enough for one district, isn't it? (If there were three).
Title: Re: Census population estimates 2011-2020
Post by: Tender Branson on February 16, 2021, 01:14:59 AM
According to my calculations
Seat 420 is NY-25
Seat 421 is NC-14
Seat 422 is TX-38
Seat 423 is AZ-10
Seat 424 is CA-51
Seat 425 is WI-8
Seat 426 is CO-8
Seat 427 is PA-17
Seat 428 is OR-6
Seat 429 is NJ-12
Seat 430 is CA-52
Seat 431 is MT-2
Seat 432 is IL-17
Seat 433 is FL-29
Seat 434 is TX-39
Seat 435 is AL-7
----------
Seat 436 is NY-26
Seat 437 is MN-8
Seat 438 is OH-16
Seat 439 is CA-53
Seat 440 is VA-12
Seat 441 is RI-2
Seat 442 is ID-3
Seat 443 is TX-40
Seat 444 is GA-15
Seat 445 is MI-14
Seat 446 is FL-30
Seat 447 is CA-54
Seat 448 is WA-11
Seat 449 is NC-15
Seat 450 is PA-18
Seat 420 is NY-25
Seat 421 is NC-14
Seat 422 is TX-38
Seat 423 is AZ-10
Seat 424 is CA-51
Seat 425 is WI-8
Seat 426 is CO-8
Seat 427 is PA-17
Seat 428 is OR-6
Seat 429 is NJ-12
Seat 430 is CA-52
Seat 431 is MT-2
Seat 432 is IL-17
Seat 433 is FL-29
Seat 434 is TX-39
Seat 435 is AL-7
----------
Seat 436 is NY-26
Seat 437 is MN-8
Seat 438 is OH-16
Seat 439 is CA-53
Seat 440 is VA-12
Seat 441 is RI-2
Seat 442 is ID-3
Seat 443 is TX-40
Seat 444 is GA-15
Seat 445 is MI-14
Seat 446 is FL-30
Seat 447 is CA-54
Seat 448 is WA-11
Seat 449 is NC-15
Seat 450 is PA-18
Idaho's third district has become a virtual certainty by 2030, and it's actually shockingly close to getting one this cycle!
Only 30k people away from getting a third seat, and this is while it gained an average of 26k people every year this decade, and also gained 35k people every year during the last five years!
I know, I was pretty shocked too when I realized how close ID had come. If somehow the estimates are way off and ID did pull an upset in 2020 and gain a 3rd seat, that would be pretty epic, though from a political standpoint, that would likely be another GOP seat. By 2030 though, a 3rd district would likely have to be Boise based.
ID had a higher self-response rate in the 2020 census than in 2010 (70% vs. 67%).
Whether this will lead to a higher counted population relative to the pre-census estimates is unknown.
If ID really gets a 3rd seat already, there should be one in and around Boise (= a Dem leaning one) because Dems regularly get 33% of the vote in ID. This would be fair.
Title: Re: Census population estimates 2011-2020
Post by: Stuart98 on February 16, 2021, 03:25:31 AM
According to my calculations
Seat 420 is NY-25
Seat 421 is NC-14
Seat 422 is TX-38
Seat 423 is AZ-10
Seat 424 is CA-51
Seat 425 is WI-8
Seat 426 is CO-8
Seat 427 is PA-17
Seat 428 is OR-6
Seat 429 is NJ-12
Seat 430 is CA-52
Seat 431 is MT-2
Seat 432 is IL-17
Seat 433 is FL-29
Seat 434 is TX-39
Seat 435 is AL-7
----------
Seat 436 is NY-26
Seat 437 is MN-8
Seat 438 is OH-16
Seat 439 is CA-53
Seat 440 is VA-12
Seat 441 is RI-2
Seat 442 is ID-3
Seat 443 is TX-40
Seat 444 is GA-15
Seat 445 is MI-14
Seat 446 is FL-30
Seat 447 is CA-54
Seat 448 is WA-11
Seat 449 is NC-15
Seat 450 is PA-18
Seat 420 is NY-25
Seat 421 is NC-14
Seat 422 is TX-38
Seat 423 is AZ-10
Seat 424 is CA-51
Seat 425 is WI-8
Seat 426 is CO-8
Seat 427 is PA-17
Seat 428 is OR-6
Seat 429 is NJ-12
Seat 430 is CA-52
Seat 431 is MT-2
Seat 432 is IL-17
Seat 433 is FL-29
Seat 434 is TX-39
Seat 435 is AL-7
----------
Seat 436 is NY-26
Seat 437 is MN-8
Seat 438 is OH-16
Seat 439 is CA-53
Seat 440 is VA-12
Seat 441 is RI-2
Seat 442 is ID-3
Seat 443 is TX-40
Seat 444 is GA-15
Seat 445 is MI-14
Seat 446 is FL-30
Seat 447 is CA-54
Seat 448 is WA-11
Seat 449 is NC-15
Seat 450 is PA-18
Idaho's third district has become a virtual certainty by 2030, and it's actually shockingly close to getting one this cycle!
Only 30k people away from getting a third seat, and this is while it gained an average of 26k people every year this decade, and also gained 35k people every year during the last five years!
I know, I was pretty shocked too when I realized how close ID had come. If somehow the estimates are way off and ID did pull an upset in 2020 and gain a 3rd seat, that would be pretty epic, though from a political standpoint, that would likely be another GOP seat. By 2030 though, a 3rd district would likely have to be Boise based.
ID had a higher self-response rate in the 2020 census than in 2010 (70% vs. 67%).
Whether this will lead to a higher counted population relative to the pre-census estimates is unknown.
If ID really gets a 3rd seat already, there should be one in and around Boise (= a Dem leaning one) because Dems regularly get 33% of the vote in ID. This would be fair.
()
Title: Re: Census population estimates 2011-2020
Post by: Tender Branson on February 16, 2021, 03:51:27 AM
According to my calculations
Seat 420 is NY-25
Seat 421 is NC-14
Seat 422 is TX-38
Seat 423 is AZ-10
Seat 424 is CA-51
Seat 425 is WI-8
Seat 426 is CO-8
Seat 427 is PA-17
Seat 428 is OR-6
Seat 429 is NJ-12
Seat 430 is CA-52
Seat 431 is MT-2
Seat 432 is IL-17
Seat 433 is FL-29
Seat 434 is TX-39
Seat 435 is AL-7
----------
Seat 436 is NY-26
Seat 437 is MN-8
Seat 438 is OH-16
Seat 439 is CA-53
Seat 440 is VA-12
Seat 441 is RI-2
Seat 442 is ID-3
Seat 443 is TX-40
Seat 444 is GA-15
Seat 445 is MI-14
Seat 446 is FL-30
Seat 447 is CA-54
Seat 448 is WA-11
Seat 449 is NC-15
Seat 450 is PA-18
Seat 420 is NY-25
Seat 421 is NC-14
Seat 422 is TX-38
Seat 423 is AZ-10
Seat 424 is CA-51
Seat 425 is WI-8
Seat 426 is CO-8
Seat 427 is PA-17
Seat 428 is OR-6
Seat 429 is NJ-12
Seat 430 is CA-52
Seat 431 is MT-2
Seat 432 is IL-17
Seat 433 is FL-29
Seat 434 is TX-39
Seat 435 is AL-7
----------
Seat 436 is NY-26
Seat 437 is MN-8
Seat 438 is OH-16
Seat 439 is CA-53
Seat 440 is VA-12
Seat 441 is RI-2
Seat 442 is ID-3
Seat 443 is TX-40
Seat 444 is GA-15
Seat 445 is MI-14
Seat 446 is FL-30
Seat 447 is CA-54
Seat 448 is WA-11
Seat 449 is NC-15
Seat 450 is PA-18
Idaho's third district has become a virtual certainty by 2030, and it's actually shockingly close to getting one this cycle!
Only 30k people away from getting a third seat, and this is while it gained an average of 26k people every year this decade, and also gained 35k people every year during the last five years!
I know, I was pretty shocked too when I realized how close ID had come. If somehow the estimates are way off and ID did pull an upset in 2020 and gain a 3rd seat, that would be pretty epic, though from a political standpoint, that would likely be another GOP seat. By 2030 though, a 3rd district would likely have to be Boise based.
ID had a higher self-response rate in the 2020 census than in 2010 (70% vs. 67%).
Whether this will lead to a higher counted population relative to the pre-census estimates is unknown.
If ID really gets a 3rd seat already, there should be one in and around Boise (= a Dem leaning one) because Dems regularly get 33% of the vote in ID. This would be fair.
()
I know.
Thats what I meant with it.
Not Dem leaning in a sense that the new 3rd would be a Dem seat, but the most Dem leaning out of the 3 - giving strong Dem candidates a chance there.
Title: Re: Census population estimates 2011-2019
Post by: beesley on March 05, 2021, 11:35:42 AM
According to my calculations
Seat 420 is NY-25
Seat 421 is NC-14
Seat 422 is TX-38
Seat 423 is AZ-10
Seat 424 is CA-51
Seat 425 is WI-8
Seat 426 is CO-8
Seat 427 is PA-17
Seat 428 is OR-6
Seat 429 is NJ-12
Seat 430 is CA-52
Seat 431 is MT-2
Seat 432 is IL-17
Seat 433 is FL-29
Seat 434 is TX-39
Seat 435 is AL-7
----------
Seat 436 is NY-26
Seat 437 is MN-8
Seat 438 is OH-16
Seat 439 is CA-53
Seat 440 is VA-12
Seat 441 is RI-2
Seat 442 is ID-3
Seat 443 is TX-40
Seat 444 is GA-15
Seat 445 is MI-14
Seat 446 is FL-30
Seat 447 is CA-54
Seat 448 is WA-11
Seat 449 is NC-15
Seat 450 is PA-18
Seat 420 is NY-25
Seat 421 is NC-14
Seat 422 is TX-38
Seat 423 is AZ-10
Seat 424 is CA-51
Seat 425 is WI-8
Seat 426 is CO-8
Seat 427 is PA-17
Seat 428 is OR-6
Seat 429 is NJ-12
Seat 430 is CA-52
Seat 431 is MT-2
Seat 432 is IL-17
Seat 433 is FL-29
Seat 434 is TX-39
Seat 435 is AL-7
----------
Seat 436 is NY-26
Seat 437 is MN-8
Seat 438 is OH-16
Seat 439 is CA-53
Seat 440 is VA-12
Seat 441 is RI-2
Seat 442 is ID-3
Seat 443 is TX-40
Seat 444 is GA-15
Seat 445 is MI-14
Seat 446 is FL-30
Seat 447 is CA-54
Seat 448 is WA-11
Seat 449 is NC-15
Seat 450 is PA-18
Gosh, NY-27 doesn't even make this list. I think it's time to expand the HoR honestly, but keeping the current apportionment rules. Not sure about the logic of folks calling for the abolition of the Senate/EC and also saying 'every state should have at least 3 Reps'.
Title: Re: Census population estimates 2011-2019
Post by: Nyvin on April 11, 2021, 08:05:23 PM
Sounds like apportionment will be announced on either the 27th or 28th this month
Title: Re: Census population estimates 2011-2019
Post by: Ebsy on August 12, 2021, 03:12:46 PM
THROW THEM IN THE TRASH